Abstract
The study of the time-dependent properties of engineering rock masses is a frontier topic in rock mechanics. In this study, creep tests and stress relaxation tests were conducted on mud-calcareous conglomerates from the Three Gorges Reservoir Area, and the long-term strength values of the conglomerate specimens were determined via different methods based on the test curves. By comparing these mainstream long-term strength determination methods, it was found that each of these methods have their own drawbacks. For example, the transition creep method requires a high accuracy of the test curve and only obtains an approximate strength interval rather than an accurate value. The long-term strength values determined by the isochronous stress–strain curve method are strongly influenced by subjective factors, among other things. Therefore, this paper proposes a new method for determining long-term strength, called the steady-state creep rate method, based on stress intervals. By comparison, the long-term strength values determined via this method are in good agreement with the transition creep method, the volume expansion method, and the stress relaxation method.
1. Introduction
The study of the time-dependent properties of engineering rock masses is a frontier topic in rock mechanics. With the construction of large hydropower projects, south–north water transfer projects, transportation projects, mining projects, and other major projects, increasing attention has been paid to the influence of the time-dependent properties of engineering rock masses on actual engineering. It is very important and necessary to consider the time-dependent phenomena and to conduct related studies in rock engineering [1,2,3,4]. The strength of rocks under long-term loading is an important mechanical parameter for engineering design and long-term operational stability analysis. The rapid and accurate determination of the long-term strength of rocks has important theoretical value and practical engineering significance.
At present, methods of estimating or determining long-term strength can be divided into the indirect method and the direct method [5]. The direct determination method is to carry out compression creep tests under various conditions of constant stress levels for rock samples until they are damaged and to, subsequently, select the maximum stress value of the sample that has been subjected to a constant load for a long enough time without failure as the long-term strength [6]. In the past, the direct method was rarely used to determine long-term strength as, in theory, this method was the most accurate and reasonable [7]; however, problems such as the significant time cost, expensive experimental cost, and the difficulty of the operational process make this method disadvantageous. The indirect method is a method used to identify the change law of the strength parameters and the critical threshold value of rocks under constant long-term loads, and it is based on the physical and mechanical properties of rocks throughout the whole process—from stress deformation to fracture. At present, the conventional indirect methods of long-term strength determination include the transition creep method, volume expansion method, the stress–strain isochronal curve method, the stress relaxation method, etc. [8]. In 1967, Bieniawski [9] found that when a rock sample approached fracture, the volume of the rock sample would expand and dilate, and an unstable crack expansion would occur inside the sample. The stress corresponding to the unstable expansion of the fracture is the critical point of the volumetric strain curve transition from negative (compression) to positive (expansion), and it can be considered the long-term strength [10,11]. Above is the basic outline of the volume expansion method, which was also the primary method used to determine the long-term strength of rocks in early phases of this field of research [12]. Since then, a large number of scholars have conducted series of studies on the determination of the long-term strength of rocks. Fuji et al. [13] obtained the axial, circumferential, and volumetric strain curves via creep tests on sandstone and granite; furthermore, they advised that the circumferential strain should be used as the criterion to judge rock damage and long-term strength. Sangha and Dhir [14] suggested that a stress value corresponding to Poisson’s ratio of 0.5 in the stress–strain curve should be taken as the long-term strength of rocks. In 1982, Chen [15] proposed the method of the isochronous stress–strain curve, the inflection point of which could be used to determine the long-term strength of rocks. This method has gradually developed into one of the most commonly used methods to determine the long-term strength of rocks. Ding et al. [16] comparatively analyzed and discussed the isochronous stress–strain curve method and the volume expansion method. Hou et al. [17] determined the long-term strength of rock samples with differing initial damage by using four methods: the isochronous stress–strain curve, the steady-state creep method, the volume expansion method, and the steady-state creep rate intersection point method. Damjanac and Fairhurst [18] verified that the long-term strength of hard brittle rock was no less than 40% of the instantaneous strength, and they determined the long-term strength of rock through the relationship between the instantaneous strength and long-term strength. Aubertin et al. [19] deduced the relationship expression between failure time and long-term strength based on the Charles rule and suggested estimating the long-term strength by using the failure time of rocks. However, the creep failure time is affected by the loading stress intensity, damage threshold, and loading stress history—uncertain factors that make this method flawed. Schmidtke and Lajtai [20] defined the minimum loading stress of the fatigue failure of rocks as the long-term strength. This test method shows great differences in the stress state of rocks; thus, it remains a great controversy.
Overall, many scholars have studied the long-term strength of various rocks using the conventional long-term strength determination methods described above. However, there are few studies on the advantages and disadvantages of these methods and their scope of application. In view of this, this paper systematically summarizes various conventional long-term strength determination methods and adopts different methods to determine the long-term strength of mud-calcareous conglomerates in the Three Gorges Reservoir Area; in addition, the characteristics and scope of application of each method is analyzed in detail and a new method is proposed (which is based on the steady-state creep rate of the stress range [21,22]). This novel method has simple steps and requires a low accuracy of the test curve and instrumentation. The long-term strength values determined using this method are in good agreement with the results obtained by the transition creep method, the volume expansion method, and the stress relaxation method.
2. Conventional Long-Term Strength Determination Method
The conventional long-term strength determination methods mainly include the transition creep method, the isochronous stress–strain curve method, the volume expansion method, and the stress relaxation method, the most widely used of which are the transition creep method and the isochronous curve method [23,24]. Of course, apart from the conventional methods mentioned above, there are also some rarely used methods, such as the steady-state rate method, the remnant strain method and the strength and failure time relationship method [25,26,27,28,29,30,31]. The theoretical systems of these methods are not yet mature, and their rationality and applicability need to be further explored. Therefore, this paper only includes the abovementioned conventional methods for discussion and analyzes, in detail, their respective principles, scope of use, as well as their advantages and disadvantages.
2.1. Transitional Creep Method
The transition creep method considers the maximum load that the rock can withstand without steady-state creep as the long-term strength of the rock [32]. It assumes that there is a stress threshold inside the rock, and when the applied external load is lower than this stress threshold, the rock is not damaged under long-term loads [33]—that is, the rock will only enter the decay creep phase during loading [34]. When the applied external load is higher than this stress threshold, the crack inside the rock will be unstable over time and will expand, causing rock damage, i.e., the rock will enter the steady-state creep phase or accelerated creep phase [35]. Therefore, the transition creep method identifies the stress threshold as the long-term strength of the rock via the change in creep rate.
The detailed process of the transition creep method for determining the long-term strength is shown in Figure 1. (1) The creep test under a graded loading is used to obtain the strain–time curve at each level of stress; (2) a multi-level loading curve obtained by unifying the loading time points under different stress levels and then superposing them is determined via Boltzmann’s superposition principle; and (3) according to the principle of the transition creep method, the slope K of the creep curve under low stress will eventually converge to 0, but when the stress is low, the rate of strain growth of the specimen will be very slow [36], resulting in a longer time required for the creep curve to converge to the horizontal line. Furthermore, after the stress level becomes high, the creep curve will converge to the horizontal line at an earlier time. Therefore, within a certain time frame, the situation will arise when the curve at high stress is horizontal (K = 0), while the curve at low stress is still rising (K > 0). Therefore, it is only necessary to find the stress interval in which the creep rate tends to 0 in a certain time range, i.e., , as shown in Figure 1.
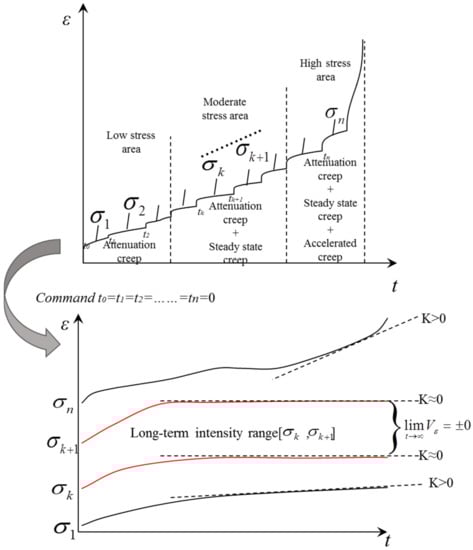
Figure 1.
Determination process of the transition creep method.
The transitional creep method has strict requirements on the creep test curve and can only estimate the interval of the long-term strength value instead of the specific long-term strength value [37]. The size of the interval is related to the stress range of the creep test. The smaller the stress range is, the smaller the interval of the long-term strength value is.
2.2. Isochronous Stress–Strain Curve Method
The isochronous curve is the curve of creep deformation versus stress, corresponding to the same creep time points in the creep curves of different stress levels. The isochronous curve method considers the stress value that corresponds to the horizontal asymptote and is formed by the yield stress of a rock sample as its long-term strength [38,39]. The inflection point of the isochron curve at each time point symbolizes the transition of the sample from the viscoelastic to the viscoplastic deformation stage. The internal structure of the rock sample changes accordingly, and internal cracks begin to expand unsteadily. The stress–strain isokinetic curve method is a common method for obtaining the long-term strength of samples, and it has been introduced into the relevant specifications for rock mechanics tests.
The initial steps of the isochronous stress–strain curve method for determining the long-term strength are basically consistent with the transition creep method. However, after obtaining the multi-stage loading curve, the isochronous stress–strain curve method requires different times as the parameter in order to obtain the isochronous curve cluster of the stress–strain relationship [40]. Through the inflection point curve of the isochronous curve cluster, a horizontal asymptotic line with the strain tending to infinity is found. The stress level corresponding to this horizontal asymptotic line is the long-term strength of the rock (Figure 2) [41].
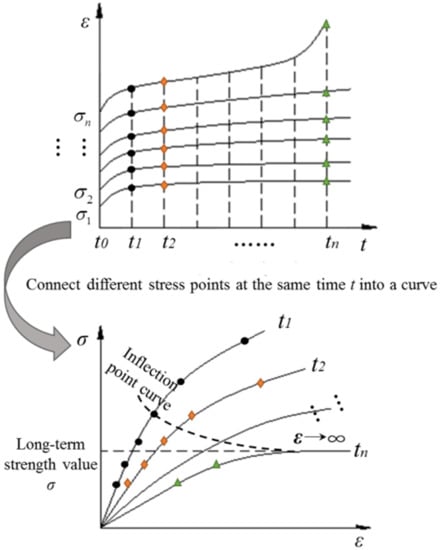
Figure 2.
Determination process of the isochronous stress–strain curve method.
This method has strict requirements for the regularity of the creep test curve. Only when the creep characteristics of rock samples are significant and the long-term deformation is large does the isochronous stress–strain curve have a relatively obvious inflection point [42]; moreover, there are certain subjective factors in determining the inflection point. The theoretical rationality and practical operability of this method need further research.
2.3. Volume Expansion Method
The basic principle of the volumetric expansion method is that when the rock is at a low stress level, the initial defects, such as internal fractures, pores, and joints, gradually tend to close and the stress–strain curve shows a nonlinear compaction phase. With the increase in stress, the deformation of the rock follows a linear elastic growth law. With the further increase in stress, the deformation characteristics of the rock sample change from elastic deformation to inelastic deformation [43], and the internal cracks or defects of the rock sample start to expand. The internal cracks of the rock are stable and expand at first, but with the gradual increase in the load, the internal cracks gradually develop into an unstable expansion stage. The changing of the cracks from stable to unstable extension corresponds exactly to the inflection point of the volume strain curve from negative to positive growth [44,45]. This inflection point is considered the long-term strength of the rock.
The specific process of the volume expansion method used to determine the long-term strength is as follows: (1) the stress–axial strain curve and the stress–circular strain curve are obtained according to the creep test; (2) the stress–volume strain curve is obtained by superimposing the two curves from Step 1; and (3) the reverse inflection point of the volumetric strain, which is the long-term strength value, is then determined (Figure 3).
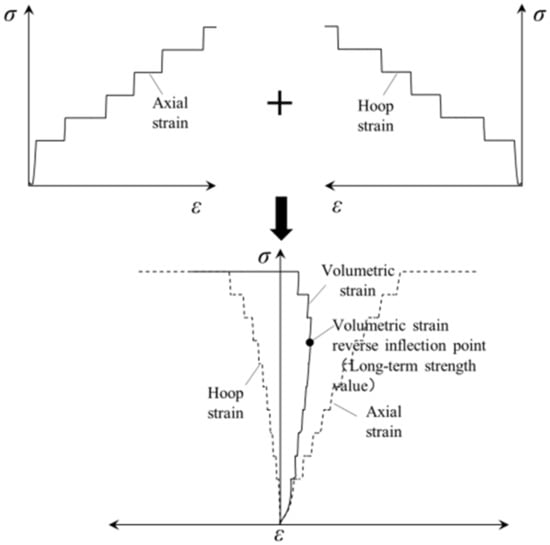
Figure 3.
Determination process of the volume expansion method.
The volume expansion method is simple and easy to implement, but the premise of this method is to accurately measure the axial and lateral strains of the rock throughout the whole process of the stress, deformation, and failure of the rock sample, so as to obtain the whole process curve of the volumetric strain. The accuracy of determining the long-term strength largely depends on the accuracy of the measurement of the specific values of the axial and lateral strain during the test [46]; therefore, the accuracy of the strain measuring instrument is higher and the cost is higher.
2.4. Stress Relaxation Method
There is a close correlation between rock creep and stress relaxation. During creep, the viscous deformation contributes to the stress relaxation effect. At the same time, the stress relaxation reduces the stress value required for creep development. From an energy point of view, the development of deformation during the creep test has a relaxation effect on the stress, leading to a decrease in stress. In order to ensure constant stress on the rock sample, the stress needs to be continuously applied to compensate for the stress loss caused by the relaxation effect, which will generate an accumulation of additional energy; in the stress relaxation test, a portion of the elastic deformation is released to compensate for the creep deformation in order to keep the strain of the rock sample constant [47,48]. There is no incremental energy gain in this process, and part of the elastic energy of the rock is released. This is why creep develops failure during the tests, while stress relaxation tends to stabilize. The rapid relaxation phase of stress relaxation better reflects the instantaneous mechanical properties, and the stress concentration accumulated during loading is rapidly released through crack expansion and extension. After that, the stress relaxation of the rock sample enters the decay relaxation stage. In this stage, the stress relaxation mode of the rock sample gradually changes from crack extension-based to the viscous deformation of the rock sample [49]. In order to keep the deformation unchanged, the stress will inevitably relax to the stress level that corresponds to a creep rate of 0, which is induced by the viscous deformation and is the long-term strength.
The process of the stress relaxation method for determining long-term strength is relatively simple (Figure 4). The stress relaxation test curve is obtained through a single-stage load stress relaxation test. As the stress level increases, the relaxation residual stress will eventually approach a constant value [50]. This value is the long-term strength value.
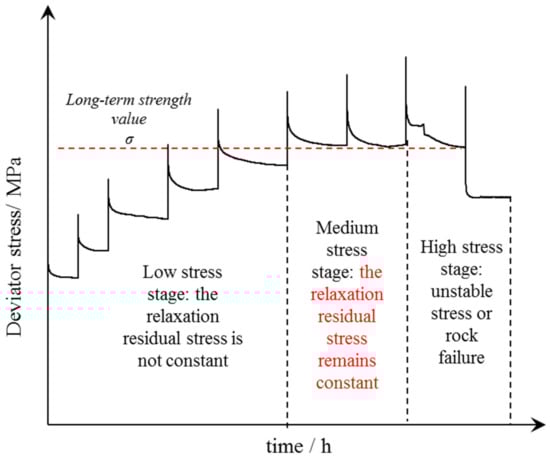
Figure 4.
Stress relaxation method to determine the process.
The mechanical significance of the stress relaxation method is clear, but the test procedure is relatively complex, the test period is long, and the test is less effective for rocks with insignificant stress relaxation characteristics. This method is suitable for rocks with obvious relaxation characteristics.
2.5. Comparison of Different Long-Term Strength Determination Methods
Table 1 summarizes the characteristics and applicable scope of the various long-term strength determination methods discussed above.

Table 1.
Characteristics and applicable conditions of different long-term strength determination methods.
3. Creep and Stress Relaxation Characteristics Test
In order to compare the characteristics and applicable scope of various long-term strength determination methods more directly, creep tests and stress relaxation tests were carried out on the mud-calcareous conglomerate rock samples in the Three Gorges Reservoir Area. This type of conglomerate rock is cemented by mud and calcium, and it has a very significant steady creep stage during long-term deformation. The particle size of the gravel in the rock samples was between 2–20 mm.
3.1. Test Scheme
The design of the test plan is strictly based on the “Rock rheological test procedures”, prepared by the Yangtze River Academy of Sciences of the Yangtze River Water Resources Commission [51]. The test instrument used was a TLW-2000 servo-controlled rock tester (Figure 5). The axial strain and lateral strain were measured by measuring needles. The measurement range was 5 mm, and the full range accuracy was 0.1%.
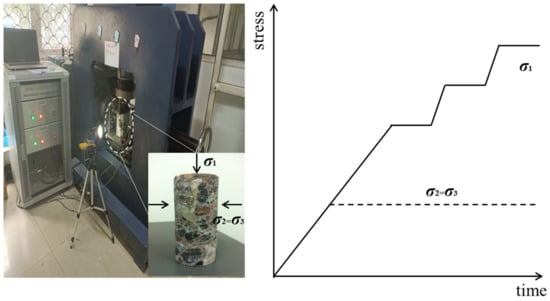
Figure 5.
TLW-2000 servo-controlled rock tester and load path.
The steps of creep test are as follows: (1) creating rock samples sized 50 mm (diameter) by 100 mm (height), and smoothing the faces of the rock samples; (2) applying a 5 mPa confining pressure to the rock samples and keeping the confining pressure constant; and (3) when the first axial stress stage is applied to the rock sample, the loading rate is controlled at 0.05 mPa/s and the strain is monitored. When the creep rate of the rock sample under the first stage is generally constant, the next stage stress is applied. Table 2 shows the loading stage in detail.
Table 2.
Triaxial creep test scheme.
The stress relaxation test steps are as follows: (1) creating rock samples sized 50 mm (diameter) by 100 mm (height) and smoothing the faces of the rock samples; (2) applying a 5 mPa confining pressure to the rock samples and keeping the confining pressure constant; and (3) applying deviatoric stress to the rock samples, and the loading rate is controlled at 0.05 mPa/s. When the deviatoric stress reaches the designed value, the corresponding strain value is kept constant, and the variation of deviatoric stress with time is recorded. Table 3 shows the loading stage in detail.
Table 3.
Stress relaxation test scheme.
3.2. Test Results
3.2.1. Creep Test Results
The triaxial creep test curve of the rock specimen is shown in Figure 6. When the load is small, the rock sample is in the compaction stage, the internal cracks are in a closed state, and the deformation characteristic is the attenuation creep. With the increase in stress, the creep deformation of the specimen is gradually significant, and the deformation characteristics are attenuation and steady-state creep; the creep rate value in the steady-state stage over time gradually tends toward being constant. By continuing to increase the axial stress, the steady-state creep deformation characteristics of the rock sample become increasingly obvious and the steady-state creep rate increases step by step. When the stress level is loaded to the last level of 55 mPa, the rock sample shows the three-stage typical characteristic of creep deformation and, eventually, failure due to the nonlinear accelerated creep.
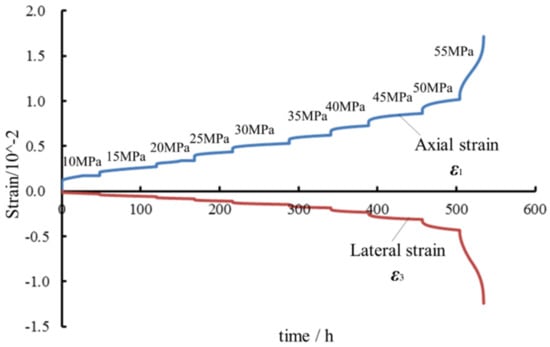
Figure 6.
Triaxial creep test curves of the rock specimen.
3.2.2. Stress Relaxation Test Results
Figure 7 shows the stress relaxation test curves for the rock samples. The relaxation of the conglomerate can be seen in the curves of the different levels of stress over time. In contrast to the stress characteristics of brittle rocks with high strength, the stress in the conglomerate specimen decreases significantly during the first stage of relaxation, with no obvious onset of relaxation. The circumferential strain of the rock specimen increases slowly with time while keeping the axial strain value of the rock specimen constant, which is manifested in two main stages: decay creep and steady creep. The decaying stress relaxation phenomenon occurs at the initial stage when relaxation first occurs, and the stress relaxation rate of the rock specimen decreases rapidly with time. The stable stress relaxation stage occurs after the attenuated relaxation and, after entering this stage, the stress relaxation rate of the rock sample tends toward a relatively constant value. Due to the presence of external energy recharge during the relaxation process, the stable relaxation rate will gradually tend toward 0. In addition, the magnitude of the relaxation stress of the rock is closely related to the initial stress level of relaxation. When the initial strain level of stress relaxation is low, the specimen is mainly in the viscoelastic relaxation stage, and the stress relaxation is mainly manifested as attenuated relaxation, which gradually becomes stable over time. When the stress value corresponding to the initial strain level of stress relaxation is close to the ultimate strength of the rock sample, the magnitude of the relaxation stress increases significantly, and the phenomenon of a stable stress relaxation with a longer duration appears. In the final stage of the test, some of the stresses in the rock samples decrease rapidly. After a short decaying relaxation phase, the partial stress remained at about 32 mPa. This stress can be considered as the residual strength of the rock sample after damage. The conglomerate specimen did not fail during the stress relaxation process of maintaining a constant strain but was destroyed at the last stage of loading to 48.3 mPa.
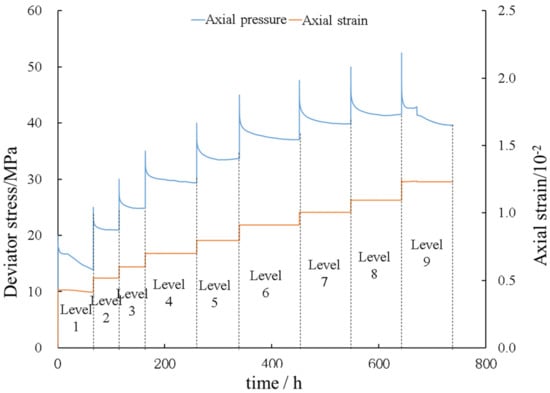
Figure 7.
Stress relaxation test curves of the rock specimens.
3.3. Long-Term Strength Determination Based on Conventional Methods
The interval for determining the long-term strength of the conglomerate based on the transition creep method is around 35 to 40 mPa, as shown in Figure 8.
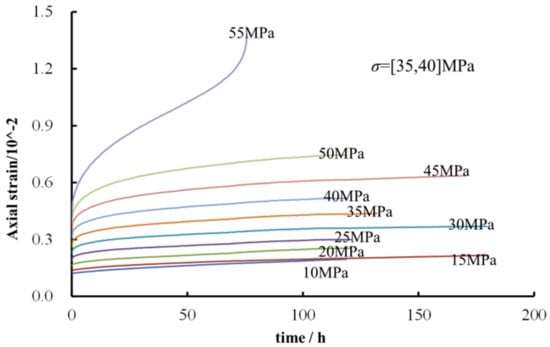
Figure 8.
Single-stage creep test curves under different stress levels.
The long-term strength of the conglomerate was determined using the isochronous stress–strain curve method, as shown in Figure 9. This method has certain subjective factors when determining the inflection point of the isochronous curve, and the specific steps are different. The method for determining the inflection point in this paper is as follows. According to the isochronous stress–strain curve of the rock samples, the slope mutation point of each curve or the interval with the maximum slope change in the same strain can be obtained with the slope method. When the mutation point is present, this point is the inflection point. When the mutation point is absent, the successive dichotomy is used to narrow the maximum slope change interval for a sufficient number of hours, and the midpoint of the interval is taken as the inflection point. The long-term strength of the conglomerate was determined to be about 47.1 mPa, according to the inflection point curve.
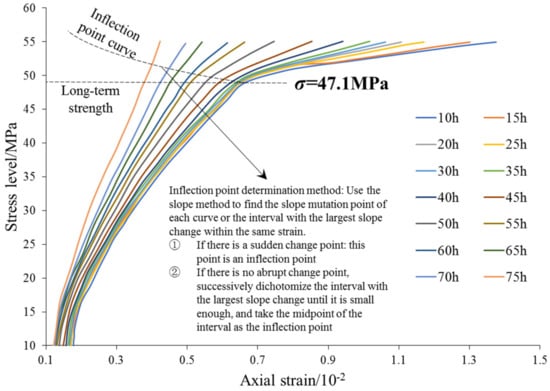
Figure 9.
Isochronal stress–strain curves of the rock specimen.
The long-term strength of the rock sample was determined to be approximately 39.2 mPa with the volume expansion method, as shown in Figure 10.
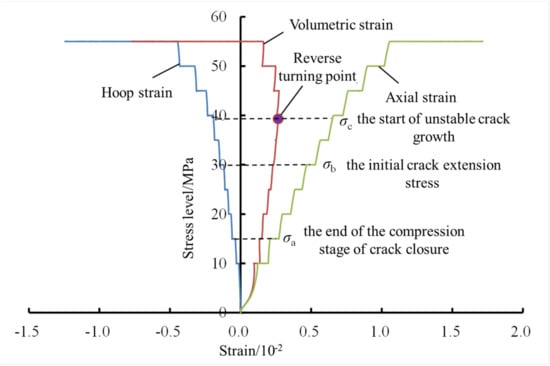
Figure 10.
Complete stress–strain curve and volume expansion point of the rock specimen.
As shown in Figure 11, according to the stress relaxation method, the long-term strength of the rock sample was determined to be 39.6 mPa.
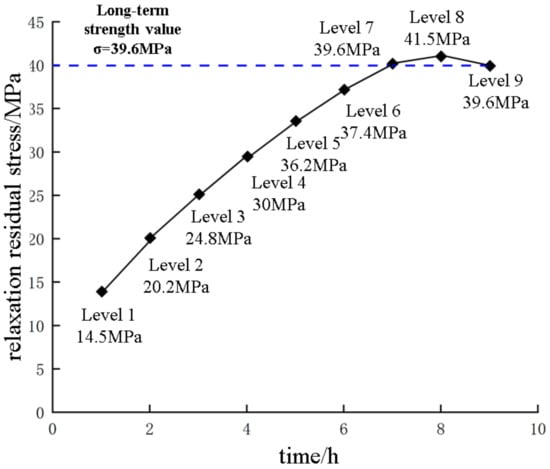
Figure 11.
Residual stress curve after relaxation and stabilization.
4. Steady-State Creep Rate Method Based on Stress Interval
4.1. Principle of Steady-State Creep Rate Method Based on Stress Interval
All of the above long-term strength determination methods have their own limitations. In view of this, this paper proposes a simple and fast method for the long-term strength estimation of such soft rocks, and it is characterized by significant steady-state creep phases.
Rocks undergo three typical deformation stages from the onset of creep to fracture: decay creep, steady creep, and accelerated creep. When the rock exhibits only initial decay creep, it can be assumed that the deformation of the rock converges with time. When the specimen is in the stable creep stage, the creep deformation rate is constant at a certain value that is greater than 0. As the creep time increases, the specimen will eventually transition to a nonlinear accelerated creep phase and ultimately fail. Therefore, the characteristics of the steady-state phase in the creep process of the rock sample can determine whether the sample will eventually rupture, and the basic characteristic of the rock sample in the steady-state creep phase is that its creep deformation rate will maintain a certain value; when the value tends to 0, the corresponding stress value can be regarded as the long-term strength value of the rock sample, and the stress interval of the long-term strength of the rock sample can be estimated by analyzing the creep test curve. Based on the above idea, a method for the long-term strength determination of rocks based on the stable creep rate of the stress interval is proposed.
4.2. Analysis of the Test Results of the Steady-State Creep Rate Method Based on the Stress Interval
The specific steps of the steady creep rate method for the stress interval are as follows:
The stress–strain curve of the specimen by loading can usually be divided into four stages: the crack closure stage, linear elastic deformation stage, crack stable growth stage, and unstable crack growth stage. As shown in Figure 10, the point σa on the curve represents the end of the compression stage of crack closure and the beginning of the line elastic deformation stage; σb represents the initial crack extension stress, which marks the start of the stress–strain curve’s divergence from the linear elastic trajectory (this illustrates the steady progression of internal fissures in the rock); and σc represents the start of unstable crack growth, and the volume strain appears inverted at this point, indicating the onset of rock volume expansion. The stress value corresponding to the point σb is taken as the lower limit of the interval where the long-term strength value is located, and the stress level of the creep failure of the rock is taken as the upper limit of the interval where the long-term strength value is located, so that the stress interval range of the long-term strength value of the rock can be initially estimated. In accordance with the above method, the stress interval range of the long-term strength value of the rock was initially determined to be 30~55 mPa from the stress–strain curve of the creep test.
The correlation between the creep rate of the steady-state creep and the stress increment beyond the long-term strength was investigated in the stress interval. It is assumed that there is an exponential nonlinear relationship between the steady-state creep rate and the stress increment in terms of long-term strength. The steady-state creep rate tends to be 0 as the stress level is gradually reduced and approaches the long-term strength value. By fitting the steady-state creep rate as it corresponds to different stress levels, the long-term strength of the rock can be obtained.
The correlation law between the assumed steady creep rate and the stress increment in terms of long-term strength can be calculated using the following equation:
In the above formula, is the steady-state creep rate; is the stress level; is the long-term strength of the rock; and q, p, and k are the related parameters of the rock material. The determination of parameters in Equation (1) depends on the fineness of the test loading grading: the finer the grading, the more accurate the parameters obtained.
The range of values of the long-term strength parameters of the rock was set to 30~55 mPa, and the steady creep stage of the test curve was more obvious when the axial partial stress levels in this range were 40, 45, 50, and 55 mPa, as shown in Figure 12. The corresponding parameters were obtained using Equation (1) for fitting and identification (as shown in Table 4), and are based on the steady creep rate of the rock under these four stress levels. The obtained value was 38.6 mPa, and the correlation coefficient R2 was 0.962.
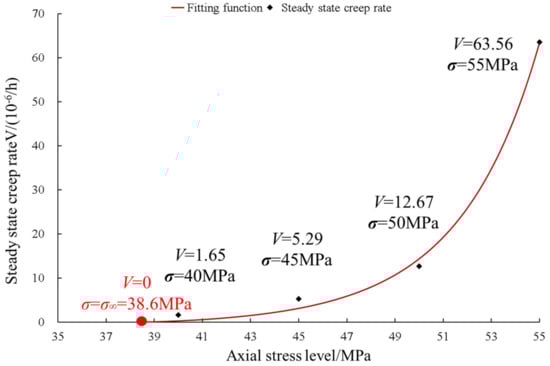
Figure 12.
The curve of the steady creep rate with stress level.
Table 4.
Parameters of the steady creep rate method based on stress intervals.
Compared with the conventional long-term strength determination methods, the steady-state creep rate method based on stress intervals has the following advantages: (1) The method only needs the following: to initially estimate the interval where the long-term strength is located based on the creep test curve, to calculate the steady-state creep rate for different stress levels within the interval, and to, finally, estimate the long-term strength value by fitting the steady-state creep rate corresponding to different stress levels into the equation (which is a simple determination procedure). (2) Since this method calculates the long-term strength by fitting the steady-state creep rates corresponding to different stress levels, compared with the transition creep method and the isochronous stress–strain curve method, this method requires a lower degree of accuracy for the creep experimental curve and can obtain specific long-term strength values rather than ranges. (3) The long-term strength value obtained via this method is an approximation estimated reached through fitting the curve, which requires a lower degree of instrument accuracy than the volumetric expansion method, and the scattering of data due to individual differences in measuring instruments and rock samples has less influence on this method than other methods.
The long-term strength of the conglomerate is determined based on the transition creep method in the interval of 35–40 mPa. The long-term strength of the specimen was determined to be 39.2 mPa by the volume expansion method. The long-term strength of the sample was determined to be 39.6 mPa by the stress relaxation method. The long-term strength of the specimen was determined to be 38.6 mPa by the steady-state creep rate method based on the stress interval. It can be seen that the results obtained through the steady-state creep rate method based on the stress interval are within the range of the transition creep method and are basically consistent with the results obtained using the volume expansion method and the stress relaxation method, indicating that the steady creep rate method in the stress interval is feasible for the conglomerate in this test.
5. Conclusions
- (1)
- The creep and stress relaxation tests were conducted on a slightly weathered mud-calcareous conglomerate in the Three Gorges Reservoir Area. The creep test results show that the creep characteristics of the rock samples over time are very obvious and show the typical characteristics of the three stages of rocks changing over time. The relaxation test results show that the stress relaxation effect of the mud-calcareous conglomerate was significant, which was manifested in the two stages of decay relaxation and stable relaxation, and the relaxation rate gradually tended toward 0 after entering the stable relaxation stage. Under the conditions of constant strain levels in the latter three stages, the residual stress level after relaxation basically remained close to the same value;
- (2)
- Different methods were used to determine the long-term strength values of the conglomerate specimens. Through comparative analysis, the transition creep method requires a more stringent accuracy of the creep test curve, it is suitable for rocks with distinct characteristics in the decaying creep phase and stable creep phase, and it can only estimate the interval of long-term strength; in addition, the process of determining the inflection point using the isokinetic stress–strain curve method contains a certain number of subjective factors. The volumetric expansion method is simple and easy to implement, but its accuracy depends on the accuracy of the specific values of axial and transverse strains measured during the test. The stress relaxation method is able to directly obtain the residual stress value after stabilization, but the test procedure is relatively complicated, the test period is long, and the rock effect is poor. It is suitable for determining the long-term strength of rocks with obvious relaxation characteristics;
- (3)
- A method is proposed here to rapidly determine the long-term strength of rocks based on the steady-state creep rate in the stress interval. The method first estimates the range of stress levels for the long-term strength of rocks based on the characteristics of stress–strain curves during the deformation and fracture of rocks, and it assumes an exponential nonlinear relationship between the steady-state creep rate and the increase in stress in terms of the long-term strength. As the steady-state creep rate gradually approaches 0, the stress gradually decreases and approaches the long-term strength value.
Author Contributions
Data curation, R.W. and H.L.; investigation, C.Y. and F.W.; methodology, R.W. and H.L.; writing—original draft, R.W. and H.L.; writing—review and editing, R.W. and C.Y. All authors have read and agreed to the published version of the manuscript.
Funding
This research was funded by the National Natural Science Foundation of China (grant number 51979151); the Natural Science Foundation of Hubei Province Outstanding Youth Project (grant number 2021CFA090); and the Three Gorges Key Laboratory of Geological Hazards of the Ministry of Education (China Three Gorges University) (grant number 2020KDZ07).
Institutional Review Board Statement
Not applicable.
Informed Consent Statement
Not applicable.
Data Availability Statement
Not applicable.
Acknowledgments
The authors gratefully acknowledge the Yangtze River Scientific Research Institute for its help in the field sampling process.
Conflicts of Interest
The authors declare no conflict of interest.
References
- Li, L.C.; Xing, M. A Numerical Investigation on Time-Dependent Failure of Tunnels Based on the Long-Term Strength Characteristics of Rocks. Appl. Mech. Mater. 2014, 580–583, 1315–1320. [Google Scholar] [CrossRef]
- Kemeny, J. The Time-Dependent Reduction of Sliding Cohesion due to Rock Bridges Along Discontinuities: A Fracture Mechanics Approach. Rock Mech. Rock Eng. 2003, 36, 27–38. [Google Scholar] [CrossRef]
- Wang, Q.Y.; Zhu, W.C.; Xu, T.; Niu, L.L.; Wei, J. Numerical Simulation of Rock Creep Behavior with a Damage-Based Constitutive Law. Int. J. Geomech. 2017, 17, 04016044. [Google Scholar] [CrossRef]
- Eberhardt, E.; Stead, D.; Coggan, J.S. Numerical analysis of initiation and progressive failure in natural rock slopes—The 1991 Randa rockslide. Int. J. Rock Mech. Min. Sci. 2004, 41, 69–87. [Google Scholar] [CrossRef]
- Gao, R.; Wu, F.; Chen, J.; Zhu, C.; Ji, C. Study on creep characteristics and constitutive model of typical argillaceous salt rock in energy storage caverns in China. J. Energy Storage 2022, 50, 104248. [Google Scholar] [CrossRef]
- Chen, J.; Chen, H.; Wu, F.; Jiang, D.; Zhang, H.; Gao, R.; Ding, B. Creep Properties of Mudstone Interlayer in Bedded Salt Rock Energy Storage Based on Multistage Creep Test: A Case Study of Huai’an Salt Mine, Jiangsu Province. Geofluids 2022, 2022, 2012776. [Google Scholar] [CrossRef]
- Lin, L.; Weiya, X. Experimental Researches on Long-Term Strength of Granite Gneiss. Adv. Mater. Sci. Eng. 2015, 2015, 187616. [Google Scholar]
- Chen, D.; Wang, L.; Versaillot, P.D.; Sun, C. Triaxial creep damage characteristics of sandstone under high crustal stress and its constitutive model for engineering application. Deep Undergr. Sci. Eng. 2023, in press. [Google Scholar] [CrossRef]
- Bieniawski, Z. Mechanism of brittle fracture of rock: Part I—Theory of the fracture process. Int. J. Rock Mech. Min. Sci. Geomech. Abstr. 1967, 4, 395–406. [Google Scholar] [CrossRef]
- Deng, N.; Qiao, L.; Li, Q.; Hao, J.; Wei, M.; Zhang, Q. Study on crack evolutional behavior of rocks in triaxial compression based on colony growth dynamics model. Sci. Rep. 2022, 12, 18459. [Google Scholar] [CrossRef]
- Helal, H.; Homand-Etienne, F.; Josien, J.-P. Validity of uniaxial compression tests for indirect determination of long term strength of rocks. Int. J. Min. Geol. Eng. 1988, 6, 249–257. [Google Scholar] [CrossRef]
- Zha, E.; Zhang, Z.; Zhang, R.; Wu, S.; Li, C.; Ren, L.; Gao, M.; Zhou, J. Long-term mechanical and acoustic emission characteristics of creep in deeply buried jinping marble considering excavation disturbance. Int. J. Rock Mech. Min. Sci. 2021, 139, 104603. [Google Scholar] [CrossRef]
- Fujii, Y.; Kiyama, T.; Ishijima, Y.; Kodama, J. Circumferential strain behavior during creep tests of brittle rocks. Int. J. Rock Mech. Min. Sci. 1999, 36, 323–337. [Google Scholar] [CrossRef]
- Sangha, C.M.; Dhir, R.K. Influence of time on the strength, deformation and fracture properties of a lower Devonian sandstone. Int. J. Rock Mech. Min. Sci. Geomech. Abstr. 1972, 9, 343–352. [Google Scholar] [CrossRef]
- Zong-ji, C. The mechanical problems for the long-term stability of underground galleries. Chin. J. Rock Mech. Eng. 1982, 1, 1–20. [Google Scholar]
- Ding, G.; Liu, J.; Wang, L.; Wu, Z.; Zhou, Z. Discussion on determination method of long-term strength of rock salt. Energies 2020, 13, 2460. [Google Scholar] [CrossRef]
- Hou, R.; Shi, Y.; Xu, L.; Fu, J.; Zhang, K. Evaluating long-term strength and time to failure of sandstone with different initial damage. Adv. Civ. Eng. 2020, 2020, 7149148. [Google Scholar] [CrossRef]
- Damjanac, B.; Fairhurst, C. Evidence for a Long-Term Strength Threshold in Crystalline Rock. Rock Mech. Rock Eng. 2010, 43, 513–531. [Google Scholar] [CrossRef]
- Aubertin, M.; Li, L.; Simon, R. A multiaxial stress criterion for short-and long-term strength of isotropic rock media. Int. J. Rock Mech. Min. Sci. 2020, 37, 1169–1193. [Google Scholar] [CrossRef]
- Schmidtke, R.H.; Lajtai, E.Z. The long-term strength of Lac du Bonnet granite. Int. J. Rock Mech. Min. Sci. Geomech. Abstr. 1985, 22, 461–465. [Google Scholar] [CrossRef]
- Wu, F.; Gao, R.; Zou, Q.; Chen, J.; Liu, W.; Peng, K. Long-term strength determination and nonlinear creep damage constitutive model of salt rock based on multistage creep test: Implications for underground natural gas storage in salt cavern. Energy Sci. Eng. 2020, 8, 1592–1603. [Google Scholar] [CrossRef]
- Haifeng, L.; Zhigen, Z. Creep properties and a creep equation of delay outburst coal and its adjacent mudstone. Int. J. Min. Sci. Technol. 2016, 26, 1161–1167. [Google Scholar]
- Yao, W.; Hu, B.; Zhan, H.; Ma, C.; Zhao, N. A Novel Unsteady Fractal Derivative Creep Model for Soft Interlayers with Varying Water Contents. KSCE J. Civ. Eng. 2019, 23, 5064–5075. [Google Scholar] [CrossRef]
- Liu, A.; Tian, G.; Zhang, Q.; Lin, W.; Jiang, J. Shear relaxation characteristics of rock joints under stepwise loadings. Comptes Rendus Mécanique 2018, 346, 1179–1191. [Google Scholar] [CrossRef]
- Yan, J.; Zhang, X.; Wang, K.; Song, X.; Yue, S.; Hou, J. Experimental Study on Creep Characteristics and Long–Term Strength of Anthracite. Processes 2023, 11, 947. [Google Scholar] [CrossRef]
- Okubo, S.; Fukui, K.; Hashiba, K. Hashiba Long-term creep of water-saturated tuff under uniaxial compression. Int. J. Rock Mech. Min. Sci. 2010, 47, 839–844. [Google Scholar] [CrossRef]
- Bieniawski, Z. Time-dependent behaviour of fractured rock. Rock Mech. 1970, 2, 123–137. [Google Scholar] [CrossRef]
- Yu, H.C.; Liu, H.D.; Huang, Z.Q.; Shi, G.C. Experimental study on time-dependent behavior of silty mudstone from the Three Gorges Reservoir Area, China. KSCE J. Civ. Eng. 2017, 21, 715–724. [Google Scholar] [CrossRef]
- Efimov, V.P. Investigation into the long-term strength of rocks under loading with a constant rate. J. Min. Sci. 2007, 43, 600–606. [Google Scholar] [CrossRef]
- Rahimi, S.; Hosseini, M. Laboratory studies of creep behavior on thick-walled hollow cylindrical salt rock specimens. Arab. J. Geosci. 2015, 8, 5949–5957. [Google Scholar] [CrossRef]
- Günther, R.M.; Salzer, K.; Popp, T.; Lüdeling, C. Steady-state creep of rock salt: Improved approaches for lab determination and modelling. Rock Mech. Rock Eng. 2015, 48, 2603–2613. [Google Scholar] [CrossRef]
- Zhang, L.; Yang, S. Unloading rheological test and model research of hard rock under complex conditions. Adv. Mater. Sci. Eng. 2020, 2020, 3576181. [Google Scholar] [CrossRef]
- Aixiang, W. Rheology of Paste in Metal Mines; Springer Science and Business Media LLC: Cham, Switzerland, 2022. [Google Scholar]
- Zhao, J.; Feng, X.T.; Yang, C.; Zhou, Y.; Zhang, Y. Study on Time-Dependent Fracturing Behaviour for Three Different Hard Rock Under High True Triaxial Stress. Rock Mech. Rock Eng. 2021, 54, 1239–1255. [Google Scholar] [CrossRef]
- Yu, C.; Tang, S.; Duan, D.; Zhang, Y.; Liang, Z.; Ma, K.; Ma, T. The effect of water on the creep behavior of red sandstone. Eng. Geol. 2019, 253, 64–74. [Google Scholar] [CrossRef]
- Zhang, Z.; Jiang, Q.; Zhou, C.; Liu, X. Strength and failure characteristics of Jurassic Red-Bed sandstone under cyclic wetting–drying conditions. Geophys. J. Int. 2014, 198, 1034–1044. [Google Scholar] [CrossRef]
- Zhao, M.L.; Zhang, Q.Y. The Application of Cubic Spline Interpolation Function in Determining Rock Rheological Long-Term Strength. Appl. Mech. Mater. 2014, 580–583, 205–208. [Google Scholar] [CrossRef]
- Brantut, N.; Heap, M.; Meredith, P.; Baud, P. Time-dependent cracking and brittle creep in crustal rocks: A review. J. Struct. Geol. 2013, 52, 17–43. [Google Scholar] [CrossRef]
- Martin, C.; Chandler, N. The progressive fracture of Lac du Bonnet granite. Int. J. Rock Mech. Min. Sci. Geomech. Abstr. 1994, 31, 643–659. [Google Scholar] [CrossRef]
- He, Q.; Wu, F.; Gao, R. Nonlinear creepdamage constitutive model of surrounding rock in salt cavern reservoir. J. Energy Storage 2022, 55, 105520. [Google Scholar] [CrossRef]
- Xu, X.; Zhang, C.; Yin, S.; Huang, T.; Wang, L. Unloading-creep test and long-term strength study of different initial conditions of limestone. IOP Conf. Ser. Earth Environ. Sci. 2021, 861, 022068. [Google Scholar] [CrossRef]
- Hu, J.; Sun, L.; Feng, H.; Liu, Z.; Wang, Q. Experimental Study on Creep of Sandstone under Hydrochemical Corrosion. J. Phys. Conf. Ser. 2022, 2148, 012024. [Google Scholar] [CrossRef]
- Wen, T.; Tang, H.; Ma, J.; Wang, Y. Evaluation of methods for determining crack initiation stress under compression. Eng. Geol. 2018, 235, 81–97. [Google Scholar] [CrossRef]
- Xiurong, Y.; Jiang, A.; Guo, X. Effects of water content and temperature on creep properties of frozen red sandstone: An experimental study. Bull. Eng. Geol. Environ. 2021, 81, 51. [Google Scholar]
- Gong, F.Q.; Wu, C.; Luo, S.; Yan, J.Y. Load–unload response ratio characteristics of rock materials and their application in prediction of rockburst proneness. Bull. Eng. Geol. Environ. 2019, 78, 5445–5466. [Google Scholar] [CrossRef]
- Pushkarev, V.I.; Afanas’ev, B.G. A rapid method of determining the long-term strengths of weak rocks. Sov. Min. Sci. 1973, 9, 558–560. [Google Scholar] [CrossRef]
- Liu, A.; Lin, W.; Jiang, J. Investigation of the Long-Term Strength Properties of a Discontinuity by Shear Relaxation Tests. Rock Mech. Rock Eng. 2019, 53, 831–840. [Google Scholar] [CrossRef]
- Ang, L.; Mingrong, S.; Jingcai, J. Investigation of the Shear Stress Relaxation Characteristics of a Structural Plane Using the Isostress Cyclic Loading Method. Geotech. Test. J. 2015, 38, 20140049. [Google Scholar] [CrossRef]
- Bai, Y.; Shan, R.; Ju, Y.; Wu, Y.; Tong, X.; Han, T.; Dou, H. Experimental study on the strength, deformation and crack evolution behaviour of red sandstone samples containing two ice-filled fissures under triaxial compression. Cold Reg. Sci. Technol. 2020, 174, 103061. [Google Scholar] [CrossRef]
- Paraskevopoulou, C.; Perras, M.; Diederichs, M.; Amann, F.; Löw, S.; Lam, T.; Jensen, M. The three stages of stress relaxation—Observations for the time-dependent behaviour of brittle rocks based on laboratory testing. Eng. Geol. 2017, 216, 56–75. [Google Scholar] [CrossRef]
- T\CSRME019-2022; Rock Rheological Test Procedures—Chinese Society for Rock Mechanics & Engineering. China Water & Power Press: Beijing, China, 2022. (In Chinese)
Disclaimer/Publisher’s Note: The statements, opinions and data contained in all publications are solely those of the individual author(s) and contributor(s) and not of MDPI and/or the editor(s). MDPI and/or the editor(s) disclaim responsibility for any injury to people or property resulting from any ideas, methods, instructions or products referred to in the content. |
© 2023 by the authors. Licensee MDPI, Basel, Switzerland. This article is an open access article distributed under the terms and conditions of the Creative Commons Attribution (CC BY) license (https://creativecommons.org/licenses/by/4.0/).