Abstract
The characteristics of electric buses make it difficult to estimate the energy consumption and mean that they are prone to battery loss; as such, fuel bus scheduling methods are no longer fully applicable. In current studies, the influence of these factors is ignored. This paper proposes an electric bus scheduling optimization model based on energy consumption and battery loss. Firstly, the LSTM (long short-term memory) is used to estimate trip energy consumption. Subsequently, these results are combined with the optimization objectives of minimizing the fleet size and battery loss amount. Limitations on the buses’ number, travel time, battery safety thresholds, remaining charge, and total charge are also considered. By controlling the different battery charge and discharge thresholds to minimize battery losses, the goal of sustainability is achieved. NSGA-II (non-dominated sorting genetic algorithm-II) is used to solve the model. The corresponding scheduling and charging scheme are determined. Electric bus route A is taken to validate the predictions. The results show that the annual fleet battery loss value decreases as the fleet size increases. The company has the lowest annual operating cost when the battery charge and discharge thresholds are set to [25%, 85%]. Optimizing the scheduling and charging scheme for electric bus can effectively reduce the operating cost.
1. Introduction
The development of the electric bus (EB) can effectively reduce vehicle emission pollution and ensure the sustainable development of society. A company’s improper use of batteries for EBs will accelerate its loss, indirectly causing irreversible effects on the environment. The high cost of battery purchase is also not beneficial to the company’s sustainability. In the era of fuel buses, companies do not need to consider the impact of batteries, so scheduling solutions are not fully applicable to electric buses. In the era of EBs, it is necessary to pay attention to the impact of driving range and charging lines.
EB scheduling problem can be described as follows: constrained by the mileage of the battery, the manager reasonably schedules all the EBs to complete the charging and operation work. The ultimate objective is to develop a well-designed scheduling scheme. With the recent promotion and development of EB, scholars have widely studied the problem of energy consumption estimation and battery loss of EB.
In terms of the impact of energy consumption estimates on EB scheduling, based on the fuel bus scheduling method, Lee et al. [1] considered the influence of random power consumption in energy consumption estimation and established a scheduling model. Yao et al. [2] considered the differences in energy consumption between different EB types. They developed a heuristic procedure for solving the problem and found the best solution considering the relationship between energy consumption and EB types. Liu et al. [3] established a scheduling model based on energy consumption with the goal of minimizing EB energy consumption and passenger waiting time. Teng et al. [4] estimated energy consumption to achieve the goal of minimizing the number of vehicles and total charging costs. Based on these results, a comprehensive optimization of the EB scheduling was performed. Bie et al. [5] considered the random fluctuation of travel time and energy consumption. They established a scheduling method that coordinates the scheduling scheme and charging scheme. Gkiotsalitis et al. [6] proposed a mixed integer nonlinear model for multi-depot vehicle scheduling problem of EB with a time window considering energy consumption estimation results. Bie et al. [7] used an accurate estimate of energy consumption. They proposed a scheduling strategy of combined daytime and nighttime charging for the problem of mixed scheduling of interval and full buses on EB lines. Chen et al. [8] proposed a data-driven model using an artificial neural network (ANN) to estimate a bus energy consumption and combined the energy consumption estimation results with the scheduling model. Basma et al. [9] proposed a battery selection framework based on a comprehensive energy demand assessment of EB. A reasonable battery type was equipped for each bus to ensure the completion of operational operations. Yang et al. [10] considered the association between the type of vehicle, the waiting time of passengers, and the energy consumption of the vehicle. Based on this relationship, a machine model was proposed for energy consumption estimation. Meanwhile, a multi-objective EB energy saving scheduling optimization model was designed with the aim of minimizing the passenger’s waiting time and the vehicle’s energy consumption.
In terms of the impact of battery loss on EB scheduling, Chen et al. [11] established a battery loss model based on economic factors, as well as a scheduling model with the objective of minimum operating cost for the company. Zhou et al. [12] considered the nonlinear charging curve of the battery and the battery degradation effect. Based on the above characteristics, they proposed a method of charging by using the residence time between continuous work. Zhang et al. [13] also considered these factors. They determined scheduling and charging strategies to minimize the total operating cost of the system. Xing et al. [14] proposed a new method for estimating the energy consumption of electric buses based on a data-driven model with a deep learning approach. They provided more accurate data for battery loss estimation and energy consumption estimation. Zhang et al. [15] considered battery losses to develop a hierarchical dispatch model between electric vehicles and the grid for energy efficiency and economic optimization. Tang et al. [16] established a single-leader multi-follower model based on game theory to minimize the loss cost of EB and the total cost of microgrid operators. Sung et al. [17] considered the battery charging of EB, the compatibility of battery and charger, and the scheduling and charging strategy. In order to reduce the total cost, a simulation model and a heuristic algorithm were proposed to deal with complex scheduling problems. Jiang et al. [18] studied the large-scale multi-station EB scheduling problem. They considered the impact of the depot constraints and a partial charging strategy for battery loss. A mixed integer programming model and an efficient branch pricing (BP) algorithm were proposed to solve the problem. Zhou et al. [19] optimized the deployment of the charger and the battery configuration in route in order to achieve a reduction in battery losses. They developed a robust plan for EB systems. Guschinsky et al. [20] studied the fleet of EBs and their charging infrastructure in order to maximize their social and ecological value. Ji et al. [21] proposed a charging facility sharing strategy that allows eelectric cars to pay for the use of EB charging posts during use of the electric buses scheduling scheme. The results showed that the charging facility sharing strategy can increase the revenue of public transport companies and promote the charging of EB without affecting the EC schedule.
Existing studies have optimized fuel bus scheduling models and combined them with the characteristics of EB. These studies focus on energy consumption, battery loss, time fluctuations, operating costs, charging strategies, etc. Most of the models are built from the perspective of the characteristics of EB themselves or the company’s operating costs [22]. However, it is difficult to develop a reasonable solution by focusing on one characteristic or one aspect of the EB in the scheduling process. An EB has unique characteristics, such as batteries which are prone to loss and difficulty in accurately estimating energy consumption. Existing studies are missing the combination of energy consumption estimation results and battery losses to study the impact of both together on bus scheduling. Moreover, most of the studies on battery loss focus on the battery itself, ignoring the effect on vehicle scheduling when reducing the loss. In addition, the energy consumption of the previous trip can largely affect the battery status of the next trip, which in turn affects the scheduling scheme. Both will have a negative impact on the remaining power and the scheduling scheme, and then affect the operating cost. The charge and discharge behavior of the battery pack of the EB will directly affect the battery attenuation during the operation task. When it decays to a certain value, the power provided by the battery pack will no longer be able to support the daily operation of EB. At the same time, the purchase cost of the battery pack usually accounts for more than 60% of the cost of the EB, and waste batteries can cause damage to the environment.
Therefore, we focused on the impact of energy consumption estimation and battery loss on scheduling. An accurate estimate of the energy consumption result is required. The scheduling scheme and charging scheme are optimized by the result, and battery loss estimation is also inseparable from the results. We control the value of charge to minimize battery loss while ensuring the bus can fulfill the scheduling tasks. A more reliable scheduling scheme and charging scheme can be developed. In this way, the company and the environment can achieve sustainable development.
We first used the LSTM (long short-term memory) model to predict the energy consumption values for all single trips and each trip of the EB. Subsequently, based on these data, a multi-objective scheduling optimization model is developed for the EB with the optimization objective of minimizing fleet size and battery losses. The NSGA-II (non-dominated sorting genetic algorithm with an elitist strategy) algorithm is used to solve the model to ensure the best scheduling effect. Finally, we select EB route A in a certain city for validation. The framework of the research is shown in Figure 1.
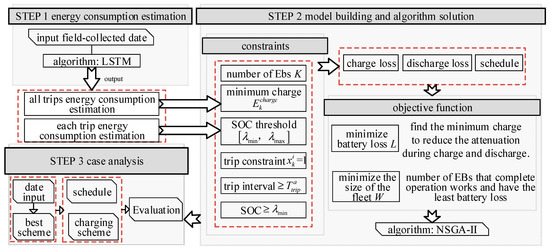
Figure 1.
Framework of the research.
2. Construction of a Multi-Objective Scheduling Optimization Model for EBs
2.1. Energy Consumption Estimation Method
The energy consumption estimation process is achieved through adapting the structure and size of the classical LSTM infrastructure. We estimate energy consumption based on the actual EB trip data collected. The results include an estimate of the energy consumption for all single trips on the future day and the energy consumption needed to complete all trips throughout the day . These data support the bus power above the safety threshold and the search for the minimum charge. The LSTM structure is shown in Figure 2.
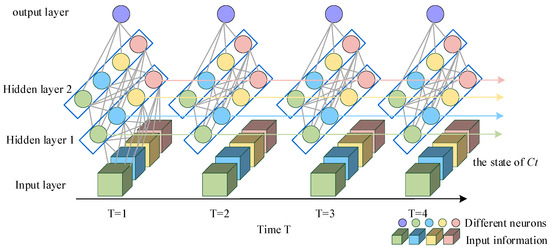
Figure 2.
The structure of the LSTM model for energy consumption estimation of electric buses.
The results of the correlation analysis of electric bus travel data by Pearson correlation coefficient method shows that the energy consumption of EBs is closely related to many factors, including average speed, travel time, air conditioning usage time, etc. At the same time, as the battery decreases, the energy consumption rate of the EB per kilometer gradually increases.
The EB operation data contains several factors related to energy consumption. In order to solve the problem of low accuracy of the existing energy consumption estimation methods, we firstly identify the influencing factors with strong correlation to energy consumption.
Meanwhile, 2 LSTM layers (both layers are 100 neurons) and 1 fully connected layer are designed in the model. The output value of the model is the energy consumption estimation value, the activation function uses the Relu function, the loss function uses MSE (mean squared error), and the optimizer uses the RMSprop method. On this basis, the LSTM model is used for time series prediction, and the time step is set to seven days, i.e., the data for each trip in seven days is used to predict the energy consumption value of each trip on the eighth day. The energy consumption estimation process is shown in Figure 3. The RMSE (root mean squared error) method was used to evaluate the effectiveness of the training model.
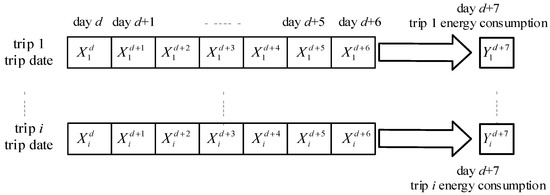
Figure 3.
Energy consumption estimation process.
is the estimated energy consumption of the trip on the day. is the data of the trip on the day, as shown in the following Equation (1):
where is the average speed of the EB, km/h; is the average temperature of the weather, °C; is the initial power, %; is the air conditioning time, min; is the trip time, min.
2.2. Model Assumptions
In the actual operation of EB, there are many factors influencing bus scheduling. In order to improve the applicability of the model, we simplify the actual situation by formulating assumptions, which are as follows:
- There are no traffic accidents or other accidents on the line, and the traffic environment is normal;
- The EBs are all the same model;
- The bus company formulates the bus line departure schedule in advance and fixes the departure interval;
- We ignore the natural aging loss of the EB power battery.
- All electric buses are charged at night and can be charged from a battery deficit to a full charge in one night.
2.3. Multi-Objective Scheduling Optimization Model Construction
Fleet size directly affects a company’s operating costs, while overcharging and discharging can increase battery loss and indirectly increase costs. Therefore, we establish a multi-objective scheduling optimization model for EBs based on energy consumption estimation.
Based on the results of the energy consumption estimation, we take the two objectives of minimizing fleet size and battery losses, while also considering the constraint of the number of buses, trip time, safety threshold, remaining charge, and minimum total charge.
2.3.1. Objective Function
The battery life of EBs will be shortened due to battery degradation during charging and discharging. The value of degradation is closely related to the charge amount, discharge amount, and the battery degradation coefficient [6].
Lam and Bauer established an empirical model of battery degradation as follows [23]:
where is the average during the charging or discharging of the EB; is the battery percentage of EB before charging; is the battery percentage of EB after charging; is the deviation during the charging or discharging of the EB; , , , and are model constants.
Objective function 1: Battery loss directly affects the service life of EB. Frequent deep charging and discharging of batteries will accelerate the loss. According to the energy consumption estimation results, Objective function 1 minimizes the loss from charging and discharging by selecting the appropriate charging moment and charging amount, as shown in the following Formula (5):
where is the number of the EB participating in the operation; is the battery loss rate during battery charging; is the battery loss rate during battery discharge; EB- needs to charge after completing the operation of the day, kWh; the discharge capacity of EB after completing the operation task of the day is , kWh.
Objective function 2: The minimum fleet size is selected as the objective function 2. That is, under the condition of ensuring the minimum battery loss, it is the minimum number of EBs required to complete all operations, as shown in Formula (6).
where is the number of EBs participating in the operation, vehicles; is the trip number; is the total number of bus trips throughout the day, times; is the EBs that complete the trip , then ; otherwise .
2.3.2. Constraints
The number of EBs constraint: The minimum number of buses required to complete all operational tasks, regardless of other restrictions, is the lower limit, vehicles. The number of EBs currently owned by the bus company is the upper limit, vehicles, as shown in the following Formula (7):
Trip constraint: The bus company needs to ensure that each trip is completed when scheduling, and one trip can only be performed by one EB, as shown in the following Formula (8):
Trip time interval constraint: During operation, the time interval between the two operating trip a and trip b of the EB- should be greater than the trip time for completing trip a , as shown in the following Formula (9):
safety threshold constraint: Jiang et al. [24] studied the long-term cycle performance of batteries in different ranges. They found that batteries cycled in the middle range had better cycle stability and lower battery degradation than batteries cycled at both ends of the (0–100%). In order to reduce the loss of the battery caused by overcharging and discharging, the upper and lower constraint of the battery safety threshold of the EB- are set. This range ensures that the battery remains within the safe threshold range, as shown in the following Formula (10):
Remaining constraint: Based on the specific value of the estimated energy consumption for a single trip, managers need to ensure that the remaining of the EB- after completing trip is not lower than the safety threshold, otherwise no work is scheduled, as shown in Formula (11).
is the battery of the EB- before the trip , %; is the rated capacity of the EB battery, kWh.
Minimum total charge constraint: The fleet will charge after completing all the trips of the day. The total charge is the total estimated power for the next day’s operation task minus the remaining power of the fleet for that day. At the same time, managers need to ensure that the remaining power of the EB after operation is above the safety threshold.
The charging strategy is as follows. Managers evenly distribute electricity to each bus and consider the upper constraint of the battery safety threshold. When the threshold is reached, the unfinished power is evenly distributed again until the reaches the requirement. When charging, the manager tries to keep the power of each EB in the medium SOC range as much as possible After the cycle is complete, the EBs will recharge to the upper threshold, as shown in the following Formula (12):
where is the remaining battery power of the EB- after completing the full day of operations, kWh.
2.3.3. Multi-Objective Scheduling Optimization Model
To sum up, we establish a multi-objective scheduling optimization model for EBs based on an energy consumption estimation, as shown in the following Formulas (13)–(15):
2.4. Algorithm Design
The two objective functions in the model are mutually restrictive. Specifically, in order to obtain better battery loss, it is necessary to select more EBs to reduce the average charge. This leads to an increase in the size of the EB fleet and poor economics. It is difficult to achieve the optimum of the two objectives at the same time, but there is a set of Pareto optimal solutions to make the two achieve the optimal balance.
Based on the complexity of the model, the NSGA algorithm was chosen to solve it. The algorithm has a strong global search capability and robustness, especially in finding Pareto frontiers quickly and maintaining population diversity, and it has been widely used to solve multi-objective problems. The NSGA-II algorithm flow is shown in Figure 4.
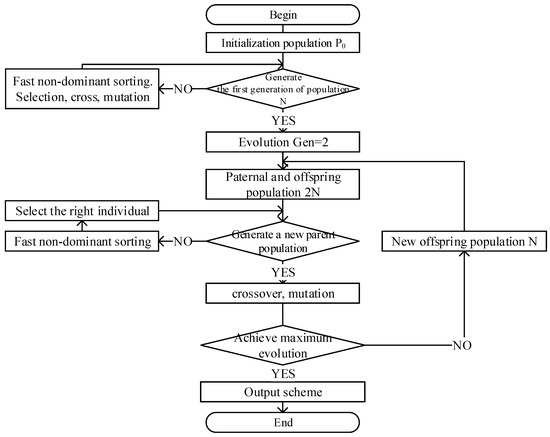
Figure 4.
NSGA-II algorithm flow.
- Coding scheme design
The NSGA-II algorithm used for solving the model is designed as a coding scheme, as shown in Figure 5. The first code is a real number code, which indicates the number of EBs used for operation; the subsequent code is a 0 or 1 code, which corresponds to the trip number operated by the EB.

Figure 5.
Schematic diagram of the coding scheme design.
The 0 or 1-code segment has a total of K segments, indicating the trip number operated by EB 1 to EB-K; each segment code is a total of 132 trips, corresponding to 0/1 on the position [0, 132], meaning that the EB is not operating/operating the trip. For example, if the code in position 7 of the 5th segment is 0, it means that EB 5 is not operating for trip 7; if it is 1, it means that trip 7 is operating.
- 2.
- Algorithm selection operation
The selection was carried out by a binary tournament method, in which two individuals in the population were randomly selected. Firstly, non-dominance ranking and crowding degree were calculated for two individuals. Secondly, we selected the best individual in the mating pool according to the non-dominance rank and crowding degree of the individuals. Finally, the mating pool size was the population size.
- 3.
- Algorithm cross operation
A single-point crossover was used for two random individuals (Individual 1 and Individual 2) in the mating pool. The crossover intercepts part of the length of each of the two individuals to form a new individual 0 or 1 variable coded segment of length , as shown in Figure 6.
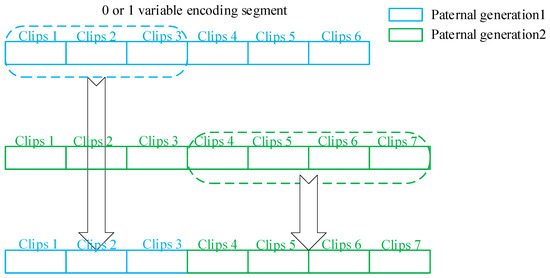
Figure 6.
Cross operation diagram.
As shown in Figure 5 for a new individual after the crossover trip, there will be duplicate trip codes for segments from different individuals in the 0 or 1 variable code segment (segments 1, 2, and 3 and 4, 5, 6, and 7), so it is necessary to set the duplicate trip code from 1 to 0, and at the same time set the trip code from 0 to 1 for the location where a trip is missing in a segment.
- 4.
- Algorithm mutation operation
Mutation processing is mainly aimed at the 0 or 1 variable coding segment. The rule is to randomly transform 0/1 at a certain position on a certain segment. For example, the 12th position in the 4th segment is randomly selected; if it is 0 at this time, it is converted to 1, and at the same time, the 12th position in the coding segment whose 12th position is 1 is converted to 0. The mutation operation is shown in Figure 7.

Figure 7.
Mutation operation diagram.
2.5. Evaluation System
The annual cost of an EB loss for a bus company includes the purchase cost of the EB , the charging cost of the EB , and the battery loss cost of the EB ; these three parts are shown in Formula (16). The evaluation cycle is one year, yuan.
Annual procurement cost of EBs is the ratio of the purchase cost to the operation life of the EBs, as shown in the following Formula (17):
where is the purchase cost of all EBs required to complete the scheme, yuan; A is the mandatory scrapping period of EBs, year.
Annual charging cost of EBs is the product of the charging power of all EBs and the electricity price within one year, as shown in the following Formula (18):
where is the local electricity price, yuan.
Annual battery loss cost of EBs is the product of the battery loss of all EBs operating within a year and the battery unit price per kilowatt hour, as shown in the following Formula (19):
where T is the operating cycle, day; is the battery price of EB, yuan.
3. Validation Analysis of Model
EB route A in a certain city is taken as an example to validate the proposed model. The operating data of the route is used to test the model. The solution results are analyzed under different charging and discharging thresholds. All calculations are carried out on a general-purpose computer with am Intel Core i5-9400F CPU@2.90 GHz and 8 GB RAM. Python is used to compile the LSTM network and NSGA-II genetic algorithm programs.
3.1. Basic Data and Parameter Determination
The driving length of route A is 7.9 km in each direction and consists of twenty-four stations. The EBs are equipped with LiFePO4 batteries (manufactured by Yutong Power Supply Company Limited, Shenzhen, China) and have a capacity of sixty passengers. The basic parameters of the bus are shown in Table 1.

Table 1.
Operational data of a certain EB.
The start time of route A is 6:30, and the end time is 17:20. The departure interval is 10 min. The total number of all EBs per day is 66 operations and 132 trips. We field-collected a total of 23,760 driving data from May to August, including certain data, such as departure time, average speed, end time, energy consumption, initial power consumption, and air conditioning start time.
Consider the impact of different battery safety threshold ranges on battery loss, charging capacity, and fleet size. A total of nine groups of upper and lower constraints of charge and discharge are set [20%, 90%], [20%, 85%], [20%, 80%], [25%, 90%], [25%, 85%], [25%, 80%], [30%, 90%], [30%, 85%], and [30%, 80%] to form a control group. At the same time, taking three days as a scheduling cycle, the EB scheduling scheme and charging scheme under different threshold conditions are analyzed.
3.2. Results of the Optimal Scheme
According to the NSGA-Ⅱalgorithm solution, we derived a total of 27 scheduling and charging schemes for 9 different charging threshold cases in a single scheduling cycle. Taking the battery safety threshold interval [25%, 85%] as an example, seven buses are required at this time, and the specific scheduling scheme for the first day is shown in Figure 8.
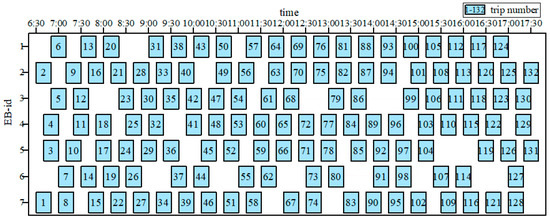
Figure 8.
Threshold range [25%, 85%] of the first day’s scheduling scheme.
After completing all operation work on the first day, the remaining power of all EBs is 391.199 kWh. It is necessary to make a charging scheme. According to the energy consumption estimation method, all EBs need to be recharged with 502.991 kWh to ensure the completion of the next day’s operation work.
Before charging, the SOC of each EB battery is 35%, 28%, 36%, 30%, 33%, 45% and 36%, respectively, and the charging value is 73.1 kWh, 73.1 kWh, 64.4 kWh, and 73.1 kWh. After charging, the SOC of the battery is 80%,73%,81%,75%,78%,85%, and 81%, respectively. The charging scheme is shown in Figure 9.
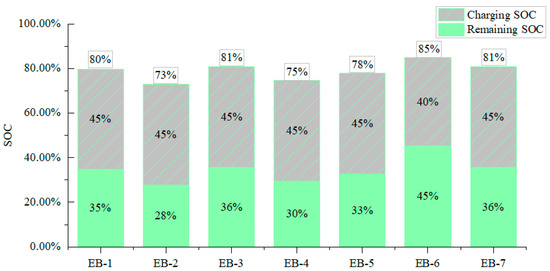
Figure 9.
Threshold range [25%, 85%] charging strategy for EBs on the first day.
The next day, seven EBs need to continue to complete the operation. The specific scheduling scheme for the first day is shown in Figure 10.
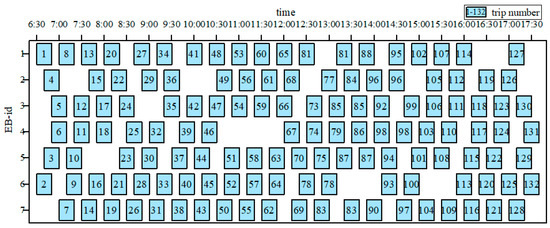
Figure 10.
Threshold range [25%, 85%] of the second day’s scheduling scheme.
After completing all operation work on the second day, the battery SOC of each electric bus is 32%, 27%, 25%, 26%, 36%, 34%, 27%, and the charging value is 85.5 kWh, 87.0 kWh, 87.0 kWh, 87.0 kWh, 87.0 kWh, 82.3 kWh, and 87.0 kWh, respectively. After charging, the SOC of the battery is 85%, 84%, 79%, 80%, 80%, 85%, and 81%, respectively. The charging scheme is shown in Figure 11.
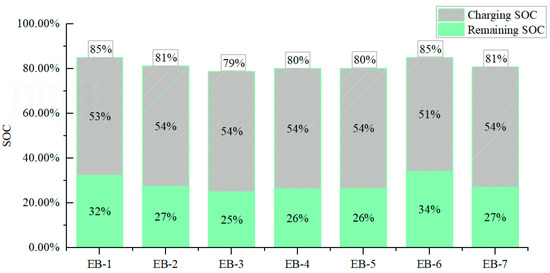
Figure 11.
Threshold range [25%, 85%] charging strategy for EBs on the second day.
On the last day of a scheduling cycle, the specific scheduling scheme for the seven EBs is shown in Figure 12.
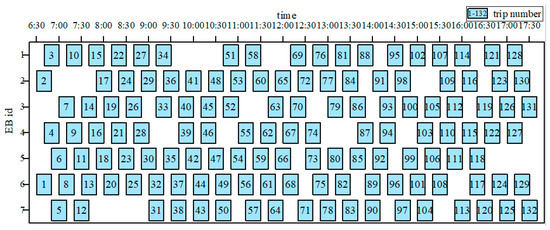
Figure 12.
Threshold range [25%, 85%] of the third day’s scheduling scheme.
According to the charging strategy, all electric buses need to be charged to the upper threshold on the last day of the cycle. The charging value is 83.5 kWh, 89.6 kWh, 89.0 kWh, 93.3 kWh, 93.3 kWh, 96.3 kWh, and 84.9 kWh, respectively. The SOC of the rechargeable battery is 85%. The charging scheme is shown in Figure 13.
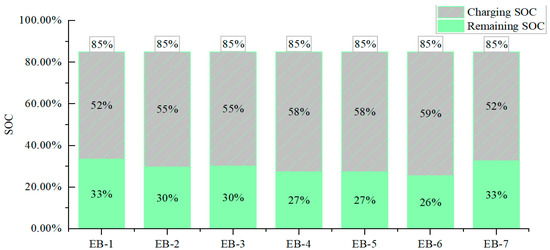
Figure 13.
Threshold range [25%, 85%] charging strategy for EBs on the third day.
3.3. Results Discussion and Evaluation
After the energy consumption estimation model is trained, all the data were substituted to compare with the real value, as shown in Figure 14. The results showed that all predicted values were basically consistent with the actual values, and the RMSE accuracy evaluation index reached 91.56%.
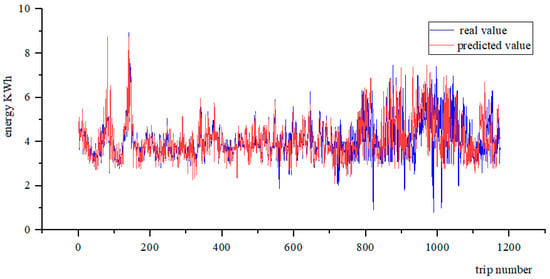
Figure 14.
Comparison of predicted and real values.
We selected the multiple nonlinear regression mode of the convolutional neural network time series prediction for comparison with the LSTM time series prediction. The RMSE results for the multiple nonlinear regression and convolutional neural network are calculated as 89.97% and 90.52%, respectively. The LSTM model prediction accuracy increased by 1.77% and 1.14%, as shown in Figure 15.
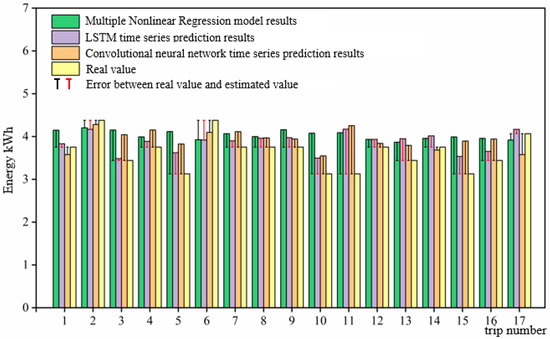
Figure 15.
Comparison of the estimated energy consumption results.
We designed different battery safety threshold ranges and used the NSGA-II algorithm to solve the corresponding scheduling schemes and charging values. The constants , , and of the LiFePO4 battery loss model are equal to −4.09 × 10⁻⁴, −2.167, 1.408 × 10⁻⁵, and 6.13, respectively. Based on these data, Formulas (2)–(4) and objective function (1) are used to calculate the battery loss value in this cycle and the annual loss value.
Under different conditions of charging and discharging thresholds, different fleet sizes of electric buses are needed to complete the operation work. The comparison between the number of EBs and the annual batteries loss value shows that the overall loss of the battery caused by the charging and discharging process shows a negative relationship with the number of EBs. In other words, the larger the fleet size, the less battery charging per EB and the lower battery loss, as shown in Figure 16.
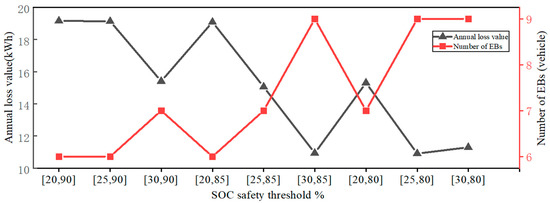
Figure 16.
Comparison between the number of EBs and the annual battery loss values.
According to the Formulas (16)–(19), the operating cost of the route A EB is estimated, as shown in Table 2.

Table 2.
Statistics of annual loss cost of EBs.
Different charging and discharging thresholds lead to different dispatching schemes, which in turn make a difference in terms of fleet size and battery loss. Due to the higher purchase cost of EBs, compared with using nine buses, the annual average EB purchase cost is reduced by 82,708 yuan when only six buses are used. However, a too small fleet size will lead to an average increase of 8.19 kWh in annual battery loss. As the purchase cost of the power battery is close to 70% of the vehicle cost, it cannot be ignored.
Overall, the company obtains the minimum annual operating cost of 338,961 when the battery safety threshold is set to [25%, 85%]. In this case, the fleet size is seven EBs, one bus more than the minimum fleet size number; the annual battery loss is 15.05 kWh, 4.12 kWh more than the minimum annual battery loss value, and there is an average annual operating cost saving of 9039.
4. Conclusions
The operation problems of EBs need specific scheduling methods. To solve this problem, a multi-objective scheduling model is proposed. Firstly, the single-trip energy consumption estimation results are obtained based on LSTM. A good performance of LSTM is shown with a prediction accuracy of 91.56%. It is increased by 1.77% and 1.14% compared to multiple nonlinear regression and the convolutional neural network, respectively. Based on these results with constraints, such as the number of buses, trip interval, battery safety threshold, remaining power, and minimum total charge, the objectives of minimizing fleet size and battery loss are formulated. Finally, a multi-objective scheduling optimization model for EB is developed. The NSGA-II algorithm solves the multi-objective scheduling optimization model, i.e., working out the EBs scheduling and charging scheme under different battery safety thresholds, and determining the scheme combined with the operating cost. The NSGA-II algorithm solves in 41.7706 s and obtains a better Pareto solution.
The results show that the optimal charge and discharge threshold of EB route A is [25%, 85%]. In this time, the average annual battery loss of EBs decreased by an average of 4.12 kWh, and the company’s operating costs reduced by an average of 9039. In this way, a new theoretical basis for reasonable scheduling of EBs is proposed.
We assume only one line and the differences between different EB types are not considered. As such, there is a lot of space to improve the accuracy of energy consumption estimation using LSTM. In the future we will study the synergistic optimization between multiple lines. With the increase in lines, the NSGA-II algorithm may not find the best solution. Moreover, we will consider using non-working hours for charging operations to improve efficiency. This requires a higher accuracy of energy consumption estimation. A more reliable energy consumption estimation method and solution algorithm will be investigated.
Author Contributions
Conceptualization, Y.X. and Q.F.; methodology, Q.F.; software, Y.L.; validation, H.C., Q.F. and E.N.; formal analysis, Y.X.; investigation, Y.L.; resources, Y.X.; data curation, Q.F.; writing—original draft preparation, Q.F.; writing—review and editing, Q.F.; visualization, Y.X.; supervision, Y.X.; project administration, Y.X.; funding acquisition, Y.X. All authors have read and agreed to the published version of the manuscript.
Funding
Project of Liaoning Provincial Education Department Scientific Research: Research on the evaluation method of urban regional road network structure based on supply and demand (LJKZ0590); Project of Liaoning Provincial Science and Technology Department Applied Basic Research Program: Road traffic information intelligent detection and evaluation technology research and equipment development (2023JH2/101600032).
Institutional Review Board Statement
Not applicable.
Informed Consent Statement
Not applicable.
Data Availability Statement
Not applicable.
Conflicts of Interest
The authors declare no conflict of interest.
References
- Lee, J.; Shon, H.; Papakonstantinou, I.; Son, S. Optimal fleet, battery, and charging infrastructure planning for reliable electric bus operations. Transp. Res. Part D Transp. Environ. 2021, 100, 103066. [Google Scholar] [CrossRef]
- Yao, E.; Liu, T.; Lu, T.; Yang, Y. Optimization of electric vehicle scheduling with multiple vehicle types in public transport. Sustain. Cities Soc. 2020, 52, 101862. [Google Scholar] [CrossRef]
- Liu, Y.; Yao, E.; Liu, S. Energy Consumption Optimization Model of Multi-Type Bus Operating Organization Based on Time-Space Network. Appl. Sci. 2019, 9, 3352. [Google Scholar] [CrossRef]
- Teng, J.; Chen, T.; Fan, W. Integrated Approach to Vehicle Scheduling and Bus Timetabling for an Electric Bus Line. J. Transp. Eng. Part A Syst. 2020, 146, 04019073. [Google Scholar] [CrossRef]
- Bie, Y.; Ji, J.; Wang, X.; Qu, X. Optimization of electric bus scheduling considering stochastic volatilities in trip travel time and energy consumption. Comput. Civ. Infrastruct. Eng. 2021, 36, 1530–1548. [Google Scholar] [CrossRef]
- Gkiotsalitis, K.; Iliopoulou, C.; Kepaptsoglou, K. An Exact Method for the Multi-Depot Electric Bus Scheduling Problem in Time Windows. Eur. J. Oper. Res. 2023, 306, 189–206. [Google Scholar] [CrossRef]
- Bie, Y.; Hao, M.; Guo, M. Optimal electric bus scheduling based on the combination of all-stop and short-turning strategies. Sustainability 2021, 13, 1827. [Google Scholar] [CrossRef]
- Chen, Y.; Zhang, Y.; Sun, R. Data-driven estimation of energy consumption for electric bus under real-world driving conditions. Transp. Res. Part D Transp. Environ. 2021, 98, 102969. [Google Scholar] [CrossRef]
- Basma, H.; Mansour, C.; Haddad, M.; Nemer, M.; Stabat, P. Energy consumption and battery sizing for different types of electric bus service. Energy 2022, 239, 122454. [Google Scholar] [CrossRef]
- Yang, X.; Liu, L. A Multi-Objective Bus Rapid Transit Energy Saving Dispatching Optimization Considering Multiple Types of Vehicles. IEEE Access 2020, 8, 79459–79471. [Google Scholar] [CrossRef]
- Chen, L.J.; Qin, M.; Gu, S.P.; Qian, K.J.; Xu, X.H. Optimal scheduling strategy for electric buses participating in V2G considering battery loss. Autom. Electr. Power Syst. 2020, 44, 52–60. [Google Scholar]
- Zhou, Y.; Meng, Q.; Ong, G.P. Electric Bus Charging Scheduling for a Single Public Transport Route Considering Nonlinear Charging Profile and Battery Degradation Effect. Transp. Res. Part B Methodol. 2022, 159, 49–75. [Google Scholar] [CrossRef]
- Zhang, L.; Wang, S.; Qu, X. Optimal electric bus fleet scheduling considering battery degradation and non-linear charging profile. Transp. Res. Part E Logist. Transp. Rev. 2021, 154, 102445. [Google Scholar] [CrossRef]
- Xing, Y.; Li, Y.; Liu, W.; Li, W.; Meng, L. Operation Energy Consumption Estimation Method of Electric Bus Based on CNN Time Series Prediction. Math. Probl. Eng. 2022, 2022, 6904387. [Google Scholar] [CrossRef]
- Zhang, Q.; Liu, H.; Li, C. A hierarchical dispatch model for optimizing real-time charging and discharging strategy of electric vehicles. IEEJ Trans. Electr. Electron. Eng. 2018, 13, 537–548. [Google Scholar] [CrossRef]
- Tang, C.; Liu, M.; Xie, M.; Dong, P.; Zhu, J.; Lin, S. A single-leader and multiple-follower stackelberg model for the look-ahead dispatch of plug-in electric buses in multiple microgrids. Energy 2021, 214, 118929. [Google Scholar] [CrossRef]
- Sung, Y.-W.; Chu, J.C.; Chang, Y.-J.; Yeh, J.-C.; Chou, Y.-H. Optimizing mix of heterogeneous buses and chargers in electric bus scheduling problems. Simul. Model. Pract. Theory 2022, 119, 102584. [Google Scholar] [CrossRef]
- Jiang, M.; Zhang, Y. A Branch-and-Price Algorithm for Large-Scale Multidepot Electric Bus Scheduling. IEEE Trans. Intell. Transp. Syst. 2022, 1–14. [Google Scholar] [CrossRef]
- Zhou, Y.; Wang, H.; Wang, Y.; Li, R. Robust optimization for integrated planning of electric-bus charger deployment and charging scheduling. Transp. Res. Part D: Transp. Environ. 2022, 110, 103410. [Google Scholar] [CrossRef]
- Guschinsky, N.; Kovalyov, M.Y.; Rozin, B.; Brauner, N. Fleet and charging infrastructure decisions for fast-charging city electric bus service. Comput. Oper. Res. 2021, 135, 105449. [Google Scholar] [CrossRef]
- Ji, J.; Bie, Y.; Wang, L. Optimal electric bus fleet scheduling for a route with charging facility sharing. Transp. Res. Part C Emerg. Technol. 2023, 147, 104010. [Google Scholar] [CrossRef]
- QU, X.; Liu, Y.; CHEN, Y.; Bie, Y. Urban electric bus operation management: Review and outlook. J. Automob. Saf. Energy Sav. 2022, 13, 407–420. [Google Scholar]
- Lam, L.; Bauer, P. Practical Capacity Fading Model for Li-Ion Battery Cells in Electric Vehicles. IEEE Trans. Power Electron. 2013, 28, 5910–5918. [Google Scholar] [CrossRef]
- Jiang, J.; Shi, W.; Zheng, J.; Zuo, P.; Xiao, J.; Chen, X.; Xu, W.; Zhang, J.G. Optimized operating range for large-format LiFePO4/graphite batteries. J. Electrochem. Soc. 2013, 161, A336. [Google Scholar] [CrossRef]
Disclaimer/Publisher’s Note: The statements, opinions and data contained in all publications are solely those of the individual author(s) and contributor(s) and not of MDPI and/or the editor(s). MDPI and/or the editor(s) disclaim responsibility for any injury to people or property resulting from any ideas, methods, instructions or products referred to in the content. |
© 2023 by the authors. Licensee MDPI, Basel, Switzerland. This article is an open access article distributed under the terms and conditions of the Creative Commons Attribution (CC BY) license (https://creativecommons.org/licenses/by/4.0/).