Article

Quantifying Brain and Cognitive Maintenance as Key Indicators for Sustainable Cognitive Aging: Insights from the UK Biobank

1
Department of Biomedical Engineering, Faculty of Environment and Life, Beijing University of Technology, Beijing 100124, China
2
Intelligent Physiological Measurement and Clinical Translation, Beijing International Base for Scientific and Technological Cooperation, Beijing University of Technology, Beijing 100124, China
3
School of Psychology, Central China Normal University, Wuhan 430079, China
4
Key Laboratory of Human Development and Mental Health of Hubei Province, Wuhan 430079, China
5
Key Laboratory of Adolescent Cyberpsychology and Behavior, Ministry of Education, Wuhan 430079, China
*
Authors to whom correspondence should be addressed.
Sustainability 2023, 15(12), 9620; https://doi.org/10.3390/su15129620
Submission received: 23 April 2023 / Revised: 14 June 2023 / Accepted: 14 June 2023 / Published: 15 June 2023
(This article belongs to the Section Health, Well-Being and Sustainability)

Abstract

:
Age-related cognitive decline is a global phenomenon that affects individuals worldwide. The course and extent of this decline are influenced by numerous factors, such as genetics, lifestyle, education, and cognitive engagement. The theory of brain and cognitive reserve/maintenance posits that these factors have a significant impact on the degree of cognitive decline and overall brain health. However, the absence of standardized definitions and measurements for these terms creates ambiguity in research. To address this issue, we utilized a robust and systematic experimental paradigm, employing a considerably large subject pool comprising 17,030 participants from the UK Biobank. Utilizing advanced machine learning methodologies, we were able to accurately quantify both brain maintenance (BM) and cognitive maintenance (CM), making use of six distinct MRI modalities and nine distinct cognitive capabilities. Our study successfully identified several significant features that were meaningfully associated with both BM and CM outcomes. The results of our study demonstrate that lifestyle factors play a significant role in influencing both BM and CM through unique and independent mechanisms. Specifically, our study found that health status is a critical determinant of BM, while diabetes was found to be moderately associated with CM. Furthermore, our study revealed a positive correlation between BM/CM and cognitive reserve. By carefully considering the unique and independent mechanisms that govern both BM and CM, as well as their correlation with cognitive reserve, our study has provided valuable insight into the various strategies that may be leveraged to promote sustainable interventions to enhance cognitive and brain health across the lifespan.

1. Introduction

As we age, declines in cognitive outcomes such as memory, processing speed, executive functioning, and attention are typical [1]. However, the course of aging can vary greatly between individuals, with some maintaining cognitive function until the end of life, while others experience a sharp decline [2]. Individual differences and variability in the trajectory of changes in cognition and brain health may be caused by many causes. Several models [3], such as brain reserve (BR), cognitive reserve (CR), brain maintenance (BM), and cognitive maintenance (CM), have been proposed to offer insights into the apparent paradox of resilience to cognitive decline. These models suggest that individual differences and variability in cognitive decline may be due to factors such as genetics, lifestyle factors, education, and cognitive engagement [4,5].
The BR and CR models have important implications for sustainable cognitive aging [6]. The BR model [7,8] suggests that some individuals may better cope with age- and disease-related brain damage than others before cognitive function is affected. This is because they have a greater initial neurobiological resource, such as more neurons or synapses, which allows them to tolerate more severe pathological change without deterioration of cognitive abilities. In contrast, the CR model [9] emphasizes the adaptability of functional brain networks, which enables resistance against the detrimental impact of age- or disease-related changes. Individual differences in CR are determined by the interaction between genetic predispositions and environmental exposures during an individual’s lifetime. This means that some individuals possess a greater ability to compensate for brain damage by utilizing alternate brain networks, allowing them to maintain cognitive performance. Unlike the BR model, which focuses on passive neurobiological resources, the CR model emphasizes the importance of functionality, plasticity, and adaptability in maintaining cognitive function [10]. CR is typically measured through proxies such as educational and occupational attainment, which summarize experiences that affect reserve [11]. CR can be metaphorically envisioned as software that executes computations in the brain and is shaped by diverse aspects of life experience [12]. This means that cognitive engagement, social interaction, and physical exercise throughout life can all contribute to building and maintaining CR, BM [13], and CM [14].
The study of the brain and cognitive resilience has garnered significant interest in recent years due to the rising prevalence of cognitive decline and dementia in aging populations. However, the relationship between the concepts of BR, CR, BM, and CM and their respective contributions to resilience remains a subject of ongoing debate. One of the main challenges in this field is the varying definitions and usage of these terms among different researchers, which leads to confusion in measurement and research applications [15]. Given the extensive research on BR and CR, scholars are now increasingly focused on defining and measuring BM and CM. Barulli et al. [16] proposed that reserve theories emphasize compensatory mechanisms, while maintenance theories emphasize neuroprotective mechanisms. Cabeza et al. [15] highlighted the clear relationship between reserve and maintenance but emphasized their distinct features: reserve enhances and augments resources, while maintenance preserves these resources through constant recovery and repair. Kremen et al. [14] suggested that reserve and maintenance are two parallel concepts, and the lack of reference to CM is due to the common use of static CR proxies, such as education, which do not allow for the examination of changes in CR. To promote more consistent and rigorous research, the reserve, resilience, and protective factors professional interest area, established under the auspices of the Alzheimer’s Association, formed a white paper workgroup to develop consensus definitions for BR, CR, and BM [12]. However, accurately measuring BM and CM in cross-sectional data remains a challenge, as these concepts are longitudinal in nature and require longitudinal data for accurate assessment.
The use of cross-sectional data to accurately assess maintenance presents a significant challenge. However, it should be noted that cross-sectional data can still provide valuable insights into the maintenance process. The “Reserve and Resilience” collaboratory, funded by the National Institute of Health, has proposed (https://reserveandresilience.com/framework/, accessed on 1 January 2023) comparing a given brain or cognitive measure to the distribution of brain or cognitive measures seen in younger individuals or establishing the expected level of brain or cognition for a particular age, which may address some of the concerns with cross-sectional data. For example, if successful BM is observed in a cross-sectional study, it may suggest that the structural and functional characteristics of the brains of the study participants are comparable to those of younger individuals. Conversely, if unsuccessful BM is observed, it may indicate that the structural and functional characteristics of the brains of the study participants are more similar to those of individuals who are older. These insights, when interpreted with caution, can provide important clues for investigating maintenance processes in aging and disease. Anatürk and colleagues [17] were pioneers in using cutting-edge machine learning techniques to quantify BM and CM during aging by predicting brain age and cognitive age. Their groundbreaking investigation revealed that CM was linked to CR proxies such as education and premorbid IQ, whereas BM did not exhibit such associations. Additionally, the researchers reported a negative association between cumulative lifestyle scores and BM, which did not maintain statistical significance after correcting for multiple comparisons. Conversely, no relationship was observed between cumulative lifestyle scores and CM. While the study significantly advances our knowledge of the complex interplay between lifestyle factors and cognitive health, several limitations need to be acknowledged. One limitation of the study is that BM and CM are constructed based on residuals between predicted brain age, predicted cognitive age, and chronological age. When the age prediction models show a suboptimal or unsatisfactory fit in accounting for chronological age (e.g., R2 = 0.38 for the brain age model and R2 = 0.09 for the cognitive age model), the residuals may contain a high level of noise, which can obscure true effects and make it more difficult to identify significant relationships between maintenance and lifestyle variables. Additionally, it should be noted that the study only considered three lifestyle factors: smoking, alcohol consumption, and physical activity. Previous research has shown that smoking and alcohol consumption have a negative impact on BM, indicating the existence of a negative association between cumulative lifestyle scores and BM. It is conceivable that the exclusion of other critical lifestyle factors may have influenced the observed lack of association between cumulative lifestyle scores and CM. Thirdly, the use of non-nested cross-validation in the study is an important consideration, where data are partitioned into training and validation sets, with the model being trained on the training set and evaluated on the validation set. In such cases, since the same data are utilized to tune model parameters and evaluate model performance, the model can overfit to the training data and produce poor outcomes on unseen data [18]. As a result, the model may identify spurious relationships or effects in the data, which can inflate the Type I error rate in subsequent statistical analyses. Fourth, the study’s gender distribution was imbalanced, with only 17.5% of the sample being female, which may result in underrepresented or misrepresented findings. Lastly, it is worth noting that the sample size of the study was moderate, with slightly over 500 participants. As a result, this might have limited the statistical power of the study and its ability to identify significant differences or relationships in the data. Therefore, it is crucial to keep these limitations in mind when interpreting the study’s findings.
In response to the limitations of previous research on BM and CM in aging, we have designed a rigorous and systematic experimental paradigm. Our study includes a large sample of 17,030 participants with a balanced gender distribution. To enhance model performance, we incorporated six MRI modalities, namely T1-weighted MRI (T1), T2 fluid-attenuated inversion recovery MRI (T2), susceptibility-weighted imaging (SWI), diffusion-weighted imaging (DWI), task fMRI (tfMRI), as well as resting-state functional MRI (rsfMRI)), thereby significantly increasing the dimensionality of the features. Furthermore, we investigated a wider range of lifestyle factors and health status indicators to comprehensively examine their effects on BM and CM. To mitigate the risk of overfitting, we employed a nested cross-validation approach to partition the data into training, validation, and test sets. This approach allowed us to optimize model parameters and evaluate model performance on unseen data. The present study has incorporated the employment of the last absolute shrinkage and selection operator (Lasso) [19] as a machine learning algorithm to discern the most enlightening features associated with brain age and cognitive age. Our research seeks to convey a more all-encompassing and meticulous comprehension of the intricate nexus between lifestyle parameters and preservation in the aging process.

2. Materials and Methods

2.1. Participants

Data utilized in the present study were drawn from a population-based prospective cohort study, the UK Biobank (UKB) [20]. This extensive study comprises a significant number of individuals, aged middle to old, exceeding 500,000 in total, and seeks to investigate the underlying causes of complex diseases affecting this age range [21]. Ethical approval for the study was granted by the North West Multicentre Research Ethics Committee (REC reference 11/NW/0382), and the UKB (application number 68382) had provided approval for the study’s implementation. Standardized questionnaires were used to collect participants’ comprehensive lifestyle information during in-person interviews. Additionally, cognitive function assessments were implemented using a touchscreen questionnaire. As part of the UKB’s research efforts, brain imaging data from a subset of participants was collected. The brain imaging data were collected approximately eight years after their baseline information was initially collected. To ensure the eligibility of participants, a rigorous screening process was implemented, as illustrated in Figure 1. Exclusions were made based on diagnoses classified according to the International Classification of Diseases, Tenth Revision (ICD-10), with individuals displaying malignant neoplasms of the eye, brain, and other parts of the central nervous system, cerebrovascular diseases, mental and behavioral disorders, diseases of the nervous system, and other conditions that impact brain health being excluded from the study. Out of the initial 388,721 participants, only individuals who had undergone brain scans using all six image modalities were selected. Satisfying this criterion were 27,842 individuals. Subsequently, further screening was carried out by selecting individuals who had completed nine cognitive tests, including pairs matching, numeric memory, fluid intelligence, paired associate learning, matrix pattern completion, reaction time, symbol digit substitution, tower rearranging, and trail making). Finally, following the stringent screening process, a total of 17,030 eligible participants were included in the study.
We employed nested cross-validation to estimate the prediction accuracy of the model. To accomplish this, we randomly partitioned the selected samples into two separate and equally sized subsets: a training set and a test set. A five-fold cross-validation approach was used to validate the model for the training set. Table 1 provides a detailed summary of the demographic characteristics of both sets, including key features such as gender and age. Figure 2 displays the chronological age distribution across the training and testing sets as well as the entire cohort.

2.2. Imaging Derived Phenotypes (IDPs)

The UKB study utilized MRI to generate multiple imaging modalities carefully designed by the UKB Imaging Working Group and a team of brain imaging experts. To ensure data compatibility, three imaging centers used identical 3T Siemens Skyra scanners with fixed platforms (Skyra 3T, Siemens Healthcare Gmb H, Erlangen, Germany). In the data release’s processing pipeline, high-quality image-derived phenotypes (IDPs) [22,23] were produced using a variety of freely available software tools, including the FMRIB Software Library (FSL) version 6.0. The ultimate objective of generating IDPs was to facilitate the direct usage of data for non-imaging experts without requiring any technical expertise and overcoming the intricacies of data processing methodologies. In the present study, the IDPs utilized were selected after a thorough review of the data showcase available at http://biobank.ctsu.ox.ac.uk/crystal/index.cgi, accessed on 11 January 2021. Table 2 provides a succinct overview of each IDP utilized. Our brain age prediction model incorporated a total of 2218 IDPs, which significantly improved the prediction accuracy and robustness.

2.3. Neuropsychological Exam

The neuropsychological battery [24] consists of seven cognitive domains used in our study. In order to make the data of the cognitive scale show a normal distribution rule, this study performed log (x + 1) conversion on the three cognitive scales, namely, the paired matching test (UKB ID: 399), the alphanumeric matching test (UKB ID: 6350), and the symbolic number-matching test (UKB ID: 20023). Then, in order to make the scale data show the order rule, this study conducted negative processing. Table 3 presents a comprehensive list of neuropsychological tests. A total of nine neuropsychological tests were included in the cognitive age prediction model.

2.4. Lifestyle and Physical Health Determinants

During their participation in the UKB study, participants were requested to provide comprehensive information regarding their lifestyle and physical health through several methods, including completing a touchscreen questionnaire, participating in a verbal interview, and undergoing physical measurements. To curate the non-imaging derived phenotypes (non-IDPs) for analysis, the study utilized the FMRIB UKBiobank Normalisation, Parsing And Cleaning Kit (https://git.fmrib.ox.ac.uk/fsl/funpack, accessed on 8 November 2022) software. This software categorized the variables into predefined groups and ensured that quantitative variable coding was parsed into monotonically meaningful values, while categorical variables were separated into multiple binary indicators. The resulting numeric vectors for all non-IDPs, including both quantitative and categorical variables, facilitated the straightforward calculation of correlation coefficients. The collected data were carefully analyzed to establish associations between key lifestyle and physical health determinants and maintenance. Specifically, the study assessed lifestyle factors such as smoking, alcohol consumption, and physical activity levels alongside the physical health outcomes of hypertension and diabetes. The study focused on 16 non-IDPs that were related to lifestyle and physical health and were carefully selected based on their relevance to the aim of the study. A detailed description of these phenotypes is presented in Table 4.

2.5. CR Proxy

The study examined four distinct CR proxies, including educational attainment, early fluid intelligence (measured during the initial assessment visit, 2006–2010), leisure activity, and social interactions. Educational level (UKB ID: 6138) or early fluid intelligence (UKB ID: 20016) were considered vital components of CR, reflecting lifetime cognitive enrichment that helps to safeguard against age-related cognitive decline [25,26]. Leisure activities, including visiting sports clubs or gyms, going to pubs or social clubs, participating in religious organizations, attending adult education classes, and other group activities (UKB ID: 6160) were also assessed as they are believed to enhance CR and protect against cognitive decline [27]. The total number of leisure activities participated in was quantified to calculate an overall score for leisure activities [28]. Additionally, social interaction frequency (UKB ID: 1031) was measured and divided into seven categories. Those who refused to answer or did not participate in the activities were excluded, and an overall score for social interaction was calculated. The higher the scores obtained for each CR proxy, the greater the level of CR. Table 5 outlines the mean, standard deviation (SD), and range of CR proxies assessed in the study.

2.6. Brain Age Prediction Model

In the field of neuroscience, machine learning methods have emerged as a powerful tool for predicting brain age using neuroimage features. Over the past decade, numerous studies have explored the use of machine learning methods for this purpose [29,30,31]. Recent advances in deep learning have further expanded the potential of machine learning for predicting brain age. Deep learning-based approaches have demonstrated impressive results in precisely predicting brain age, even in the presence of modest amounts of data [32,33]. The UK Biobank’s extensive neuroimaging data enhances the precision and robustness of brain age prediction models, thereby increasing their clinical applicability. As such, researchers widely utilize UKB for developing such models. For example, Subramaniapillai et al. [34] used XgBoost to predict brain age from the structural brain characteristics of 35,740 subjects (age range 44.57 to 81.89 years) and achieved a mean absolute error (MAE) of 4.23 years. Jawinski et al. [35] utilized three types of machine learning to predict brain age based on the T1 MRI features of 32,634 subjects (age range 45–80 years) and obtained an optimal MAE result of 3.09 years. Jonsson et al. [36] utilized convolutional neural networks (CNN) to predict brain age using the T1 MRI images of 12,395 subjects (age range 45–80 years) and obtained a MAE of 3.631 years. Gong et al. [37] applied a lightweight deep CNN architecture, Simple Fully CNN, to predict brain age based on the T1 MRI images of 6216 subjects (age range 44 to 80 years) and obtained a MAE result of 3.22 years. Dinsdale et al. [38] applied a deep 3D convolutional neural network architecture based on the T1 MRI images of 19,687 subjects (age range 44.6 to 80.6 years), achieving MAEs of 2.86 years in females and 3.09 years in males, respectively. In a recent study [39], we conducted a comprehensive comparative analysis of six commonly used machine learning models. Our results revealed that the Lasso model demonstrated significantly superior performance compared to the other five models. Moreover, Lasso’s performance levels were on par or even superior to classical deep learning algorithms. This superior performance of the Lasso model can be attributed to its distinctive capacity for variable selection and parameter estimation in high-dimensional datasets. By imposing a penalty on regression coefficients, Lasso reduces the influence of irrelevant or redundant features, making it particularly useful when working with a vast number of features, such as in our study involving over 2000 imaging features. The feature selection capability of Lasso enhances the efficiency and accuracy of data analysis by identifying and excluding uninformative features.
Given the strong predictive power of the Lasso model in brain age estimation, it was deemed appropriate for its application towards both brain age and cognitive age prediction. Within the Lasso model, the penalty regularization parameter alpha plays a critical role in determining the intensity of the penalty associated with model parameters. As alpha increases, the respective penalties associated with each parameter grow stronger, leading to greater degrees of model shrinkage. In this study, the grid search space for the aforementioned alpha parameter was specifically defined as (0.001, 0.01, 0.1, 1, 10, 100) in order to expeditiously search for the parameter value that would best optimize model performance.

2.7. Quantifying BM and CM

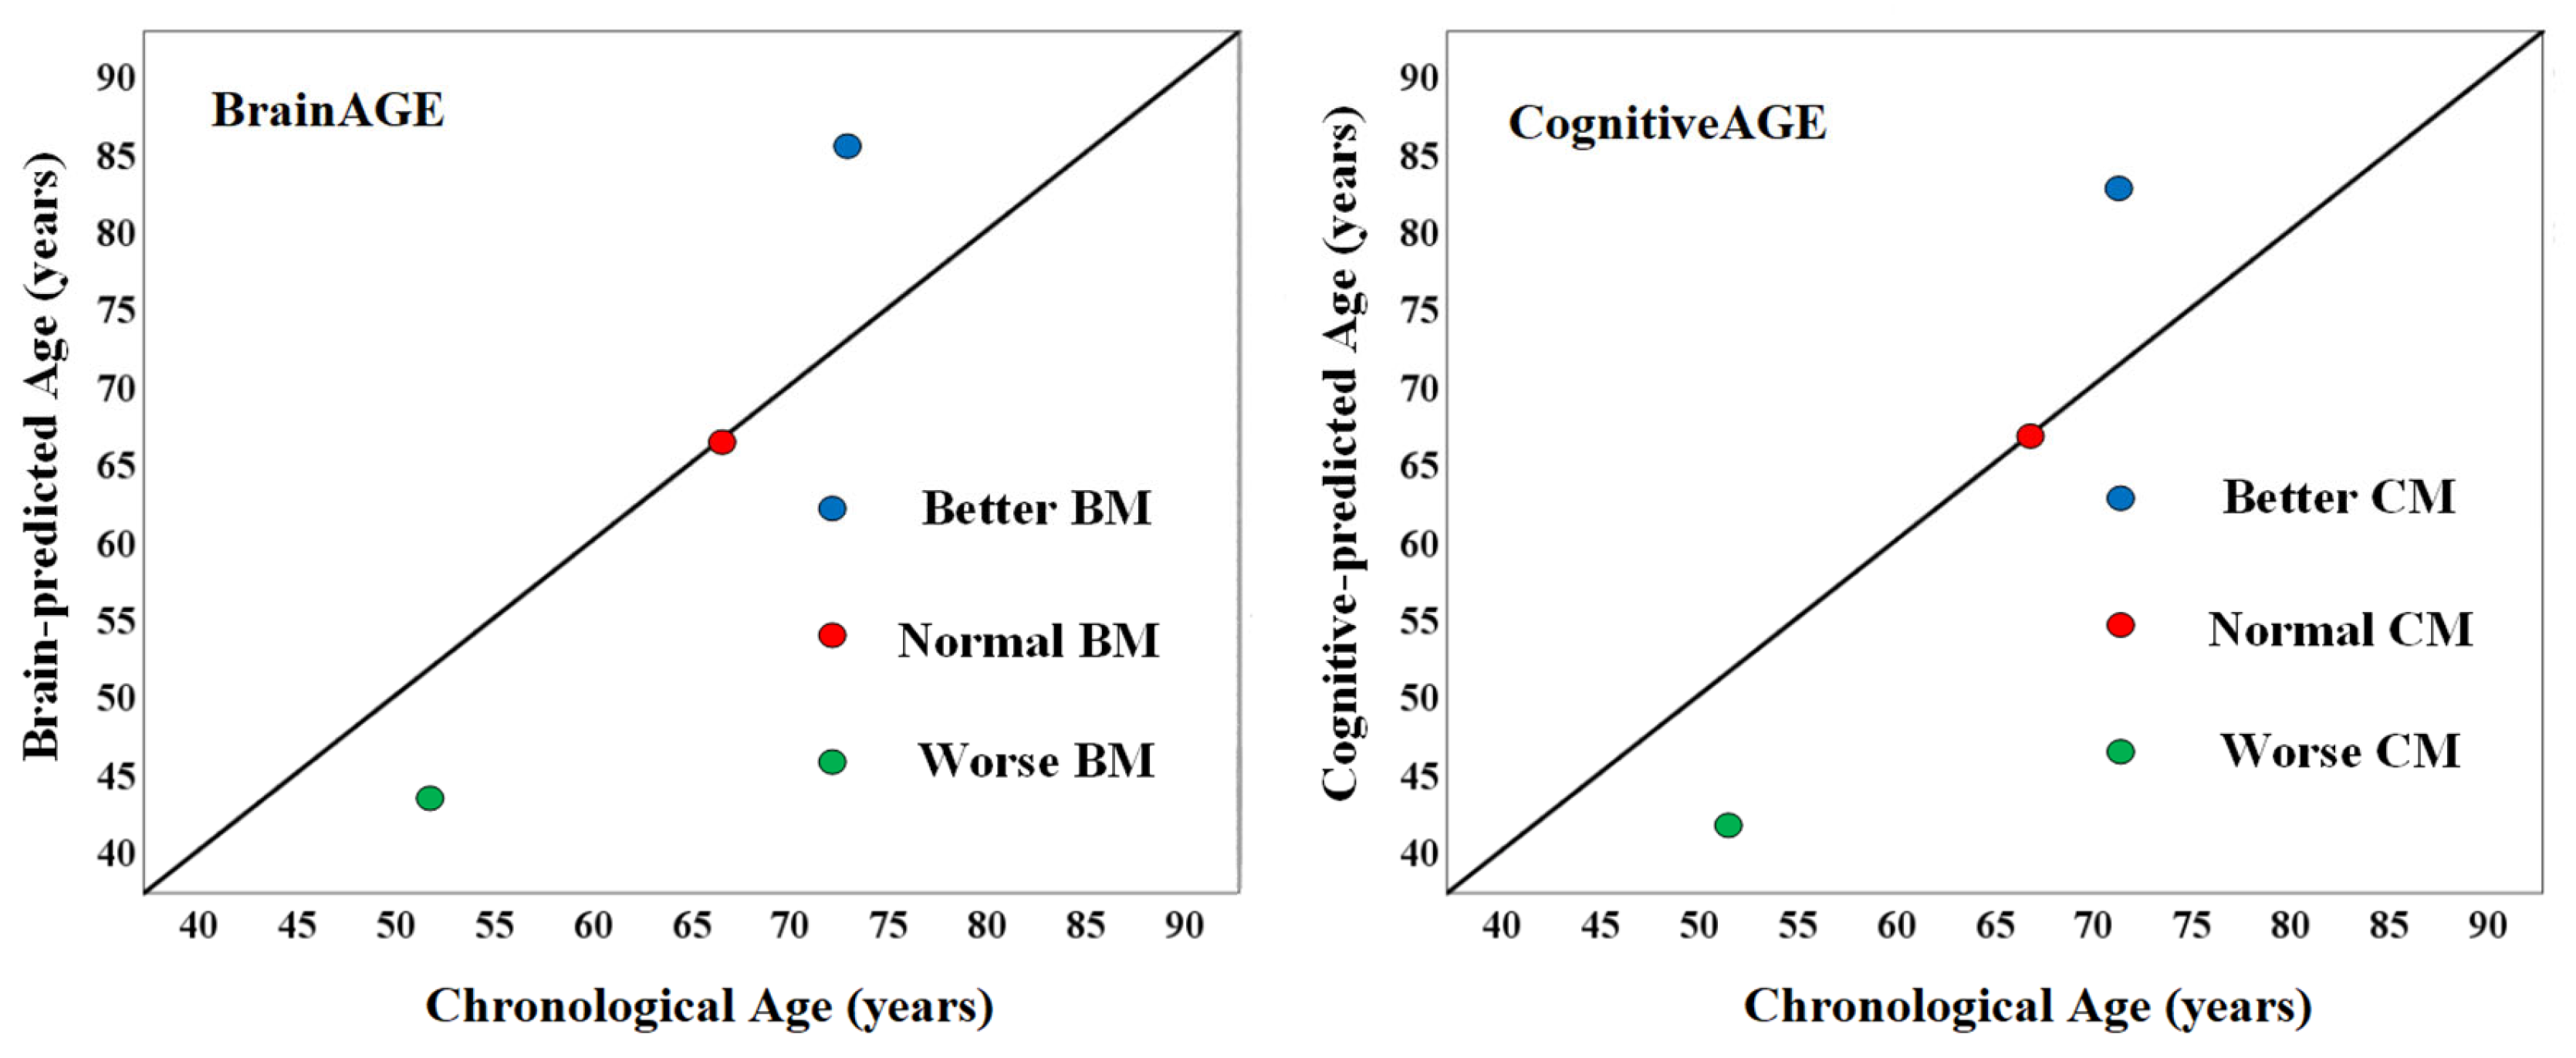
As the field of aging neuroscience continues to advance, researchers have developed novel methods for assessing brain and cognitive health (Figure 3). One such measure is the brain age gap estimation (BrainAGE) score. This score is calculated by quantifying the difference between an individual’s chronological age and their anticipated brain age utilizing structural brain imaging data, which calculates the difference between an individual’s chronological age and their predicted brain age based on structural brain imaging data in accordance with Equation (1). It has been demonstrated that BrainAGE scores possess a strong correlation with BM, whereby positive scores reflect an accelerated aging process of the brain and, subsequently, worse BM. Conversely, negative BrainAGE scores depict good BM. Similarly, the cognitive age gap estimation (CognitiveAGE) score, as outlined in Equation (2), exhibits a similar association with cognitive aging, otherwise known as CM. Subsequently, positive CognitiveAGE scores reflect accelerated cognitive decline and worse CM, while negative scores indicate better CM.
BrainAGE   =   Predicted   brain   age     chronological   age
CognitiveAGE   =   Predicted   cognitive   age     chronological   age

2.8. Bias Correction in Age Prediction

The phenomenon of ‘regression toward the mean’ [40] poses a critical challenge for predictive models designed to estimate age using regression analysis. Such a phenomenon has the potential to introduce a bias in predicted age, where overestimation may occur for younger subjects and underestimation may occur for older subjects, as compared to their respective chronological age. Prior research [41,42,43] has demonstrated a negative correlation between the difference in predicted brain age and chronological age. In light of these findings, a corrected predicted age was computed using Equation (3) to effectively account for the age-dependent bias resulting from the phenomenon of regression toward the mean.
Predicted   age corrected = Predicted   age raw β α × Chronological   age
where Predicted   age raw represents the predicted brain age, and α and β stand for the slope and intercept of the regression line.

2.9. Statistical Analysis

To investigate potential associations between non-IDPs and BM and CM, a statistical analysis was conducted utilizing SPSS 26 software (SPSS, 1989; Apache Software Foundation, Chicago, IL, USA). Specifically, Spearman correlations were executed between BrainAGE, CognitiveAGE, and a total of 16 non-IDPs. The non-IDPs examined in this study are factors that are not intrinsically linked to chronological age, but are believed to exert an influence on age-related changes in the brain and cognition. BrainAGE and CognitiveAGE serve as proxies for BM and CM, respectively. BrainAGE is estimated using MRI data, while CognitiveAGE is derived from cognitive test scores. To effectively mitigate the potential issue of multiple comparisons, we applied the false discovery rate (FDR) correction method. Such a correction was implemented with a significance threshold of q < 0.01. By adopting this method, we aimed to reduce the likelihood of erroneously reporting significant associations, thus enhancing the reliability and validity of our results.

3. Results

3.1. Brain Age and Cognitive Age Prediction

Lasso [19] regression analysis was utilized in this study to prognosticate brain age, utilizing a combination of multi-modality brain imaging features in addition to predicting cognitive age as determined via nine cognitive tests. Table 6 summarizes the efficacy of seven unique feature sets extracted from six modalities. The data indicated that Freesurfer-based features from T1 generated the highest degree of performance, followed by DWI features and FSL-based features from T1. In contrast, SWI features exhibited the lowest level of prediction performance. Furthermore, it is essential to note that multi-modality models surpassed uni-modal models in terms of prediction accuracy. The Lasso model demonstrated the ability to predict brain age with an MAE of 2.767, utilizing six imaging modalities. Subsequent to age bias correction, a noteworthy reduction in the MAE was observed, with a value of 2.428 years in contrast to the value before correction. The R2 value is also worth mentioning, as a marked increase from 77.5% to 84.2% was observed following the correction. Similarly, for cognitive age prognostication, the Lasso model initially produced a MAE of 5.113 years by integrating cognitive tests from nine unique assessments. However, after adjusting for age bias, the MAE decreased to 2.536 years, underscoring a noteworthy improvement in model performance. Furthermore, the model’s R2 value also witnessed significant growth, expanding from 26.9% to 83.6% following the correction, highlighting a substantive enhancement in predictive ability.
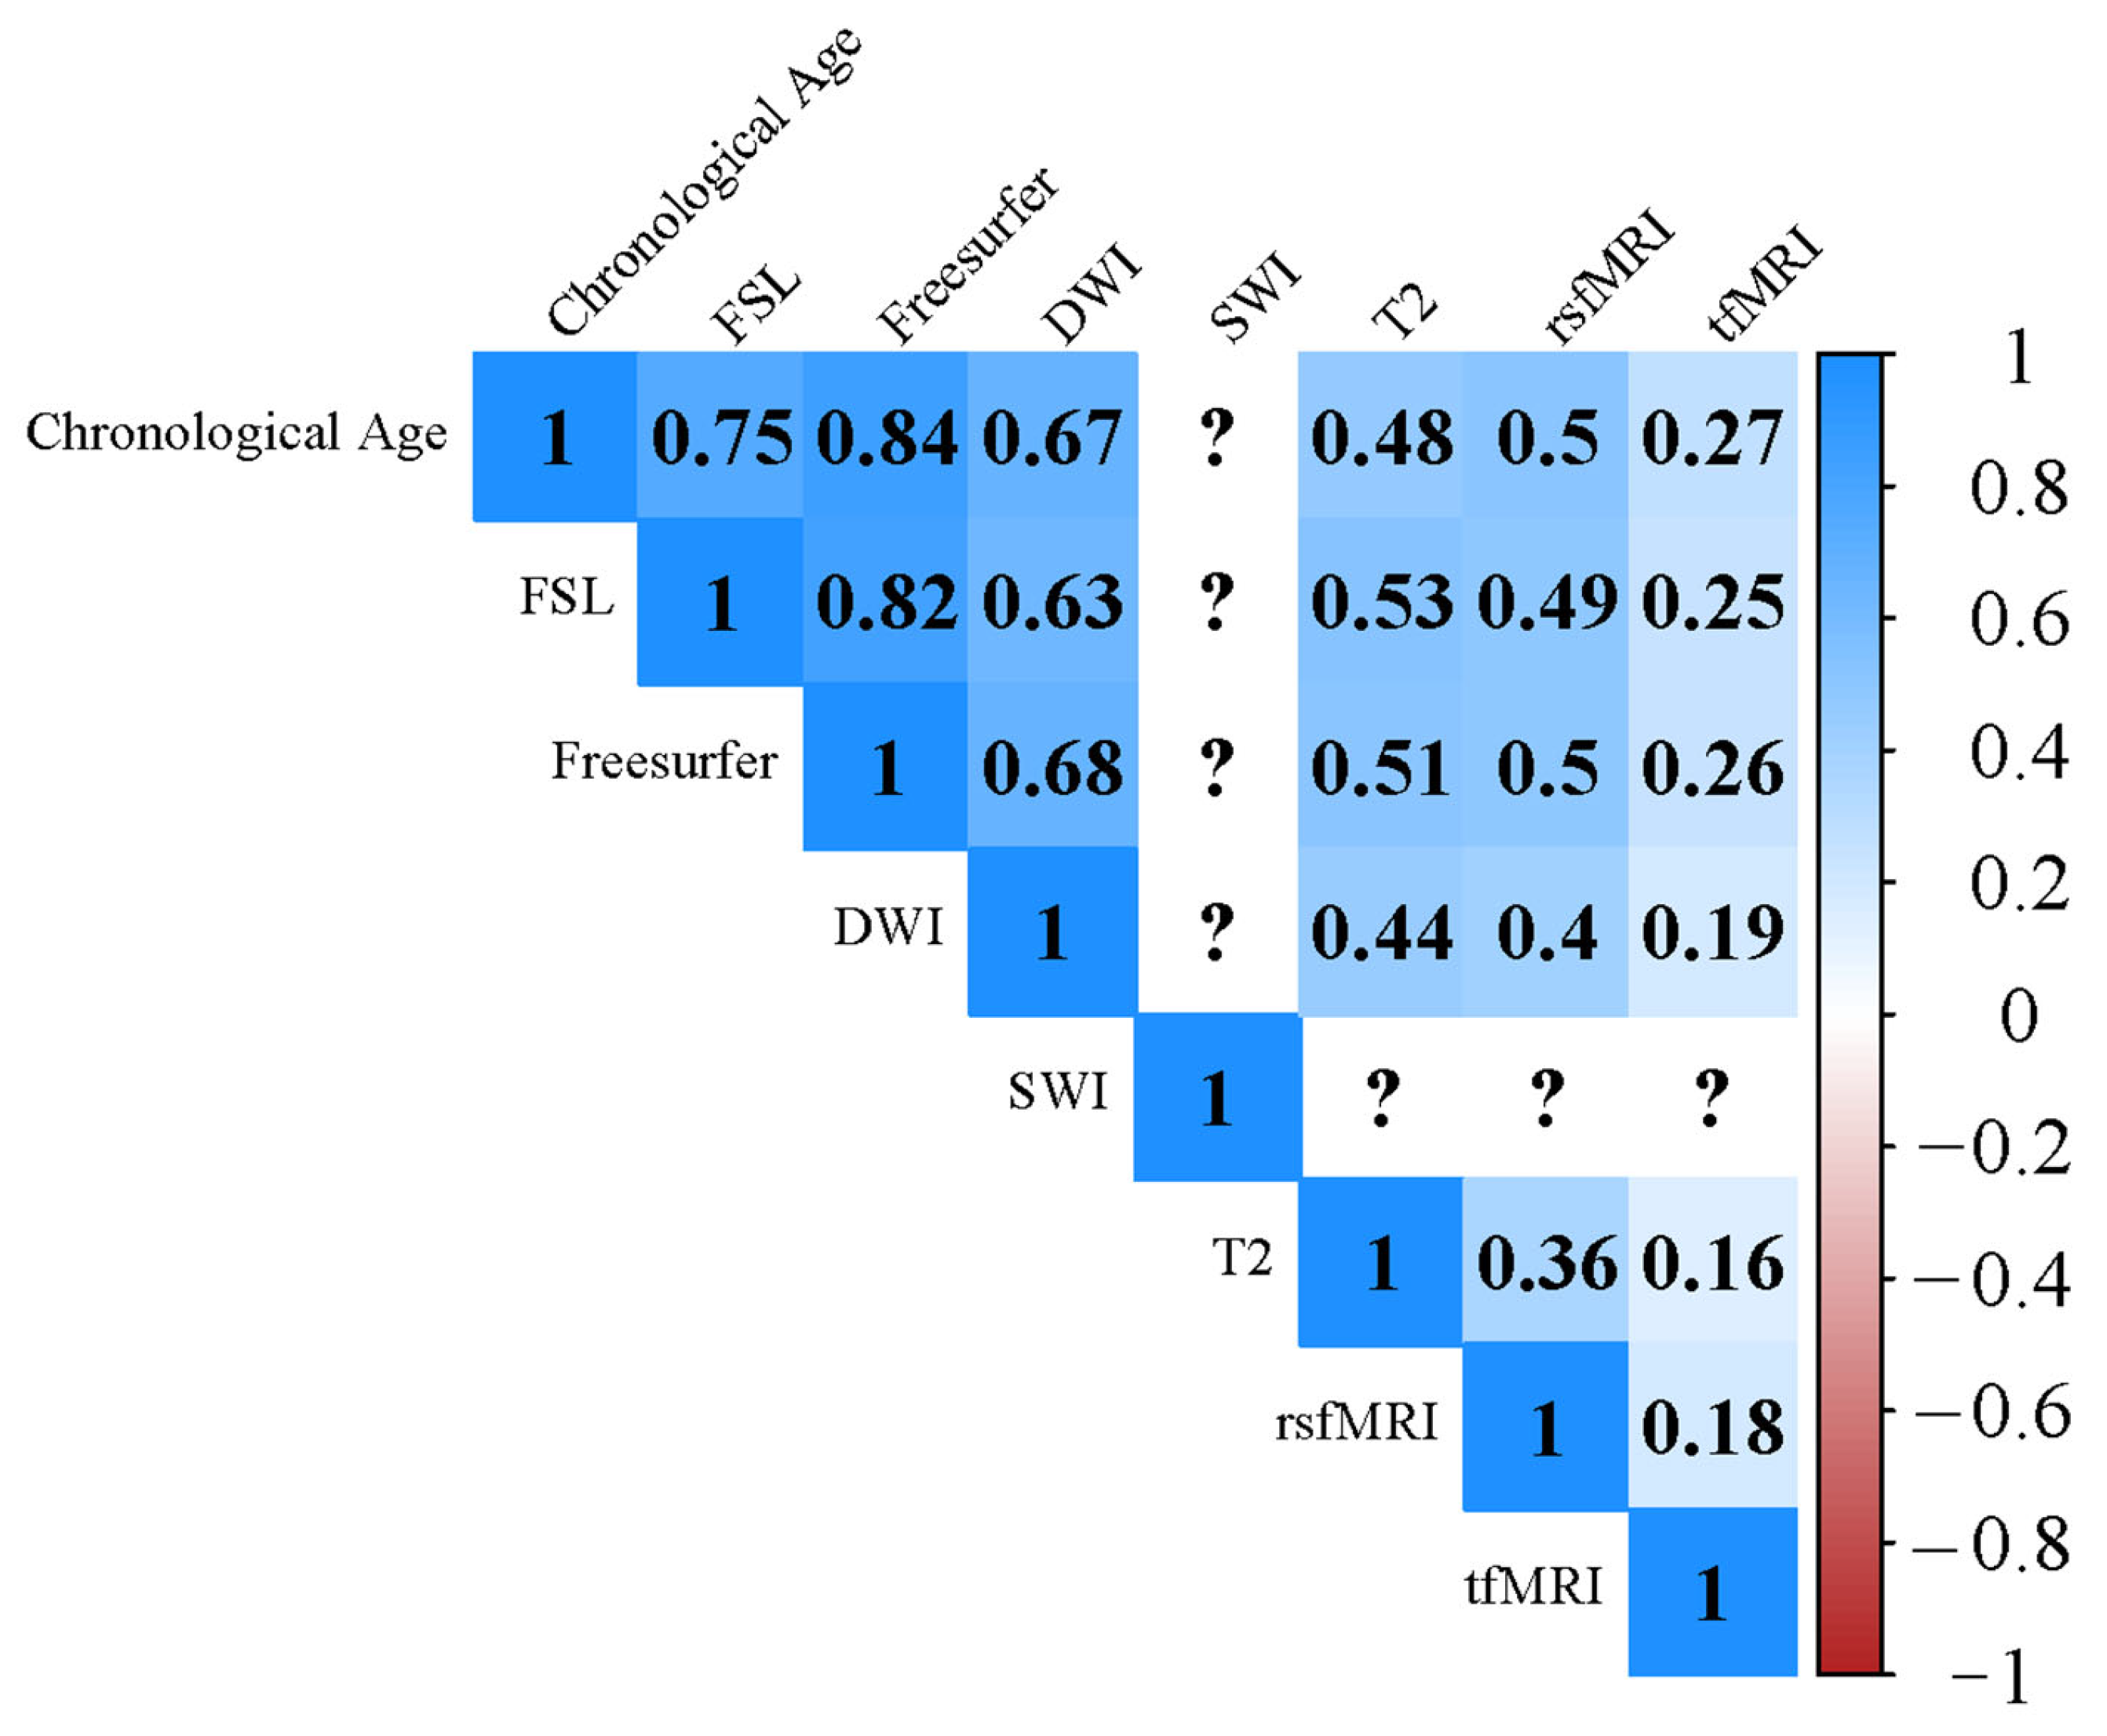
Figure 4 presents a correlation matrix, elucidating the correlation between chronological age and estimated brain age derived from six distinct imaging modalities. The outcome of the evaluation indicated that the highest correlation with chronological age was attained via the utilization of Freesurfer-based features from T1, coupled with a relatively low mean absolute error (MAE). Additionally, the DWI- and FSL-based features from T1 demonstrated a moderately positive correlation with chronological age. Contrarily, the analysis of estimated brain age derived from T2, rsfMRI, and tfMRI revealed a weak or moderately positive correlation with chronological age. It is noteworthy that certain estimated brain age predictions displayed minimal variance, resulting in an infinite correlation coefficient between chronological age and estimated brain age, designated by a “?” in the correlation matrix.
The outcome of the brain age bias correction is exhibited in Figure 5. Post bias correction, the regression line, denoted in red, exhibited increased alignment with the gray line. This result is indicative of the successful correction of age-related bias.

3.2. Relationship between BM, CM and Non-IDPs

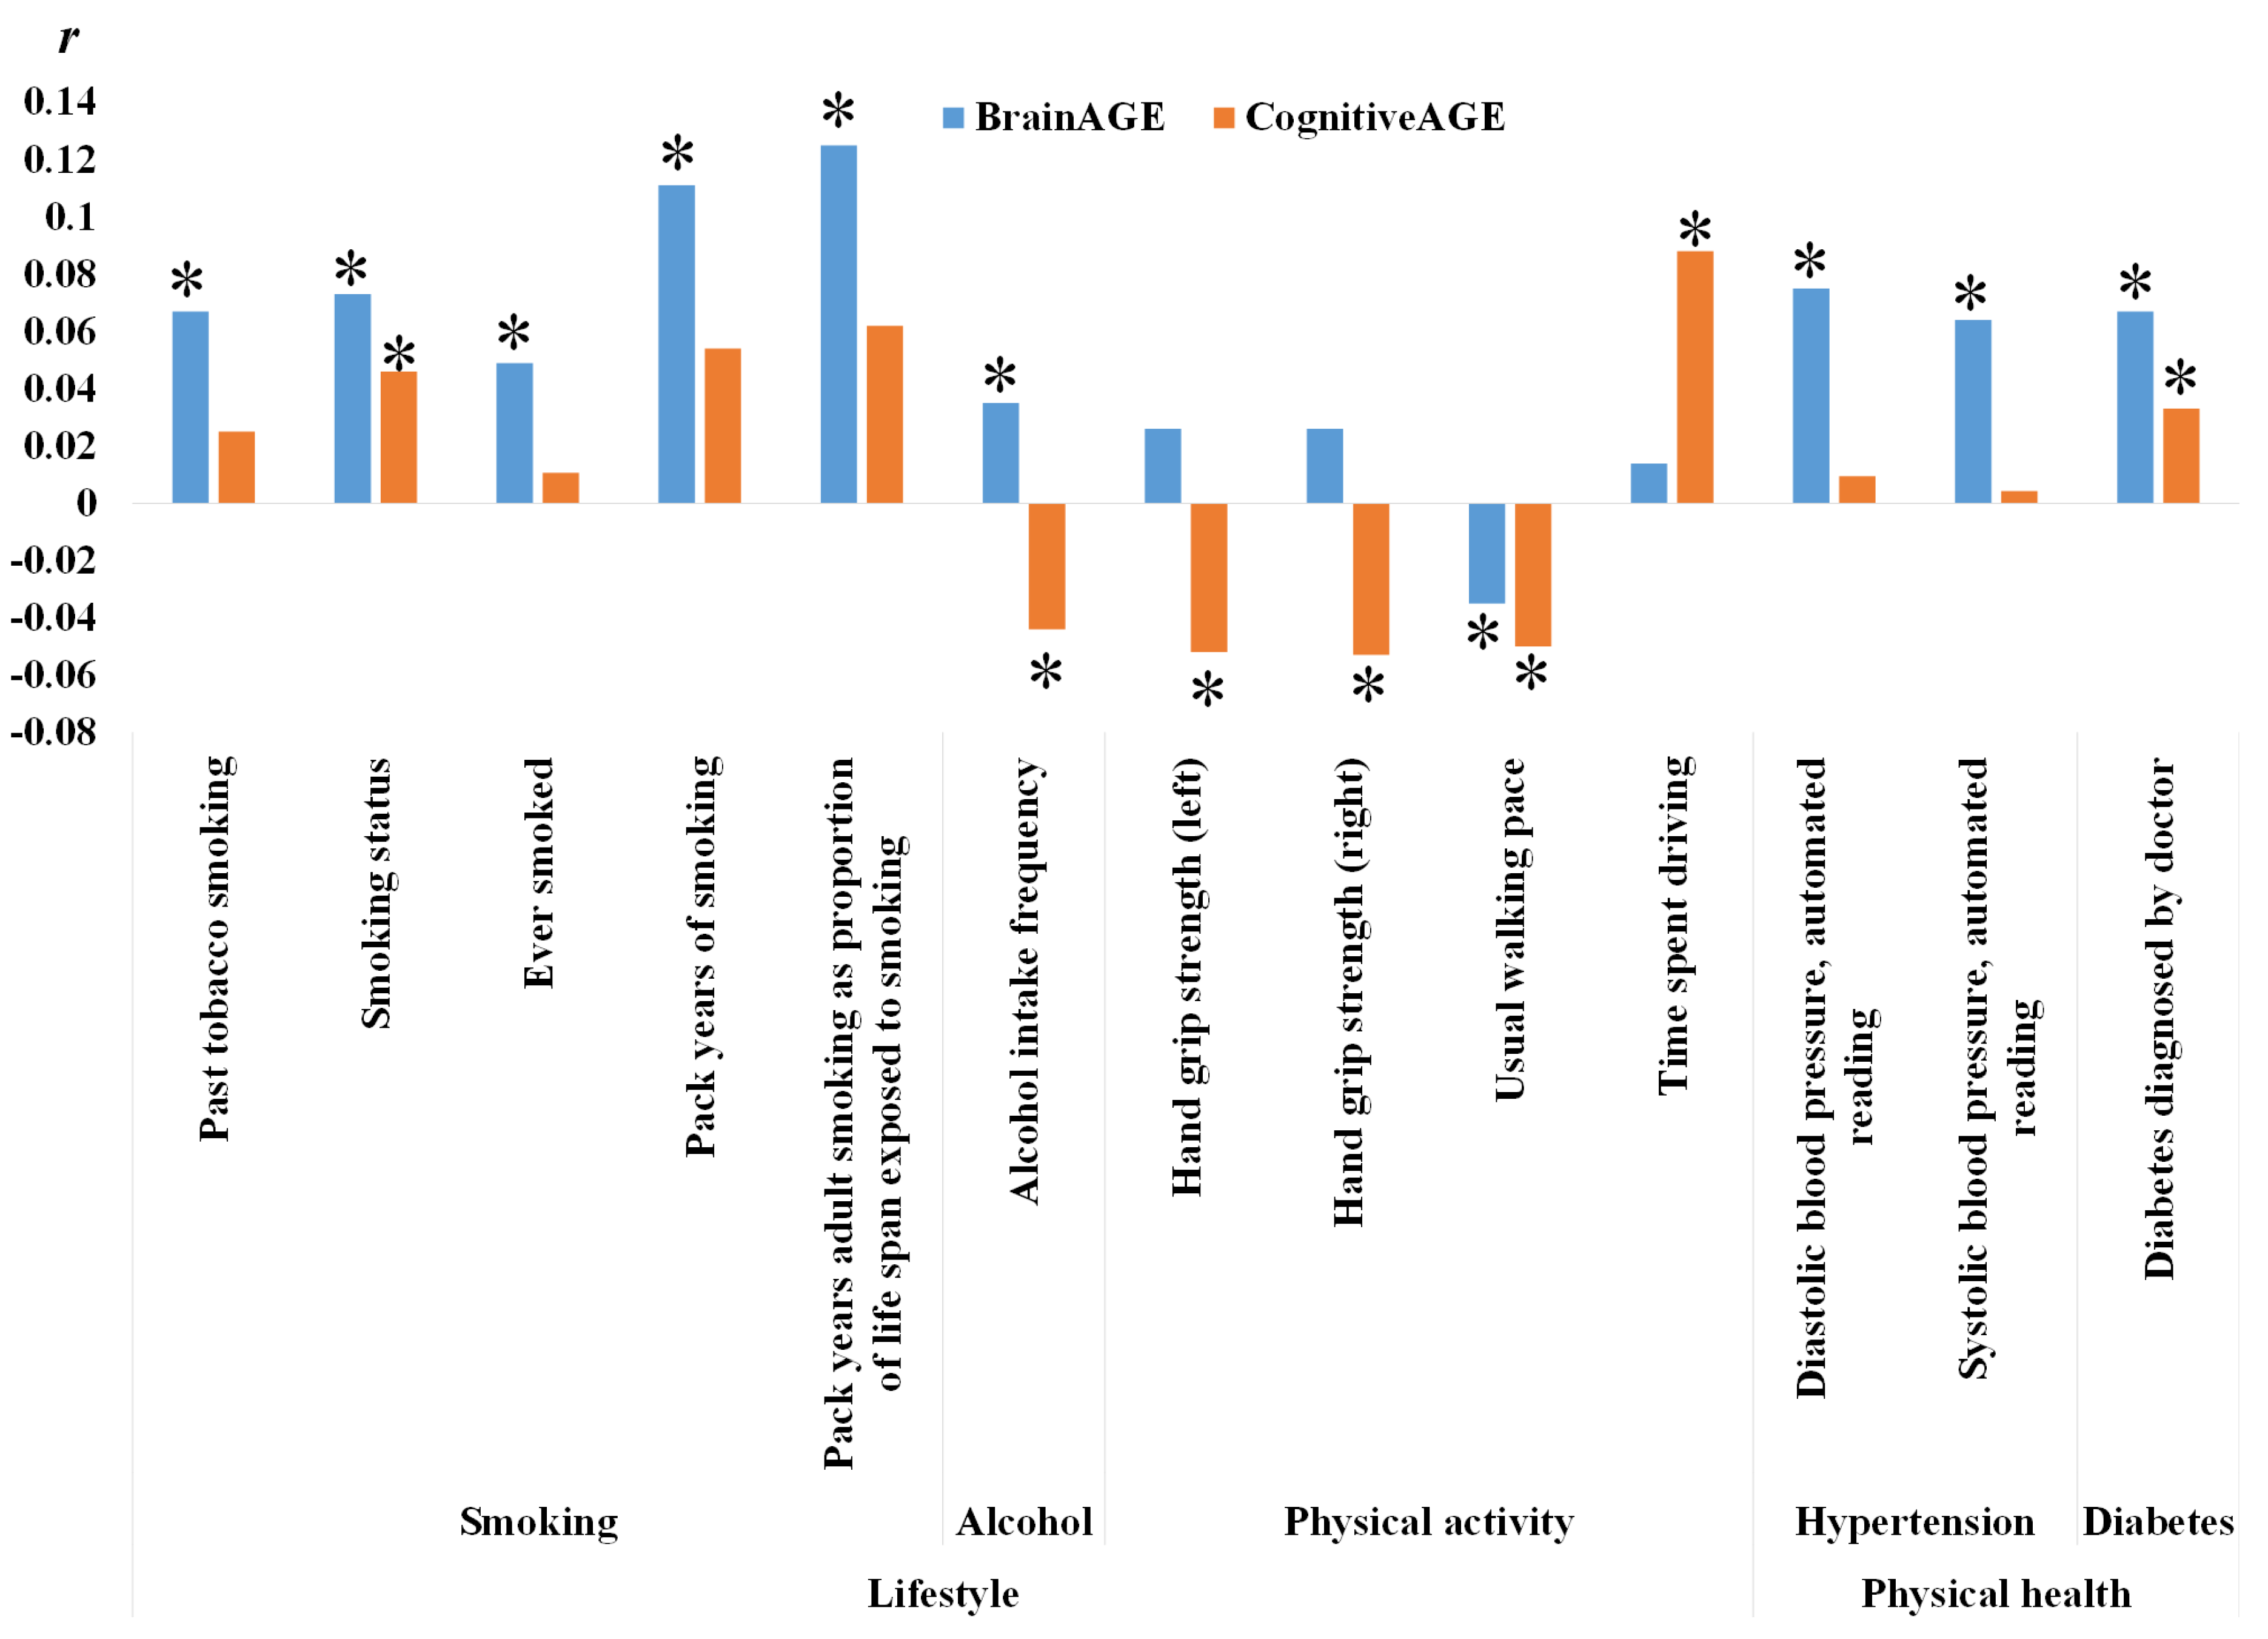
To further study the explanatory power of BrainAGE and CognitiveAGE, a Spearman correlation analysis of BrainAGE, CognitiveAGE, and non-IDPs was conducted. We performed FDR correction on the p-values of these 16 non-IDPs. In all non-IDPs affecting BrainAGE or CognitiveAGE, as long as their adjusted q < 0.01, they were retained for comparison. The correlation r between non-IDPs and BrainAGE or CognitiveAGE is shown in Figure 6. A total of 13 non-IDPs are retained, where * represents q < 0.01.
In Figure 6, a clear relationship between non-IDPs and BrainAGE and CognitiveAGE is illustrated. It was found that among the different lifestyles analyzed in this study, smoking had a more substantial effect on BrainAGE than CognitiveAGE, with a positive correlation coefficient. Furthermore, it was observed that the frequency of alcohol consumption had a significantly negative correlation with CognitiveAGE but a significantly positive correlation with BrainAGE. In terms of physical activity, left-handed grip strength and right-handed grip strength had a significant negative correlation with CognitiveAGE, whereas walking speed was significantly negatively correlated with both BrainAGE and CognitiveAGE. Additionally, it was found that time spent driving had a significant effect on CognitiveAGE and was positively correlated. Finally, in the physical health domain, diabetes and systolic and diastolic blood pressure were shown to be positively correlated with BrainAGE, while diastolic and systolic blood pressure had no significant effect on CognitiveAGE.

3.3. Associations with CR Proxies

In order to further analyze the differences between BrainAGE and CognitiveAGE in the explanatory ability of CR proxies, Spearman correlation analysis was conducted in this chapter. The findings are presented in Table 7.
Among the four CR proxies, BrainAGE is only significantly negatively correlated with educational attainment and leisure activities, while CognitiveAGE is significantly negatively correlated with all three CR indicators except for social activities. The observed inverse correlations suggest that individuals with higher CR possess brains that are biologically younger, exhibit superior cognitive abilities, and exhibit greater BM and CM. Moreover, the significant positive correlation between BrainAGE and CognitiveAGE (r = 0.088, p < 0.001) lends support to the notion that both constructs likely share a common underlying variance, plausibly associated with shared genetic and environmental factors impacting concurrent brain aging and cognitive decline.

4. Discussion

4.1. Residual Approach

The residual approach is particularly compelling because of its close alignment with the concept of maintenance. If a cross-sectional study shows successful maintenance, it could indicate that the brain or cognitive characteristics of the study participants are superior to those of their peers. An instance of utilizing this methodology is the calculation of the BrainAGE metric, which quantifies the deviation between the predicted brain age and the individual’s chronological age. In instances where there is a discordance between anticipated and chronological ages, the magnitude of the difference can be utilized to facilitate the consideration of variability in BM. Nevertheless, it is crucial to acknowledge that the utilization of the residual approach largely hinges on the tenet that the utilized model comprehensively captures the interconnection between brain aging and chronological age. Therefore, if the model does not fit well with chronological age, the residuals may not provide a reliable measure of BM, and any conclusions or inferences drawn from residual analysis could be erroneous.
Anatürk et al. [17] utilized XGBoost to develop brain age and cognitive age models in their study for quantifying BM and CM. However, the R2 values of these models were relatively low, at 0.38 and 0.09 for the brain age and cognitive age models, respectively. These low R2 values may limit the accuracy of the residuals as a measure of maintenance, and adjustments to the model and experimental design may be required to improve their accuracy and reliability in predicting aging. To this end, several strategies were employed in our study to enhance model performance. One approach involved increasing the number of feature dimensions, which allows for the capture of more complex relationships in the data. By contrast, Anatürk’s study used only two image modalities and 1363 image features, while our study used six image modalities and 2218 image features. The experimental findings demonstrated that multi-modal prediction and an increased number of feature dimensions provide superior results. Lasso was the model used in our study. This approach is particularly useful when dealing with large numbers of features, as it allows for the identification of the most relevant ones. Additionally, Lasso’s regularization parameter can be adjusted to regulate the degree of shrinkage and prevent overfitting, making it a valuable tool in large data settings. Another important factor in model performance is the amount of data used during training. In our study, we enlarged the dataset to encompass 17,030 participants. Using the Lasso model, we obtained an accuracy of 84.2% and 83.6% for brain and cognitive age prediction, respectively, which demonstrates the efficacy of this approach in improving the goodness-of-fit of age prediction models.

4.2. Favorable Lifestyles and Better Healthy Status Are Linked to Higher Maintenance

The relationship between favorable lifestyles, better health status, and the pathways of aging and maintenance has been a focal point of research attention. In our analysis, we identified an association between a more favorable lifestyle, a better health status, and the maintenance of brain and cognitive function in mid- to late adulthood.

4.2.1. Smoking

The neurological impact of smoking and its consequential negative influence on cognitive function have been the subject of extensive investigation and are now well-established [44]. Studies have consistently indicated that smoking correlates with a decline in cognitive abilities such as those related to attention, memory, and executive function [45,46]. Moreover, smoking can lead to structural changes in the brain, such as reduced gray matter volume and decreased thickness in regions linked to cognitive processing [47]. These harmful effects of smoking can be attributed to the detrimental effects of the toxic constituents present in tobacco smoke, which include nicotine and carbon monoxide. These compounds can damage the brain and restrict cognitive processing [48].
We identified five non-IDPs related to smoking, which can be categorized into two groups: smoking behavior (past smoking frequency, smoking status, and ever smoking) and smoking intensity (pack-years of smoking, pack-years of smoking in adults as a proportion of exposure to smoking environment duration). Our findings suggest that all five smoking-related indicators were positively correlated with BrainAGE, and one of them was positively correlated with CognitiveAGE. Notably, smoking appeared to have a greater negative impact on BM than CM. Furthermore, smoking intensity had a stronger association with BrainAGE and CognitiveAGE than smoking behavior. Specifically, smoking at any point in life was only positively correlated with BrainAGE, not with CognitiveAGE. Among these indicators, pack-years of adult smoking as a proportion of life span exposed to smoking showed the strongest correlation with BrainAGE, suggesting that the quantity and duration of smoking have a significant impact on brain health. These observations are consistent with earlier research studies [49,50,51], which have established a robust connection between cigarette smoking and reduced volumes of gray and white matter in the brain as well as cognitive impairments in both light and heavy smokers relative to non-smokers. Furthermore, heavy smokers show more significant brain atrophy and cognitive impairments than light smokers.

4.2.2. Alcohol Consumption

Mounting neuroimaging evidence has linked alcohol consumption, particularly chronic and heavy use, to morphological transformations of the brain and cognitive impairment [52,53]. However, moderate drinking may have potential cognitive benefits, with the amount and frequency of consumption being important factors to consider [54]. Our research findings indicate that alcohol consumption frequency has a negative impact on BM, which is in line with previous research [55,56]. Nonetheless, we also discovered that alcohol consumption frequency has a positive impact on CM. According to studies [57,58], moderate alcohol consumption may have a positive association with cognitive performance. Analysis conducted by Piumatti and colleagues [59] utilizing UKB data yielded evidence indicating a non-linear relationship between cognitive function and alcohol intake. As alcohol consumption increases, cognitive ability initially improves and then declines. However, the slope of the cognitive ability improvement is much steeper than that of the decline. Therefore, a linear line of best fit would suggest that cognitive ability improves with an increase in alcohol consumption. While the improvement in CM resulting from an increase in alcohol consumption frequency to a certain extent may be due to a linear correlation, overall, moderate drinking can enhance CM, while excessive drinking can harm it. Nevertheless, this harm can be partially counteracted by the improvement in CM resulting from drinking. Some of the plausible explanations for the potential benefits of moderate alcohol consumption for CM could be the reduction in inflammation levels that alcohol can facilitate [60,61], enhanced cardiovascular health [62], maintenance of healthy blood vessels, and increased social engagement [63].

4.2.3. Physical Activities

Participating in physical activities and sports can have numerous benefits for brain health and cognitive function, making them an essential component of a healthy lifestyle [64]. The four metrics used to measure different aspects of physical activity include grip strength for both hands, walking speed, and driving time. Grip strength is a marker of muscular strength and can be enhanced through resistance exercises. Walking speed is a measure of cardiovascular fitness and endurance, which can be improved through aerobic exercises [65]. Conversely, driving time can indicate a sedentary lifestyle, which has been linked to negative impacts on CM. The results of the study demonstrate that physical activity promotes CM, while a sedentary lifestyle has a detrimental impact on it. Although the impact of physical activity on BM is relatively small, faster walking speeds have been shown to lead to better BM. Nonetheless, this should not be interpreted to mean that physical activity is unimportant for brain health. Indeed, research has shown that exercise may lead to the enlargement of the hippocampus, a significant brain region responsible for memory and learning, as well as improved connectivity between different brain regions [66,67]. The impact of exercise on the brain is not diffuse but may be more concentrated in certain brain regions related to exercise. On the other hand, BrainAGE serves as a global indicator used to assess broad structural and functional shifts in the brain. It should, however, be noted that BrainAGE may not be attuned to detecting local changes.

4.2.4. Healthy Status

Diabetes and hypertension are both serious health concerns that can significantly impact a person’s quality of life [68]. Diabetes, in particular, is characterized by high blood glucose levels, which can lead to damage to blood vessels and nerves throughout the body, including the brain [69]. In contrast, hypertension, a medical condition characterized by high blood pressure, can lead to a reduction of blood flow to the brain and harm to blood vessels [70]. Numerous studies [42,71,72,73] have indicated that cognitive impairment and brain aging are closely associated with both diabetes and hypertension. These medical conditions have been linked not only to the onset of Alzheimer’s disease and other forms of dementia, but also to a general decline in cognitive function. Moreover, research suggests that the longer a person has diabetes or hypertension, the greater their risk of developing cognitive impairment.
Our study builds on this existing research by showing that both diabetes and hypertension are associated with higher BrainAGE and worse BM compared to healthy individuals. Interestingly, we found that only diabetes was associated with worse CM. This suggests that diabetes may have a negative impact on maintaining cognitive performance over time. This finding has important implications for the prevention and management of diabetes, as it highlights the need for targeted interventions to address this aspect of cognitive function in people with diabetes.

4.3. The Relationship between BM, CM and CR

This study delved deeper into the complex interplay between BM, CM, and CR. The findings revealed that both BM and CM were associated with proxy indicators of CR. This study showed that individuals with lower levels of education and fewer leisure activities were more likely to have weaker BM, which could lead to a decline in cognitive function. Similarly, individuals with weaker CR may experience cognitive decline due to reduced CM, particularly if they have lower levels of education, fewer leisure activities, and lower early fluid intelligence. Interestingly, this study found a particularly strong correlation between early fluid intelligence and CM, with an r-value of 21.4%. Fluid intelligence refers to one’s inherent capacity to solve unfamiliar problems and has been revealed to have a strong correlation with education [74]. Individuals with high levels of fluid intelligence tend to excel in their academic and professional pursuits [75,76]. This underscores the critical role that early fluid intelligence plays in maintaining cognitive function in later life. Moreover, this study revealed a stronger association between CM and CR compared to BM and CR. In this regard, CM can be considered a type of cognitive maintenance or optimization, akin to software optimization in computer systems. In contrast, BM pertains to the hardware maintenance of the brain, which involves the physical structures and processes that support cognitive function. Both CM and CR are interrelated with the optimization of cognitive networks, and these two mechanisms are closely intertwined; thus, they are more tightly connected to each other. Additionally, both BM and CM are influenced by lifestyle choices, although the ways in which they are affected may differ in mechanisms and degree. Therefore, there is a correlation between them, but it is not particularly strong. This study’s results reflect the distinct yet interconnected roles of CM and BM in shaping cognitive function.

4.4. Limitations

This study is subject to a few limitations that must be taken into account. Firstly, all the participants who took part in the research originated from the United Kingdom, primarily of White ethnicity. Therefore, the generalizability of the findings to other countries or ethnicities remains uncertain and requires further validation. Secondly, the study only considered a limited set of lifestyle factors, including smoking, alcohol consumption, and physical activity. Future research could expand the scope of the investigation to include other important lifestyle habits, such as diet and sleep. Similarly, the study only focused on a small subset of health factors, such as diabetes and hypertension. Future studies could incorporate additional health indicators, such as cardiovascular disease and hyperlipidemia. Thirdly, while BM and CM are global measures, more specific and sensitive measures, such as hippocampal volume and episodic memory, may better capture the subtle differences in maintenance during the process of cognitive aging.

5. Conclusions

Our study on BM and CM in aging features a rigorous and systematic experimental paradigm with 17,030 participants and a balanced gender distribution. We incorporated six MRI modalities, a wide range of lifestyle factors and health status indicators, and employed a nested cross-validation approach to mitigate overfitting. Notably, we used Lasso as a machine learning algorithm to identify informative features associated with the brain and cognitive age. Our study aims to provide a thorough comprehension of the interplay between lifestyle factors and maintenance in aging.
Through our optimized experimental designs, we have gained a more comprehensive understanding of the complex relationships among lifestyle factors, BM and CM. Our findings align with previous research [17] in that lifestyle factors are closely associated with BM, while CM is correlated with CR. However, our study reveals several novel insights. Firstly, we discovered that lifestyle factors are also significantly associated with CM, albeit to a lesser extent than with BM. Secondly, although lifestyle factors, BM, and CM are interrelated, our study uncovered distinct underlying mechanisms. For instance, alcohol consumption negatively affects BM but positively impacts CM. Thirdly, our research demonstrates that health status is primarily linked with BM, whereas the presence of diabetes is moderately associated with CM. Fourth, our investigation revealed not only an association between CM and CR, but also a relationship between BM and CR. These findings highlight the importance of considering multiple factors that influence cognitive and brain health when developing effective intervention and prevention strategies. These novel insights have important implications for developing effective intervention and prevention strategies to promote cognitive and brain health across the lifespan.

Author Contributions

Conceptualization, L.L. and M.X.; methodology, M.X.; software, M.X.; validation, Y.J. and M.X.; formal analysis, M.X.; investigation, S.S.; resources, L.L; data curation, M.X.; writing—original draft preparation, L.L.; writing—review and editing, L.L.; visualization, W.K.; supervision, S.W.; project administration, L.L. and Z.F.; funding acquisition, L.L. All authors have read and agreed to the published version of the manuscript.

Funding

This research received financial backing in the form of grants from the National Natural Science Foundation of China (81971683) and Natural Science Foundation of Beijing Municipality (L182010).

Institutional Review Board Statement

Not applicable.

Informed Consent Statement

Not applicable.

Data Availability Statement

The imaging datasets produced by UK Biobank, which were examined during the present study, can be accessed through the UK Biobank data access process (visit http://www.ukbiobank.ac.uk/register-apply/and, accessed on 11 January 2021). The Research Access Administration Team of UK Biobank impartially manages all the data access requests submitted by academic and commercial researchers. Those that meet these criteria are promptly approved. For details regarding the data available from UK Biobank, please refer to http://www.ukbiobank.ac.uk, accessed on 11 January 2021.

Acknowledgments

We express our sincere gratitude to UK Biobank for enabling access to this valuable resource and to the UK Biobank participants for their dedication in providing the data.

Conflicts of Interest

The authors hereby declare that there are no conflict of interest to disclose.

References

  1. Harada, C.N.; Natelson Love, M.C.; Triebel, K.L. Normal Cognitive Aging. Clin. Geriatr. Med. 2013, 29, 737–752. [Google Scholar] [CrossRef] [PubMed] [Green Version]
  2. Murman, D.L. The Impact of Age on Cognition. Semin. Hear. 2015, 36, 111–121. [Google Scholar] [CrossRef] [PubMed]
  3. Stern, Y.; Barnes, C.A.; Grady, C.; Jones, R.N.; Raz, N. Brain Reserve, Cognitive Reserve, Compensation, and Maintenance: Operationalization, Validity, and Mechanisms of Cognitive Resilience. Neurobiol. Aging 2019, 83, 124–129. [Google Scholar] [CrossRef] [PubMed]
  4. Borgeest, G.S.; Henson, R.N.; Shafto, M.; Samu, D.; Kievit, R.A. Greater Lifestyle Engagement Is Associated with Better Age-Adjusted Cognitive Abilities. PLoS ONE 2020, 15, e0230077. [Google Scholar] [CrossRef]
  5. Fitzgerald, J.; Morris, D.W.; Donohoe, G. Cognitive Genomics: Recent Advances and Current Challenges. Curr. Psychiatry Rep. 2020, 22, 2. [Google Scholar] [CrossRef]
  6. Nilsson, H.; Bülow, P.H.; Kazemi, A. Mindful Sustainable Aging: Advancing a Comprehensive Approach to the Challenges and Opportunities of Old Age. Eur. J. Psychol. 2015, 11, 494. [Google Scholar] [CrossRef]
  7. Katzman, R.; Terry, R.; DeTeresa, R.; Brown, T.; Davies, P.; Fuld, P.; Renbing, X.; Peck, A. Clinical, Pathological, and Neurochemical Changes in Dementia: A Subgroup with Preserved Mental Status and Numerous Neocortical Plaques. Ann. Neurol. 1988, 23, 138–144. [Google Scholar] [CrossRef]
  8. Satz, P. Brain Reserve Capacity on Symptom Onset after Brain Injury: A Formulation and Review of Evidence for Threshold Theory. Neuropsychology 1993, 7, 273–295. [Google Scholar] [CrossRef]
  9. Stern, Y. What Is Cognitive Reserve? Theory and Research Application of the Reserve Concept. J. Int. Neuropsychol. Soc. 2002, 8, 448–460. [Google Scholar] [CrossRef]
  10. Stern, Y.; Barulli, D. Cognitive Reserve. Handb. Clin. Neurol. 2019, 167, 181–190. [Google Scholar] [CrossRef]
  11. Jia, F.; Li, Y.; Li, M.; Cao, F. Subjective Cognitive Decline, Cognitive Reserve Indicators, and the Incidence of Dementia. J. Am. Med. Dir. Assoc. 2021, 22, 1449–1455.e4. [Google Scholar] [CrossRef]
  12. Stern, Y.; Arenaza-Urquijo, E.M.; Bartrés-Faz, D.; Belleville, S.; Cantilon, M.; Chetelat, G.; Ewers, M.; Franzmeier, N.; Kempermann, G.; Kremen, W.S.; et al. Whitepaper: Defining and Investigating Cognitive Reserve, Brain Reserve, and Brain Maintenance. Alzheimers Dement. 2020, 16, 1305–1311. [Google Scholar] [CrossRef]
  13. Nyberg, L.; Lövdén, M.; Riklund, K.; Lindenberger, U.; Bäckman, L. Memory Aging and Brain Maintenance. Trends Cogn. Sci. 2012, 16, 292–305. [Google Scholar] [CrossRef] [Green Version]
  14. Kremen, W.S.; Elman, J.A.; Panizzon, M.S.; Eglit, G.M.L.; Sanderson-Cimino, M.; Williams, M.E.; Lyons, M.J.; Franz, C.E. Cognitive Reserve and Related Constructs: A Unified Framework Across Cognitive and Brain Dimensions of Aging. Front. Aging Neurosci. 2022, 14, 834765. [Google Scholar] [CrossRef]
  15. Cabeza, R.; Albert, M.; Belleville, S.; Craik, F.I.M.; Duarte, A.; Grady, C.L.; Lindenberger, U.; Nyberg, L.; Park, D.C.; Reuter-Lorenz, P.A.; et al. Maintenance, Reserve and Compensation: The Cognitive Neuroscience of Healthy Ageing. Nat. Rev. Neurosci. 2018, 19, 701–710. [Google Scholar] [CrossRef]
  16. Barulli, D.; Stern, Y. Efficiency, Capacity, Compensation, Maintenance, Plasticity: Emerging Concepts in Cognitive Reserve. Trends Cogn. Sci. 2013, 17, 502–509. [Google Scholar] [CrossRef] [Green Version]
  17. Anatürk, M.; Kaufmann, T.; Cole, J.H.; Suri, S.; Griffanti, L.; Zsoldos, E.; Filippini, N.; Singh-Manoux, A.; Kivimäki, M.; Westlye, L.T.; et al. Prediction of Brain Age and Cognitive Age: Quantifying Brain and Cognitive Maintenance in Aging. Hum. Brain Mapp. 2021, 42, 1626–1640. [Google Scholar] [CrossRef]
  18. Xu, X.; Lin, L.; Sun, S.; Wu, S. A Review of the Application of Three-Dimensional Convolutional Neural Networks for the Diagnosis of Alzheimer’s Disease Using Neuroimaging. Rev. Neurosci. 2023. [Google Scholar] [CrossRef]
  19. Tibshirani, R. Regression Shrinkage and Selection Via the Lasso. J. R. Stat. Soc. Ser. B (Methodol.) 1996, 58, 267–288. [Google Scholar] [CrossRef]
  20. Sudlow, C.; Gallacher, J.; Allen, N.; Beral, V.; Burton, P.; Danesh, J.; Downey, P.; Elliott, P.; Green, J.; Landray, M.; et al. UK Biobank: An Open Access Resource for Identifying the Causes of a Wide Range of Complex Diseases of Middle and Old Age. PLoS Med. 2015, 12, e1001779. [Google Scholar] [CrossRef] [Green Version]
  21. Trehearne, A. Genetics, Lifestyle and Environment. UK Biobank Is an Open Access Resource Following the Lives of 500,000 Participants to Improve the Health of Future Generations. Bundesgesundh. Gesundh. Gesundh. 2016, 59, 361–367. [Google Scholar] [CrossRef] [PubMed]
  22. Miller, K.L.; Alfaro-Almagro, F.; Bangerter, N.K.; Thomas, D.L.; Yacoub, E.; Xu, J.; Bartsch, A.J.; Jbabdi, S.; Sotiropoulos, S.N.; Andersson, J.L.R.; et al. Multimodal Population Brain Imaging in the UK Biobank Prospective Epidemiological Study. Nat. Neurosci. 2016, 19, 1523–1536. [Google Scholar] [CrossRef] [PubMed] [Green Version]
  23. Elliott, L.T.; Sharp, K.; Alfaro-Almagro, F.; Shi, S.; Miller, K.L.; Douaud, G.; Marchini, J.; Smith, S.M. Genome-Wide Association Studies of Brain Imaging Phenotypes in UK Biobank. Nature 2018, 562, 210–216. [Google Scholar] [CrossRef] [PubMed] [Green Version]
  24. Fawns-Ritchie, C.; Deary, I.J. Reliability and Validity of the UK Biobank Cognitive Tests. PLoS ONE 2020, 15, e0231627. [Google Scholar] [CrossRef]
  25. Meng, X.; D’Arcy, C. Education and Dementia in the Context of the Cognitive Reserve Hypothesis: A Systematic Review with Meta-Analyses and Qualitative Analyses. PLoS ONE 2012, 7, e38268. [Google Scholar] [CrossRef]
  26. Sun, X.; Nancekivell, S.; Gelman, S.A.; Shah, P. Perceptions of the Malleability of Fluid and Crystallized Intelligence. J. Exp. Psychol. Gen. 2021, 150, 815–827. [Google Scholar] [CrossRef]
  27. Park, S.; Choi, B.; Choi, C.; Kang, J.M.; Lee, J.-Y. Relationship between Education, Leisure Activities, and Cognitive Functions in Older Adults. Aging Ment. Health 2019, 23, 1651–1660. [Google Scholar] [CrossRef]
  28. Ihle, A.; Ghisletta, P.; Ballhausen, N.; Fagot, D.; Vallet, F.; Baeriswyl, M.; Sauter, J.; Oris, M.; Maurer, J.; Kliegel, M. The Role of Cognitive Reserve Accumulated in Midlife for the Relation between Chronic Diseases and Cognitive Decline in Old Age: A Longitudinal Follow-up across Six Years. Neuropsychologia 2018, 121, 37–46. [Google Scholar] [CrossRef]
  29. Baecker, L.; Garcia-Dias, R.; Vieira, S.; Scarpazza, C.; Mechelli, A. Machine Learning for Brain Age Prediction: Introduction to Methods and Clinical Applications. EBioMedicine 2021, 72, 103600. [Google Scholar] [CrossRef]
  30. Baecker, L.; Dafflon, J.; da Costa, P.F.; Garcia-Dias, R.; Vieira, S.; Scarpazza, C.; Calhoun, V.D.; Sato, J.R.; Mechelli, A.; Pinaya, W.H.L. Brain Age Prediction: A Comparison between Machine Learning Models Using Region- and Voxel-Based Morphometric Data. Hum. Brain Mapp. 2021, 42, 2332–2346. [Google Scholar] [CrossRef]
  31. More, S.; Antonopoulos, G.; Hoffstaedter, F.; Caspers, J.; Eickhoff, S.B.; Patil, K.R. Brain-Age Prediction: A Systematic Comparison of Machine Learning Workflows. NeuroImage 2023, 270, 119947. [Google Scholar] [CrossRef]
  32. Lombardi, A.; Diacono, D.; Amoroso, N.; Monaco, A.; Tavares, J.M.R.S.; Bellotti, R.; Tangaro, S. Explainable Deep Learning for Personalized Age Prediction With Brain Morphology. Front. Neurosci. 2021, 15, 674055. [Google Scholar] [CrossRef]
  33. Tanveer, M.; Ganaie, M.A.; Beheshti, I.; Goel, T.; Ahmad, N.; Lai, K.-T.; Huang, K.; Zhang, Y.-D.; Del Ser, J.; Lin, C.-T. Deep Learning for Brain Age Estimation: A Systematic Review. Infin. Fusion 2023, 96, 130–143. [Google Scholar] [CrossRef]
  34. Subramaniapillai, S.; Suri, S.; Barth, C.; Maximov, I.I.; Voldsbekk, I.; van der Meer, D.; Gurholt, T.P.; Beck, D.; Draganski, B.; Andreassen, O.A.; et al. Sex- and Age-specific Associations between Cardiometabolic Risk and White Matter Brain Age in the UK Biobank Cohort. Hum. Brain Mapp. 2022, 43, 3759–3774. [Google Scholar] [CrossRef]
  35. Jawinski, P.; Markett, S.; Drewelies, J.; Düzel, S.; Demuth, I.; Steinhagen-Thiessen, E.; Wagner, G.G.; Gerstorf, D.; Lindenberger, U.; Gaser, C.; et al. Linking Brain Age Gap to Mental and Physical Health in the Berlin Aging Study II. Front. Aging Neurosci. 2022, 14, 791222. [Google Scholar] [CrossRef]
  36. Jonsson, B.A.; Bjornsdottir, G.; Thorgeirsson, T.E.; Ellingsen, L.M.; Walters, G.B.; Gudbjartsson, D.F.; Stefansson, H.; Stefansson, K.; Ulfarsson, M.O. Brain Age Prediction Using Deep Learning Uncovers Associated Sequence Variants. Nat. Commun. 2019, 10, 5409. [Google Scholar] [CrossRef] [Green Version]
  37. Gong, W.; Beckmann, C.F.; Vedaldi, A.; Smith, S.M.; Peng, H. Optimising a Simple Fully Convolutional Network for Accurate Brain Age Prediction in the PAC 2019 Challenge. Front. Psychiatry 2021, 12, 627996. [Google Scholar] [CrossRef]
  38. Dinsdale, N.K.; Bluemke, E.; Smith, S.M.; Arya, Z.; Vidaurre, D.; Jenkinson, M.; Namburete, A.I.L. Learning Patterns of the Ageing Brain in MRI Using Deep Convolutional Networks. NeuroImage 2021, 224, 117401. [Google Scholar] [CrossRef]
  39. Xiong, M.; Lin, L.; Jin, Y.; Kang, W.; Wu, S.; Sun, S. Comparison of Machine Learning Models for Brain Age Prediction Using Six Imaging Modalities on Middle-Aged and Older Adults. Sensors 2023, 23, 3622. [Google Scholar] [CrossRef]
  40. Galton, F. Regression Towards Mediocrity in Hereditary Stature. J. Anthropol. Inst. Great Br. Irel. 1886, 15, 246–263. [Google Scholar] [CrossRef] [Green Version]
  41. Smith, S.M.; Vidaurre, D.; Alfaro-Almagro, F.; Nichols, T.E.; Miller, K.L. Estimation of Brain Age Delta from Brain Imaging. Neuroimage 2019, 200, 528–539. [Google Scholar] [CrossRef] [PubMed]
  42. Cole, J.H. Multimodality Neuroimaging Brain-Age in UK Biobank: Relationship to Biomedical, Lifestyle, and Cognitive Factors. Neurobiol. Aging 2020, 92, 34–42. [Google Scholar] [CrossRef] [PubMed]
  43. De Lange, A.-M.G.; Cole, J.H. Commentary: Correction Procedures in Brain-Age Prediction. Neuroimage Clin. 2020, 26, 102229. [Google Scholar] [CrossRef] [PubMed]
  44. Chang, R.C.-C.; Ho, Y.-S.; Wong, S.; Gentleman, S.M.; Ng, H.-K. Neuropathology of Cigarette Smoking. Acta Neuropathol. 2014, 127, 53–69. [Google Scholar] [CrossRef] [PubMed]
  45. Sabia, S.; Elbaz, A.; Dugravot, A.; Head, J.; Shipley, M.; Hagger-Johnson, G.; Kivimaki, M.; Singh-Manoux, A. Impact of Smoking on Cognitive Decline in Early Old Age: The Whitehall II Cohort Study. Arch. Gen. Psychiatry 2012, 69, 627–635. [Google Scholar] [CrossRef] [Green Version]
  46. Campos, M.W.; Serebrisky, D.; Castaldelli-Maia, J.M. Smoking and Cognition. Curr. Drug Abuse Rev. 2016, 9, 76–79. [Google Scholar] [CrossRef]
  47. Gallinat, J.; Meisenzahl, E.; Jacobsen, L.K.; Kalus, P.; Bierbrauer, J.; Kienast, T.; Witthaus, H.; Leopold, K.; Seifert, F.; Schubert, F.; et al. Smoking and Structural Brain Deficits: A Volumetric MR Investigation. Eur. J. Neurosci. 2006, 24, 1744–1750. [Google Scholar] [CrossRef]
  48. Swan, G.E.; Lessov-Schlaggar, C.N. The Effects of Tobacco Smoke and Nicotine on Cognition and the Brain. Neuropsychol. Rev. 2007, 17, 259–273. [Google Scholar] [CrossRef]
  49. Ernst, M.; Heishman, S.J.; Spurgeon, L.; London, E.D. Smoking History and Nicotine Effects on Cognitive Performance. Neuropsychopharmacology 2001, 25, 313–319. [Google Scholar] [CrossRef]
  50. Zanchi, D.; Brody, A.L.; Montandon, M.-L.; Kopel, R.; Emmert, K.; Preti, M.G.; Van De Ville, D.; Haller, S. Cigarette Smoking Leads to Persistent and Dose-Dependent Alterations of Brain Activity and Connectivity in Anterior Insula and Anterior Cingulate. Addict. Biol. 2015, 20, 1033–1041. [Google Scholar] [CrossRef] [Green Version]
  51. Peng, P.; Li, M.; Liu, H.; Tian, Y.-R.; Chu, S.-L.; Van Halm-Lutterodt, N.; Jing, B.; Jiang, T. Brain Structure Alterations in Respect to Tobacco Consumption and Nicotine Dependence: A Comparative Voxel-Based Morphometry Study. Front. Neuroanat. 2018, 12, 43. [Google Scholar] [CrossRef]
  52. Woods, A.J.; Porges, E.C.; Bryant, V.E.; Seider, T.; Gongvatana, A.; Kahler, C.W.; de la Monte, S.; Monti, P.M.; Cohen, R.A. Current Heavy Alcohol Consumption Is Associated with Greater Cognitive Impairment in Older Adults. Alcohol. Clin. Exp. Res. 2016, 40, 2435–2444. [Google Scholar] [CrossRef] [Green Version]
  53. Yen, F.-S.; Wang, S.-I.; Lin, S.-Y.; Chao, Y.-H.; Wei, J.C.-C. The Impact of Heavy Alcohol Consumption on Cognitive Impairment in Young Old and Middle Old Persons. J. Transl. Med. 2022, 20, 155. [Google Scholar] [CrossRef]
  54. Rehm, J.; Hasan, O.S.M.; Black, S.E.; Shield, K.D.; Schwarzinger, M. Alcohol Use and Dementia: A Systematic Scoping Review. Alzheimers Res. Ther. 2019, 11, 1. [Google Scholar] [CrossRef] [Green Version]
  55. Ning, K.; Zhao, L.; Matloff, W.; Sun, F.; Toga, A.W. Association of Relative Brain Age with Tobacco Smoking, Alcohol Consumption, and Genetic Variants. Sci. Rep. 2020, 10, 10. [Google Scholar] [CrossRef] [Green Version]
  56. Angebrandt, A.; Abulseoud, O.A.; Kisner, M.; Diazgranados, N.; Momenan, R.; Yang, Y.; Stein, E.A.; Ross, T.J. Dose-Dependent Relationship between Social Drinking and Brain Aging. Neurobiol. Aging 2022, 111, 71–81. [Google Scholar] [CrossRef]
  57. Crome, I.; Crome, P. Moderate Alcohol Consumption in Older Adults Is Associated with Better Cognition and Well-Being than Abstinence. Age Ageing 2008, 37, 120–121. [Google Scholar] [CrossRef] [Green Version]
  58. Funk-White, M.; Moore, A.A.; McEvoy, L.K.; Bondi, M.W.; Bergstrom, J.; Kaufmann, C.N. Alcohol Use and Cognitive Performance: A Comparison between Greece and the United States. Aging Ment. Health 2022, 26, 2440–2446. [Google Scholar] [CrossRef]
  59. Piumatti, G.; Moore, S.; Berridge, D.; Sarkar, C.; Gallacher, J. The Relationship between Alcohol Use and Long-Term Cognitive Decline in Middle and Late Life: A Longitudinal Analysis Using UK Biobank. J. Public Health 2018, 40, 313–314. [Google Scholar] [CrossRef]
  60. Sacanella, E.; Vázquez-Agell, M.; Mena, M.P.; Antúnez, E.; Fernández-Solá, J.; Nicolás, J.M.; Lamuela-Raventós, R.M.; Ros, E.; Estruch, R. Down-Regulation of Adhesion Molecules and Other Inflammatory Biomarkers after Moderate Wine Consumption in Healthy Women: A Randomized Trial. Am. J. Clin. Nutr. 2007, 86, 1463–1469. [Google Scholar] [CrossRef] [Green Version]
  61. Bektas, A.; Sen, R.; Ferrucci, L. Does a Bit of Alcohol Turn off Inflammation and Improve Health? Age Ageing 2016, 45, 747–748. [Google Scholar] [CrossRef] [PubMed]
  62. Piano, M.R. Alcohol’s Effects on the Cardiovascular System. Alcohol Res. 2017, 38, 219–241. [Google Scholar] [PubMed]
  63. Dare, J.; Wilkinson, C.; Allsop, S.; Waters, S.; McHale, S. Social Engagement, Setting and Alcohol Use among a Sample of Older Australians. Health Soc. Care Community 2014, 22, 524–532. [Google Scholar] [CrossRef] [PubMed] [Green Version]
  64. Blanchet, S.; Chikhi, S.; Maltais, D. The Benefits of Physical Activities on Cognitive and Mental Health in Healthy and Pathological Aging. Geriatr. Psychol. Neuropsychiatr. Vieil. 2018, 16, 197–205. [Google Scholar] [CrossRef] [PubMed]
  65. Kuo, K.; Zhang, Y.-R.; Chen, S.-D.; He, X.-Y.; Huang, S.-Y.; Wu, B.-S.; Deng, Y.-T.; Yang, L.; Ou, Y.-N.; Guo, Y.; et al. Associations of Grip Strength, Walking Pace, and the Risk of Incident Dementia: A Prospective Cohort Study of 340212 Participants. Alzheimers Dement. 2023, 19, 1415–1427. [Google Scholar] [CrossRef]
  66. Erickson, K.I.; Voss, M.W.; Prakash, R.S.; Basak, C.; Szabo, A.; Chaddock, L.; Kim, J.S.; Heo, S.; Alves, H.; White, S.M.; et al. Exercise Training Increases Size of Hippocampus and Improves Memory. Proc. Natl. Acad. Sci. USA 2011, 108, 3017–3022. [Google Scholar] [CrossRef] [Green Version]
  67. Chen, F.-T.; Hopman, R.J.; Huang, C.-J.; Chu, C.-H.; Hillman, C.H.; Hung, T.-M.; Chang, Y.-K. The Effect of Exercise Training on Brain Structure and Function in Older Adults: A Systematic Review Based on Evidence from Randomized Control Trials. J. Clin. Med. 2020, 9, 914. [Google Scholar] [CrossRef] [Green Version]
  68. Petrie, J.R.; Guzik, T.J.; Touyz, R.M. Diabetes, Hypertension, and Cardiovascular Disease: Clinical Insights and Vascular Mechanisms. Can. J. Cardiol. 2018, 34, 575–584. [Google Scholar] [CrossRef] [Green Version]
  69. Shi, Y.; Vanhoutte, P.M. Macro- and Microvascular Endothelial Dysfunction in Diabetes. J. Diabetes 2017, 9, 434–449. [Google Scholar] [CrossRef] [Green Version]
  70. Iadecola, C.; Davisson, R.L. Hypertension and Cerebrovascular Dysfunction. Cell Metab. 2008, 7, 476–484. [Google Scholar] [CrossRef] [Green Version]
  71. Franke, K.; Gaser, C.; Manor, B.; Novak, V. Advanced BrainAGE in Older Adults with Type 2 Diabetes Mellitus. Front. Aging Neurosci. 2013, 5, 90. [Google Scholar] [CrossRef]
  72. Franke, K.; Gaser, C. Ten Years of BrainAGE as a Neuroimaging Biomarker of Brain Aging: What Insights Have We Gained? Front. Neurol. 2019, 10, 789. [Google Scholar] [CrossRef] [Green Version]
  73. Cherbuin, N.; Walsh, E.I.; Shaw, M.; Luders, E.; Anstey, K.J.; Sachdev, P.S.; Abhayaratna, W.P.; Gaser, C. Optimal Blood Pressure Keeps Our Brains Younger. Front. Aging Neurosci. 2021, 13, 694982. [Google Scholar] [CrossRef]
  74. Kaufman, A.S.; Kaufman, J.C.; Liu, X.; Johnson, C.K. How Do Educational Attainment and Gender Relate to Fluid Intelligence, Crystallized Intelligence, and Academic Skills at Ages 22-90 Years? Arch. Clin. Neuropsychol. 2009, 24, 153–163. [Google Scholar] [CrossRef]
  75. te Nijenhuis, J.; van Vianen, A.E.M.; van der Flier, H. Score Gains on G-Loaded Tests: No g. Intelligence 2007, 35, 283–300. [Google Scholar] [CrossRef]
  76. Tikhomirova, T.; Malykh, A.; Malykh, S. Predicting Academic Achievement with Cognitive Abilities: Cross-Sectional Study across School Education. Behav. Sci. 2020, 10, 158. [Google Scholar] [CrossRef]
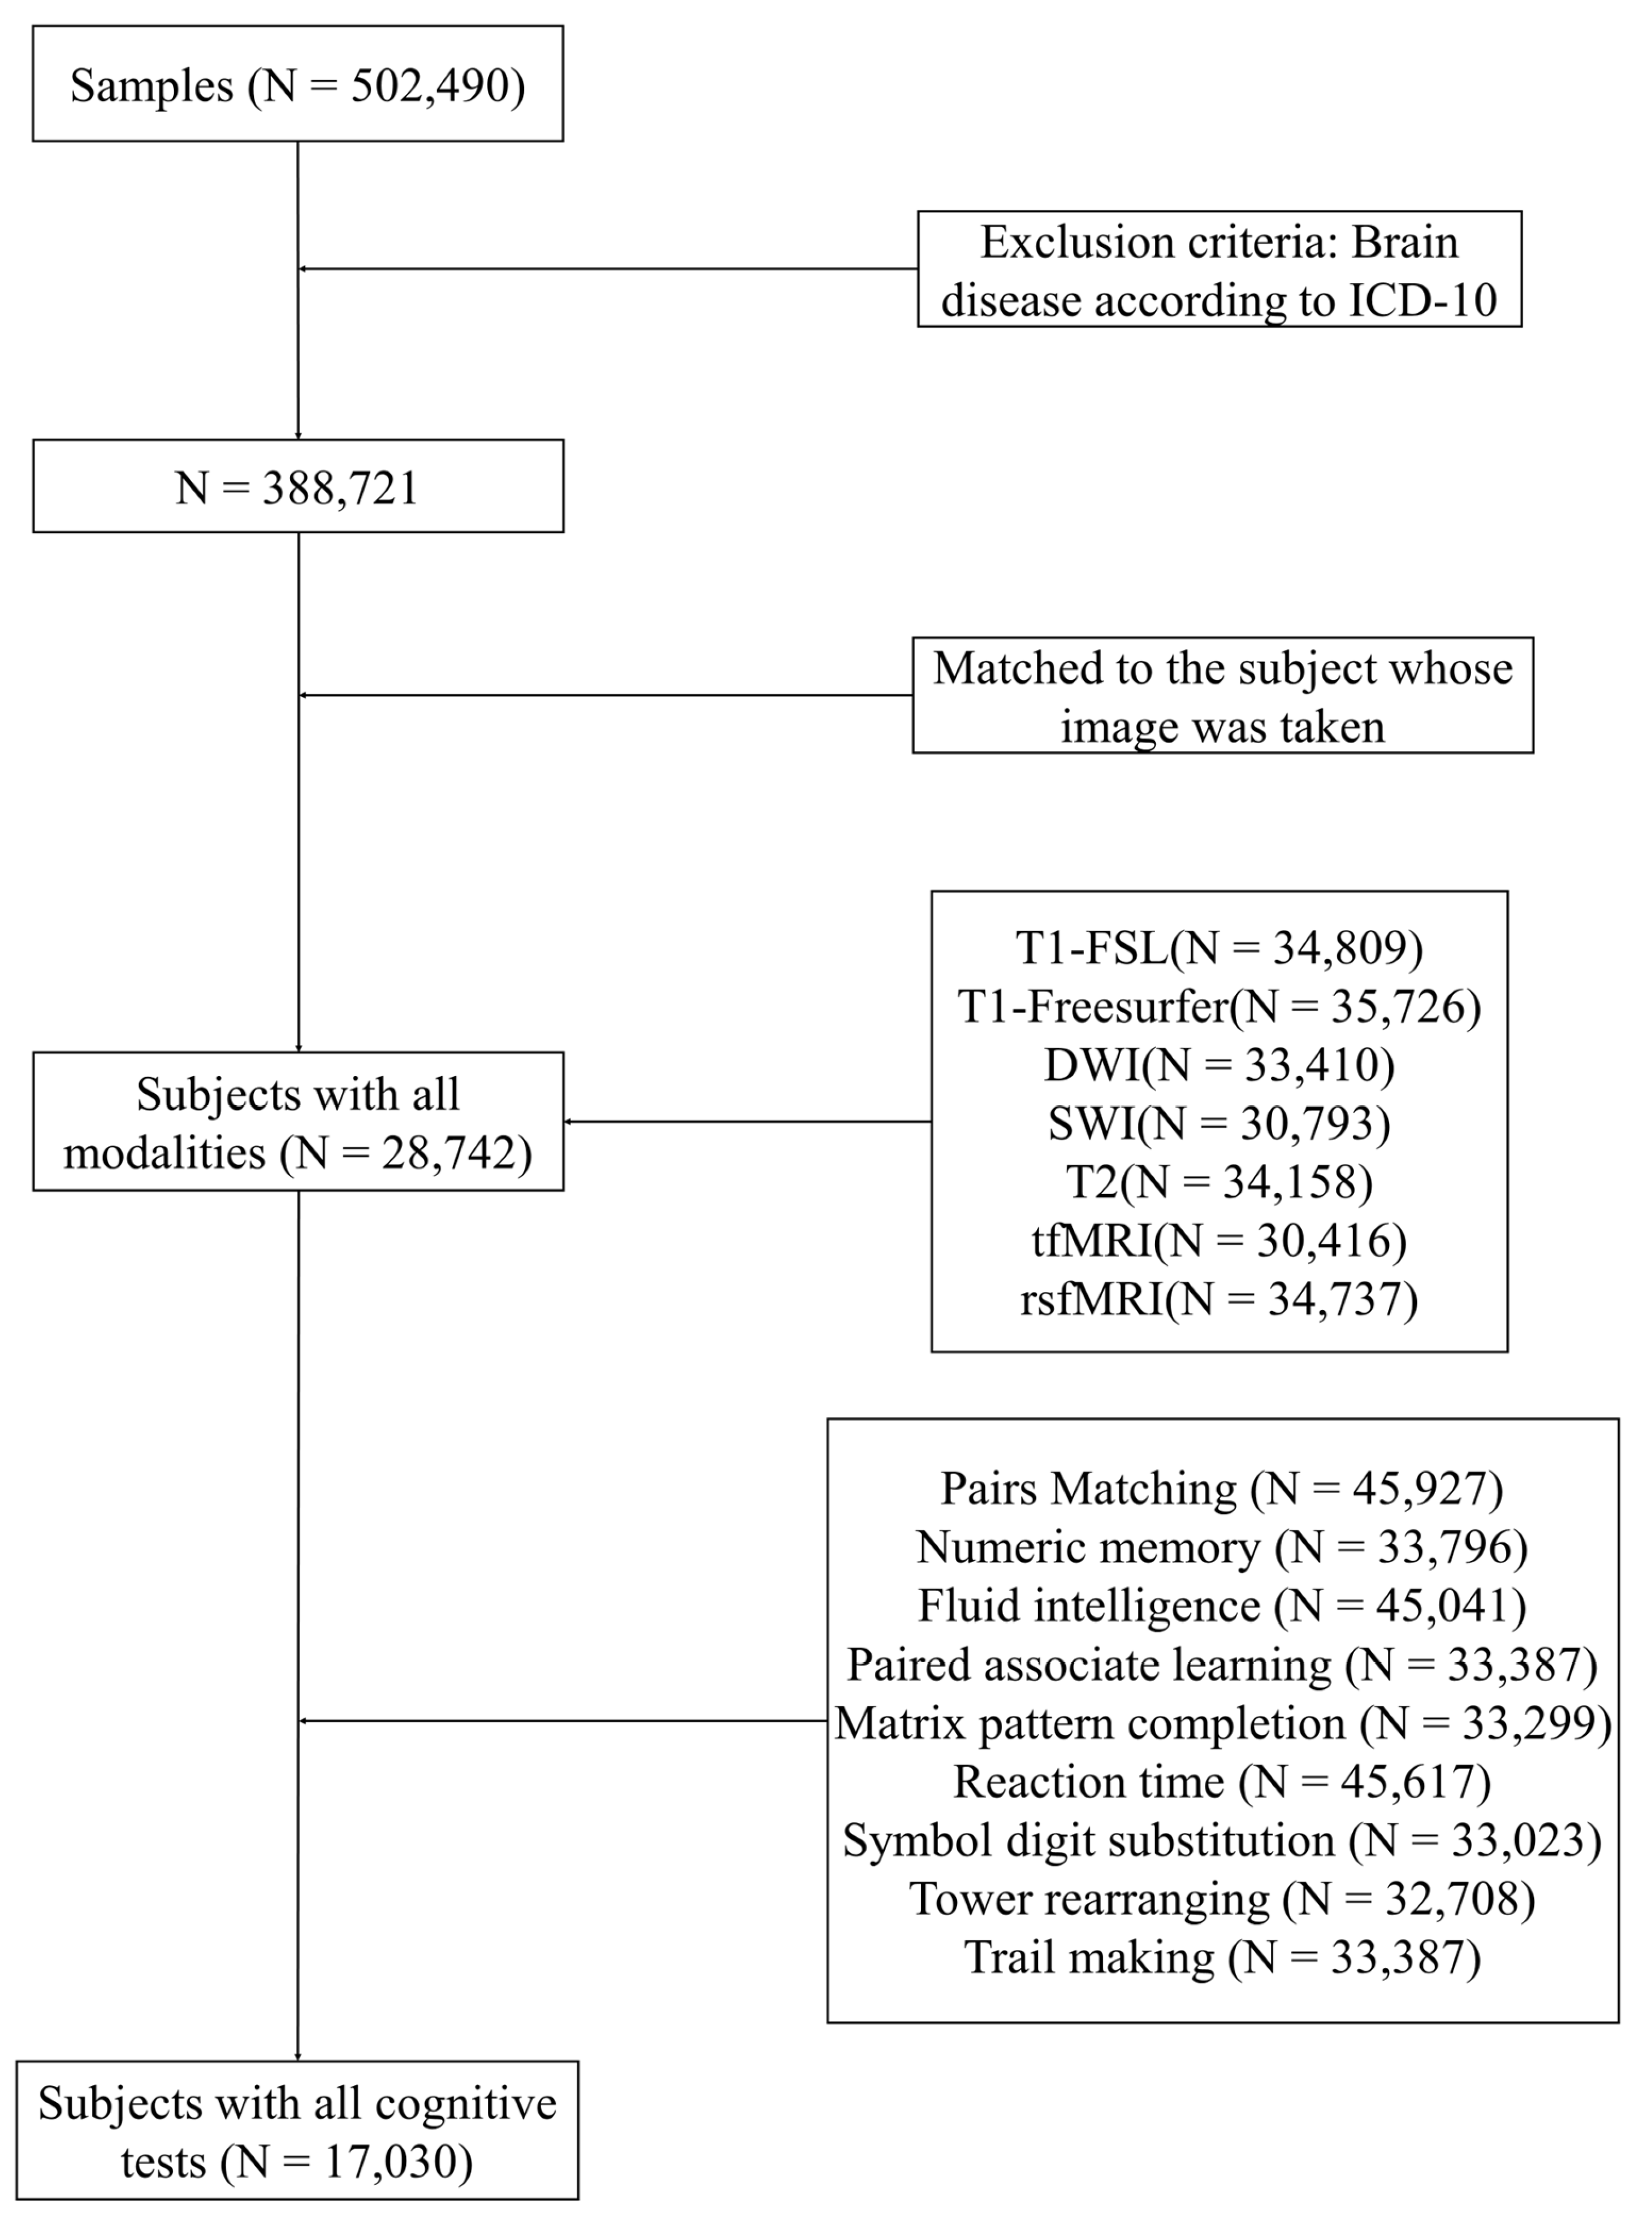
Figure 1. Selection criteria and screening process for participants enrolled in the study (T1 has two types of images, FSL processing and Freesurfer processing, depending on the processing method, which are noted as T1-FSL and T1-Freesurfer, respectively).
Sustainability 15 09620 g001
Figure 2. Comparative chronological age distributions across the training, test sets, and whole cohort.
Sustainability 15 09620 g002
Figure 3. A conceptual representation of BM and CM. The colored dots depict the respective estimated brain age or cognitive age, while the black line represents the corresponding chronological age. The relatively spatial distance between the colored dots and the black line reflects the magnitude of the BrainAGE or CognitiveAGE.
Sustainability 15 09620 g003
Figure 4. A matrix of Pearson correlation examining the relationship between the chronological age and estimated brain age of six distinct imaging modalities.
Sustainability 15 09620 g004
Figure 5. The estimated brain age in comparison to chronological age, with and without bias correction, is presented in the test set. The gray line indicates the line of identity, while the regression line of age on estimated brain age is represented in red.
Sustainability 15 09620 g005
Figure 6. Non-IDPs that affect BrainAGE and CognitiveAGE.
Sustainability 15 09620 g006
Table 1. Demographic characteristics among participants in training and test groups.
Demographic InformationTraining SetTest SetTotal
Number of participants8587844317,030
Age (mean (±SD))64.1 (±7.3)64.1 (±7.3)64.1 (±7.3)
Sex (Male/Female)4088/44993954/44898042/8988
Table 2. Descriptive summary of IDPs.
ModalityDescription of IDPsUKB IDIDPs
T1FSLAnatomical measures of brain anatomy25000~25024, 25782~25920164
Freesurfer26501~277721272
DWIQuantification of micro-structural tissue properties and brain connectivity25056~25730675
SWIAssessment of venous vasculature, microbleeds, and micro-structural aspects25026~2503914
T2Volumetric analysis of WM lesions257811
rsfMRIEvaluation of inter-regional connectivity, regional spontaneous fluctuation amplitude25754~2575576
tfMRIThe strength of response to the specific task within a given brain mask25040, 25042, 25044, 25046, 25048, 25050, 25052, 25054, 25761~2576816
Total//2218
Table 3. Cognitive domain, Neuropsychological tests, and Tests descriptions.
TestingUKB IDDescriptionCognitive DomainTraining SetTest Set
Range/Mean (SD)Range/Mean (SD)
Pairs matching399Number of incorrect matches made in roundVisual declarative
memory
−1.58~0.00/−0.59 (0.26)−1.43~0.00/−0.59 (0.26)
Numeric memory4282Maximum number of digits remembered correctlyWorking memory2~12/6.82 (1.26)2~12/6.83 (1.23)
Fluid intelligence20016Fluid intelligence score assessmentVerbal and numerical reasoning0~13/6.65 (2.02)0~13/6.65 (1.99)
Paired associate learning20197Number of correctly associated word pairsVerbal declarative
memory
0~10/7.13 (2.48)0~10/7.15 (2.49)
Matrix pattern completion6373Number of correctly solved puzzlesNon-verbal
reasoning
0~15/8.10 (2.10)1~14/8.14 (2.06)
Reaction time20023Mean time taken to correctly identify matchesProcessing speed−3.14~−2.56/−2.77 (0.072)−3.19~−2.54/−2.77 (0.073)
Symbol digit substitution23324Number of correct symbol digit matches madeProcessing speed0~37/19.33 (5.17)0~36/19.37 (5.10)
Tower rearranging21004Number of correctly solved puzzlesExecutive function0~18/10.06 (3.19)0~18/10.07 (3.18)
Trail making6350Duration to complete alphanumeric pathExecutive function−3.58~−2.20/−2.72 (0.15)−3.62~−2.31/−2.71 (0.15)
Table 4. Descriptive summary of non-IDPs.
CategorySubclassUKB FieldUKB IDParticipants/N
LifestyleSmokingPast tobacco smoking12498310
Smoking status201168404
Ever smoked201608404
Pack years of smoking201611804
Pack years adult smoking as proportion of life span exposed to smoking201621804
AlcoholAlcohol intake frequency15588425
Former alcohol drinker3731453
Alcohol drinker status201178425
Physical activityHand grip strength (left)468103
Hand grip strength (right)478108
Usual walking pace9248423
Time spent watching television10708415
Time spent driving10908376
Physical healthHypertensionDiastolic blood pressure, automated reading40796505
Systolic blood pressure, automated reading40806505
diabetesDiabetes diagnosed by doctor24438404
Table 5. The mean, SD and range of the various CR proxies assessed for the test sets in this study.
UKB IDCR ProxyParticipants/NMean (SD)Range
1031Social interactions84182.7 (1.1)1~7
6138Educational attainment80503.1 (1.1)1~4
6160Leisure activities65591.6 (0.7)1~4
20016Early fluid intelligence27236.9 (2.0)0~13
Table 6. The prognostic evaluation of seven feature sets derived from six distinct modalities.
MAE (Years)
T1DWISWIT2rsfMRItfMRIAll Modality
FSLFreesurfer
3.9063.1233.5116.1595.2765.1915.8782.767
Table 7. The associations between BrainAGE and CognitiveAGE and CR proxies.
UKB IDCR ProxiesBrainAGECognitiveAGE
rprp
1031Social activities0.0160.1540.0070.519
6138Educational attainment−0.0260.021−0.096<0.001
6160Leisure activities−0.0300.014−0.045<0.001
20016Early fluid intelligence−0.0340.075−0.214<0.001
Disclaimer/Publisher’s Note: The statements, opinions and data contained in all publications are solely those of the individual author(s) and contributor(s) and not of MDPI and/or the editor(s). MDPI and/or the editor(s) disclaim responsibility for any injury to people or property resulting from any ideas, methods, instructions or products referred to in the content.