Article

Research on Combination of Distributed Generation Placement and Dynamic Distribution Network Reconfiguration Based on MIBWOA

Faculty of Electrical and Control Engineering, Liaoning Technical University, Huludao 125105, China
*
Author to whom correspondence should be addressed.
Sustainability 2023, 15(12), 9580; https://doi.org/10.3390/su15129580
Submission received: 21 May 2023 / Revised: 10 June 2023 / Accepted: 12 June 2023 / Published: 14 June 2023
(This article belongs to the Topic Integration of Renewable Energy)

Abstract

:
This paper aims to address the combination of distributed generation placement and dynamic distribution network reconfiguration. Herein, a multi-strategy multi-objective improved black widow algorithm is proposed. A model is established, which considers the objectives of minimizing active power loss, voltage deviation, and carbon emission. The proposed algorithm significantly enhances the traversal capability and search speed by employing Cubic–Tent chaotic mapping, involving a novel formula with the fusion of optimal genes, and employing an adaptive mutation of Wald mutation and elite reverse learning mixing. The DeepSCN is employed to forecast the distributed generation (DG) output power and distribution network load. Through various test functions, the capability of the proposed algorithm is demonstrated. Whether single-objective or multi-objective, the algorithm has excellent performance. To showcase the practicality and effectiveness of the model and approach, a simulation experiment was performed on the IEEE-33 node configuration. The solution set provided by MIBWOA can reduce active network loss to improve operating efficiency, increase voltage offset to make operation more stable, and reduce carbon emissions to make operation more environmentally friendly. The proposed algorithm shows excellent performance in distributed generation placement and distribution network reconfiguration compared with the comparison algorithms. The results show that the solution proposed by MIBWOA can enhance the real-time operational parameters of the distribution network with considerable efficiency.

1. Introduction

Due to the advancement and widespread adoption of remotely operable switches and distributed power sources, the use of electric energy has become increasingly diverse and uncertain, and the operating state of the distribution network has become complex [1,2,3]. How to determine the optimal location for integrating distributed generation into a distribution network [4,5,6] and how to reasonably control the opening and closing states of distribution network switches and combine various operating indicators [7,8], in order to make the operating state of the distribution network tend toward ideality, are crucial questions in current research [9,10,11] which are, respectively, referred to as distributed generation placement (DGP) and distribution network reconfiguration (DNR).
Intelligent optimization methods are more effective than traditional mathematical methods and heuristic algorithms in dealing with nonlinear and large-scale problems [12,13,14]. The results of many researchers have shown that the rational use of distributed power is a very important research topic in the field of distribution network [15]. In order to balance the power supply cost and the penetration rate of wind and PV electricity, reference [16] introduced the principle of economic consumption. Then, an optimization planning method considering wind and PV electricity curtailment measures was proposed, and a fast model-solving method based on distribution network steady-state security region was proposed. Reference [17] utilized a genetic algorithm to optimize the placement and selection of distributed generation, aiming to minimizing the active power loss objective function. Reference [18] solved the distributed generation placement problem with active power loss and voltage stability as objectives by running a particle swarm optimization algorithm. Reference [19] used the flower pollination algorithm to optimize the distributed generation placement for minimizing active power loss and achieving desirable voltage distribution. Reference [20] solved the distributed generation placement problem with power loss minimization, voltage profile improvement, and operating cost minimization as objectives by running the whale optimization algorithm. Reference [21] focused on the minimization of active power loss in DNR. Reference [22] emphasized the dual-objective DNR optimization of reducing network loss and voltage deviation. Reference [23] optimized static DNR with active loss and voltage distribution by considering distributed power sources through the fireworks algorithm. Reference [24] proposed a NoisyNet deep Q-learning network to solve the active power loss and voltage optimization problem in static DNR. Reference [25] applied the jellyfish search algorithm to address the issue of distribution network reconfiguration, aiming to optimize the objective functions that included system average interruption frequency index (SAIFI), system average interruption unavailability index (SAIUI), and total energy not supplied (TENS). Reference [26] used a dynamic programming algorithm and improved the harmony search fusion algorithm to solve the dynamic DNR problem, with the objectives of minimizing system loss, customer interruption, and switching cost. Reference [27] proposed an improved fuzzy C-means clustering algorithm to solve the period division problem in dynamic DNR. Reference [28] introduced a parallel processing algorithm that integrated the EMA algorithm and WGA algorithm to tackle the dynamic distribution network reconfiguration (DNR) issue, optimizing both active power loss and structural reliability objectives. Reference [29] demonstrated the feasibility of using BWOA to solve the distribution network problem, but only considered the single-objective problem of static distribution network reconfiguration and did not optimize the algorithm. To simulate wind speed and solar power output, reference [30] applied beta distribution and reference [31] applied Weibull distribution.
The set parameters easily influence the abovementioned algorithms and may result in unstable solutions and local optima. Therefore, design of a high-performance and high-precision algorithm is a common issue that needs to be researched. In addition, DGP and DNR have not been considered in combination, and research on the involved objective functions is not sufficiently comprehensive, which makes it challenging to combine the results with reality. At the same time, environmental protection issues and pollution caused by fossil fuel burning have not been considered in distribution network reconfiguration, which is detrimental to the sustainable development of human beings. Due to the high randomness and uncertainty in wind speed and solar radiation, accurately simulating external variables with high uncertainty is the key to solving the distribution network reconfiguration problem.
In this paper, we propose using MIBWOA and DeepSCN to solve the DGP and DNR (DGP–DNR) problem, considering minimization of the accurate active power loss [32,33], voltage deviation, and carbon emissions as optimization objectives. Firstly, DeepSCN is employed to predict the power output of the photovoltaic (PV) distributed generation and the load power at each network node. Then, MIBWOA is used to optimize the DGP and determine the specific location of DG integration into the distribution network. Finally, MIBWOA is utilized to optimize the dynamic distribution network reconfiguration problem based on the proposed solution of distributed generation placement.
The paper is organized as follows. The first section introduces the research background and ideas, while the second section outlines the mathematical model of the distribution network. The third section describes the DG output and load power based on DeepSCN. The fourth section introduces the standard BWOA and MIBWOA. In the fifth section, to exhibit the enhanced performance of the proposed algorithm, diverse algorithms are evaluated using test functions, and the MIBWOA is utilized to determine the optimal placement of distributed generation. Additionally, the results obtained using various algorithms for the distribution network reconfiguration (DNR) problem are compared to demonstrate the superior adaptability of MIBWOA to DNR. Finally, the sixth section concludes the paper.

2. The Distributed Generation Placement and Dynamic Distribution Network Optimization Model

Proper placement of distributed generation before distribution network reconfiguration can significantly reduce power loss and improve system stability in the distribution network. Therefore, it is necessary to select the location of distributed generation scientifically. In addition, in solving the problem of distribution network optimization and reconfiguration, static DNR usually only considers the output power and load conditions of distributed generation at a particular moment, making it difficult to apply theoretical research to practical applications. When solving the problems of DG placement and dynamic DNR, it is imperative to consider the temporal variability of DG and load power. The real-time optimization and reconfiguration of the topology structure also need to be considered. Compared with static reconfiguration, dynamic rebuilding is more complex, and its optimization difficulty is higher [34,35].
The paper divides the DGP–DNR problem into 24 periods. As DGP and DNR belong to different optimization strategies of the distribution network, they share similar operating backgrounds, which allows them to use a large portion of the same optimization indicators and constraints. Each target function of the DNR indicator in each period is individually optimized to reduce errors caused by predictions and increase the number of selectable solutions. However, DG and the topology of the distribution network are different. After completing DGP, the location of DG will not change, while DNR can change the network’s topology at any time to achieve real-time optimization. Therefore, unlike DNR, DGP must consider all periods simultaneously and select the optimal solution.

2.1. DGP Objective Function

DGP relies on active network loss, voltage offset, and carbon emissions in the distribution network to select the optimal location. Their formula is as follows:

2.1.1. Accurate Active Power Loss

The objective function is established to reduce the active power loss generated in each period of the distribution network, as shown in Equation (1):
min f 1 = t = 1 H a = 1 B n A a b t P a t P b t + Q a t Q b t + B a b t Q a t P b t Q a t P b t
where f 1 represents the total active power loss during the optimization period, in which a lower value indicates a higher operating efficiency of the distribution network; H represents the entire length of the optimization period; B n represents the total number of nodes in the distribution network; A a b t = R a b t V a t V b t cos φ a t φ b t ; B a b t = R a b t V a t V b t sin φ a t φ b t ; P a t and P b t represent the active power of the a-th and b-th nodes during the t-th period; R a b t represents the line resistance between the a-th and b-th nodes during the t-th period; V a t and V b t represent the voltage at the a-th and b-th nodes during the t-th period; and φ a t and φ b t represent the power factor angle of the a-th and b-th nodes during the t-th period.

2.1.2. Voltage Deviation

To optimize the stability of the distribution network during operation, the objective function shown in Formula (2) was established:
min f 2 = t = 1 H a = 1 B n V a t V a N t V a N t
where f 2 represents the total voltage deviation within the optimization period, in which a smaller value indicates a more stable distribution network; V a t represents the voltage of the a-th node in the t-th period; and V a N t represents the rated voltage of the a-th node in the t-th period.

2.1.3. Carbon Emissions

To reduce pollution caused by the distribution network, the objective function in Equation (3) was established:
m i n f 3 = t = 1 H P s t P D t C m E f
where f 3 is the total carbon emissions generated by the distribution network during the optimization period, in which a smaller value indicates a more environmentally friendly distribution network; P s t is the total power consumption of all nodes in the distribution network during the t-th period; P D t is the total power generated by distributed power sources; C m is the carbon emissions per unit of electricity output during the t-th period; and E f is the energy utilization coefficient.

2.2. DNR Objective Function

DNR also takes active network loss, voltage offset, and carbon emissions as optimization targets, and their formulas are as follows.

2.2.1. Accurate Active Power Loss

The objective function was established to reduce the active power loss generated in each period of the distribution network, as shown in Equation (4):
min f 4 = t = 1 H i = 1 B n j = 1 B n D i j t δ i j t P i t P j t + Q i t Q j t + ε i j t Q i t P j t Q j t P i t
where f 4 represents the total active power loss during the optimization period, in which a lower value indicates a higher operating efficiency of the distribution network; D i j t represents the on/off status of the branch between the i-th and j-th nodes during the t-th period ( D i j t = 1 represents the branch closed, D i j t = 0 represents the branch open); δ i j t = R i j t V i t V j t cos φ i t φ j t ; ε i j t = R i j t V i t V j t sin φ i t φ j t ; P i t and P j t represent the active power of the i-th and j-th nodes during the t-th period; R i j t represents the line resistance between the i-th and j-th nodes during the t-th period; V i t and V j t represent the voltage at the i-th and j-th nodes during the t-th period; and φ i t and φ j t represent the power factor angle of the i-th and j-th nodes during the t-th period.

2.2.2. Voltage Deviation

To optimize the stability of the distribution network during operation, the objective function shown in Formula (5) was established:
min f 5 = t = 1 H i = 1 B n V i t V i N t V i N t
where f 5 represents the total voltage deviation within the optimization period, in which a smaller value indicates a more stable distribution network; V i t represents the voltage of the i-th node in the t-th period; and V i N t represents the rated voltage of the i-th node in the t-th period.

2.2.3. Carbon Emissions

To reduce pollution caused by the distribution network, the objective function in Equation (6) was established:
m i n f 6 = t = 1 H P s u m t P D G t C m E f
where f 6 is the total carbon emissions generated by the distribution network during the optimization period, in which a smaller the value indicates a more environmentally friendly distribution network; P sum t is the total power consumption of all nodes in the distribution network during the t-th period; P D G t is the total power generated by distributed power sources; C m is the carbon emissions per unit of electricity output during the t-th period; and E f is the energy utilization coefficient.

2.3. Constraints

Since DGP and DNR work in the same environment, they use the same constraints. In tackling the DGP–DNR problem, simplifying the constraint model as much as possible is crucial because the constraint conditions increase the complexity of the problem.

2.3.1. Flow Equation Constraint

The distribution network must satisfy the flow constraint shown in Equation (7) during operation:
P i D G + P i = P i l o a d + V i s = 1 B n V s ( G i s cos θ i s + B i s sin θ i s ) Q i D G + Q i = Q i l o a d + V i s = 1 B n V s ( G i s sin θ i s B i s cos θ i s )
where P D G i and Q D G i are the active and reactive power of DG at the i-th node, respectively; ( P i ) and ( Q i ) are the active and reactive power injected at the i-th node, respectively; P i l o a d and Q i l o a d are the active and reactive power of the load at the i-th node, respectively; V i and V s are the node voltages at the i-th and s-th nodes, respectively; G i s and B i s are the branch conductance and susceptance between the i-th and s-th nodes, respectively; and θ i s is the power factor angle of the branch between the i-th and s-th nodes.

2.3.2. Current Constraints

The currents of all branches in the reconstructed network should be within a specified range. This constraint can be mathematically expressed as Equation (8):
0 I k I k max , k = 1 , 2 , 3 , , B n
where I k is current on the k-th branch and I k max is the upper limit of the current on the k-th branch.

2.3.3. Voltage Constraints

After reconfiguration, the voltage of each node in the network must satisfy the constraints shown in Equation (9):
V n min V n V n max , n = 1 , 2 , 3 , , B n
where V n is the voltage of the n-th node, and V n min and V n max are the lower and upper voltage limits for the n-th node, respectively.

2.3.4. Branch Capacity Constraint

After reconfiguration, the currents of each branch in the network must be within the specified range. This constraint is mathematically described in Equation (10):
S k S k max , k = 1 , 2 , 3 , , L n
where S k is the capacity of the k-th branch, S k max is the maximum capacity of the k-th branch, and S k max is the total number of branches in the distribution network.

2.3.5. Topological Constraints on the Distribution Network

The distribution network operators must satisfy the topological constraint condition as shown in Equation (11), a constraint which only applies to the DNR problem:
g u G u
where g u represents the topology structure of the reconstructed distribution network and G u is the set of all radial topology structures.

2.3.6. Dynamic Constraint on the Number of Switch Operations in the Distribution Network

To reduce losses caused by switch operations, constraint (12) is established, which only applies to the DNR problem:
t = 1 H l = 1 L n α l t α l t 1 N s u m max t = 1 H α l t α l t 1 N l max
where H represents the total period, α l t and α l t 1 represent the total number of switch operations in the t-th period and ( t 1 )-th period, respectively, and N s u m max and N l max , respectively, represent the maximum number of switch operations allowed in the total period and single period.

2.3.7. Transformer Constraint

The constraint shown in Equation (13) must be satisfied to ensure the transformer operates normally:
n = 1 B n P i D G + P i μ S T cos θ
where μ is the efficiency of the transformer, taken as 0.8∼0.95; S T is the apparent power of the transformer; and θ is the power factor angle.

2.4. Distributed Generation Model

There are commonly two types of DG: the PQ type and the PV type. In this paper, the forward–backward substitution method is used for power flow calculation, so all distributed generation must be converted to PQ node-type.

2.4.1. PQ-Type Distributed Generation

The common PQ-type distributed generation is wind turbine. Power flow calculation adds its power to the distribution network parameters as a negative value. The calculation of the formula is as follows:
P = P D G Q = Q D G
where P D G and Q D G , respectively, represent the active power and reactive power output of the distributed power source.

2.4.2. PV-Type Distributed Power Generation

Common PV-type distributed power sources include photovoltaic generators and internal combustion engines, among others. The formula for calculation of its generated power is as shown:
Q t = X 1 U Δ U + Q t 1 , Q D G min < Q t 1 + X 1 U Δ U < Q D G max Q t = Q D G max , Q t 1 + X 1 U Δ U Q D G max Q t = Q D G min , Q t 1 + X 1 U Δ U Q D G min
where Q D G max and Q D G min are the maximum and minimum reactive power outputs allowed by the DG, respectively, X is the node reactance, U is the voltage magnitude of the DG, Δ U is the node voltage offset, t is the iteration number, and Q t and Q t 1 are the reactive powers at iteration t and t 1 , respectively. Equation (15) prevents the DG from exceeding its maximum allowable reactive power output.
From Equations (1) to (15), it can be seen that the dynamic DNR problem is a multi-objective discrete optimization problem. When the network size is large, conventional mathematical optimization algorithms may be difficult to solve, and heuristic algorithms may struggle to find optimal solutions.

3. Prediction of DG and Load Power Based on DeepSCN

Due to the high uncertainty and volatility in both DG and loads, direct use of mathematical distribution formulas in simulation will result in significant errors [36,37,38], making it challenging to combine the results with reality. Therefore, DeepSCN was utilized for predicting the real-time power output of distributed generation and load power at each node in the distribution network.

3.1. Introduction to DeepSCN

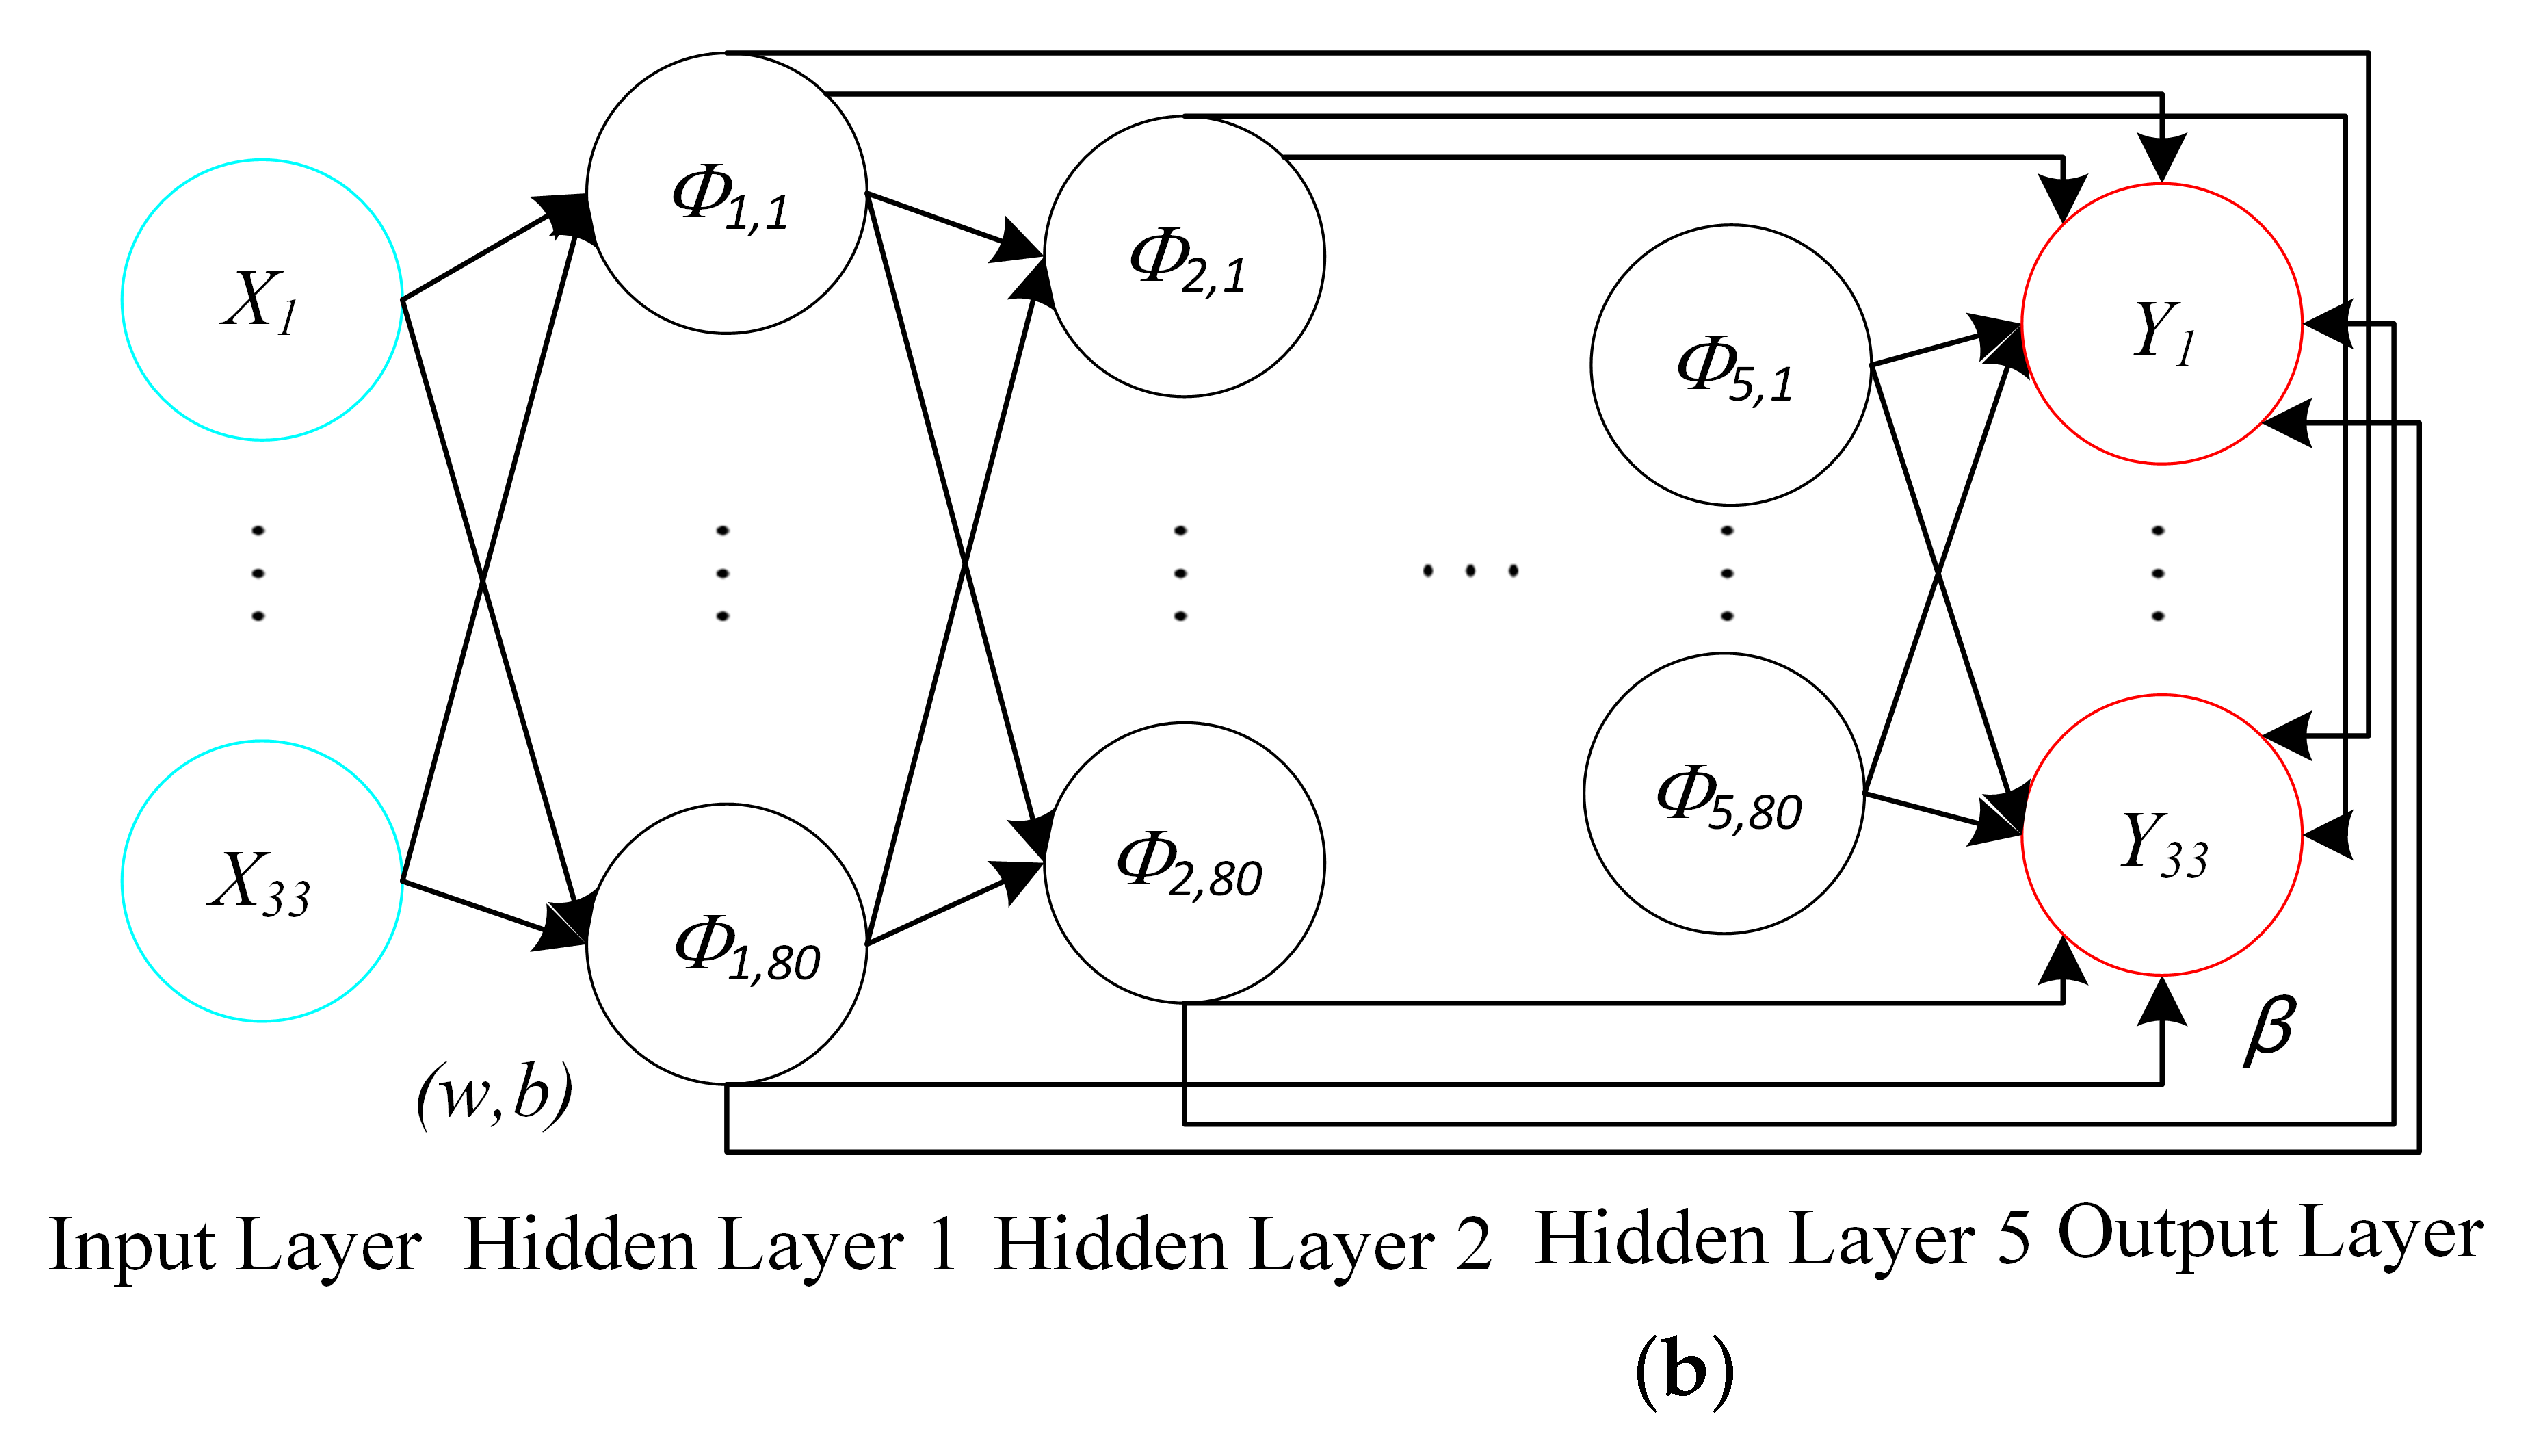
DeepSCN (deep stochastic configuration network) is a method for progressively and randomly constructing neural networks. It constrains the random allocation of weights and biases through a supervisory mechanism and can directly connect all hidden layers to the output layer. The random basis function of each hidden layer is generated by a set of inequality constraint equations [39].
Assuming that F x = [ f 1 , f 2 , , f m ] has n layers and p nodes, the formula of DeepSCN is shown below:
F p n x = n = 1 n j = 1 p μ j k C x C x = f k j x k 1 , ω k 1 j , b k 1 j
In the formula, p = 1 , 2 , , L , L is the maximum number of hidden nodes; n = 1 , 2 , , R , R is the maximum number of hidden layers; μ j k is the output weight of the j-th node in the k-th layer; f k j is the activation function of the j-th node in the k-th layer; and x k 1 , ω k 1 j , and b k 1 j are the input values and hidden parameters in the k-th hidden layer.
When configuring the j-th hidden node in the n-th hidden layer of DeepSCN, its activation function f j n must satisfy the following inequality:
ε j , q n , f j n 2 b 2 γ j , q n , q = 1 , 2 , , m
ε j , q n , in the above formula, is defined below:
ε S N n = F x F p n x
After fixing the random basis function f 1 n , f 2 n , , f L n , the first hidden node f 1 n + 1 is added in the ( n + 1 )-th hidden layer according to the following inequalities:
ε L , q n , f 1 n + 1 2 b 2 γ L , q n , q = 1 , 2 , , m
According to Formula (17), a new node is added to the ( n + 1 )-th hidden layer, and Formula (19) adds the first node to the new hidden layer. This process is repeated until the desired structure is achieved, and the output weights are evaluated using the least squares method.

3.2. DG and Load Power Prediction Based on DeepSCN

DeepSCN is used to predict the data of DG and load during a specific period, providing data support for the dynamic DNR problem and reducing the error caused by external data uncertainty.
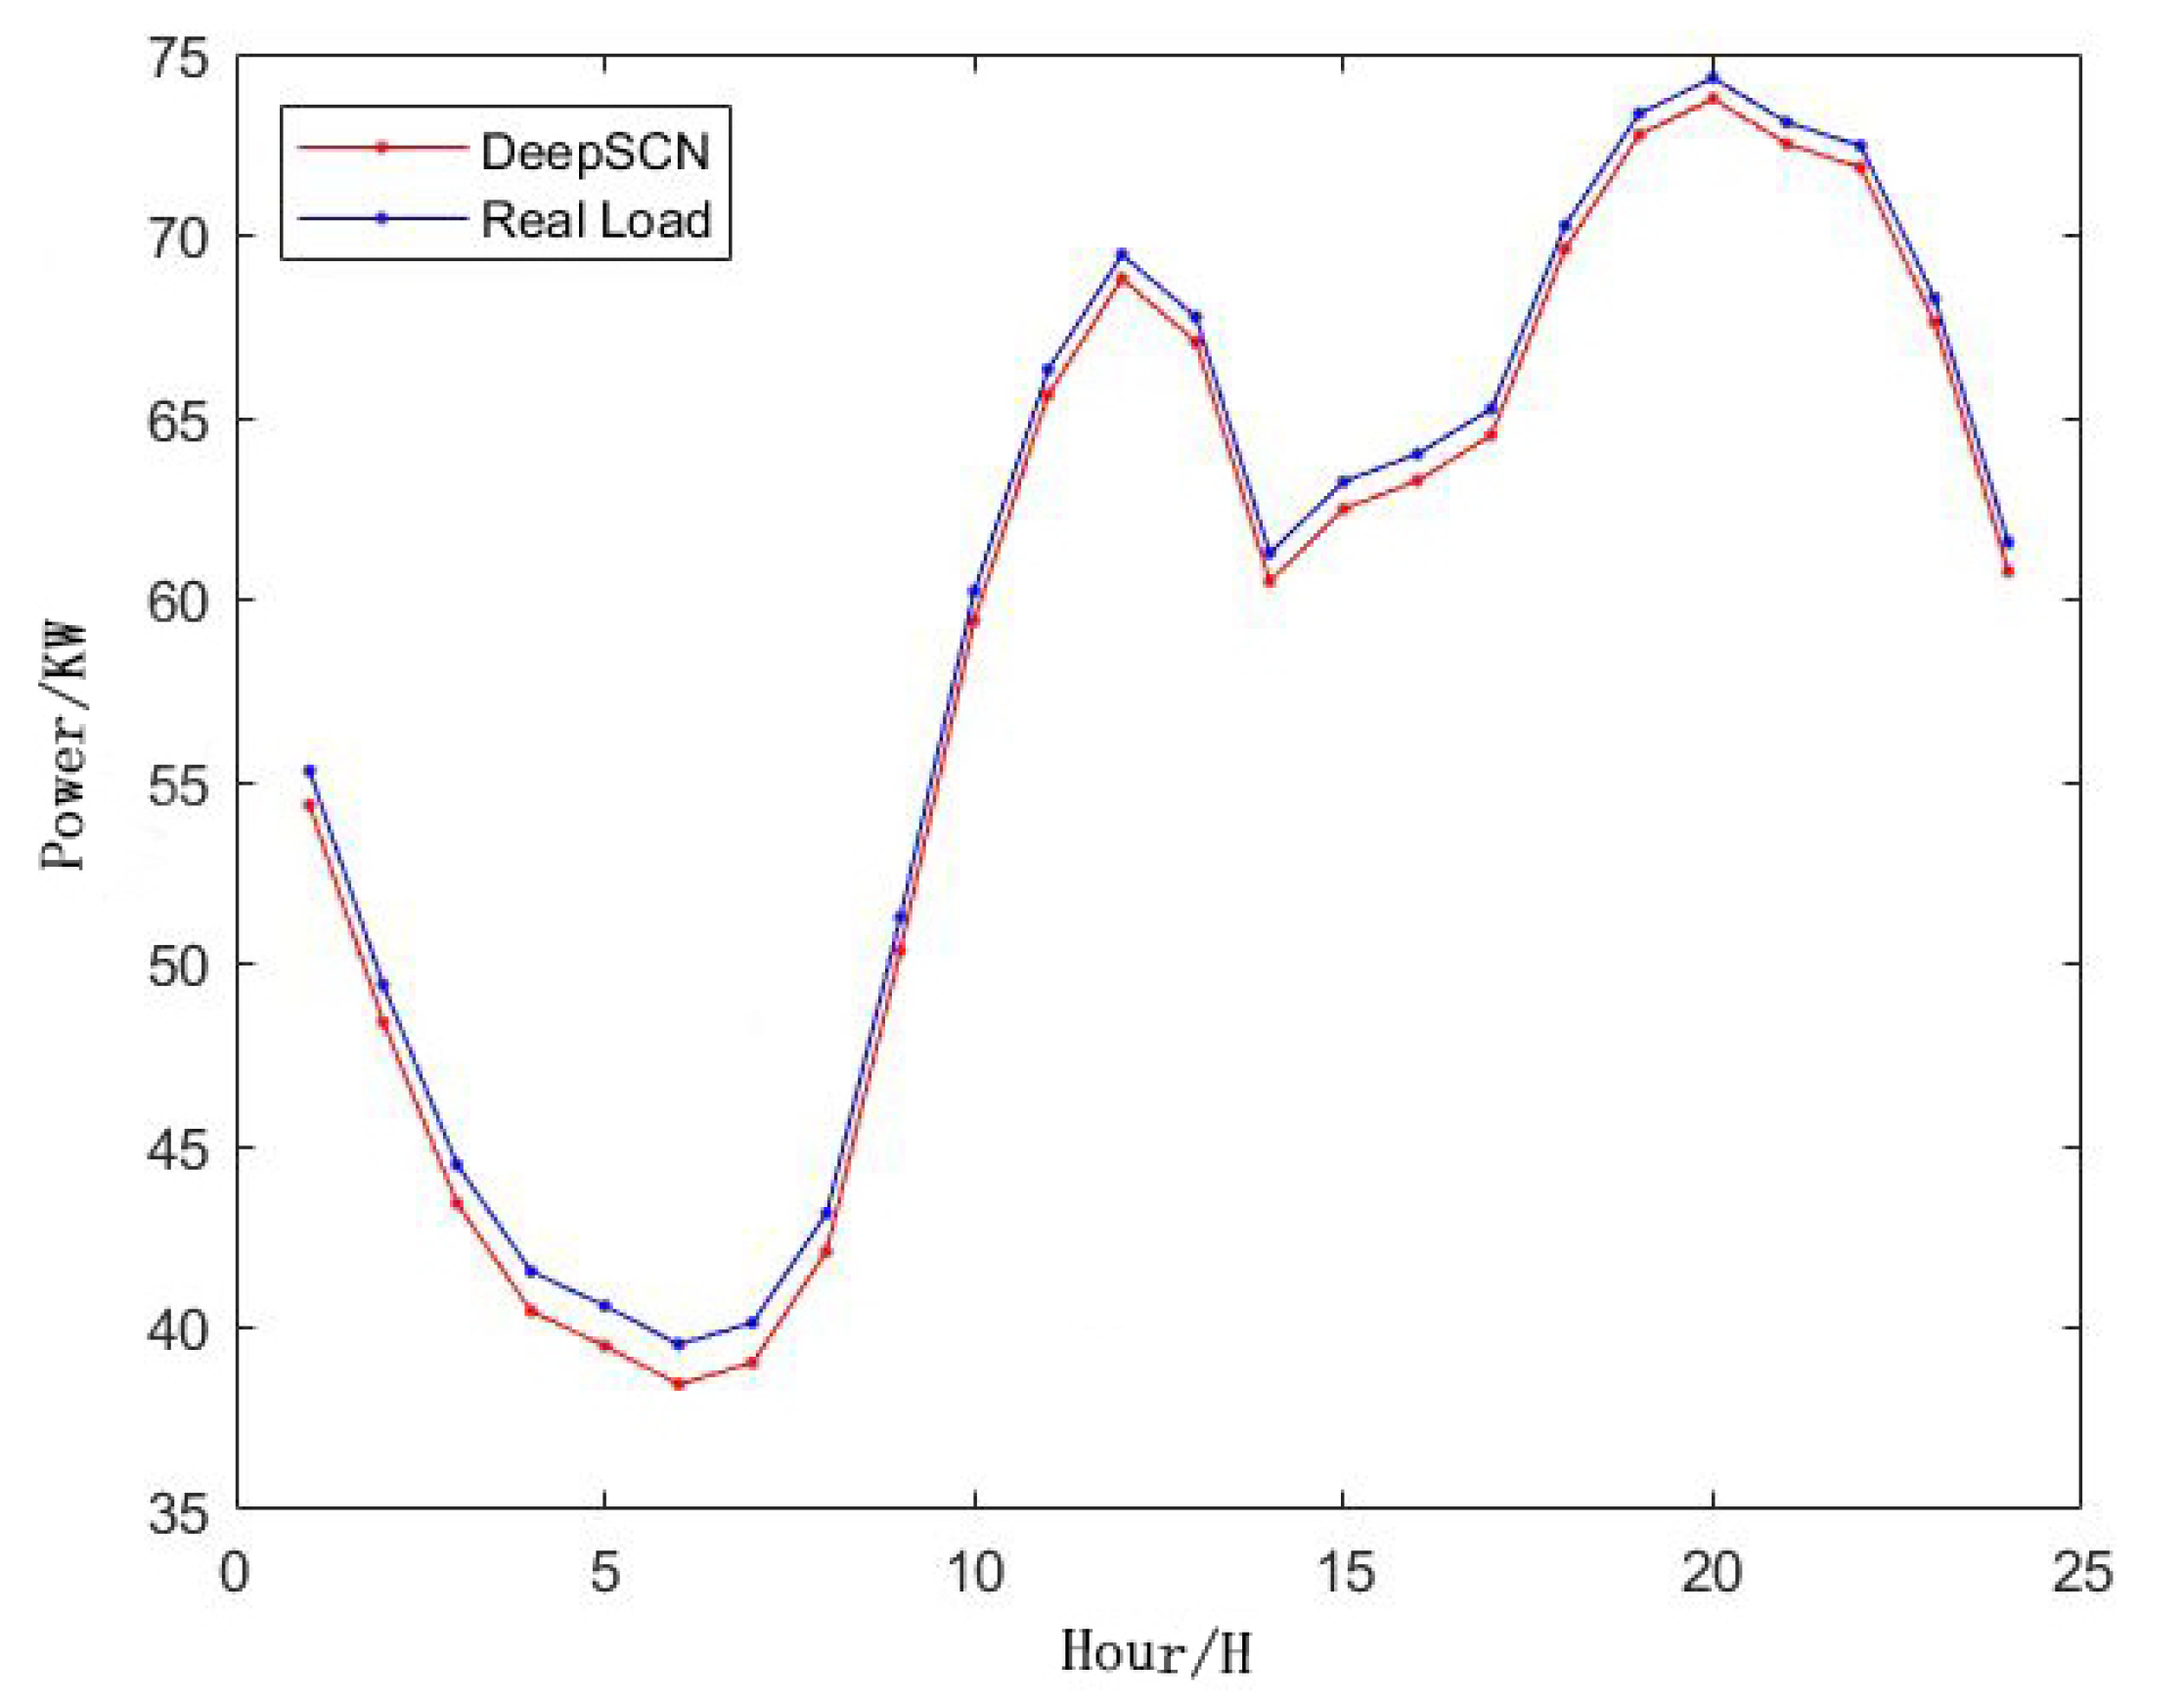
Taking the solar energy and load data of a particular region in China in 2019 as an example, assuming the maximum number of hidden layers and hidden nodes in DeepSCN to be 5 and 80, respectively, the input and output nodes for predicting the output power of DG are 3 and 3, and the input and output nodes for predicting the load power are 33 and 33, respectively. Figure 1 shows two structural diagrams of DeepSCN, and Figure 2 and Figure 3 show the predicted power data of DG output and load power for a certain node using DeepSCN.
The predicted results are very close to the actual situation, as shown in the figures. Therefore, it can be concluded that it is feasible to apply DeepSCN to predict the output power of DG and the power of load.

4. Multi-Objective Improved Black Widow Optimization Algorithm

In this section, a new type of MIBWOA is introduced through the standard black widow optimization algorithm and is then used to solve the DGP–DNR problem. Based on the prediction of DG output power and load power output using DeepSCN, MIBWOA was used to select the location of distributed generation and optimize the distribution network in each period. The algorithm initializes the population using Cubic–Tent chaotic mapping, generates a new population by updating formulas with the fusion of optimal genes, and improves the diversity in the population through the adaptive adjustment of Wald and elite reverse learning mutations. The algorithm also includes a multi-objective solution set selection based on Pareto theory and a discretization module for selecting the DGP–DNR solution set, to increase the compatibility of the algorithm for the DGP–DNR problem.

4.1. Standard Black Widow Algorithm

The black widow optimization algorithm (BWOA) is inspired by the life cycle of black widow spiders and was proposed by Vahideh Hayyolalam et al. in 2020 [40]. Compared with other algorithms, BWOA performs well in both the development and exploration stages. The following are the working steps of BWOA.
STEP 1: Initialization. Generate the initial population, where each solution is called a black widow. In dimensional problems, these solutions are represented by a 1 × dim matrix:
W = [ x 1 , x 2 , , x dim ]
Each black widow W = [ x 1 , x 2 , , x dim ] generates fitness by an objective function, and its value measures the worth of the solution:
F = f x 1 , x 2 , , x dim
In the equation, W represents an individual spider, x dim represents different numerical values within the individual, and F represents the fitness of individual [ x 1 , x 2 , , x dim ] ;
STEP 2: Population reproduction. Select a pair of parents to mate and breed a new generation of spiders, which is implemented by the following equation:
y 1 = α x 1 + 1 α x 2 y 2 = α x 2 + 1 α x 1
where α 0 , 1 ; x 1 and x 2 are the parent individuals of the black widow; and y 1 and y 2 are the new offspring individuals. After repeating the reproduction process dim/2 times, all the mothers and offspring are sorted according to their fitness;
STEP 3: Cannibalism. BWOA has three types of self-cannibalism: sexual cannibalism, where the mother eats the father; filial cannibalism, where the offspring cannibalize each other and eliminate the less fit individuals; and matricide, where the offspring eat the mother (in exceptional cases). The algorithm determines the number of surviving individuals based on their cannibalism rates (CR);
STEP 4: Mutation. A certain number of individuals are randomly selected from the population based on the mutation rate (MR), and two elements within each individual are randomly exchanged, as shown in Figure 4.

4.2. Multi-Objective Improved Black Widow Optimization Algorithm

4.2.1. Cubic–Tent Chaotic Mapping

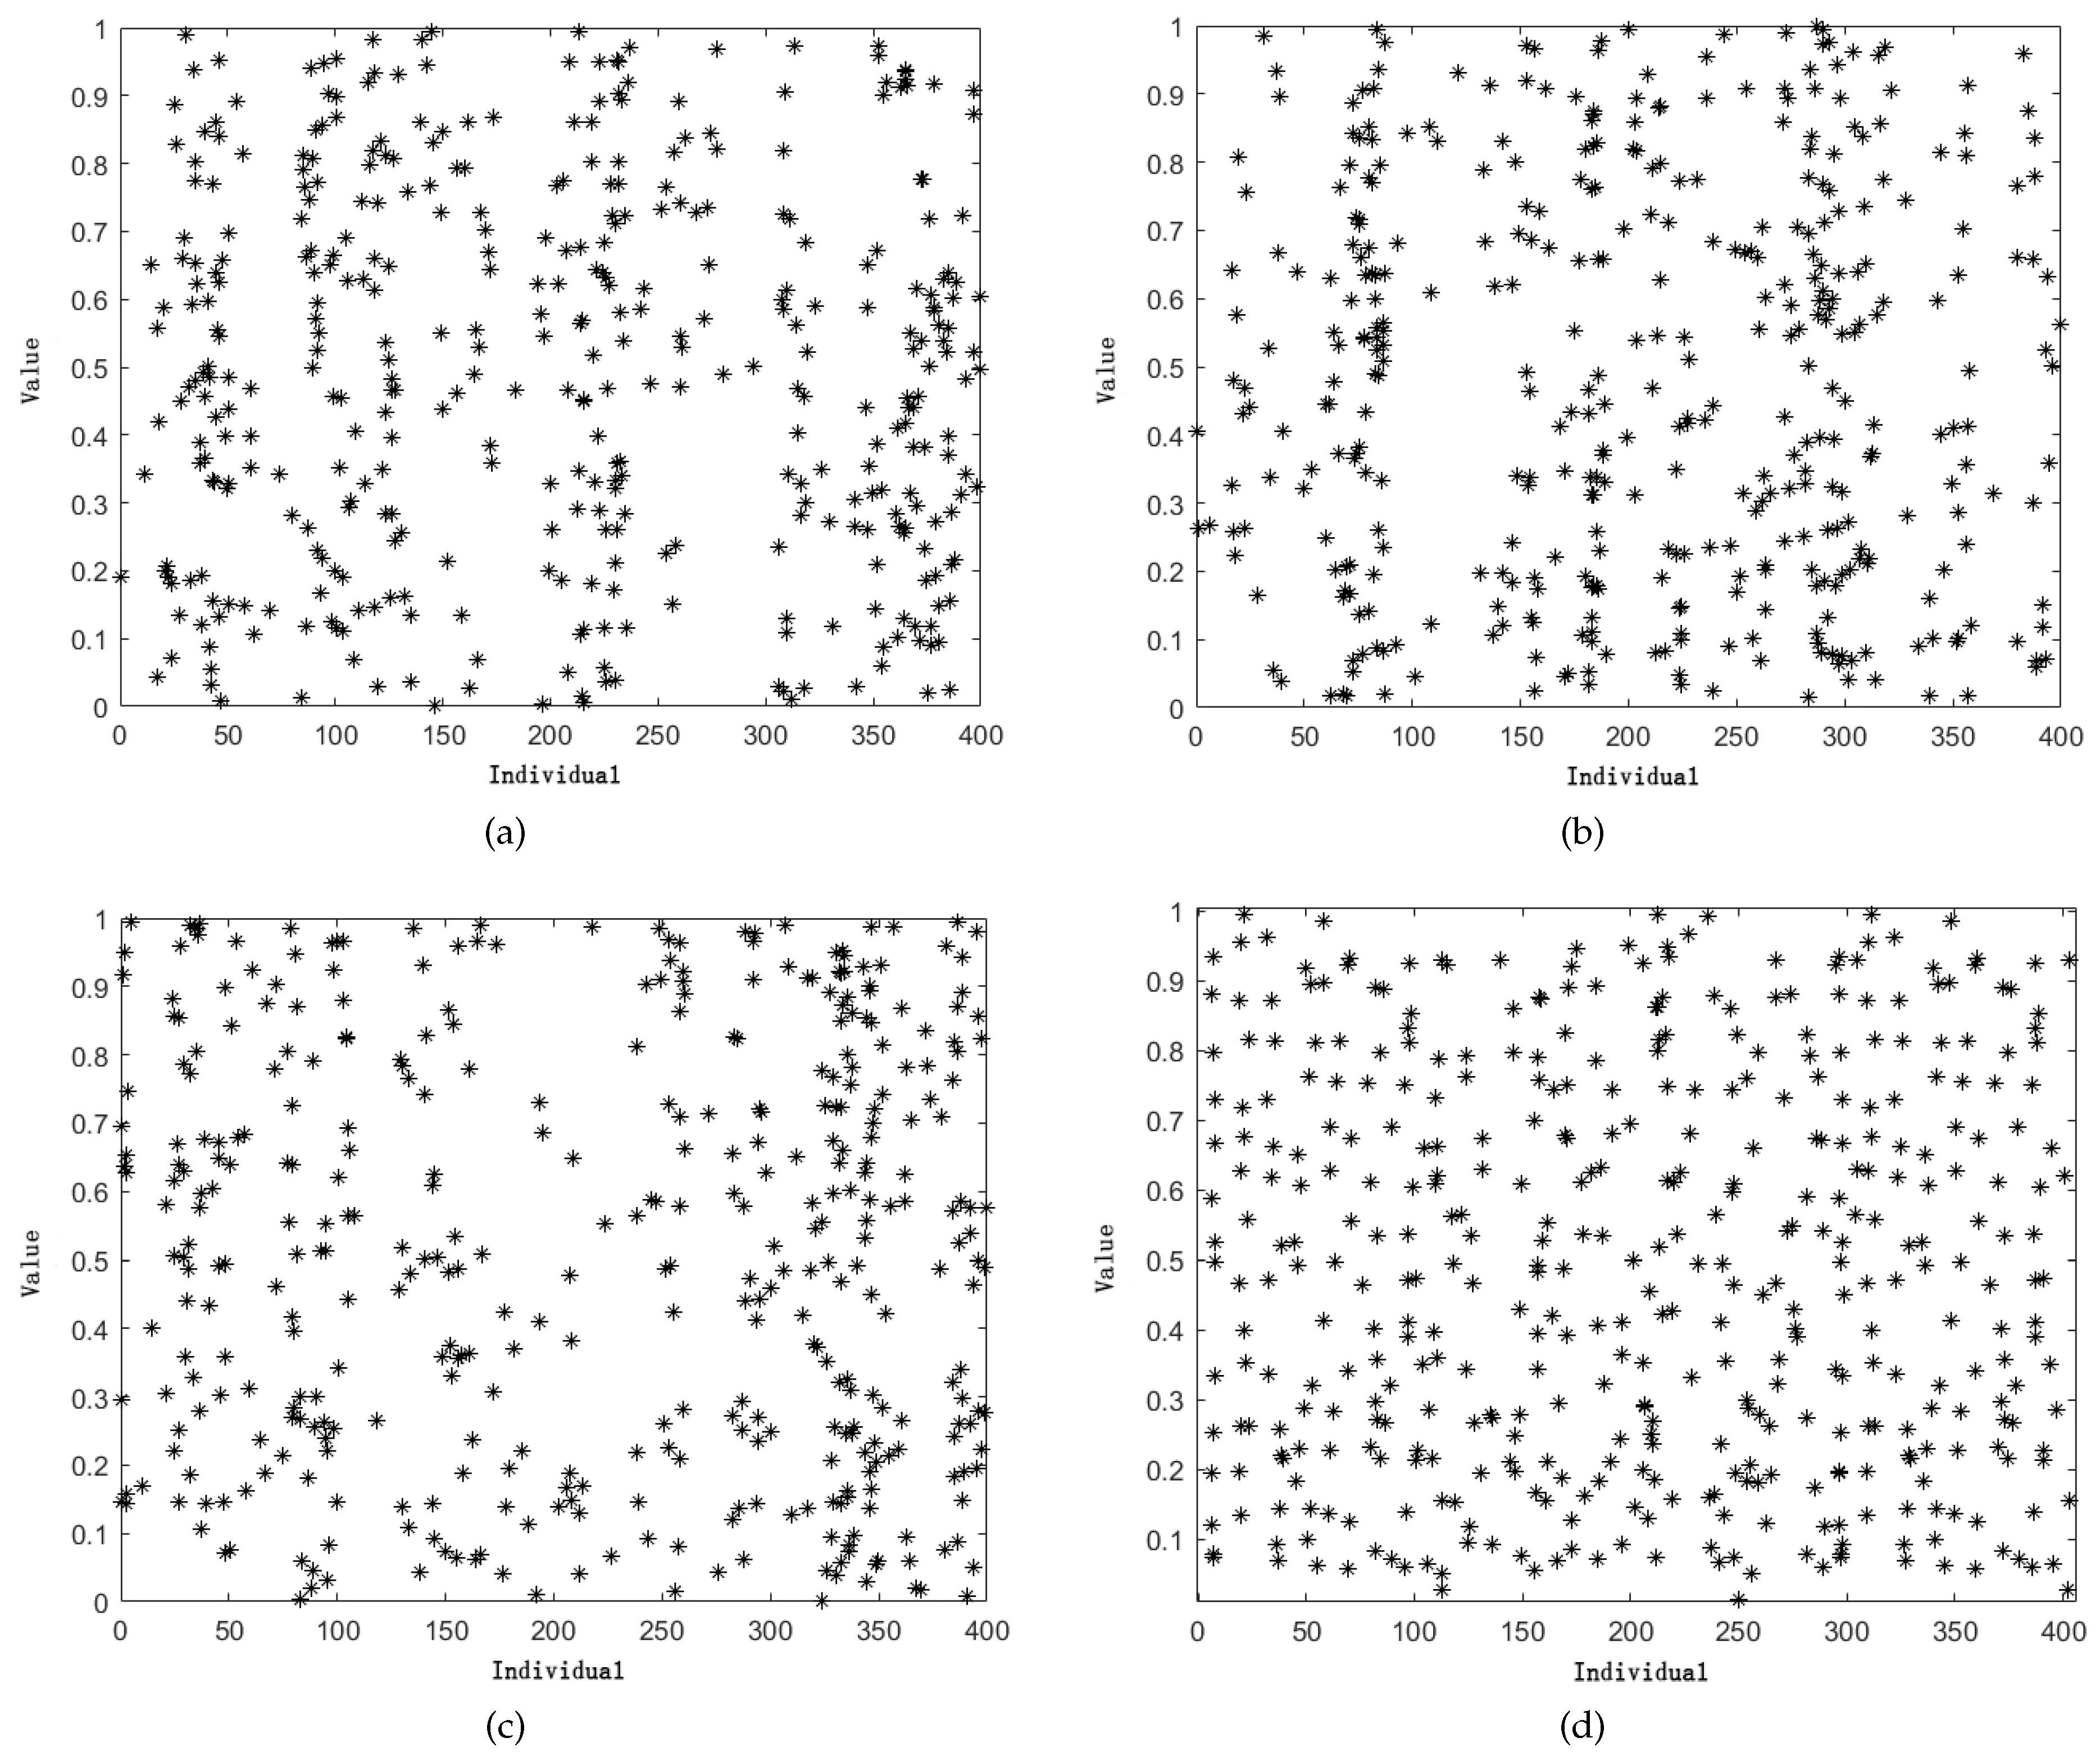
Standard BWOA generates the initial population using a completely random approach, which undoubtedly leads to unstable population quality and speed fluctuations, posing difficulties and risks to algorithm solving. Individually, both Cubic and Tent chaotic mappings have good traversal properties and improvement space [41,42]. The combination of the two shows even better performance, and the randomness and traversal properties are effectively improved. Figure 5 offers several ways to generate random arrays, and it can be seen that the solutions developed by Cubic–Tent are more uniformly distributed throughout the solution space than other methods.
The expression for generating the initial population using Cubic–Tent is as follows:
W = [ x 1 , x 2 , , x dim ]
x dim = ω x dim 0 1 2 x dim 0 2 , r a n d < 0.5 x dim = ω 1 x dim 0 1 2 1 x dim 0 2 , r a n d > 0.5
In the equation, ω is the control factor, and a value of 5.19 works relatively well; x dim 0 represents the initial data of the dim dimension of the individual, which is randomly generated within the upper and lower limits of the dimension; x dim is the data of the dim dimension of the individual that is generated; and rand is a value randomly generated on the ( 0 , 1 ) interval.

4.2.2. Updating Formulas with the Fusion of Optimal Genes

The standard BWOA population updating formula has a relatively simple structure, which results in a slow speed of population updating and the algorithm becoming easily trapped in local optima. This undoubtedly puts tremendous pressure on the mutation part of the algorithm. To solve this problem, the paper uses an improved population updating formula by adding independent random factors and the best black widow individual within the population, which enables the algorithm to quickly iterate toward the optimal direction for a solution:
y 1 = δ x 1 3 + μ x 2 3 + η x b e s t 3 3 y 2 = μ x 1 3 + δ x 2 3 + η x b e s t 3 3
In the equation, δ 0 , 1 , μ 0 , 1 , η 0 , 1 ; x 1 and x 2 are parent individuals; x b e s t is the current best individual in the population; and y 1 and y 2 are offspring individuals.
The joint action of the two random factors in the improved formula increases the possibility of obtaining optimal solutions. It greatly enhances the algorithm’s search ability, diversity, and traversal properties, thus expanding the search space of the solution set. Moreover, in using the information on the current population’s best individual, the algorithm avoids taking the direction of erroneous population evolution. Compared with the weighted updating formula in Formula (22), the improved formula has a more vital ability to break through local optima. It can increase the convergence speed and accuracy of the population.

4.2.3. Mutation Based on Adaptive Adjustment of Wald and Elite Reverse Learning

This paper introduces two mutation methods: Wald mutation and elite reverse learning mutation, with their formulas as follows:
W M = τ 2 π W 3 × e τ W γ 2 2 π 2 W , K C W M = M r α + β W t o p , K < C
In the equation, W M represents the individuals in the population after mutation; τ and γ are control factors, and their values depend on the specific problem; W t o p is the elite individual in the current population; M r is the dynamic coefficient, while α and β are the dynamic boundaries; K is the adaptive factor determined by the Formula (27); and C is the switching threshold value for mutation methods, for which the recommended value is 0.7.
K = s t d f p W s
In the equation, W s represents the population set; f p W s represents the set of normalized values of each objective function in the population; and p ( 1 , 2 , 3 ) measures the distribution of current solutions through the standard deviation calculated by the s t d function.
Wald mutation works at K C , and the two controllable factors increase the controllability and diversity of transformation, giving it excellent local search capability, increasing the speed of approaching local and globally optimal solutions and being responsible for the exploration stage of the algorithm. Elite reverse learning mutation works at K < C , utilizing the fact that privileged individuals contain higher information value than others to construct a new population from the elite individuals. Dynamic factors and dynamic boundaries allow mutations to adaptively change the search interval, actively choose the mutation direction, and improve the solution’s value, increasing population diversity and preventing the “premature” phenomenon responsible for the development stage of the algorithm. The two mutations work together, adjusting the mutation state through the adaptive factor. Compared with the swapping mutation method in Figure 4, this has a diverse evolutionary space under the premise of considering speed and accuracy, effectively improving the convergence and avoiding any local optima of the algorithm.

4.2.4. Multi-Objective Solution Set Selection Based on Pareto Theory

BWOA is a single-objective optimization algorithm that is difficult to run when facing multi-objective problems such as DGP and dynamic DNR. To address this issue, we integrated Pareto theory and ranking-dominance to transform the single-objective BWOA into a multi-objective optimization algorithm with the following function formula:
F x = f x 1 , f x 2 , , f x p
In the formula, multi-objective problem F x consists of p objective functions, and the multi-objective functions have the following constraints:
G x = 0 H x 0
In the formula, G x and H x represent the multi-objective function’s equality constraints and inequality constraints.
Generally, it is difficult to find an optimal individual for all objectives in multi-objective problems. Therefore, ranking-dominance ranks the solutions and selects individuals with higher fitness. If all the objective functions of individual A are better than those of individual B, then individual A dominates individual B. Based on the ranking-dominance, individuals that are less valuable are filtered to obtain the desired set of solutions, and different solutions are selected depending on the preference for objective functions. The collection of these solutions is called the Pareto front solution set.

4.2.5. Discretization of Solutions in DGP-DNR Problem

Since MIBWOA is continuous, it may waste computing power, lose individuals, and reduce accuracy when solving discrete problems such as DGP–DNR. Therefore, a selectable discretization module was added. When facing a discrete problem, the module is activated to switch the algorithm from continuous computation to discrete computation. The formula for the module is as follows:
η o x = o , x < k o + 1 , x > k
o k F x d x = k o + 1 F x d x
In the formula, η o x is the algorithm formula within x o , o + 1 after discretization; F x is the algorithm formula before discretization; k satisfies Formula (28); o l b , l b + 1 , , u b 1 ; and ub and lb are the upper and lower bounds of x.

4.2.6. Workflow of MIBWOA

The flowchart of MIBWOA is shown in Figure 6, and the process of MIBWOA is as follows.
STEP 1: Set the algorithm parameters, including the population size N, population dimension D, social cannibalism rate SCR, mother cannibalism rate MCR, offspring cannibalism rate CCR, maximum iteration number T, mutation rate MR, number of parent pairs for participating in crossover CP, mutation adaptive factor K, mutation adaptive factor limit C, and upper limit UB and lower limit LB for each dimension;
STEP 2: Generate the initial population through Cubic–Tent mapping;
STEP 3: Calculate the fitness of each individual using the objective function, determine the Pareto solution set and domination; if the generated population does not meet the constraints, set all fitness functions to the maximum and proceed to STEP 9;
STEP 4: The improved population update formula generates a new population;
STEP 5: Calculate the fitness of each individual using the objective function, determine the Pareto solution set and domination; if the generated population does not meet the constraints, set all fitness functions to the maximum and proceed to STEP 9;
STEP 6: Use three types of cannibalism rates to make the population self-cannibalize and eliminate individuals with poor fitness;
STEP 7: Use the adaptive Wald mutation and elite reverse learning mutation to generate the mutation population;
STEP 8: Calculate the fitness of each individual using the objective function, determine the Pareto solution set and domination; if the generated population does not meet the constraints, set all fitness functions to the maximum and go to STEP 9;
STEP 9: Combine the new population and update the solution set;
STEP 10: Stop iteration when the conditions are met; otherwise, return to STEP 4. The stopping conditions include (1) reaching the predetermined iteration number; (2) no change in the best individual fitness for multiple iterations; or (3) reaching the specified precision;
STEP 11: Stop iteration and output the current Pareto front.

5. Results and Discussion

5.1. Optimization of Classic Test Functions

The parameters used for MIBWOA were as follows: dimensionality of 5, population size of 50, the maximum number of iterations of 300, crossover rate of 0.8, C set to 4, and three types of symbiotic rates of 0.45, 0.35, and 0.2.
Firstly, MIBWOA was used to solve the Griewank function, and the iteration process is shown in Figure 7. It is not difficult to see that, compared to the standard BWOA, MIBWOA has a more substantial advantage and can converge to the optimal solution faster without being easily disturbed by local optimal solutions.
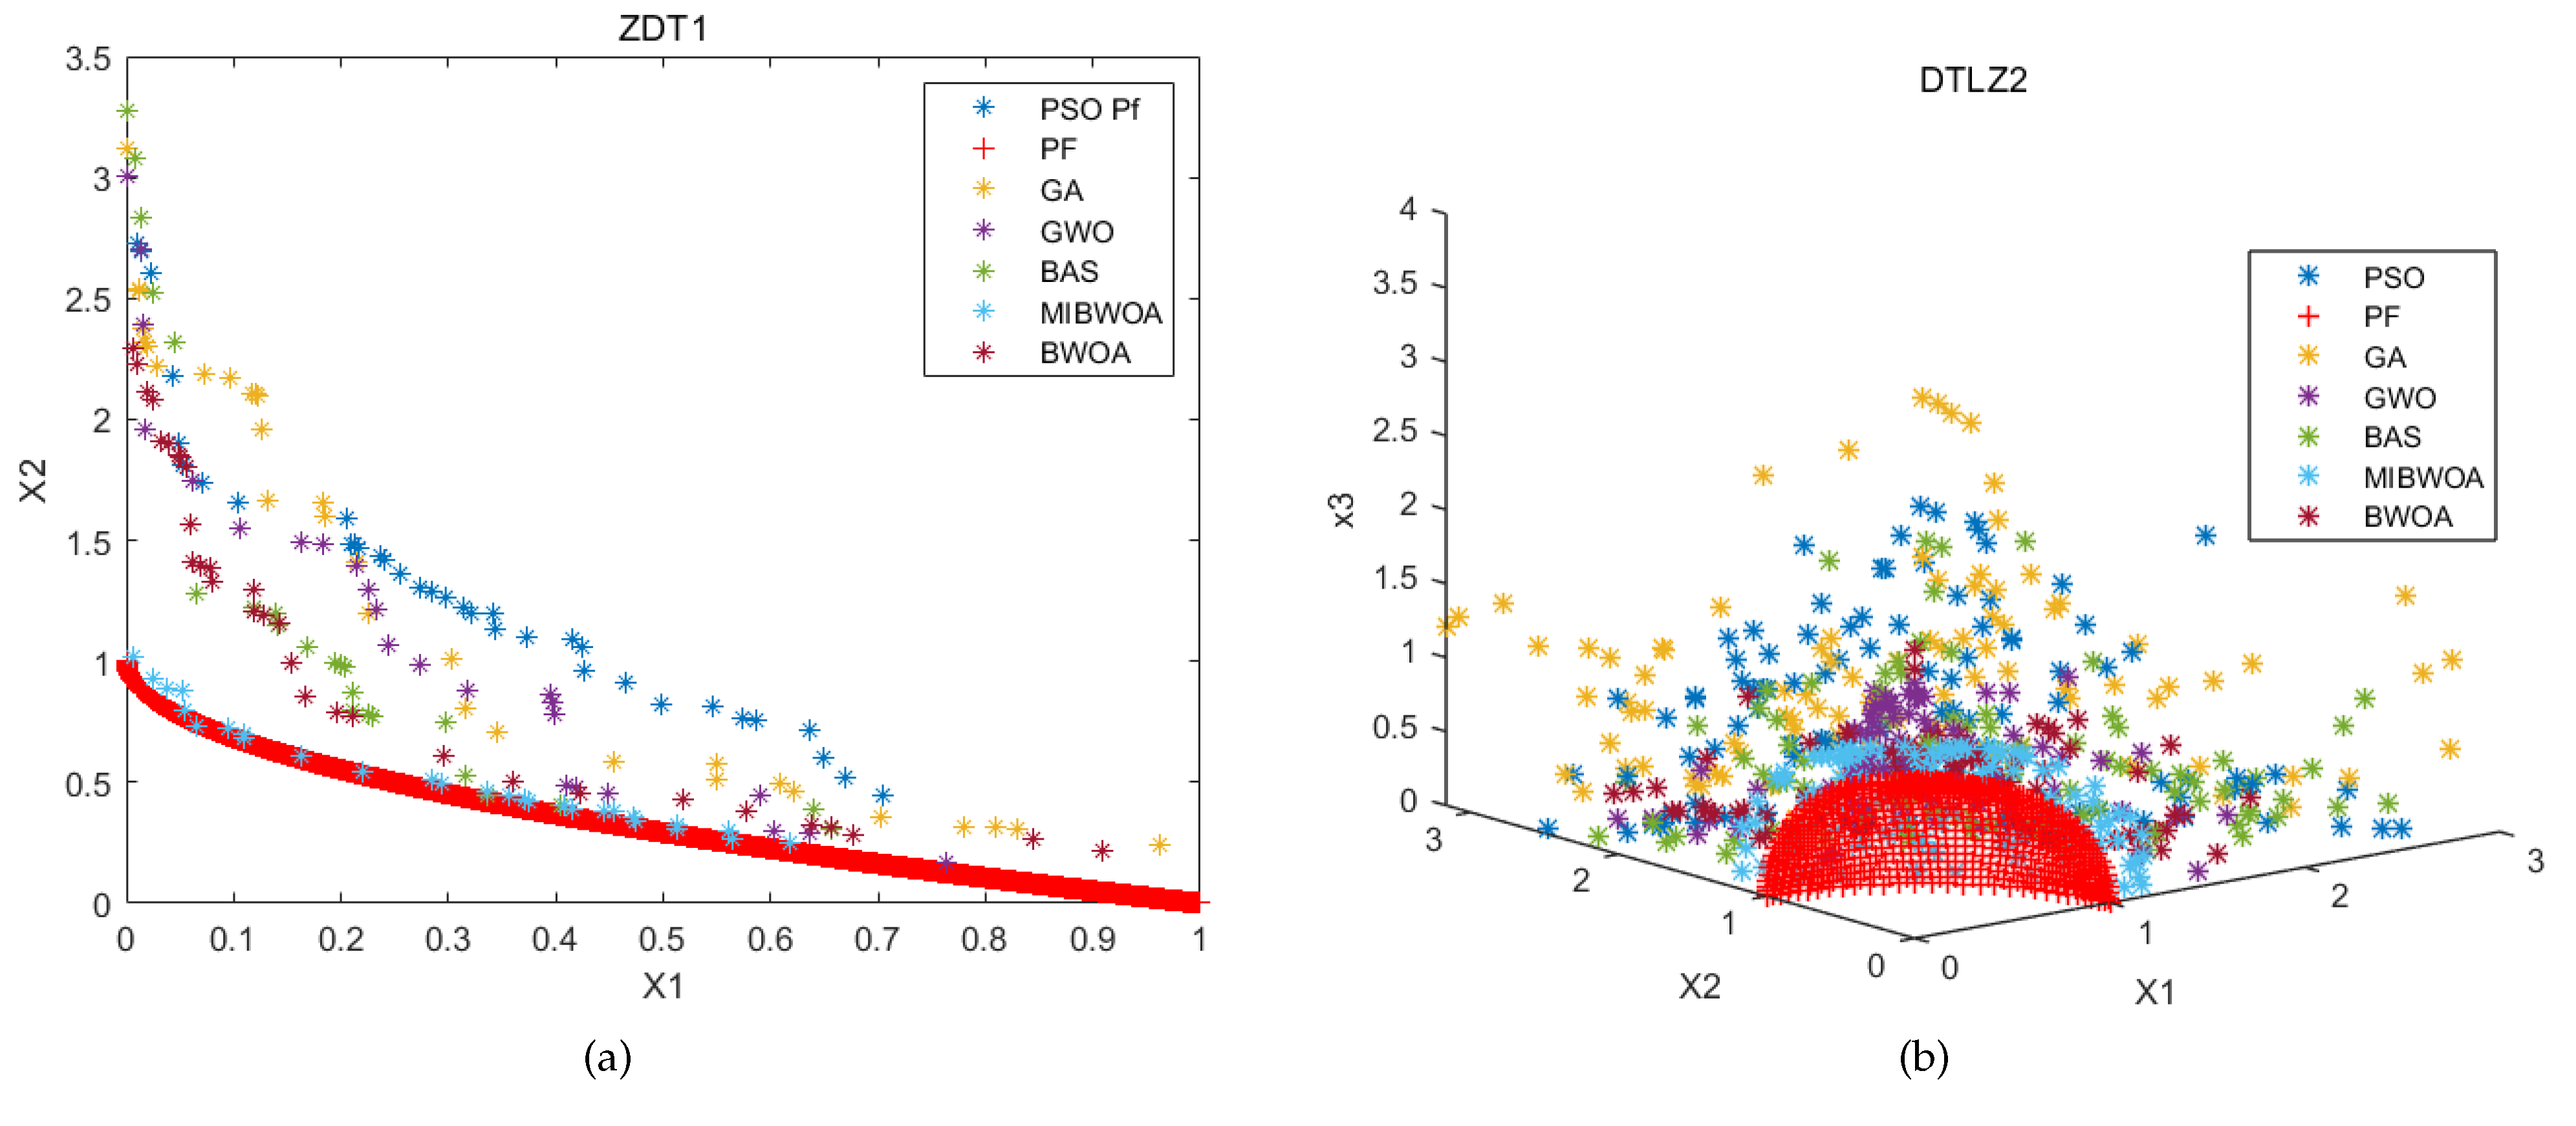
Next, algorithm performance comparison was conducted through simulation experiments using several test functions. The optimal values of single objective functions F1 and F2 were 0, and, when running multi-objective algorithms, all compared algorithms were transformed into multi-objective algorithms through Pareto theory. Several algorithms were repeated 50 times and compared with MIBWOA. The function formulas are shown in Table 1, the results of single-objective tests are shown in Table 2, and the results of multi-objective functions ZDT1 and DTLZ2 are shown in Figure 8, where PF represents the actual Pareto optimal result. The IGD [43,44], HYP [45,46], and PSP [47,48] indicator evaluation results are shown in Table 3.
It can be seen from Table 2 that, for the single-objective test function, the optimization results of BWO were 7.45 × 10 5 and 5.68 × 10 0.6 , which are closer to the real optimal value than other comparison algorithms. Additionally, they reached convergence through iterations of 52 and 76 times in 65 s and 74 s, respectively. In comparison to other algorithms, BWOA demonstrated superior performance by achieving optimal values that are closer to the true optimum. Notably, it exhibited excellent results in terms of both iteration count and iteration time. These findings lead to the conclusion that BWOA possesses a strong foundation and has the potential for further improvements. Thus, it holds promise for achieving even better outcomes. MIBWOA could stably obtain the global optimal value 0 in 37 s and 44 s, and find the optimal value in 26 and 14 iterations. MIBWOA demonstrates satisfactory performance in terms of optimization capability and convergence speed. It outperforms other algorithms and the standard BWOA in terms of optimal values, iteration count, and iteration time. These results validate the effectiveness of the improvements made to MIBWOA and highlight its excellent performance in single-objective problems.
From Figure 8, it can be observed that BWOA, compared to other algorithms in a multi-objective test function environment, performs well but fails to stand out. In contrast, the solution set of the MIBWOA algorithm shows a much closer proximity to the true Pareto front compared to the solution sets of other algorithms, including the original BWOA, with overwhelming superiority. Additionally, as indicated by the evaluation metrics in Table 3, BWOA obtained 0.1284, 0.3442, and 5.7467 in function F3, and obtained 0.3428, 1.5477, and 2.9134 in function F4. MIBWOA obtained 0.0109, 0.5501, and 6.1914 in function F3, and obtained 0.247, 2.1317, and 4.0478 in function F4. While BWOA struggles to outperform other algorithms, MIBWOA exhibits remarkable performance, surpassing other algorithms in all three metrics. This confirms the outstanding performance of MIBWOA in the field of multi-objective optimization.
The test results show that, compared with PSO, GA, GWO, BAS, and BWOA, MIBWOA has the highest optimization accuracy, fastest running speed, and the best IGD, HYP, and PSP evaluation indexes. This demonstrates the excellent value of MIBWOA in solving single-objective and multi-objective problems.

5.2. IEEE-33 DG Placement Experiment

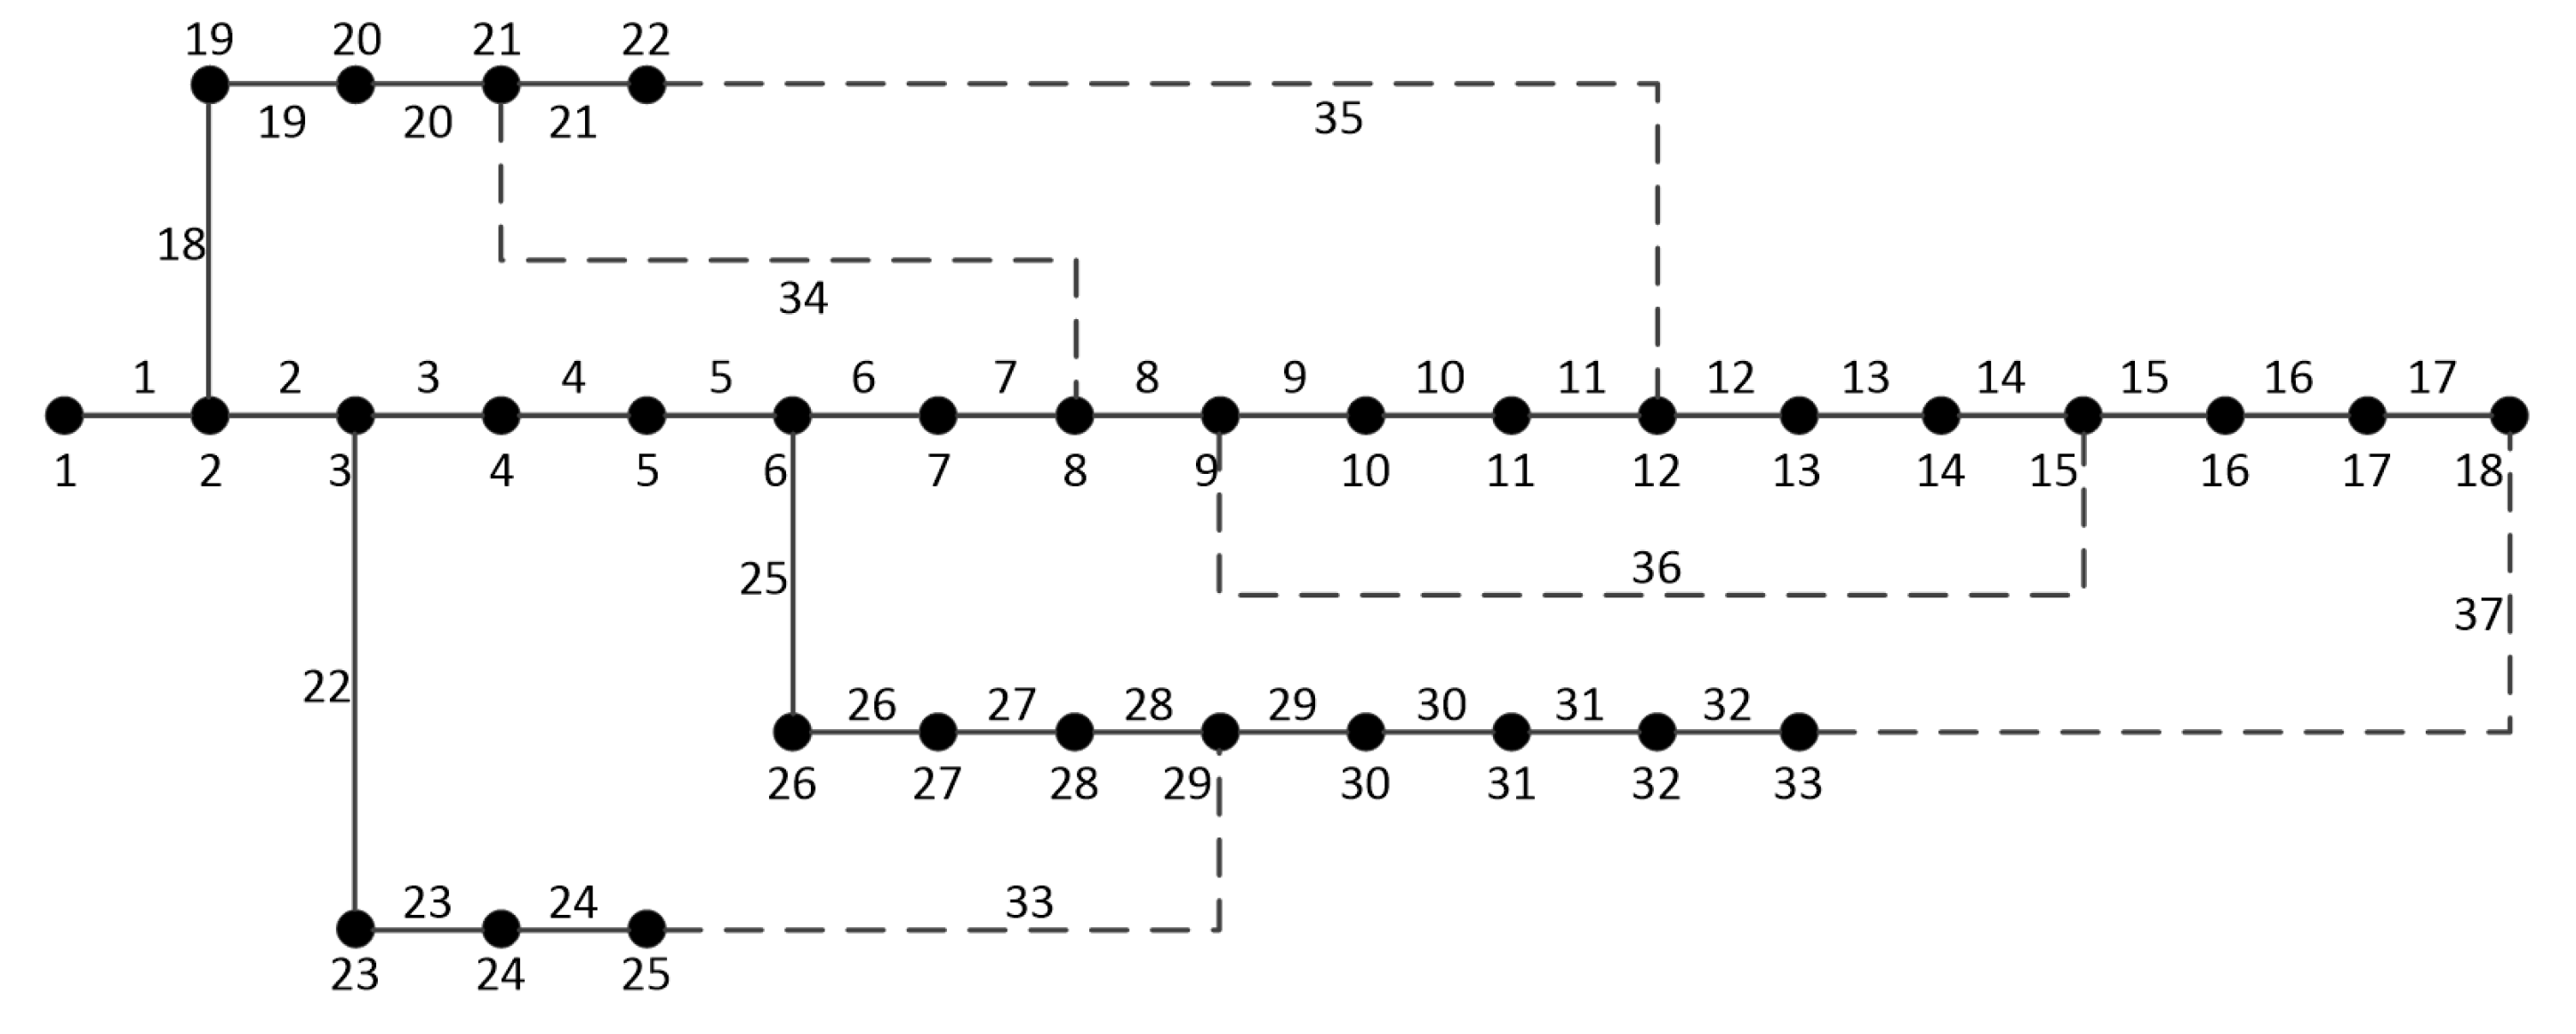
Firstly, the proposed model and improved algorithm were used to solve the DGP problem in the IEEE-33 distribution network. Then, the DGP solution was applied to the DNR problem to combine the two issues. Three photovoltaic distributed generators were added to the experiment, all predicted by DeepSCN for day-ahead forecasting. The algorithm’s termination criterion was set as a maximum of 100 iterations, and other parameters used the data in the test function section. The IEEE-33 system had five tie switches and 33 nodes, with structure as shown in Figure 9; other data can be found in [49]. The performance of MIBWOA in solving the DGP problem was compared with DA [50], SMA [51], SA [52], and WOA [53] under two scenarios: the standard IEEE-33 system and the IEEE-33 system with node load prediction by DeepSCN. Then, the superior performance of MIBWOA in solving the DGP problem was verified.
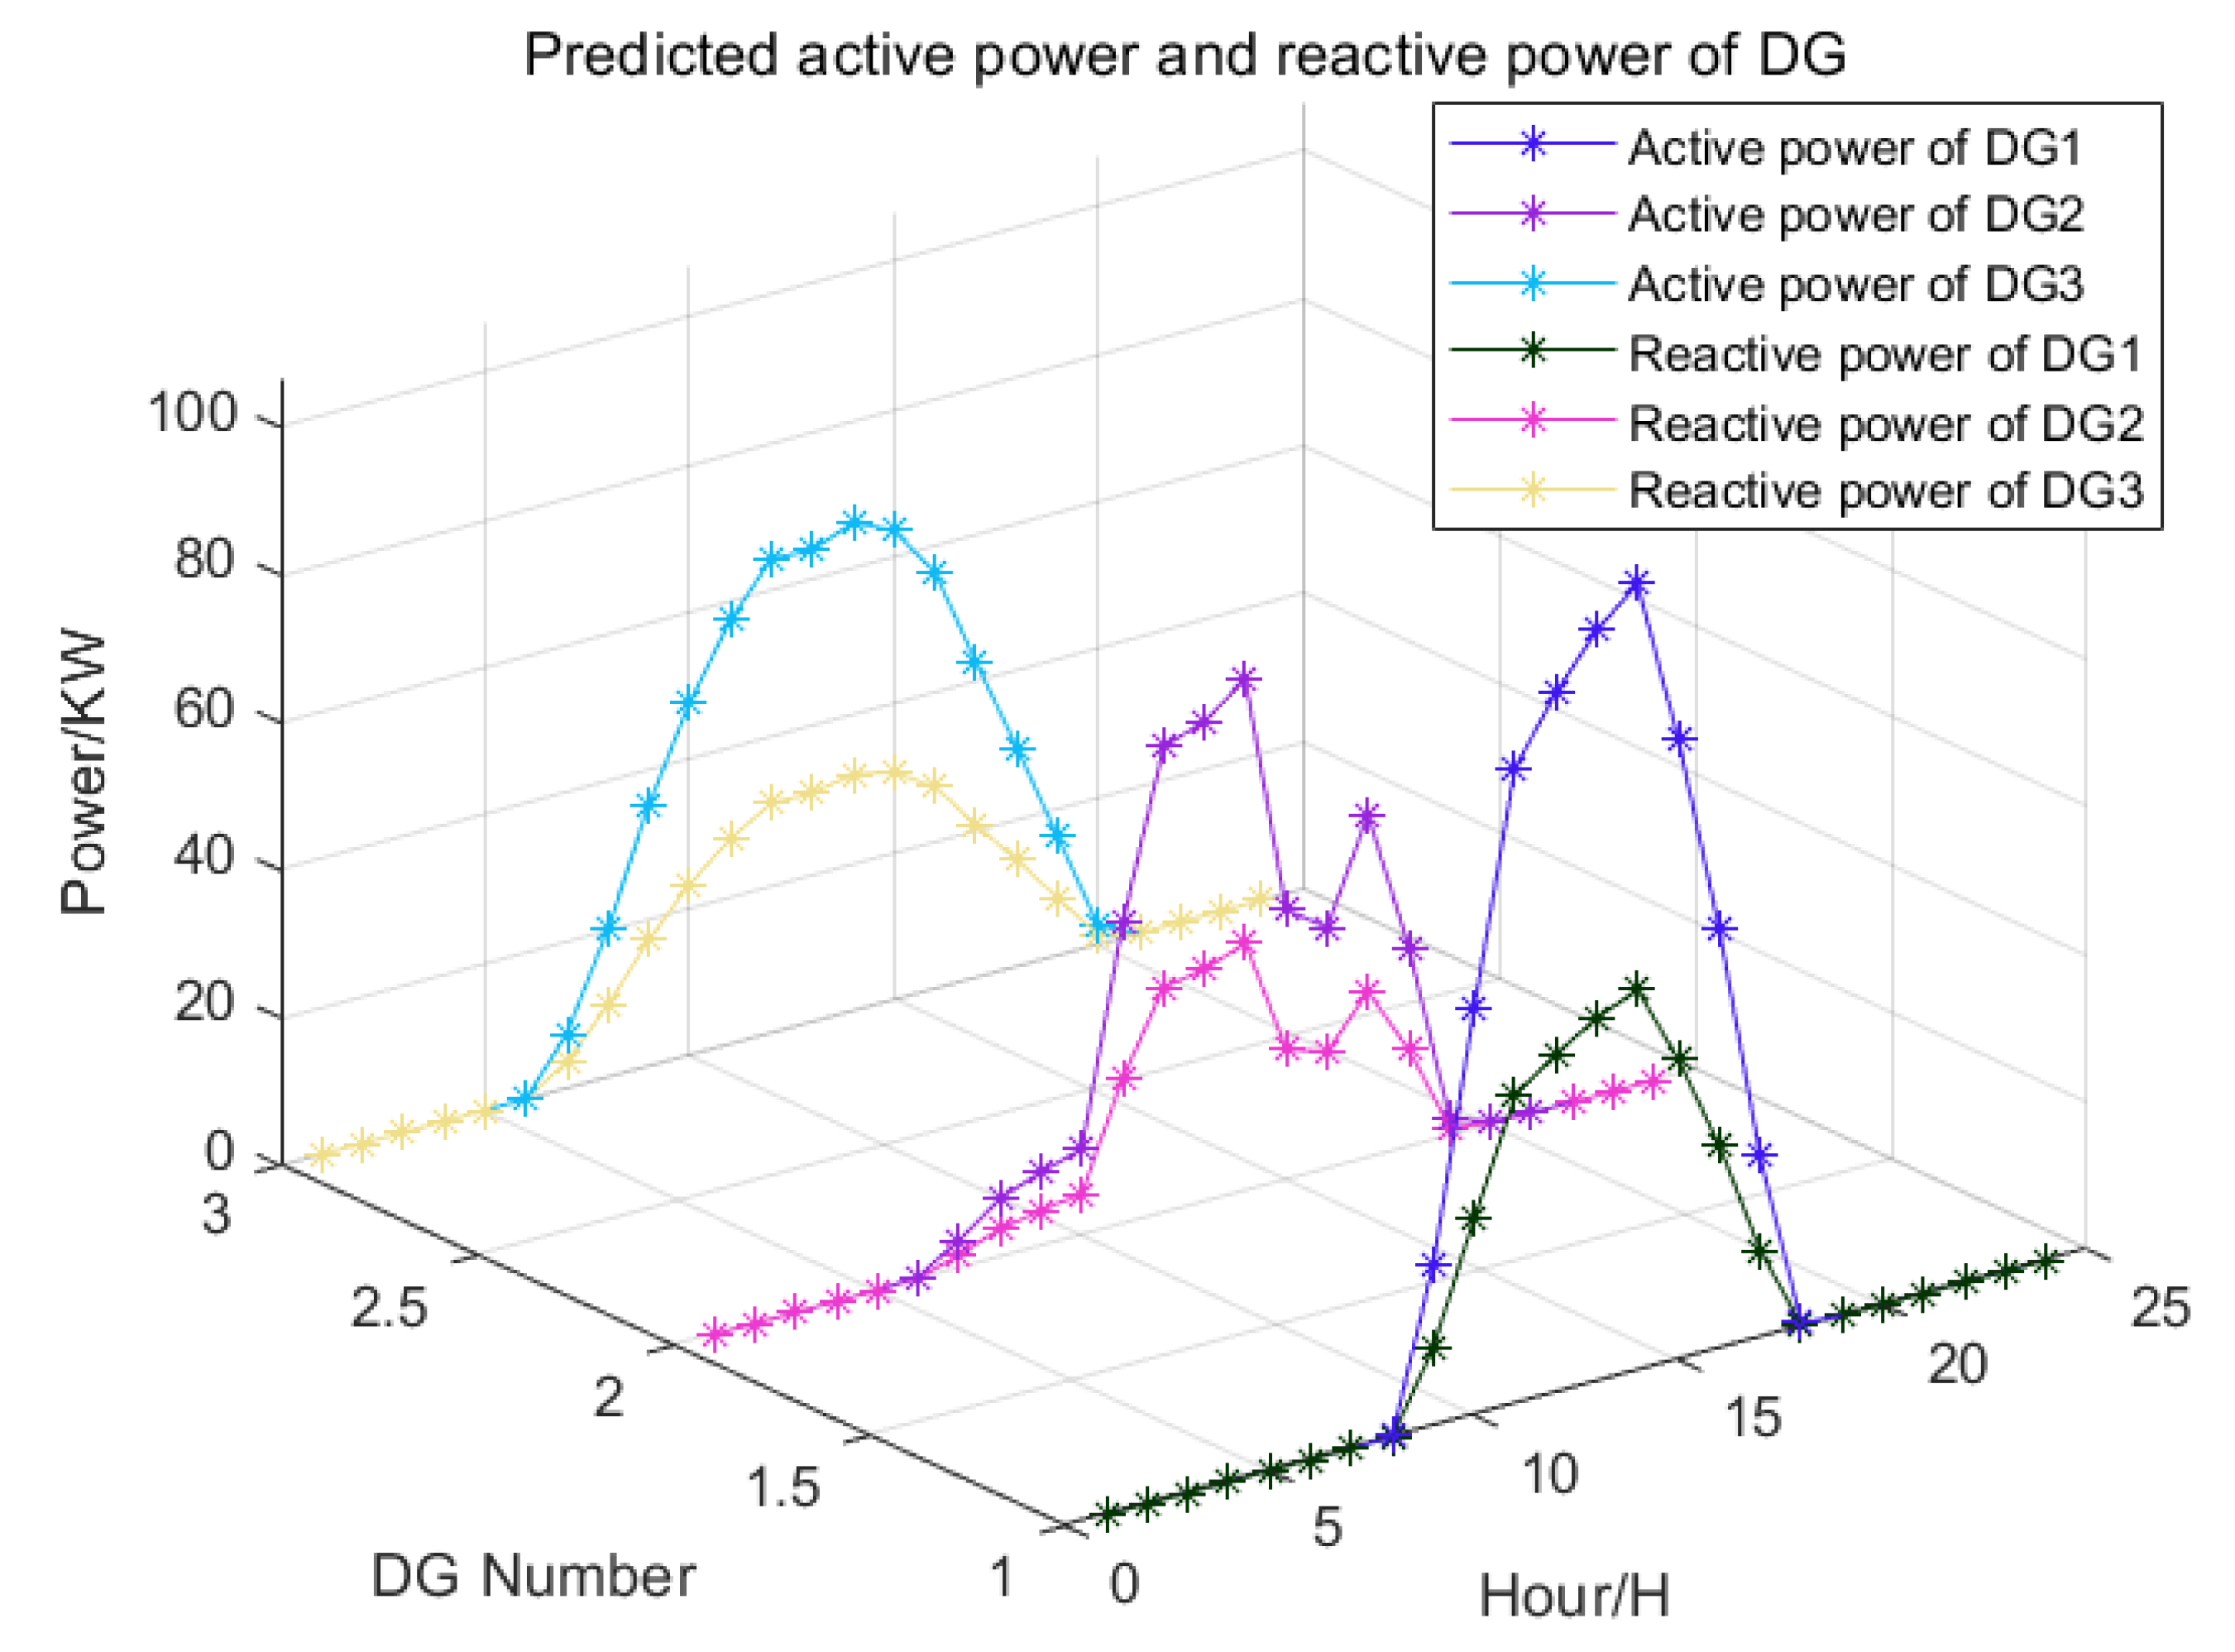
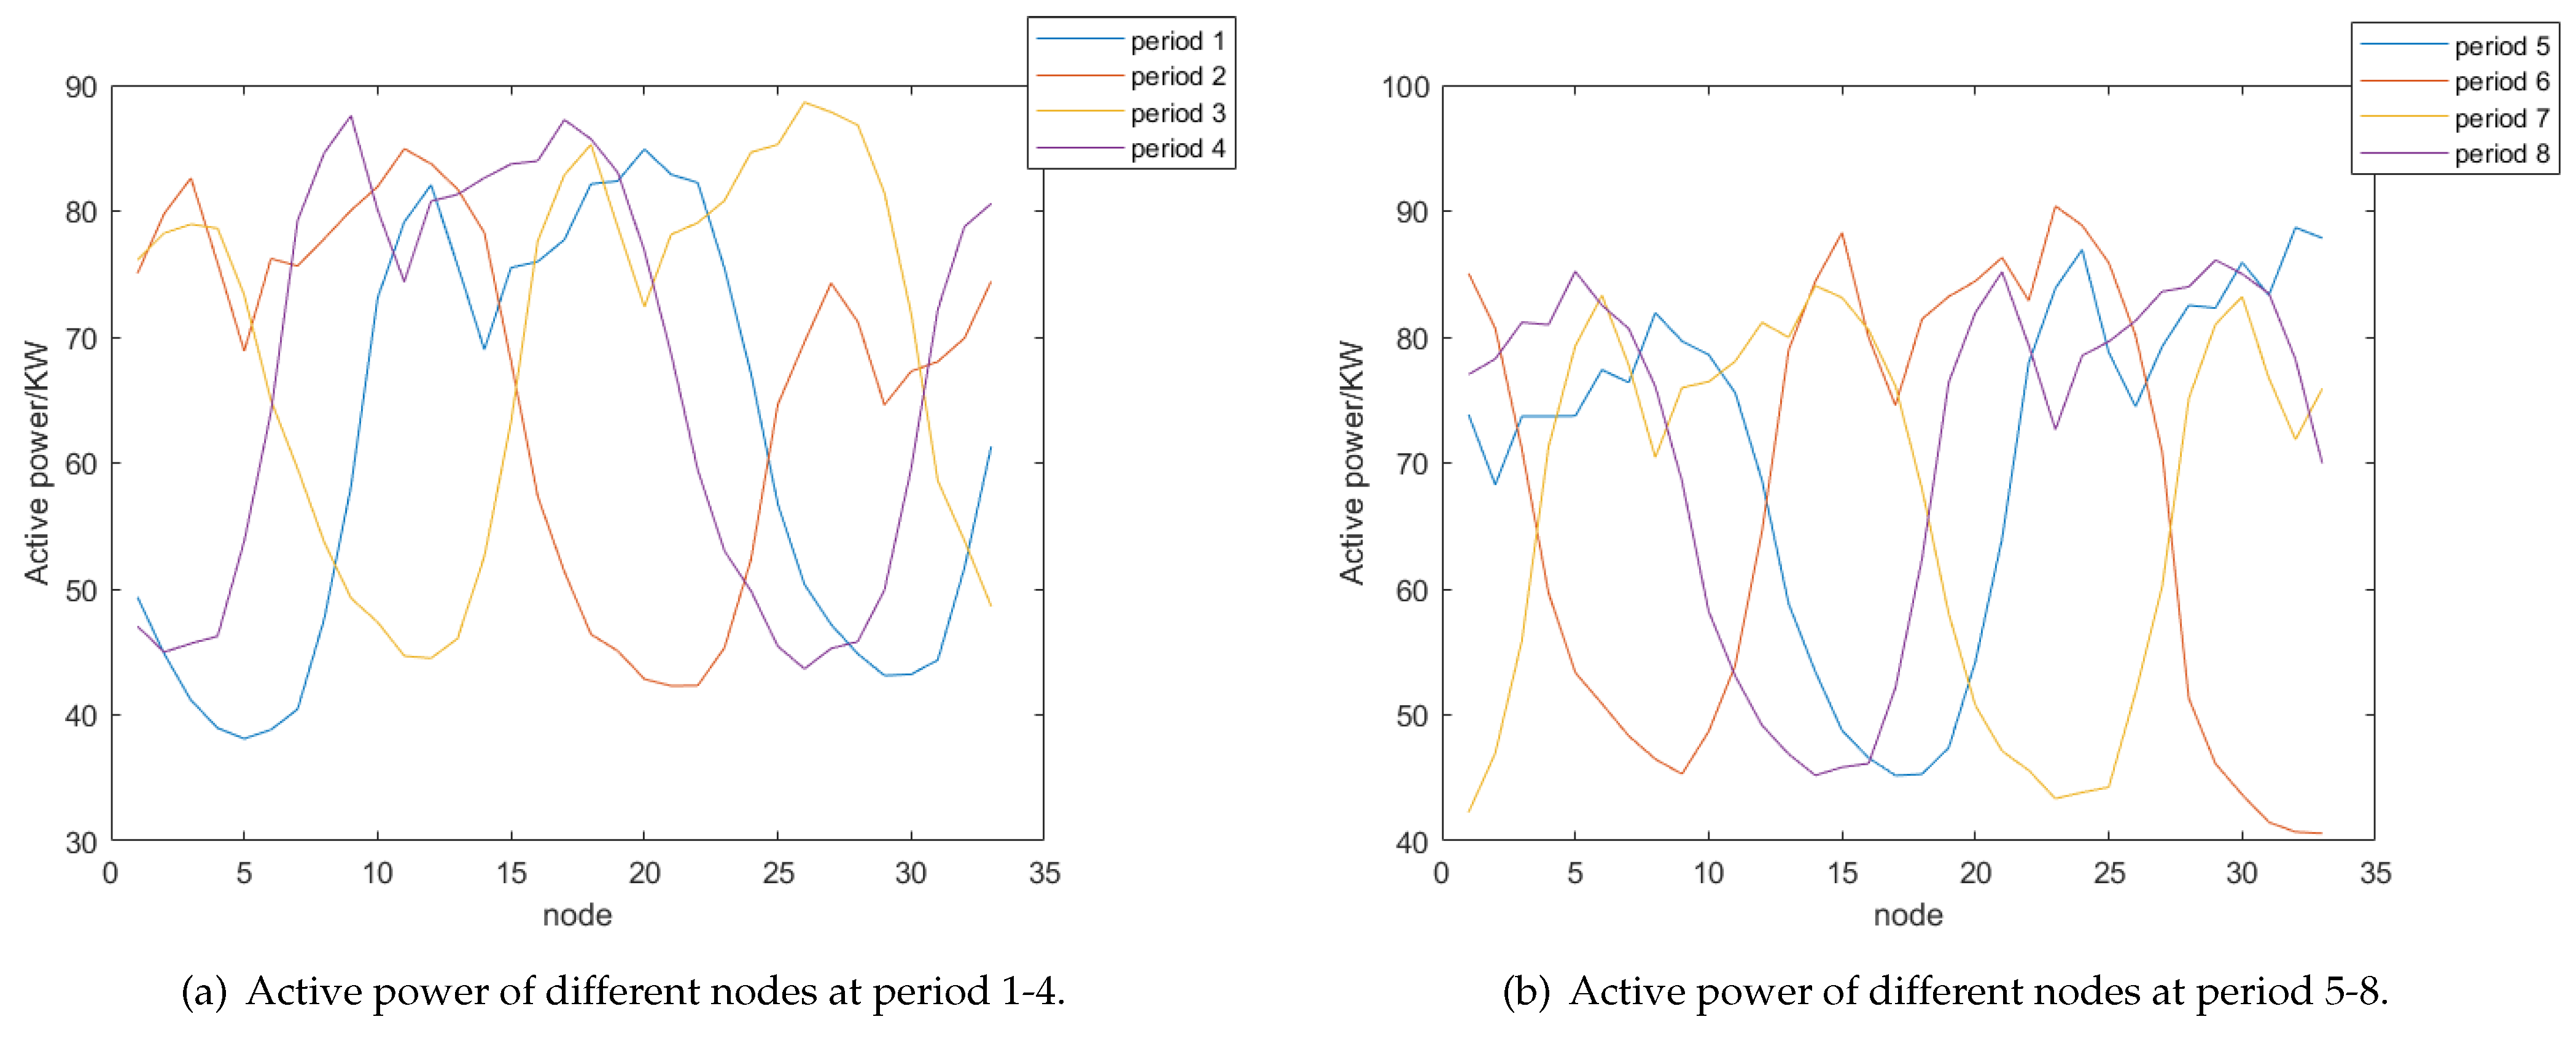
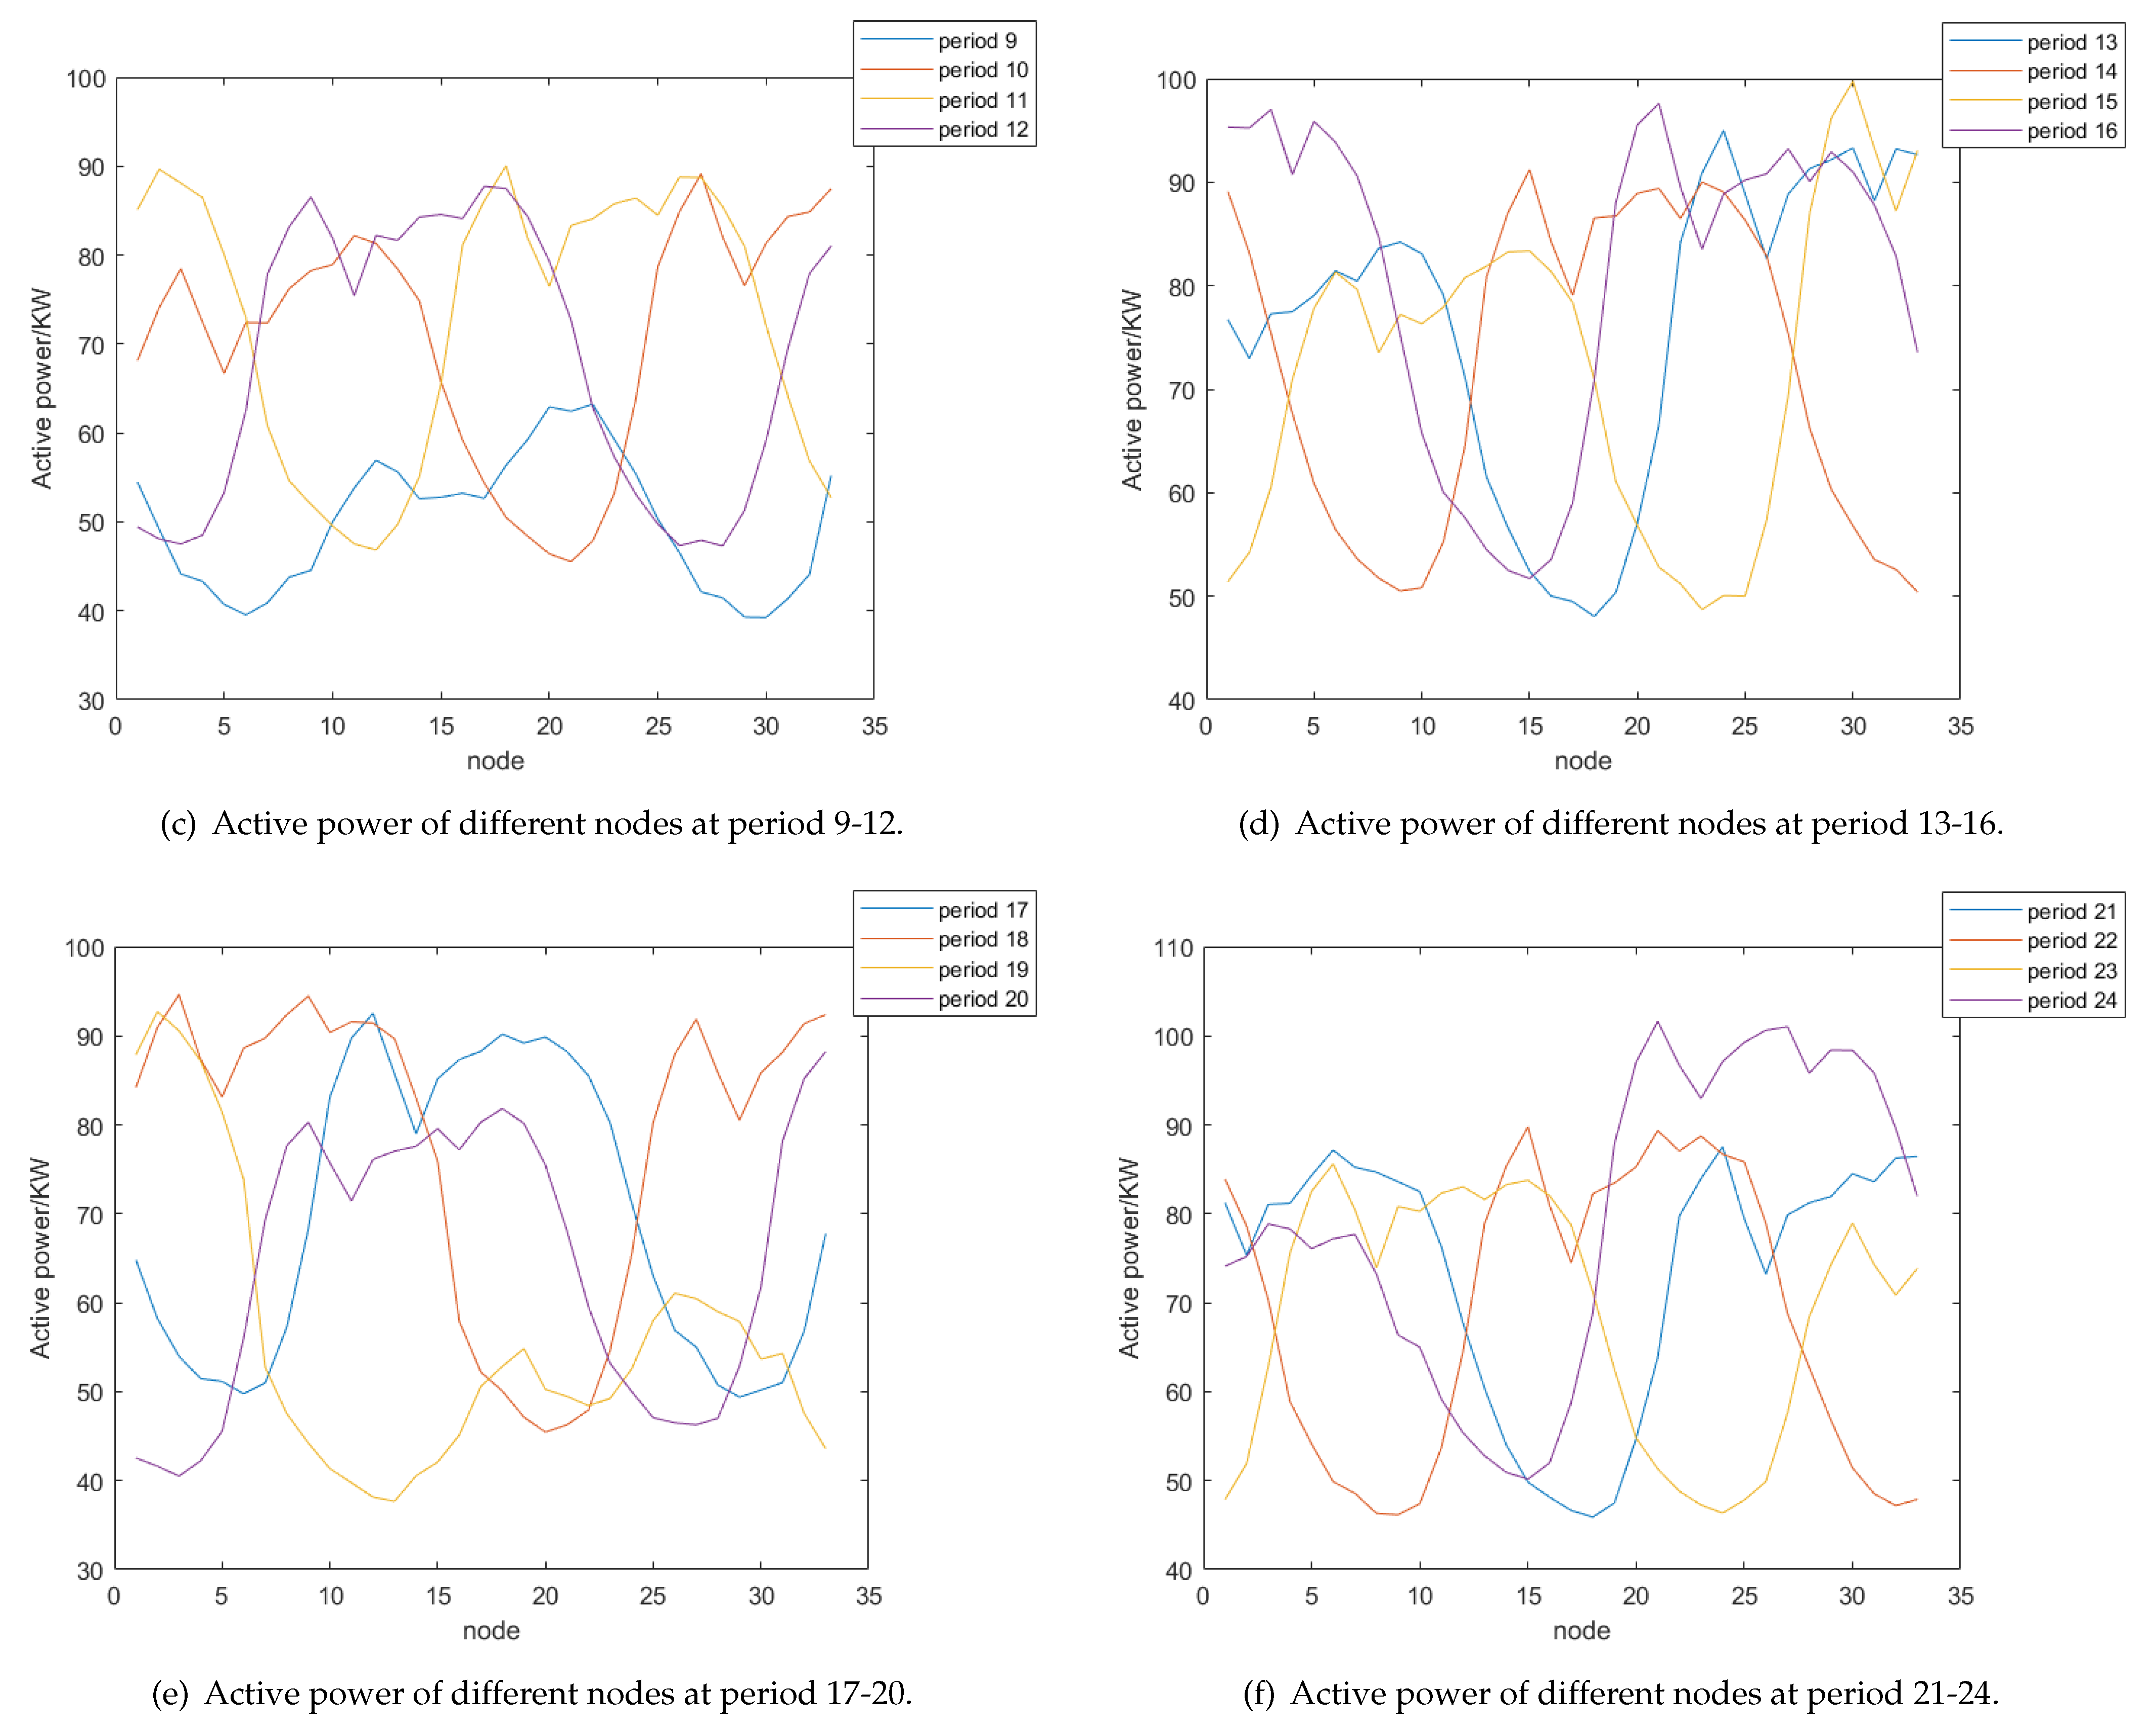
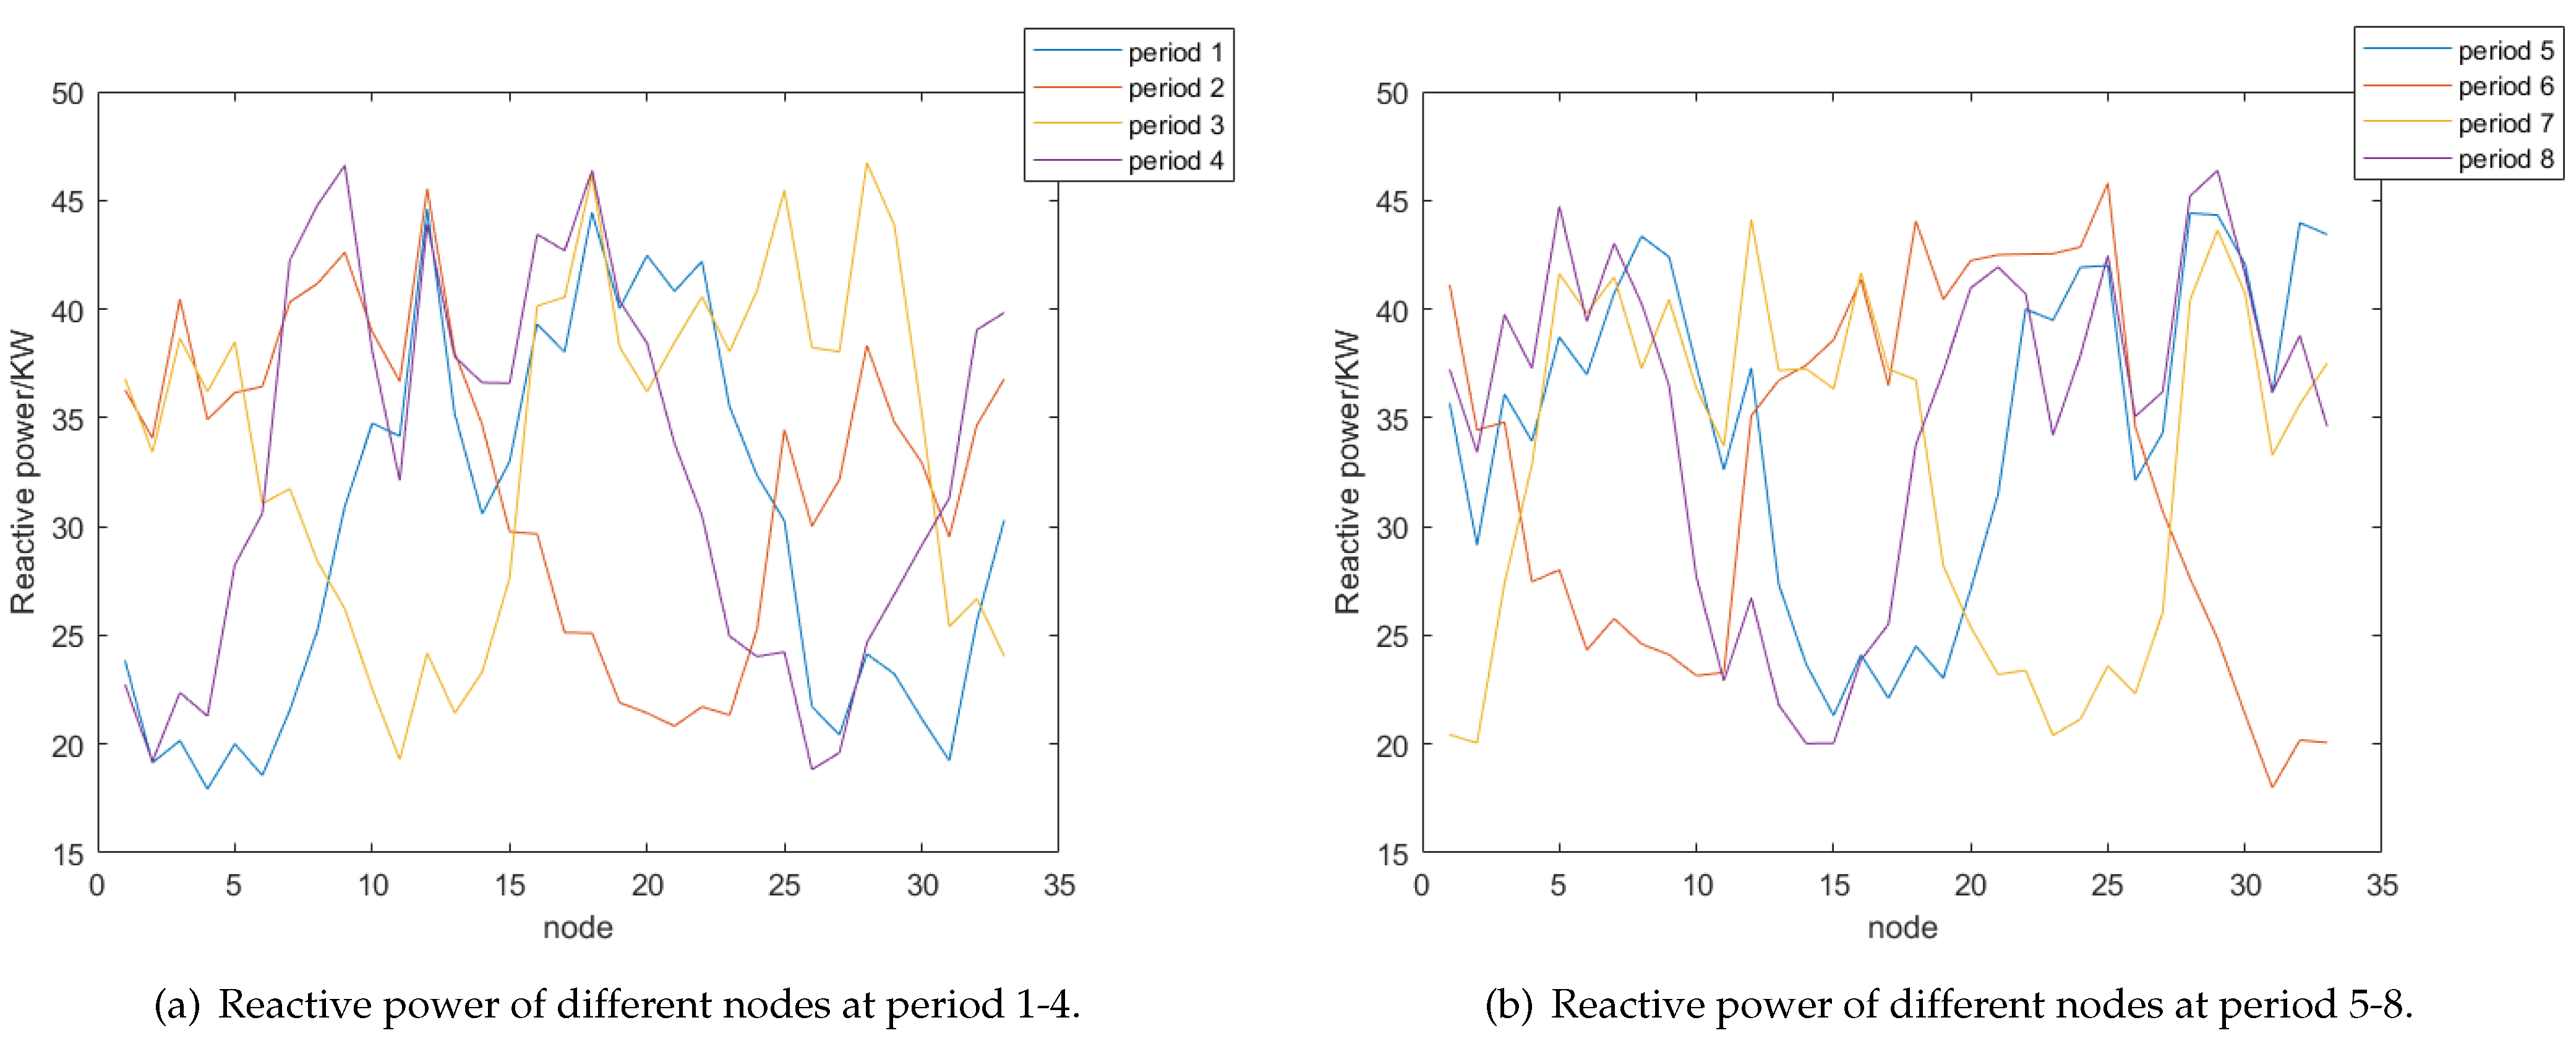
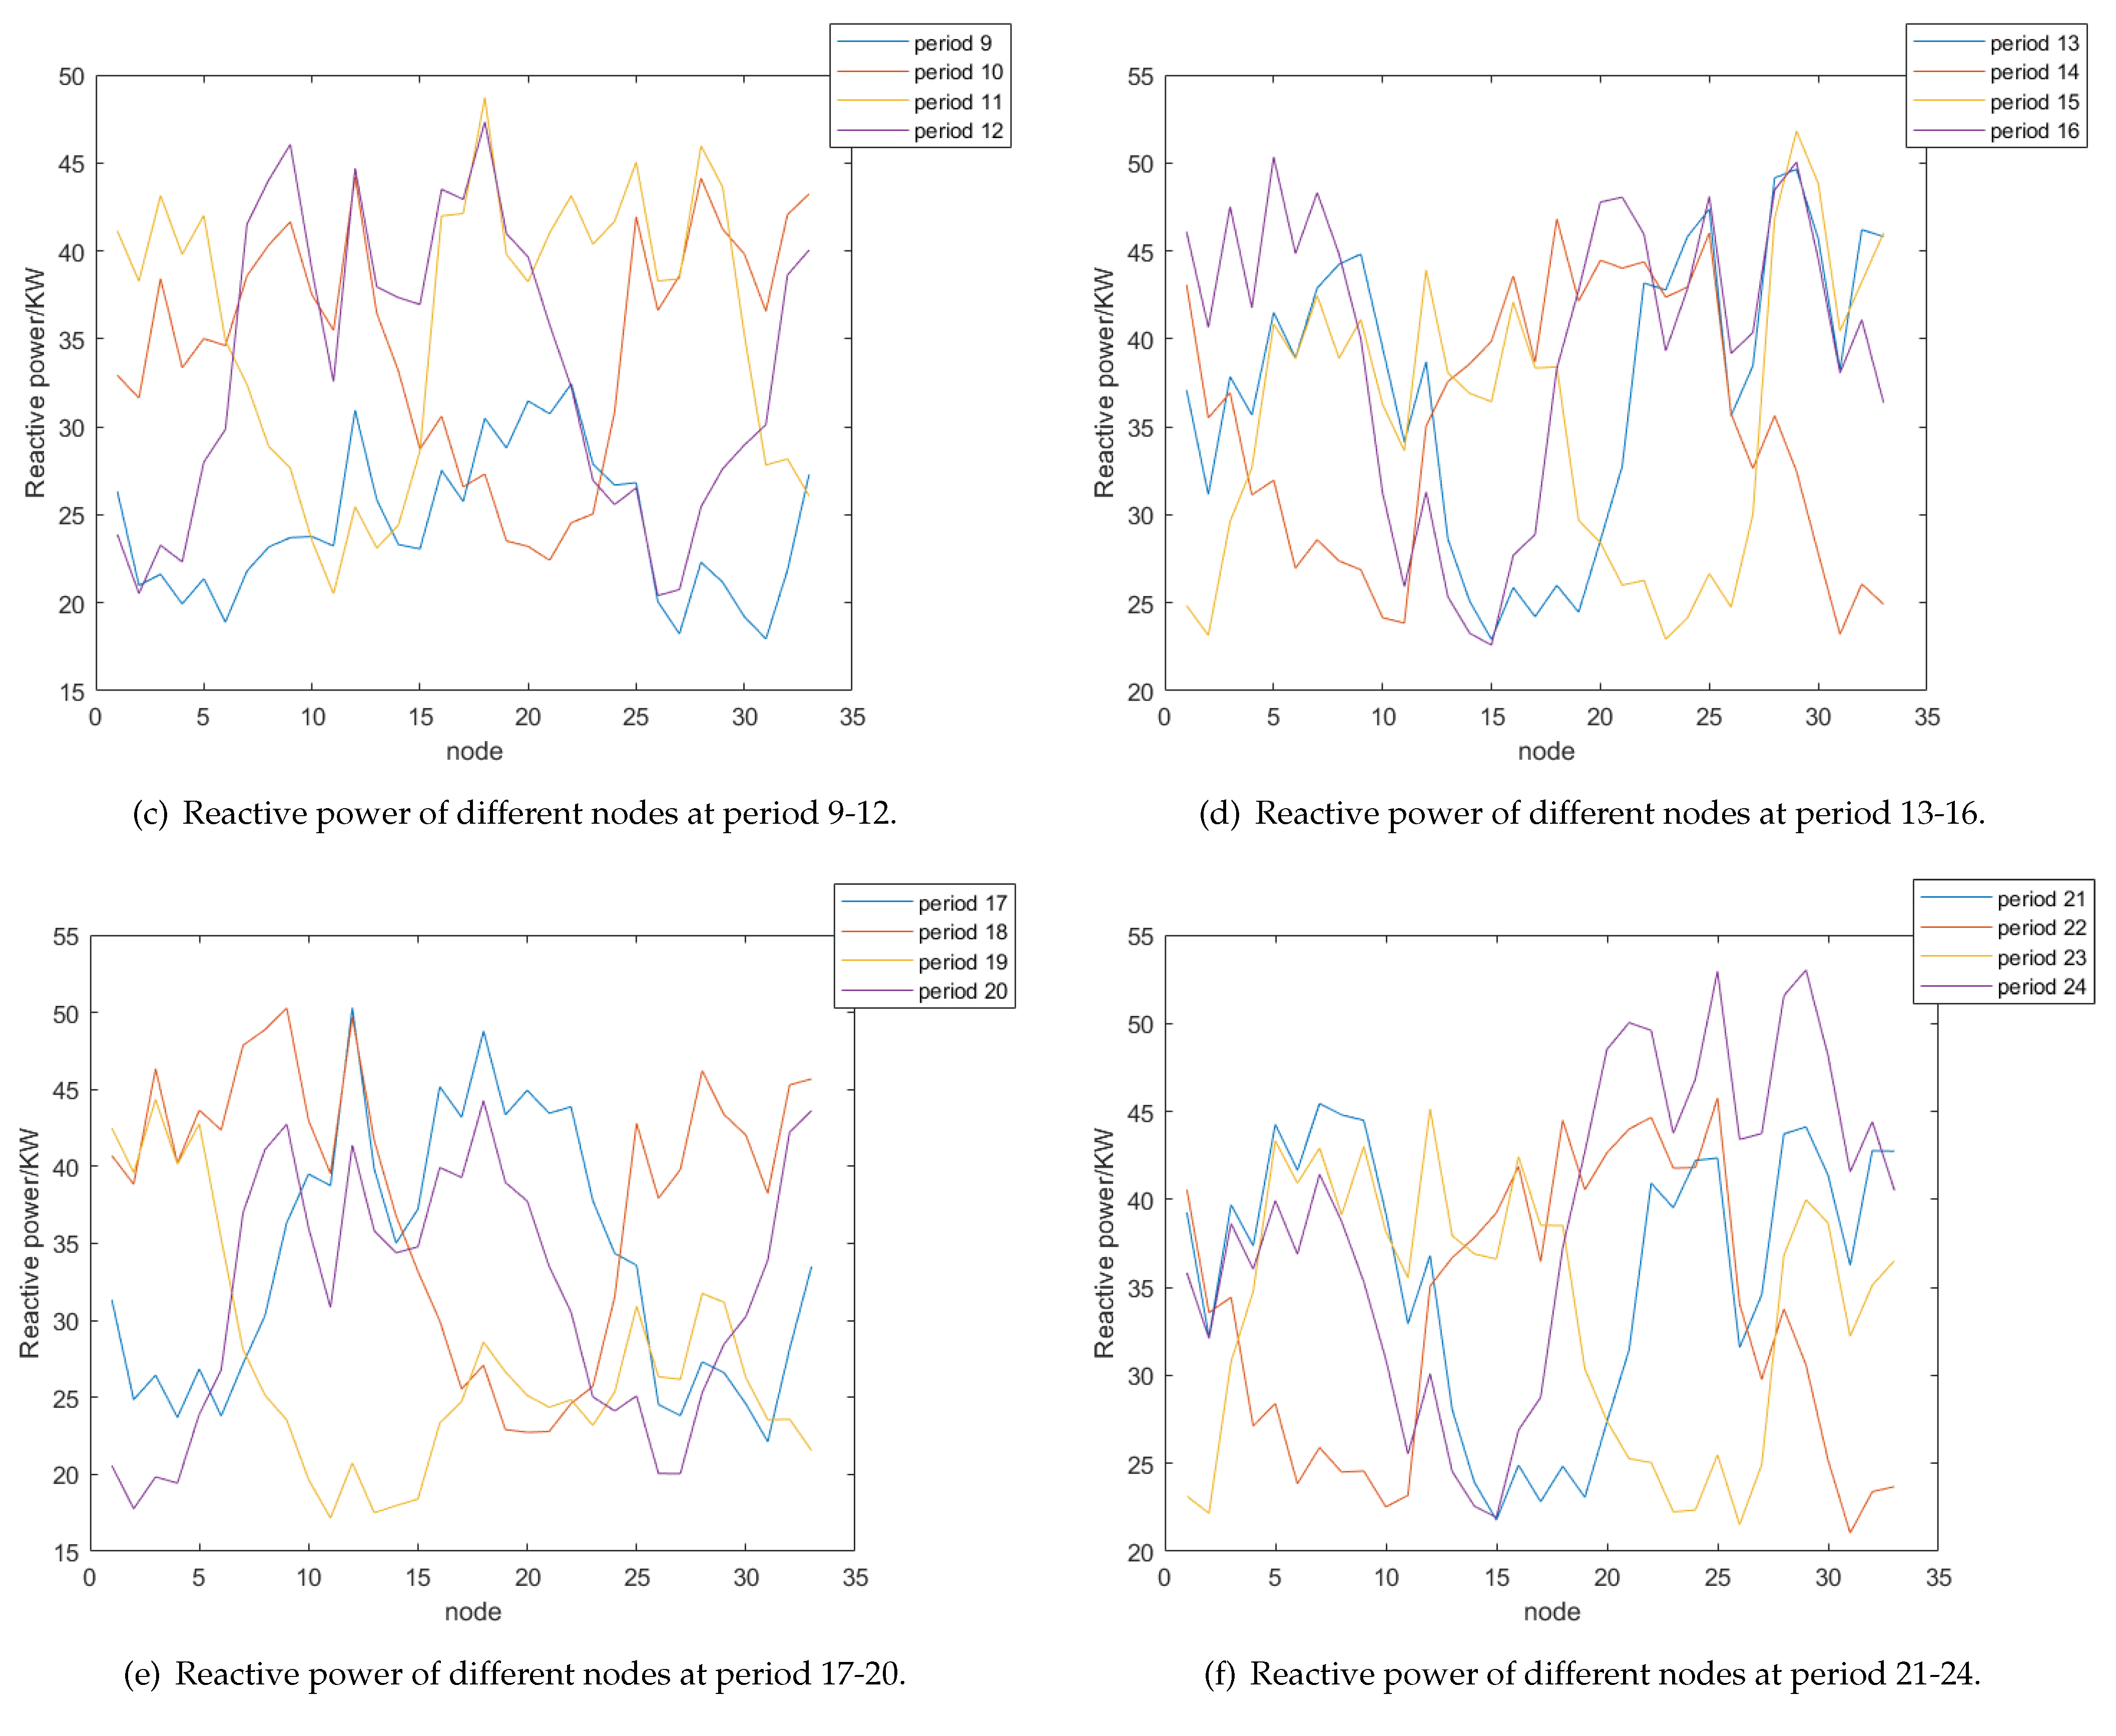
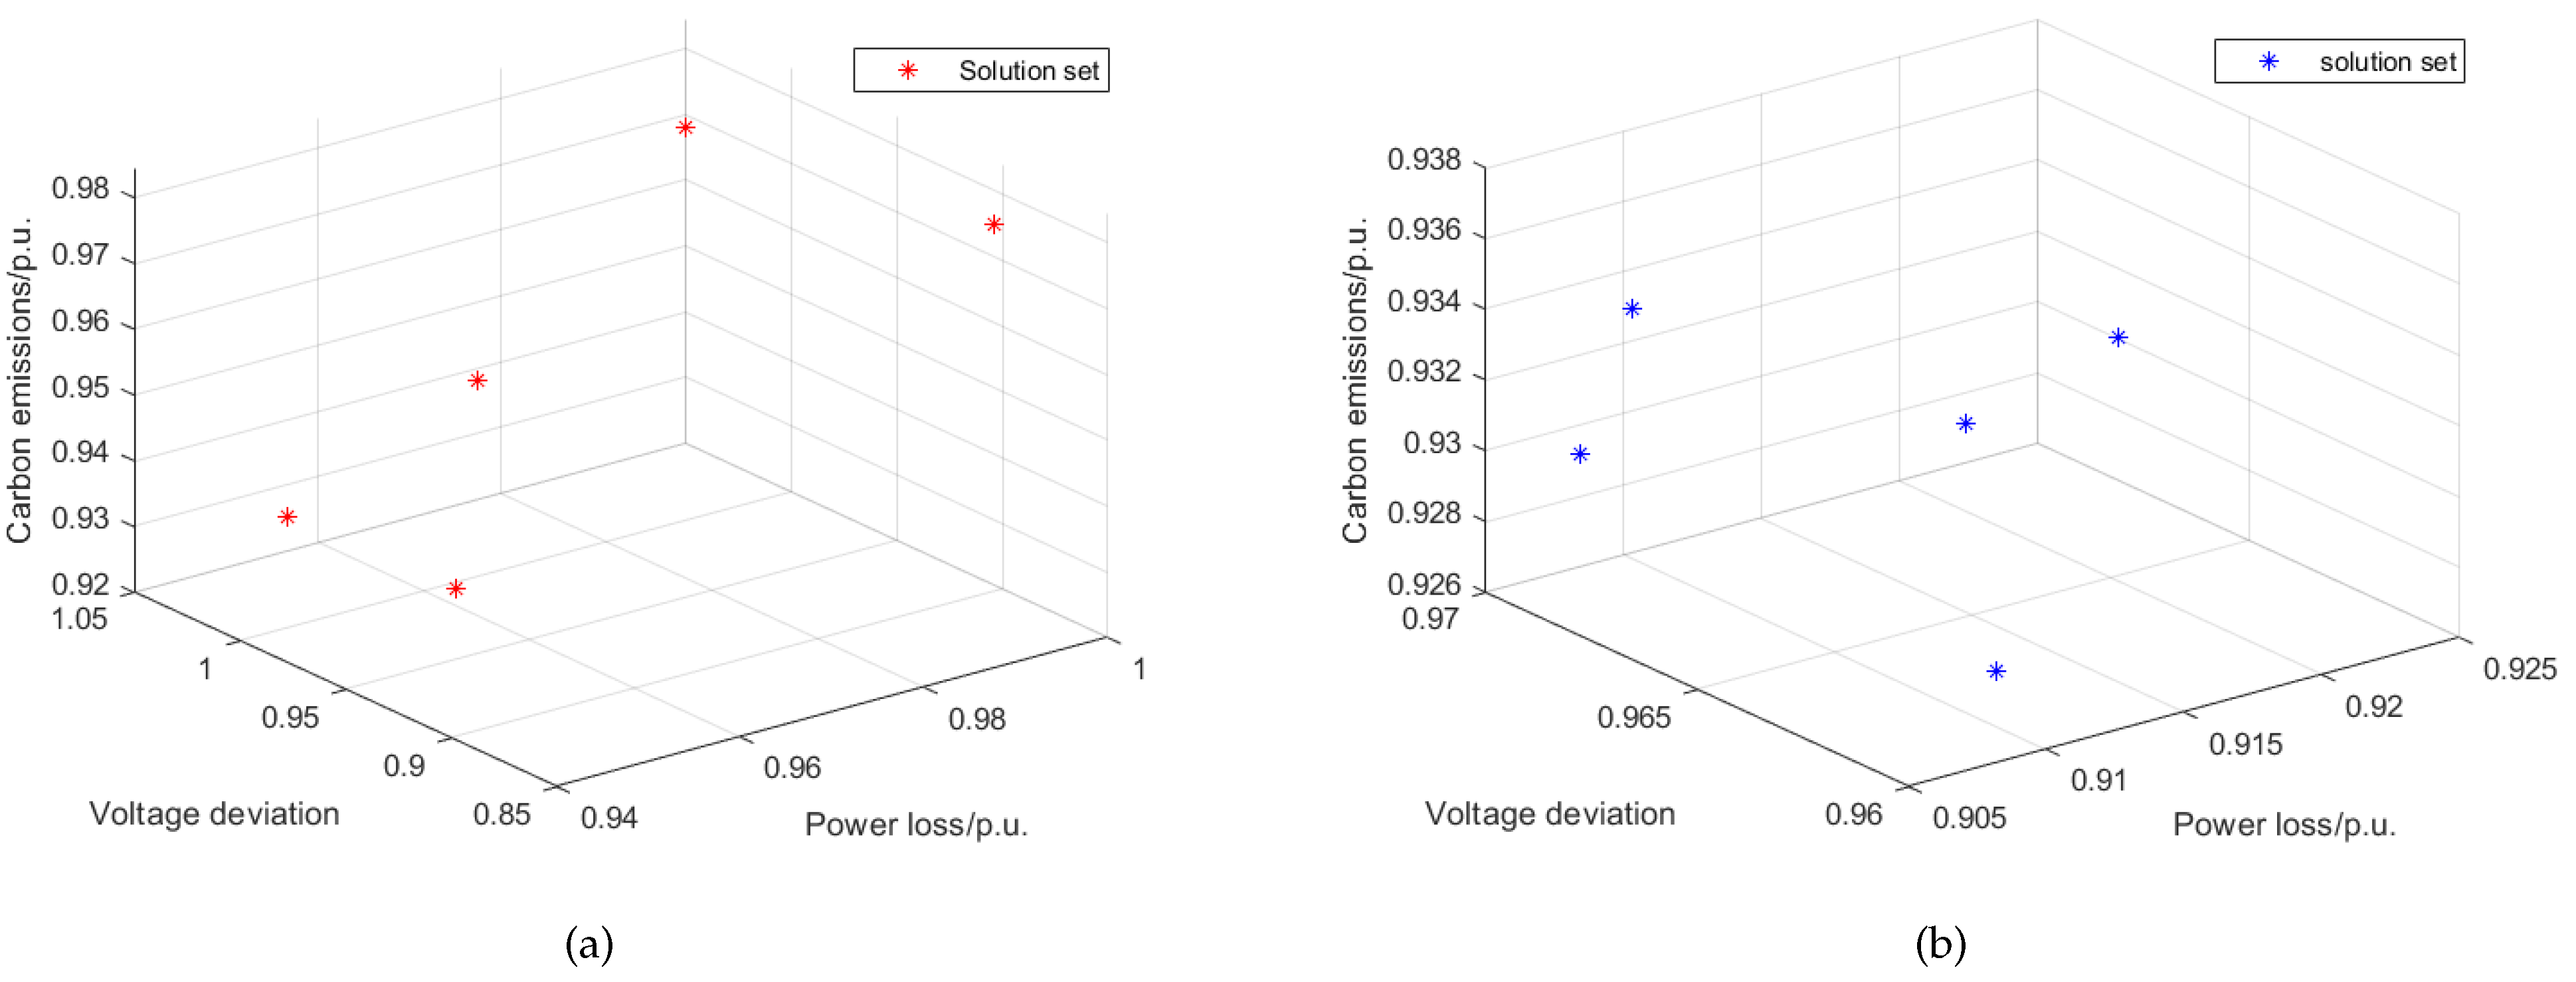
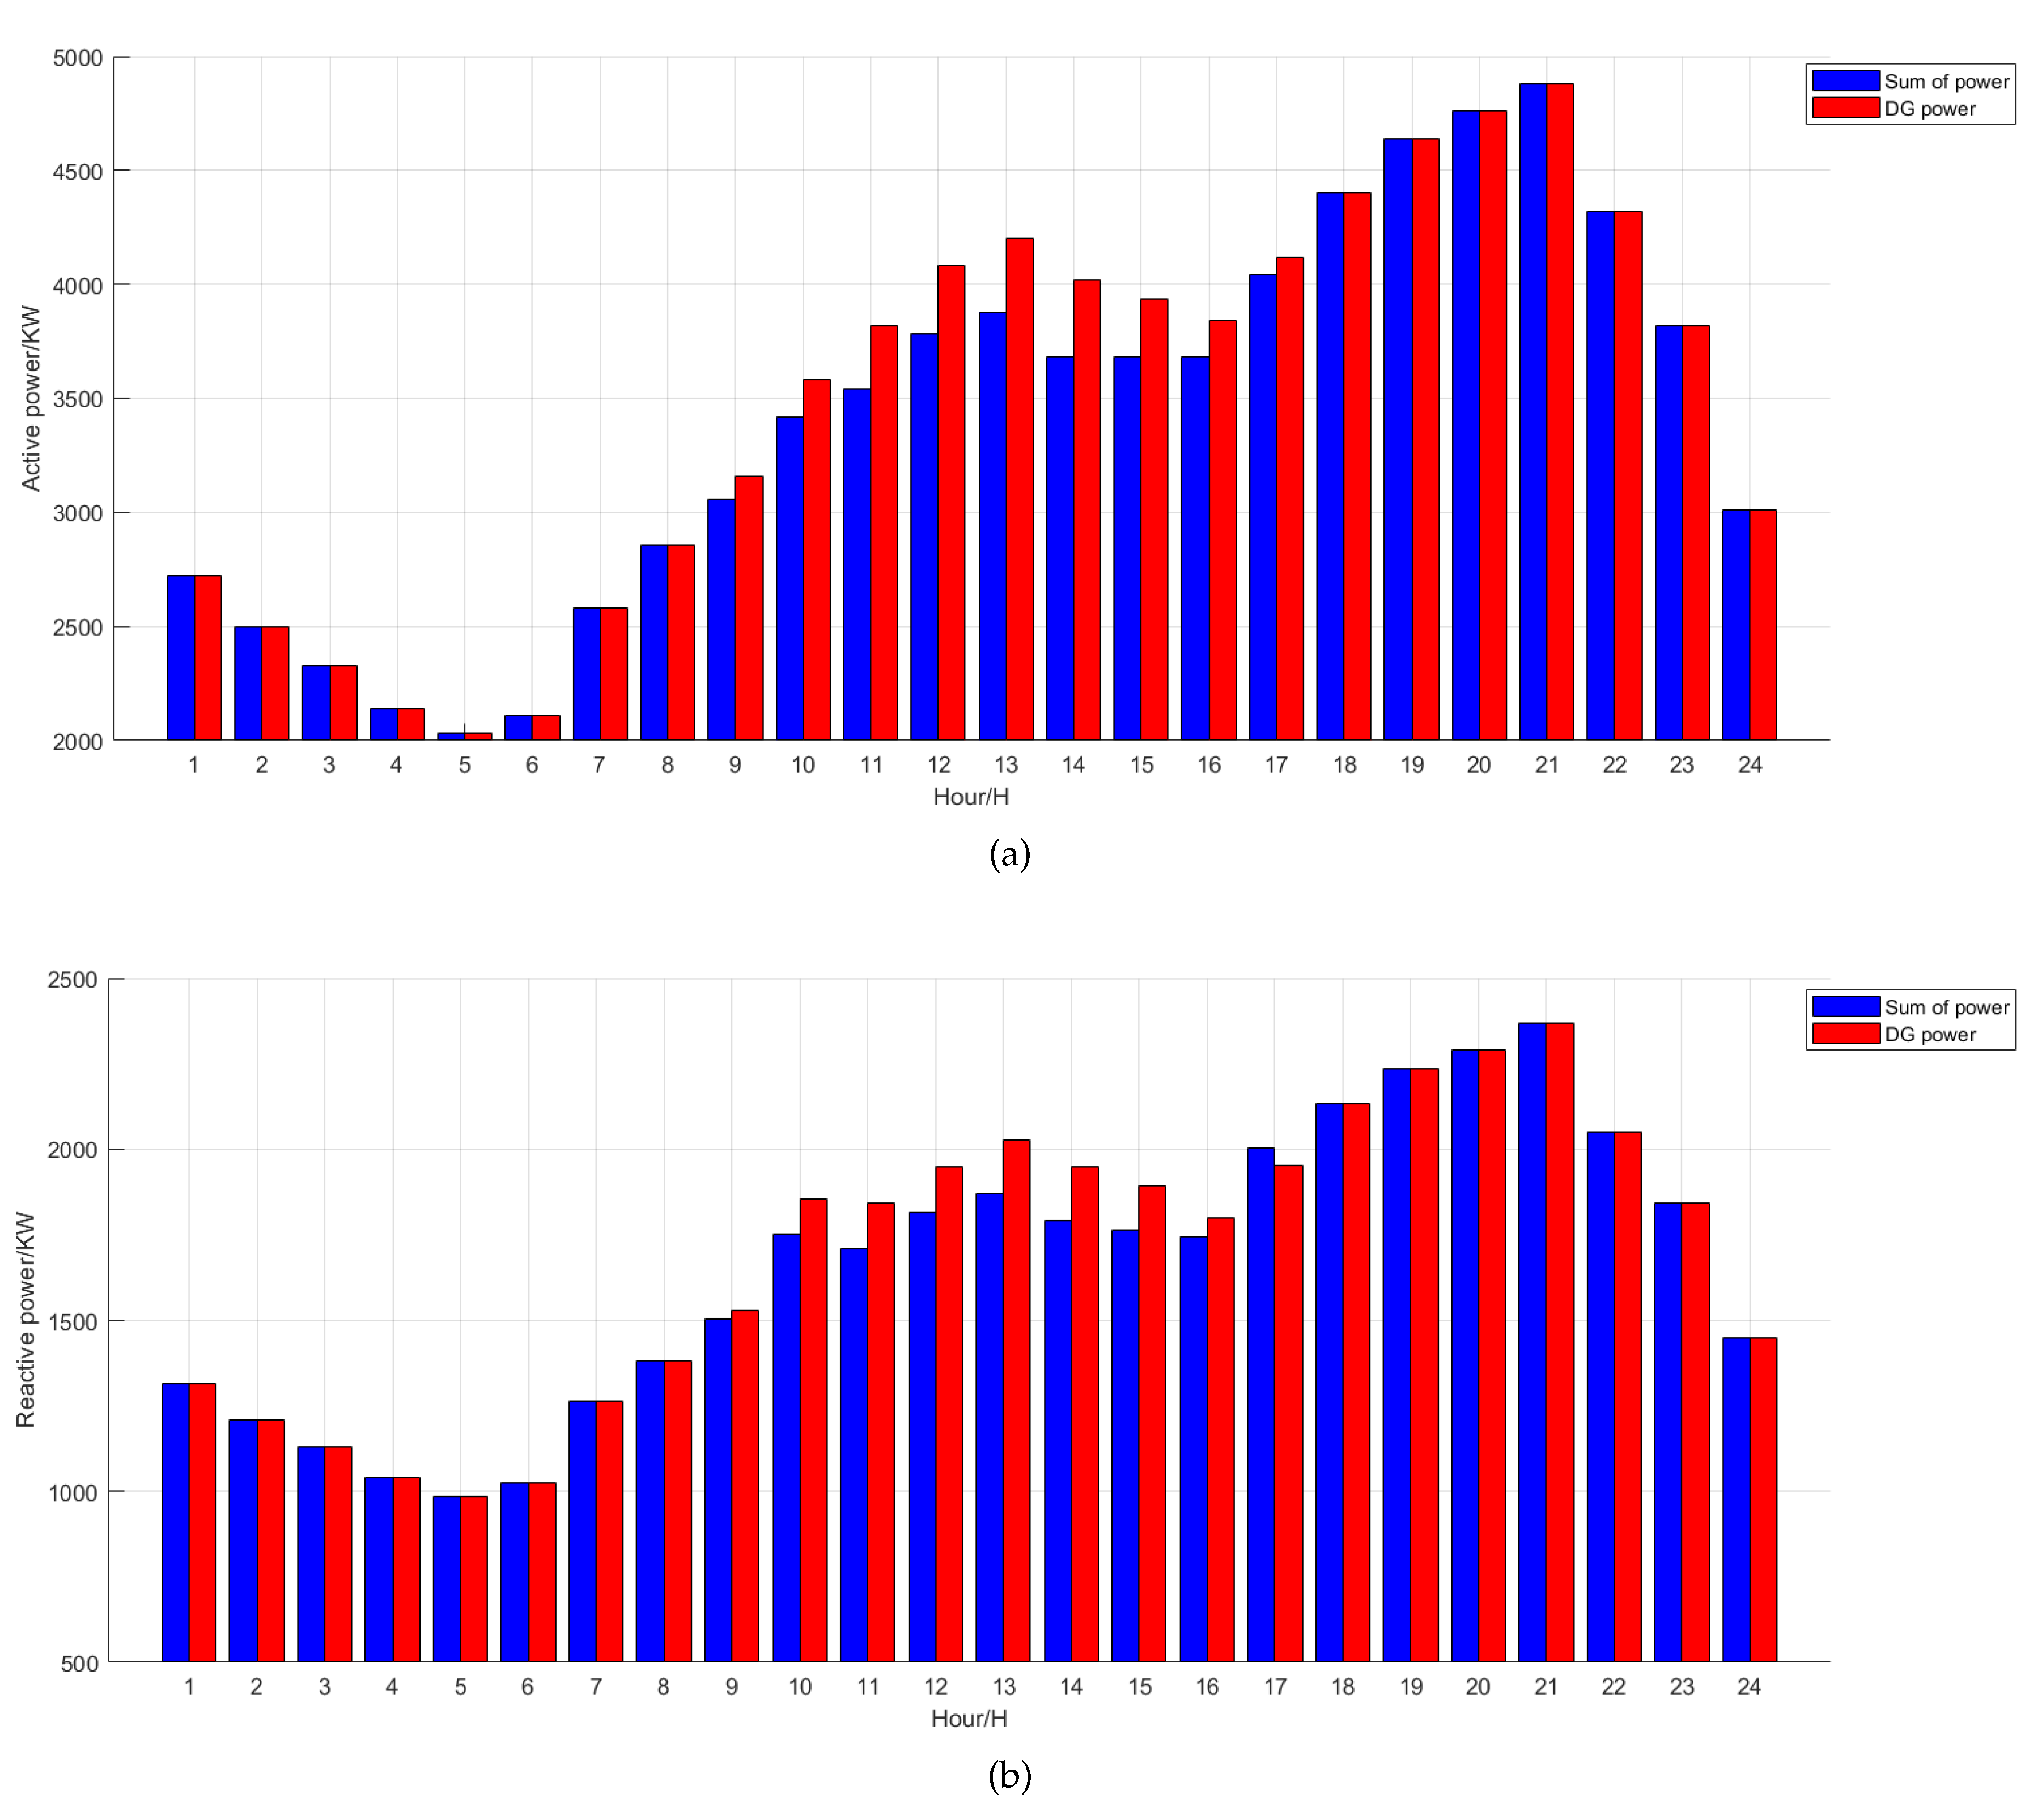
The predicted power of the DG and load by DeepSCN are shown in Figure 10, Figure 11 and Figure 12. The average results of running the algorithm repeatedly 50 times for the two DGP problems without and with load forecasting are shown in Table 4 and Table 5, and the algorithm performance comparison results are presented in Table 6. The DGP Pareto solution sets of IEEE-33 systems with and without load forecasting are shown in Figure 13. The summation of active and reactive power of each node in the distribution network is shown without load forecasting (Figure 14) and with load forecasting (Figure 15), after selecting schemes that placed DG at 13 nodes, 16 nodes, and 17 nodes.
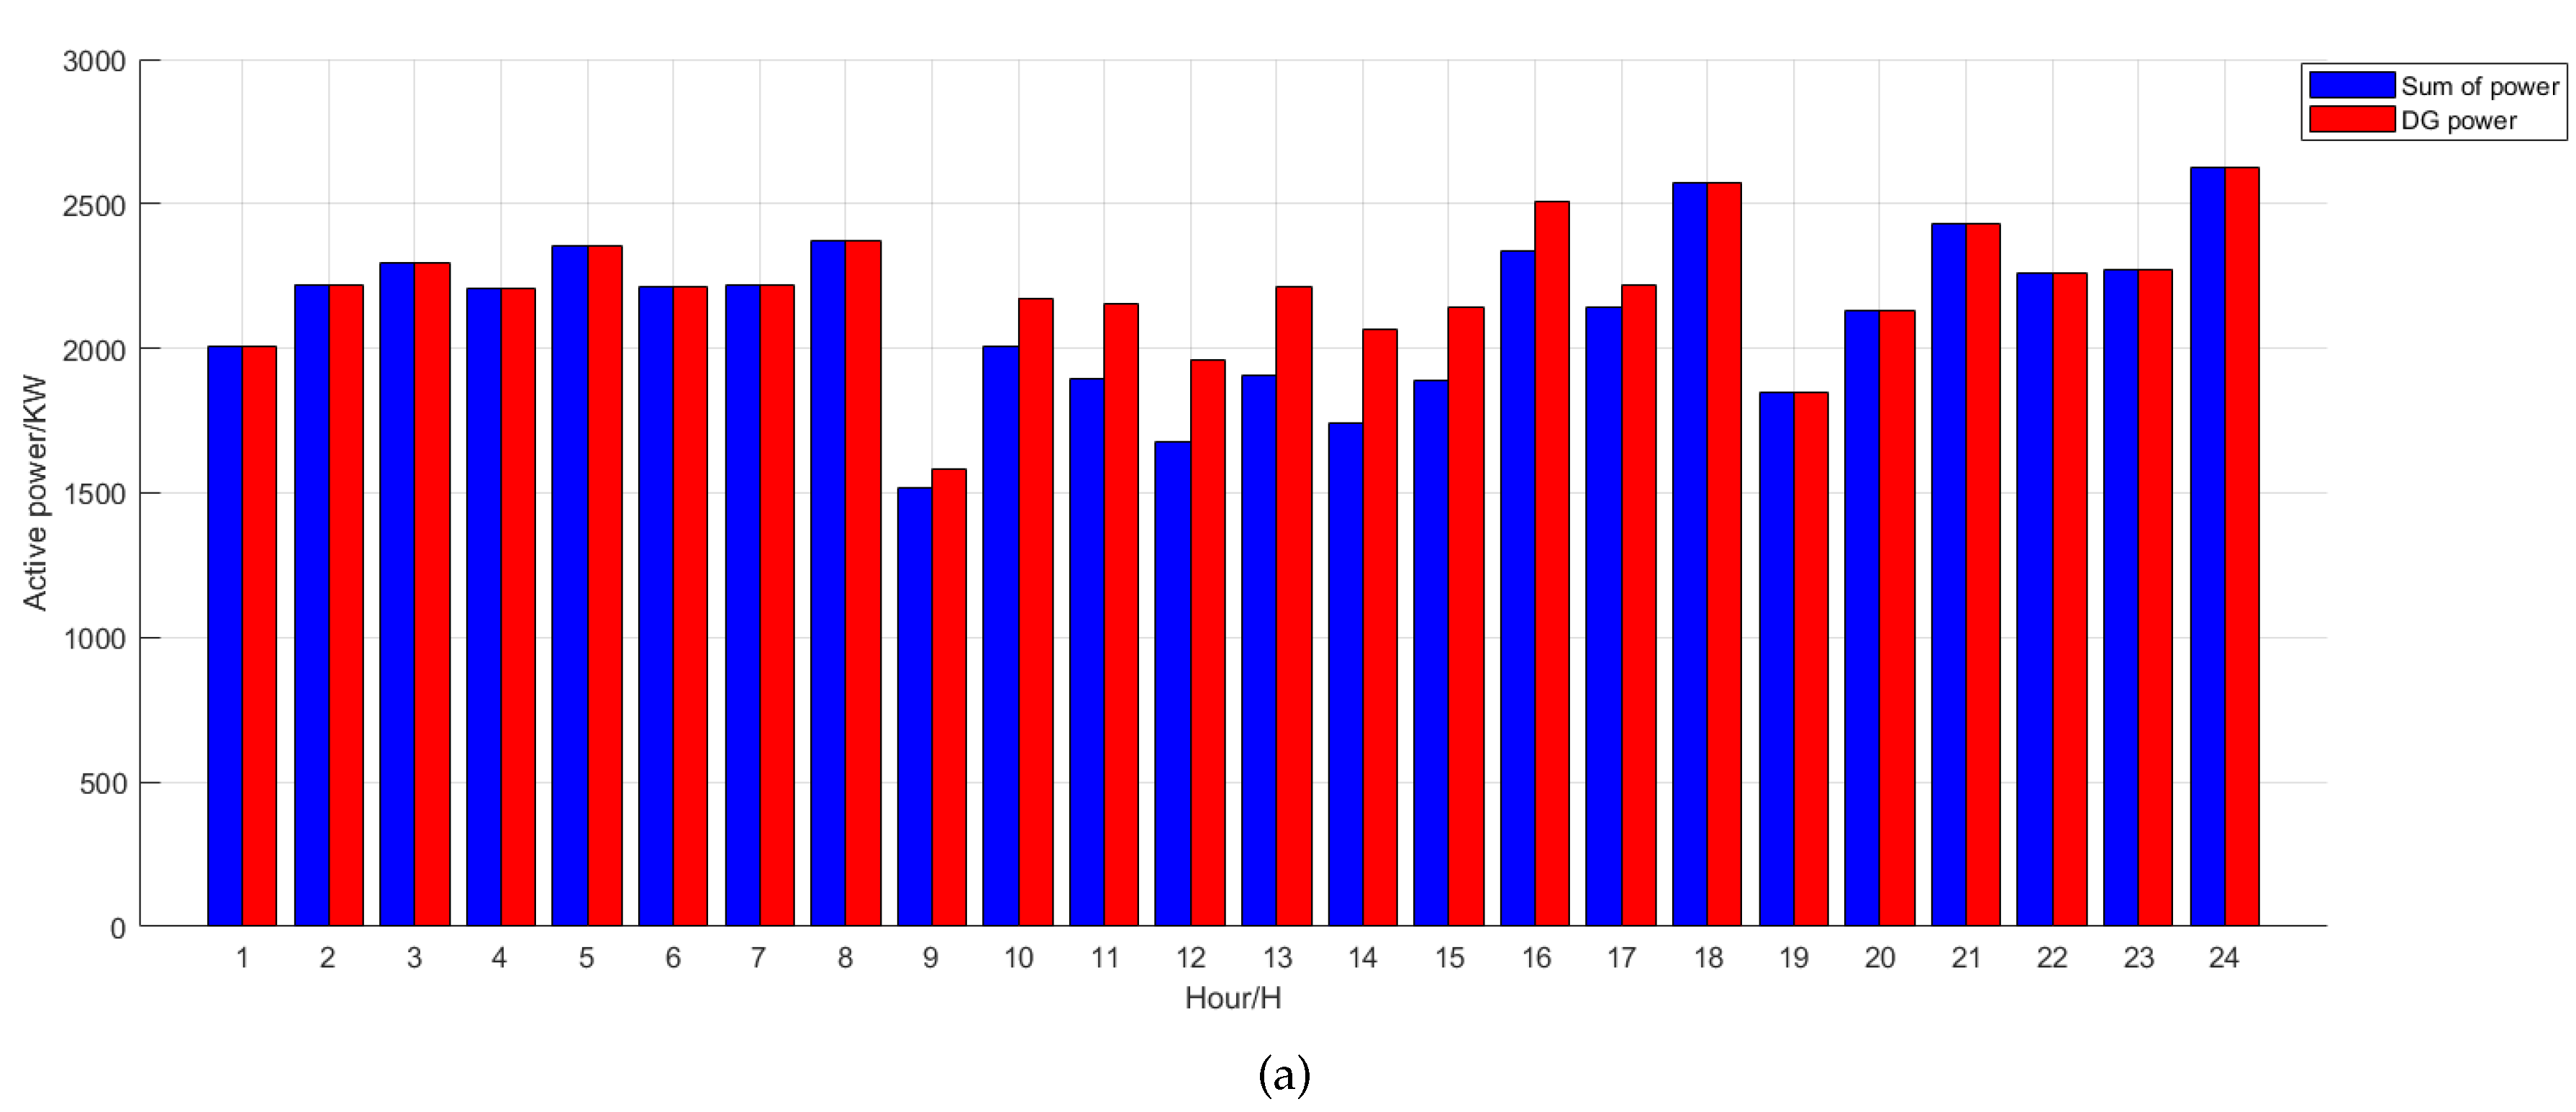
From Figure 10, it is evident that the three distributed generation sources exhibit varying levels of active and reactive power throughout the 24 h period. It is noticeable that photovoltaic generation tends to contribute a significant amount of power during daylight hours, greatly enhancing the operational efficiency of the distribution network. Therefore, in different time periods, the operating status of the distribution network is also different, and this impact on the distribution network cannot be ignored. On the other hand, Figure 11 and Figure 12 illustrate the numerical values of active and reactive power for the loads at different nodes in the distribution network during different time periods. It is common for loads at various nodes to differ from one another and undergo temporal variations, posing a significant challenge for the distribution network.
Table 4 presents the experimental data obtained using the standard IEEE-33 system, which facilitates easy comparison and serves to demonstrate the feasibility of the proposed approach. The scheme provided by MIBWOA has a minimum active power loss of 112.86 kW, a voltage offset of 0.9, and a carbon emission of 84,825 kg. On the other hand, Table 5 showcases the power prediction of distributed generation and node loads using DeepSCN during random periods, thereby enhancing the alignment between experimental results and real-world scenarios. In the most reasonable solution provided by MIBWOA, the active power loss is 63.57 kW, the voltage offset is 0.96, and the carbon emission is 74,289 kg. It is evident that MIBWOA outperforms other algorithms in terms of the three objective functions of the proposed solution set in both cases. On the other hand, Table 6 provides a comparison of algorithm performance. MIBWOA only needs three iterations to find the optimal solution, while other algorithms need no fewer than ten iterations to converge. The search speed of MIBWOA is 11.32 s, which is very fast compared with other algorithms. MIBWOA can accurately optimize, while the local optimal solutions obtained by other algorithms are unstable. This shows that MIBWOA can rapidly converge to the optimal solution within a very limited number of iterations for the DGP problem. Furthermore, it guarantees the avoidance of other local optima. This demonstrates the excellent adaptability and optimization ability of MIBWOA for multi-objective discrete problems such as DGP.
Figure 13 shows the Pareto solution space distribution of the standard IEEE-33 system and the IEEE-33 system with predicted data using DeepSCN. They clearly display the states of each solution. Figure 14 analyzes the summation of active power at different nodes during different periods, while Figure 15 analyzes the reactive power. It can be observed that, when the distributed generation is in operation, there is a significant increase in the summation of node powers, which undoubtedly has a positive impact on the distribution network without altering the input side.
The above results are evidence of the exceptional search capacity of MIBWOA for addressing the DGP problem, which can rapidly yield superior solutions relative to other algorithms. This achievement serves as a solid basis for subsequent investigations of DNR problems.

5.3. IEEE-33 Distribution Network Reconfiguration Experiment

The proposed distribution network model and improved algorithm were applied for simulation and verification by the IEEE-33 system. The algorithm’s termination criterion was set as a maximum of 100 iterations, and the remaining parameters were the same as those in the test function section. The IEEE-33 system had five tie switches and 33 nodes, DeepSCN predicted the node load, and other parameters can be found in [49].
Dynamic DNR can be decomposed into numerous static DNR, with the main differences being the computation complexity and whether the algorithm runs continuously in real time. Firstly, static DNR was used to verify the superiority of MIBWOA over several comparative algorithms that were converted into multi-objective ones using Pareto theory, including standard BWOA, SHO (jellyfish search algorithm proposed in [54]), BOA (butterfly optimization algorithm) [55], and the gravitational search algorithm proposed in reference [56], thus demonstrating the superiority of MIBWOA in solving the DNR problem.

5.3.1. Static Distribution Network Reconfiguration

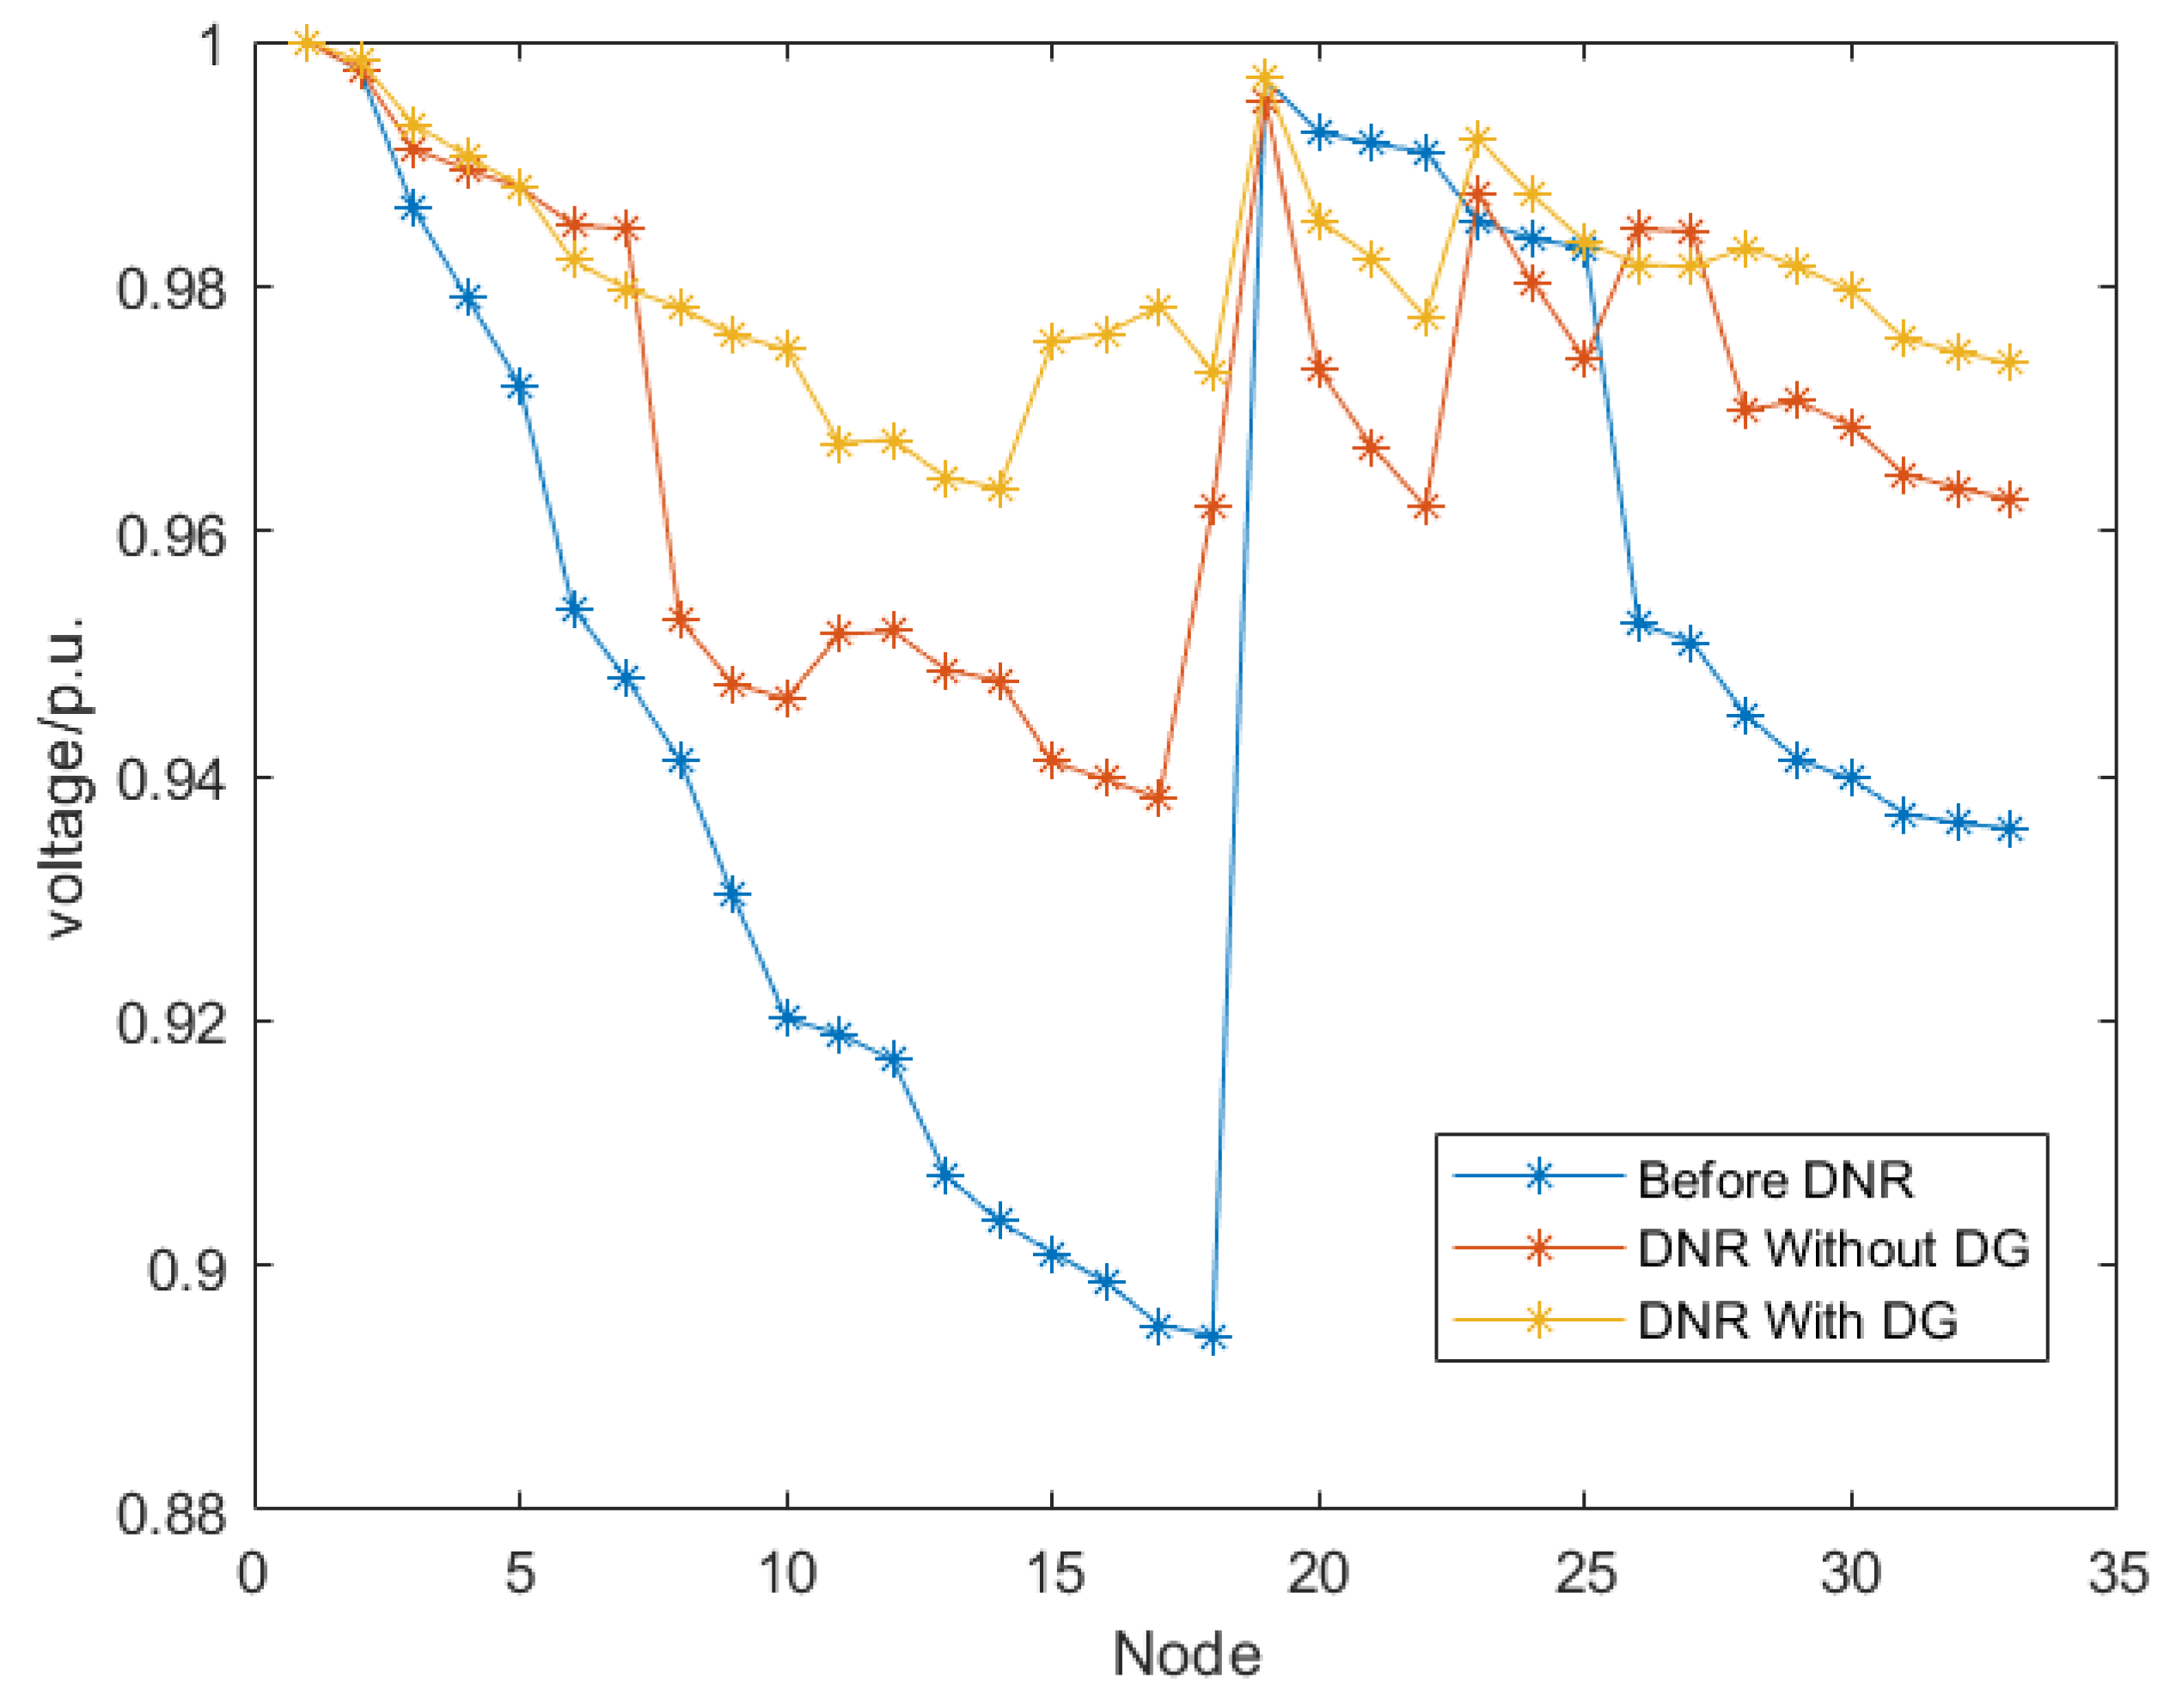
Firstly, MIBWOA was compared with other algorithms regarding the solutions proposed for the DNR problem using the standard IEEE-33 system without DG and load prediction. Based on the DGP scheme provided by MIBWOA, the distributed generators were then connected to nodes 13, 16, and 17 of the distribution network and compared with the case without distributed generators to demonstrate the excellent ability of MIBWOA in solving DNR problem. The average results of running the algorithm repeatedly 50 times for the two DNR problems without and with DG and load forecasting are shown in Table 7 and Table 8, respectively. The comparison of voltage distribution under different situations is demonstrated in Figure 16, and the algorithm performance comparison results are presented in Table 9.
Table 7 presents the optimization results for the standard IEEE-33 systems. In the optimal solution provided by MIBWOA, the active power loss was 144.58 kW, the voltage offset was 1.05, and the carbon emission was 74,223 kg. The results in Table 8 come from the IEEE-33 system with DeepSCN prediction. In the optimal solution of MIBWOA, the active power loss was 95.62 kW, the voltage offset was 0.66, and the carbon emission was 42,223 kg. This indicates that MIBWOA exhibited excellent performance and outstanding adaptability in solving DNR problems. On the other hand, Table 9 compares MIBWOA with other algorithms from the perspective of algorithm performance. When solving the DNR problem, MIBWOA only needed five iterations on average to find the optimal solution, while other algorithms were plagued by local optima. MIBWOA could accurately search for optimization in only 5.83 s, while the local optimal solutions of other algorithms were unstable. It can be observed that, similar to the DGP problem, MIBWOA outperforms other algorithms in terms of the optimal value, the number of iterations, and the iteration time in the context of DNR problems. In conclusion, it can be inferred that using MIBWOA to solve DNR problems is feasible. From Figure 16, it can be observed the voltage distribution under different operating conditions in the distribution network. It is evident that the voltage distribution after DNR is significantly more uniform, resulting in a more stable system.

5.3.2. Dynamic Distribution Network Reconfiguration

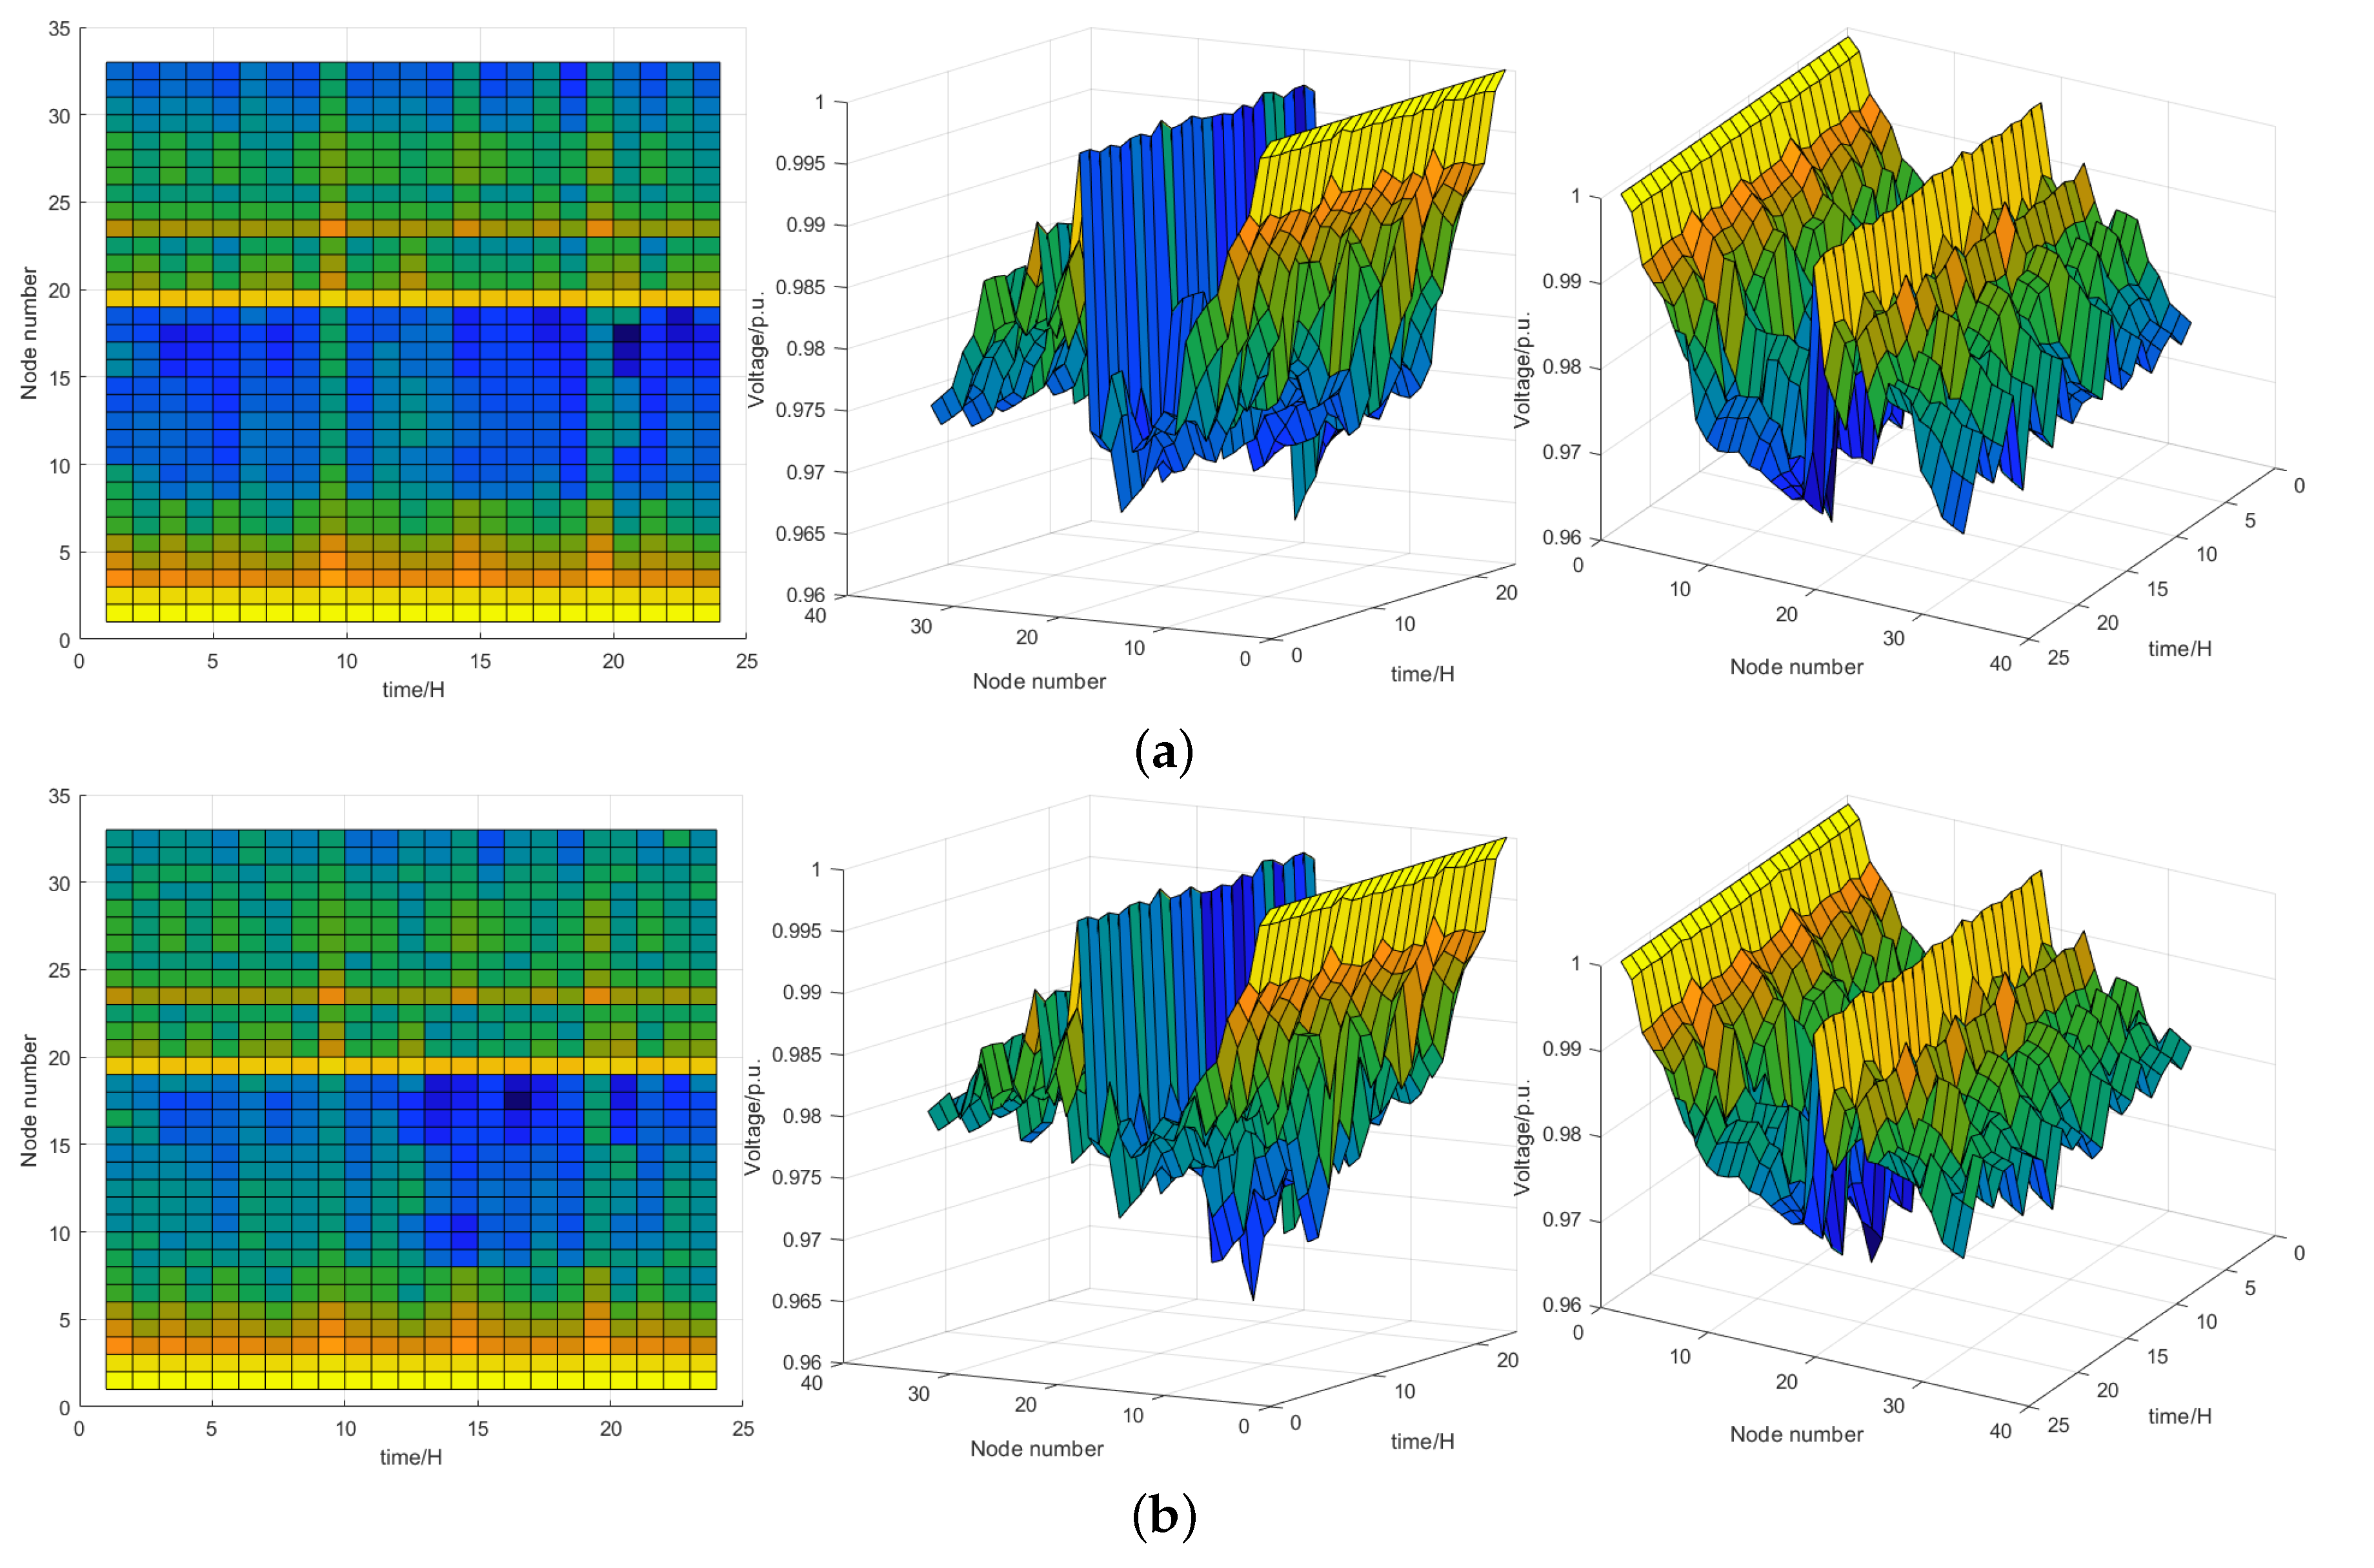
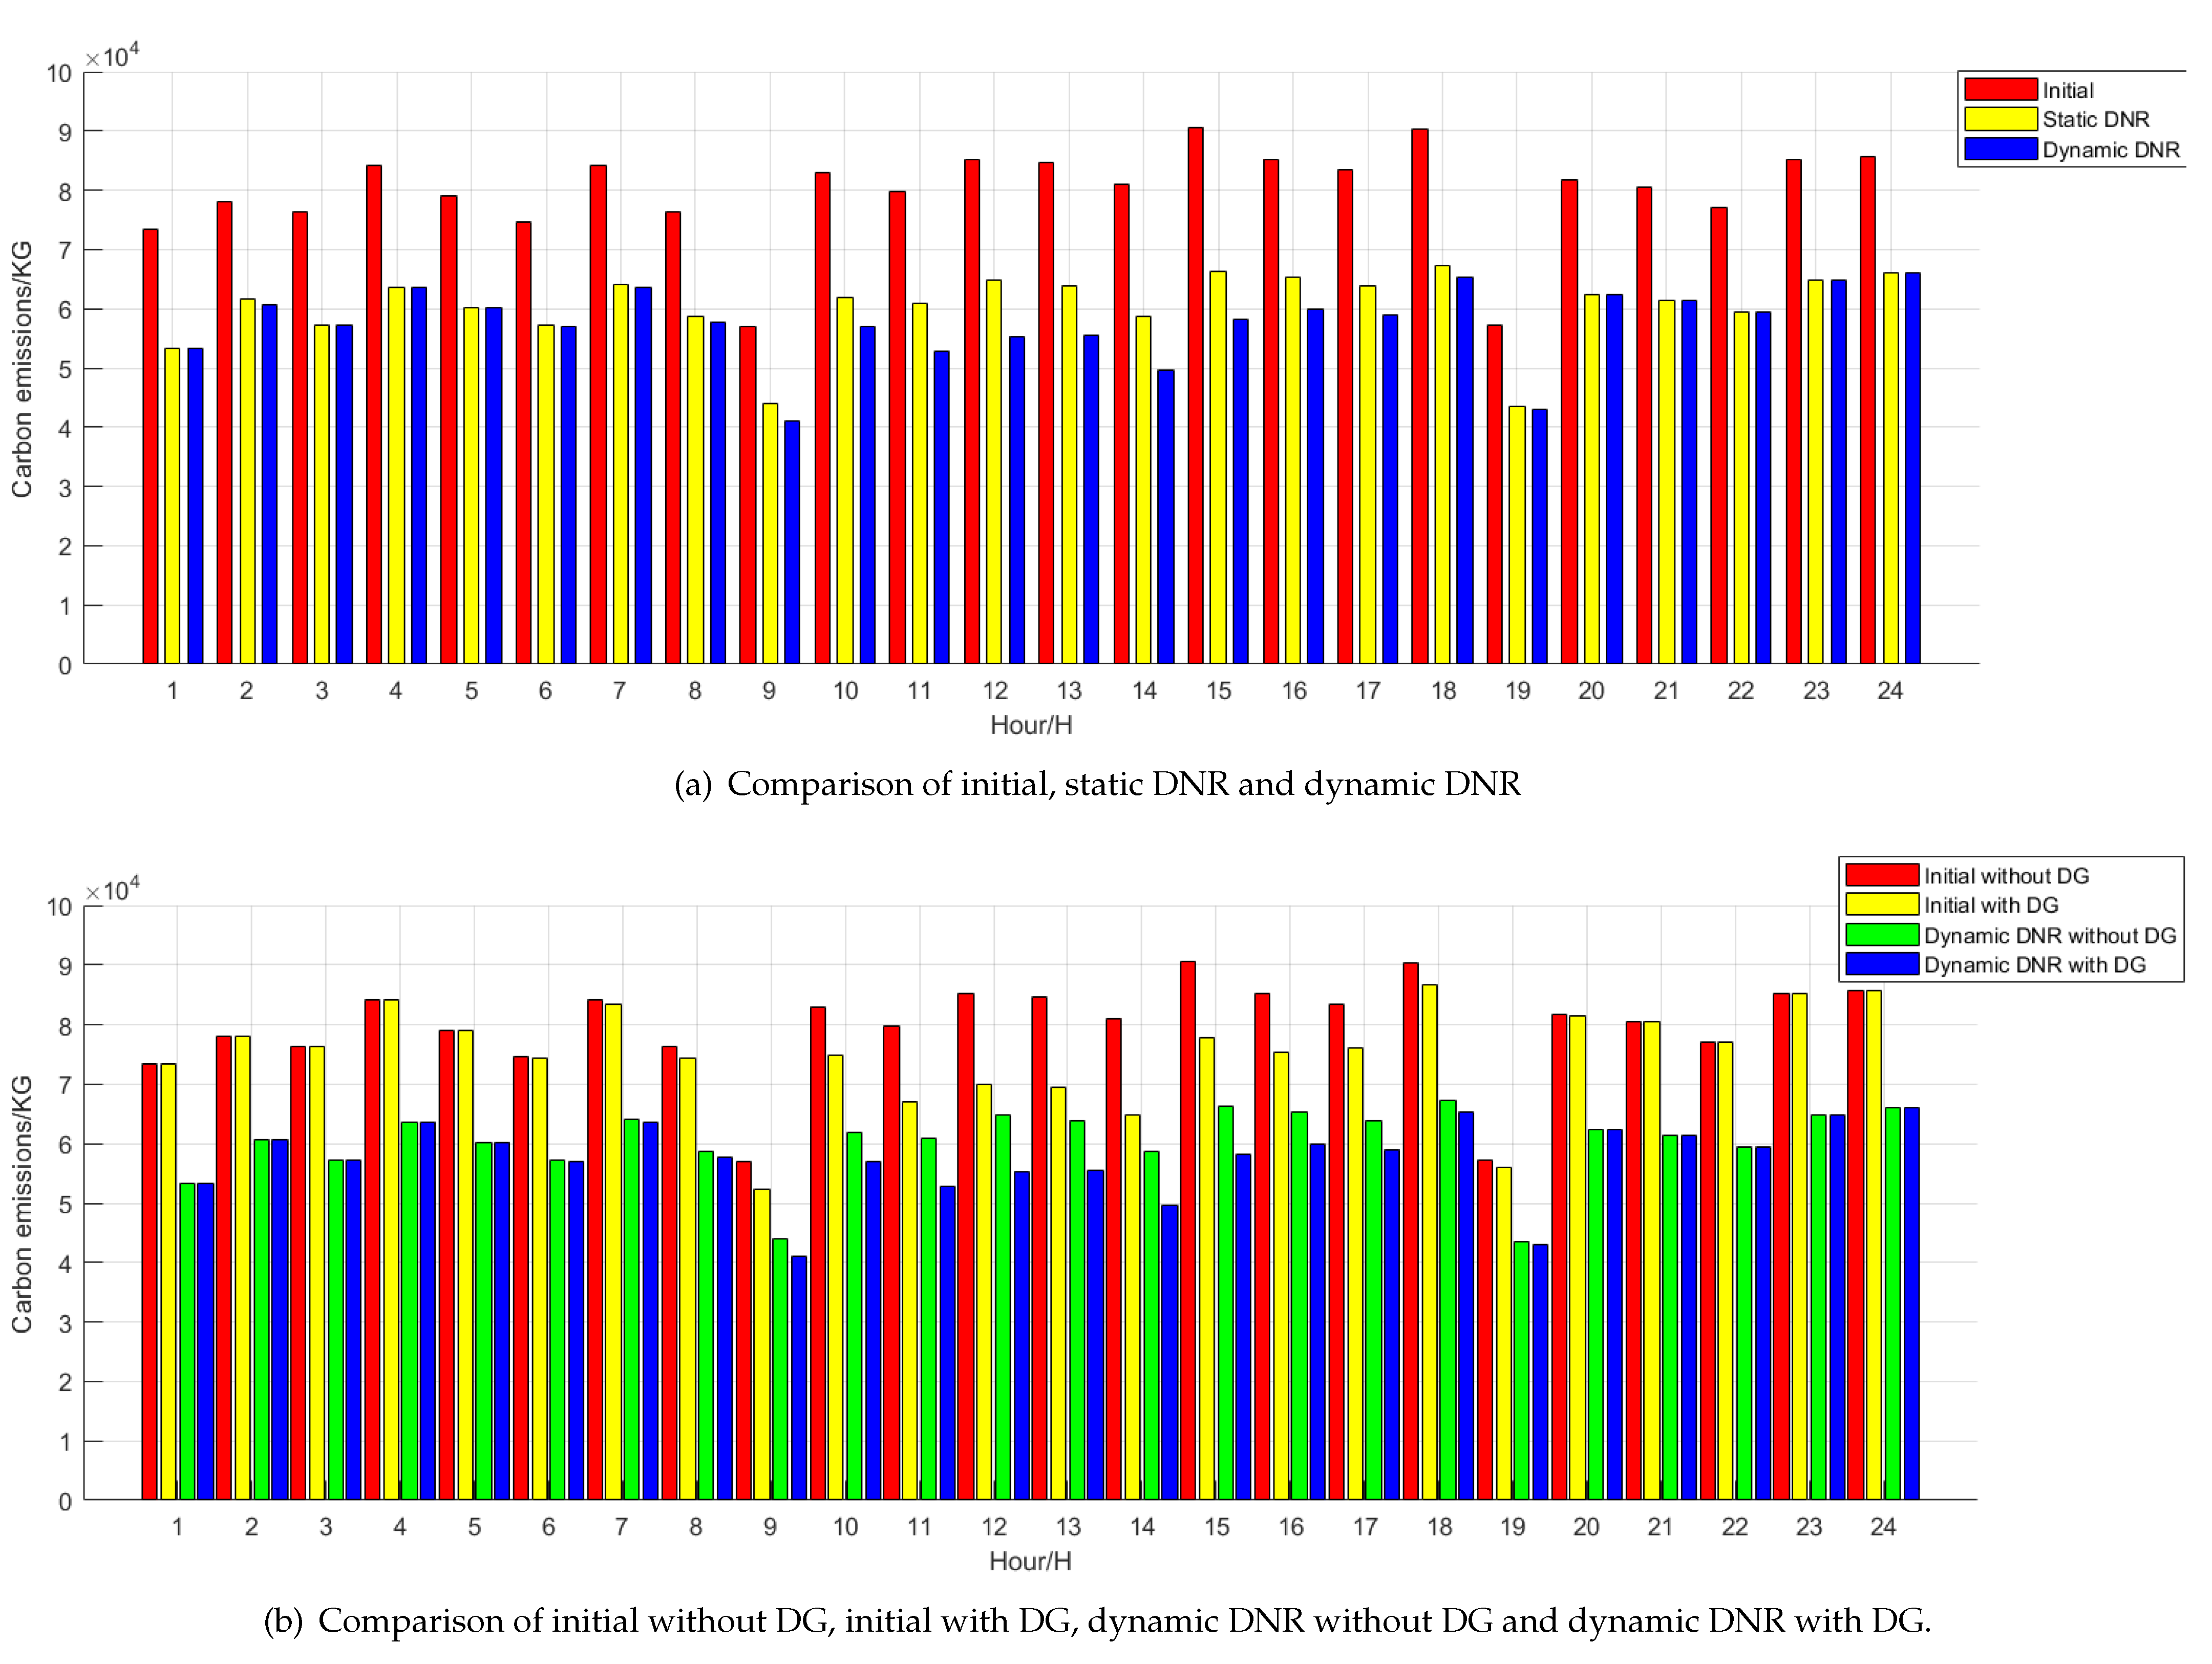
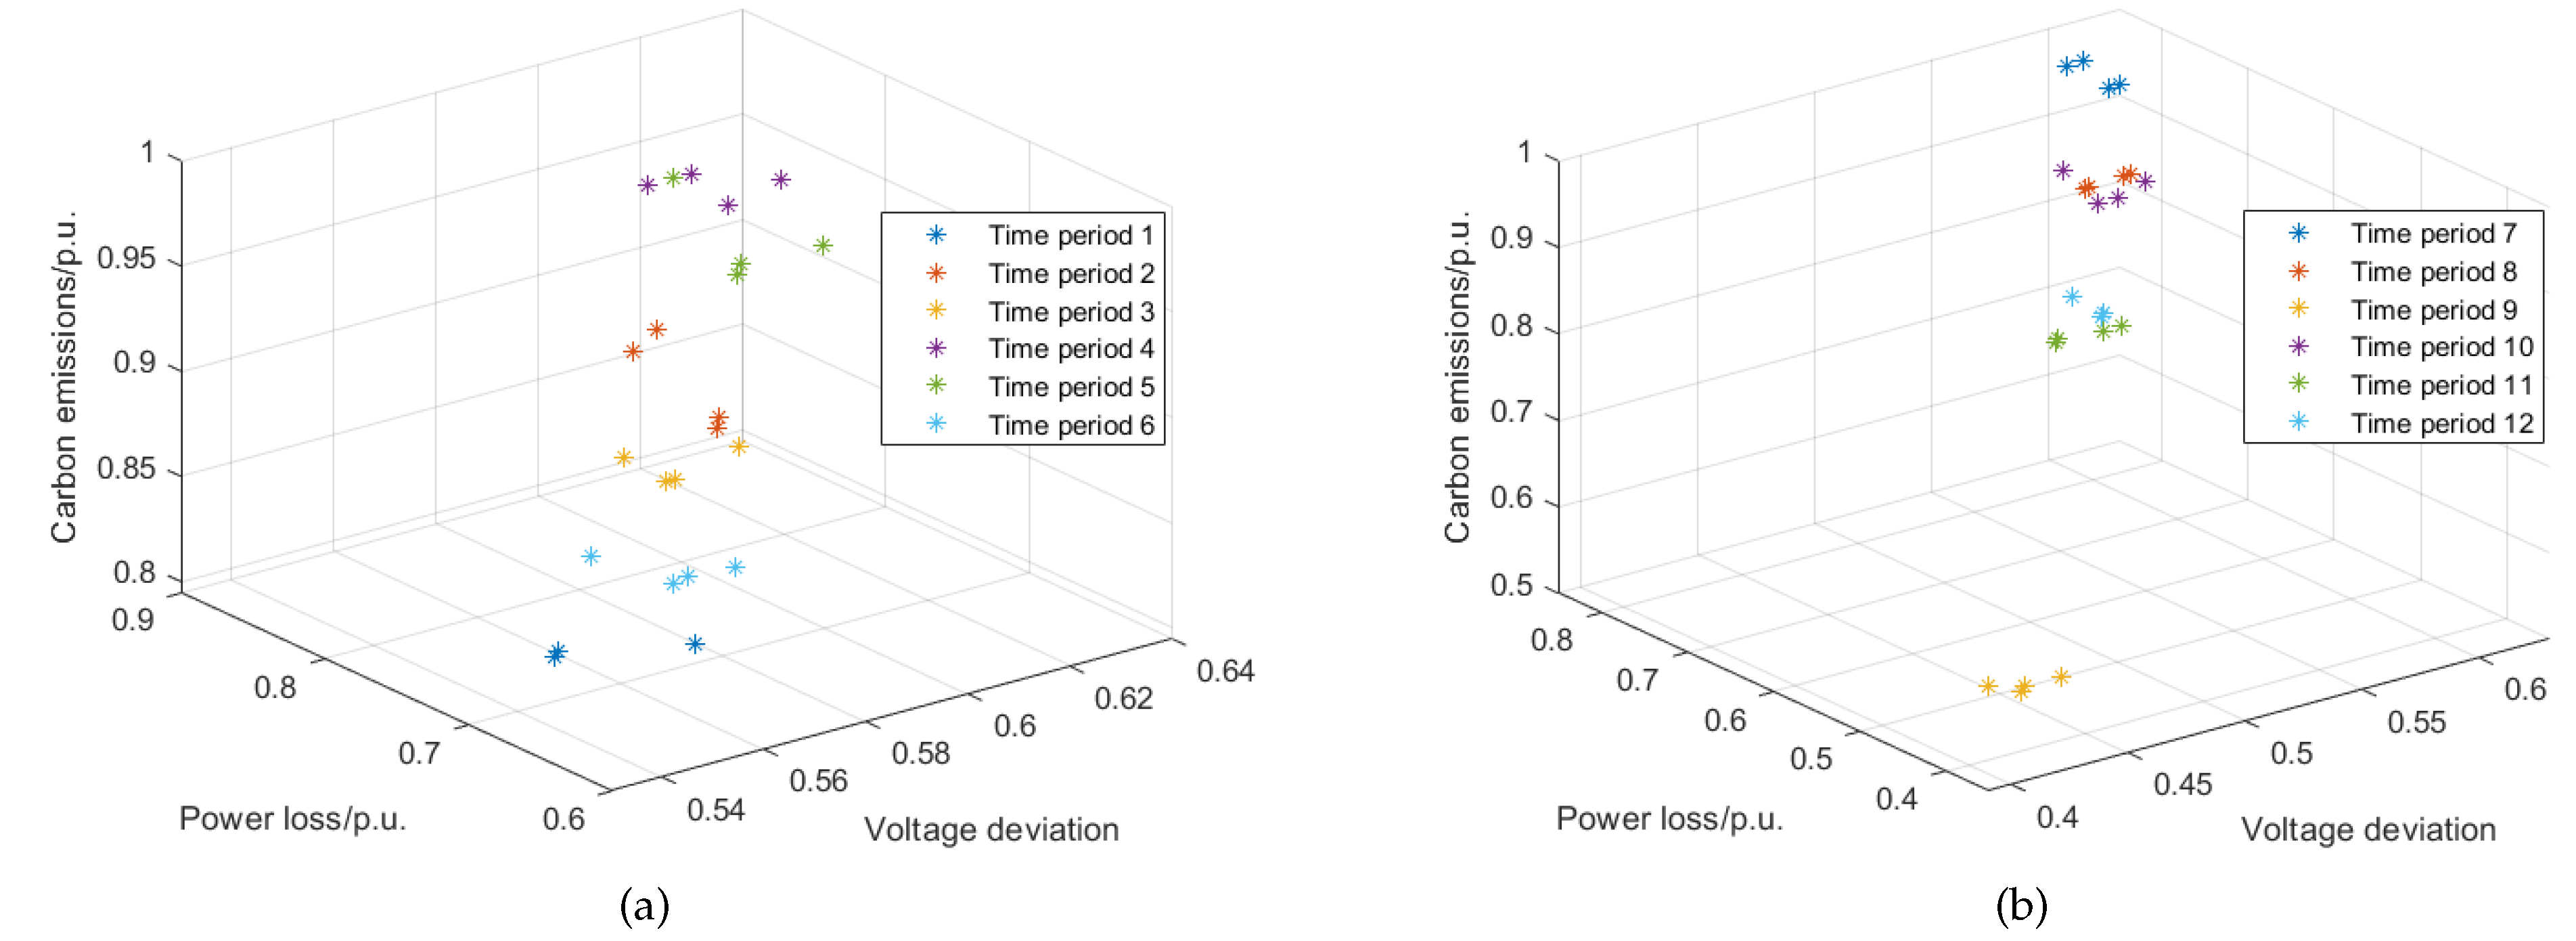
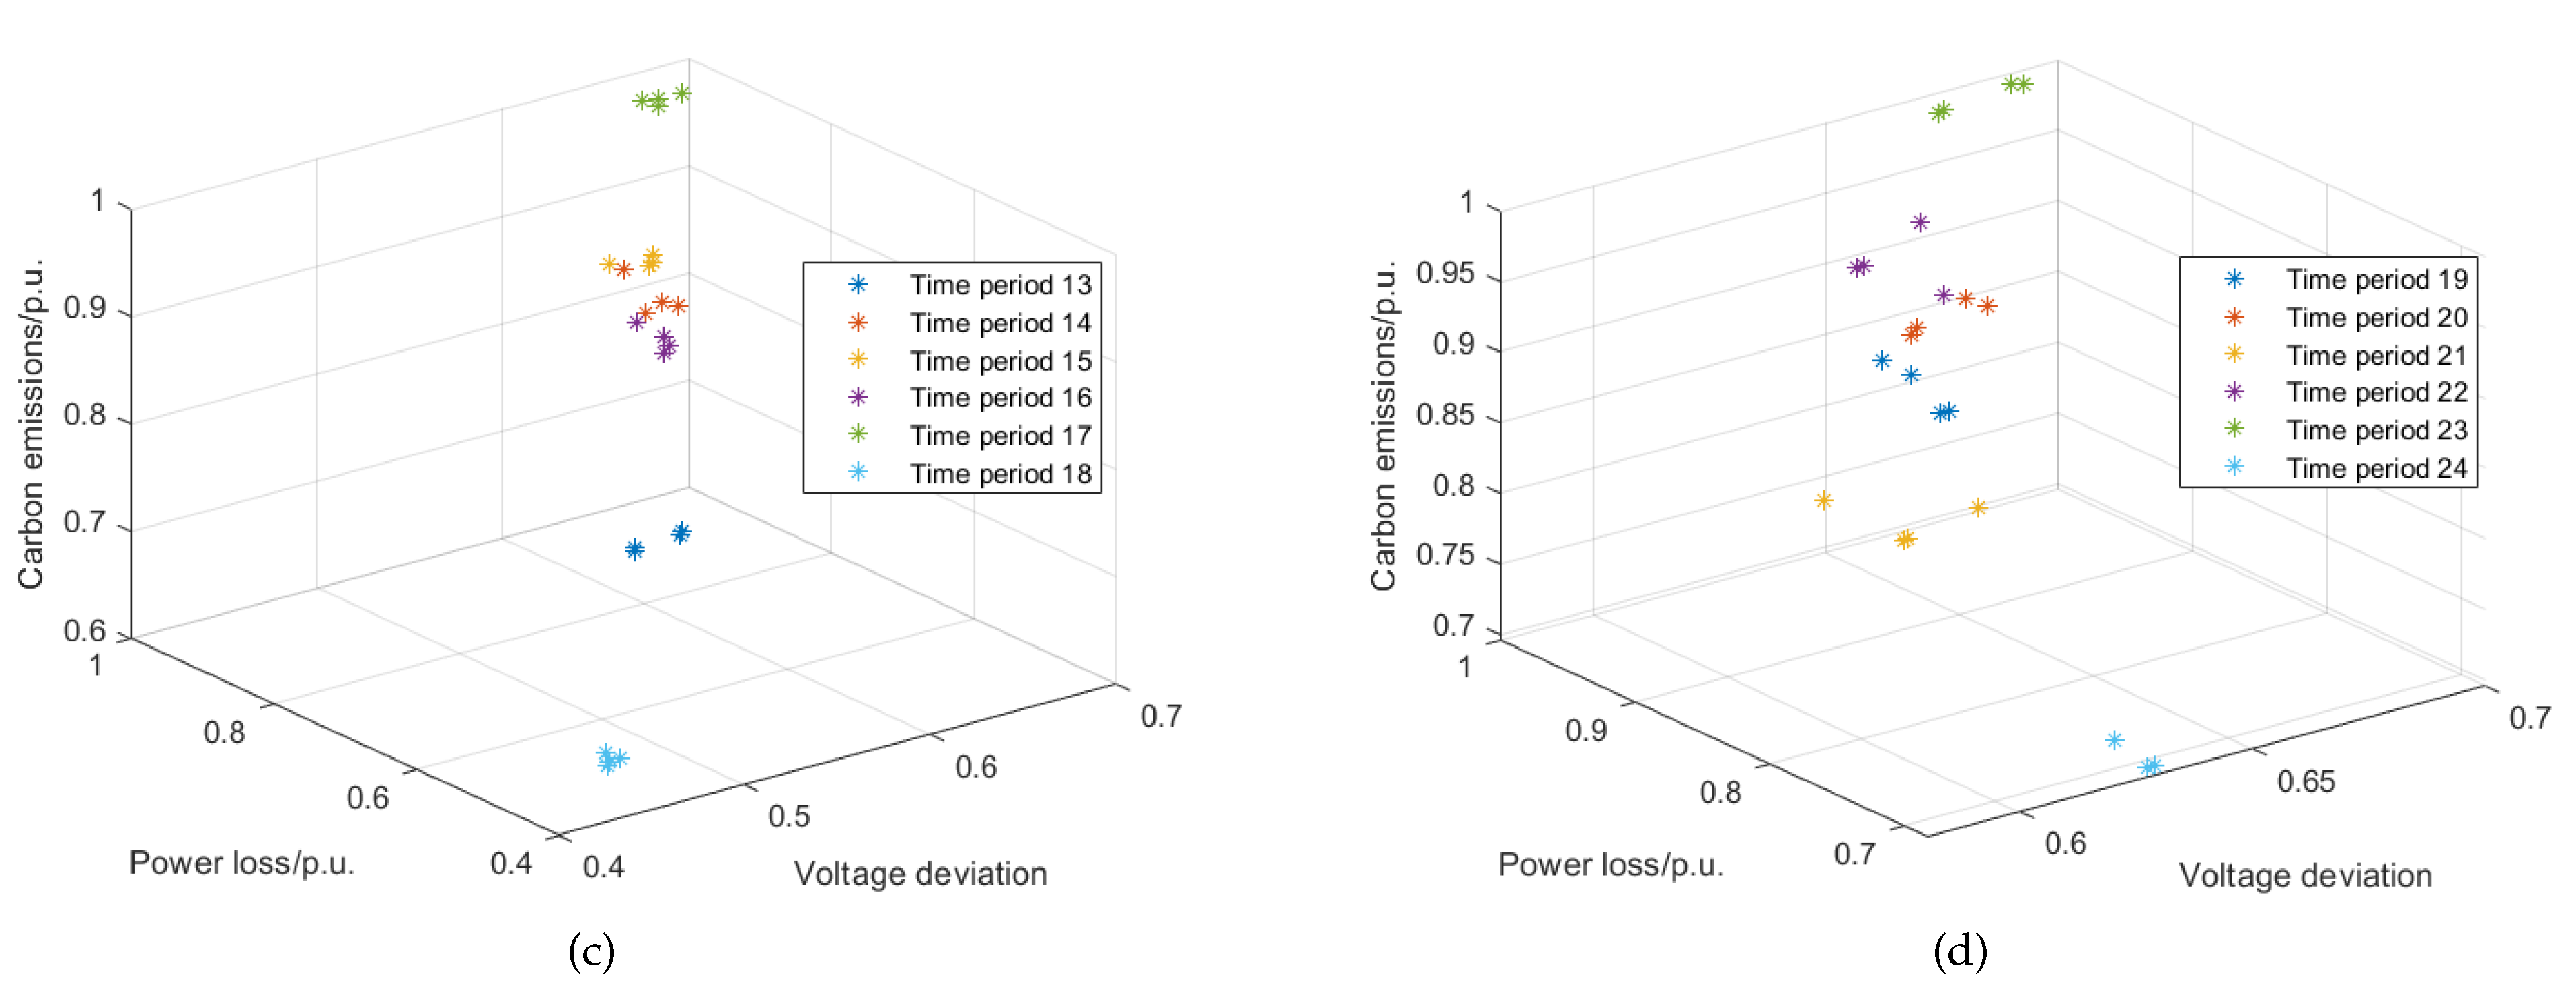
The excellent performances of MIBWOA has been demonstrated on standard IEEE-33 power distribution systems and the static DNR problem with DG and load forecasting. Next, MIBWOA was applied to dynamic DNR problem in the context of the DGP problem. Taking the IEEE-33 system with 24 periods in a day as an example, other parameters and the position of the DG were the same as those in the static DNR. The predicted power of the DG and load by DeepSCN are shown in Figure 10, Figure 11 and Figure 12. Table 10 shows the average results of the dynamic DNR focusing on active power network loss in the Pareto solution set and the comparison results before the period reconfiguration. The algorithms’ performance comparison results are shown in Table 11. The power loss comparison after repeated running 50 times under different conditions is shown in Figure 17. The distribution network node voltage distribution with and without DG in the initial state is shown in Figure 18. After dynamic DNR, the voltage distribution of distribution network nodes with and without DG is shown in Figure 19. The carbon emissions under different conditions are shown in Figure 20, and the spatial distribution of the Pareto solution set at each period is shown in Figure 21.
Table 10 presents the dynamic DNR solution set obtained by MIBWOA. The distribution network changed with time by changing the switch to adapt to the distributed power and node load with strong randomness. Each time period was selected based on active power loss, and the switch status from the previous time period was used as the initial state for the current time period. By integrating all the selection schemes from each time period, a complete solution set for the dynamic DNR problem was obtained. Table 11 demonstrates the excellent performance of MIBWOA in solving the dynamic DNR problem from an algorithmic perspective. In the more computationally intensive dynamic DNR problem, MIBWOA required an average of 6 iterations to converge to the optimal solution. MIBWOA required 63 s to complete an iteration, and other algorithms were significantly slower with regard to their own iteration times for static DNR. MIBWOA can still maintain accuracy, while the accuracy of other algorithms has dropped significantly. Similar to DGP and static DNR, MIBWOA could reach the global optimal solution after six iterations, it was capable of finding the optimal solution with the fewest iterations and at the fastest speed, and it showed that MIBWOA is still highly adaptable to multi-objective problems with large computations.
Figure 17 illustrates the active power loss in the distribution network under different conditions. In Figure 17a, the initial state of the distribution network exhibits the highest active power loss, which is partially alleviated by static DNR. However, dynamic DNR achieves the most favorable results in reducing the losses. In Figure 17b, the overall power loss is highest when DGs were not used in the initial state, followed by the scenario where DGs were utilized in the initial state. After optimization with MIBWOA, the distribution network showed significant improvement in reducing active power loss compared to the initial state.
Figure 18 and Figure 19 depict the voltage distribution in the distribution network before and after dynamic DNR, respectively. The smoother the graph, the better the voltage distribution of the distribution network. From the top, front, and back views, it can be seen that, in both cases, the voltage distribution improves after the integration of DGs. Furthermore, the distribution network optimized with MIBWOA exhibits increased stability compared to the initial state, with smaller voltage differences between different nodes. This shows that the solution provided by MIBWOA can make the operation of distribution network more stable and ensure the safety of the system.
Figure 20 illustrates the carbon emissions under different conditions. The pollution generated by the distribution network in the initial state is significantly higher compared to the optimized state with MIBWOA. Compared with standard DNR, dynamic DNR supported by MIBWOA can optimize and further reduce pollution for distribution network operation. The introduction of distributed generation, whether in the initial state or the optimized state, leads to improvements in pollution reduction. Therefore, distributed generation plays a crucial role in addressing engineering issues in the distribution network. The table shows that using the solutions provided by MIBWOA significantly reduces the pollution caused by the distribution network, which is essential for sustainable development.
Figure 21 shows the solution sets selected by MIBWOA for different time periods. It is evident that the solution sets are different for each time period. Therefore, dynamic DNR is more realistic and efficient compared to static DNR, as it can better adapt to changing conditions.
In conclusion, MIBWOA shows excellent performance in dynamic DNR problems. By optimizing the three indicators of active power loss, voltage offset, and carbon emissions, the distribution network can be operated in a more ideal condition, using DGP as the background of the DNR problem and providing multi-period DGP–DNR problem solutions, thereby assisting in solving engineering problems in distribution networks.

6. Conclusions

Aimed at addressing the DGP–DNR problem, a multi-objective optimization model for the distribution network was constructed to minimize active power loss, voltage deviation, and carbon emissions. Real-time prediction of DG output power and user load power was achieved using DeepSCN. The proposed MIBWOA algorithm was utilized to solve the problem model.
Due to the instability and uncertainty in DG output power and user load power, using a distribution function to simulate power would lead to significant errors and make it challenging to combine the proposed problem model with the actual situation. Using DeepSCN to predict power effectively avoids this problem.
In the MIBWOA algorithm, the selection strategy based on the Pareto theory was applied to transform it into a multi-objective algorithm. The algorithm can simultaneously optimize continuous and discrete problems by adding a selectable discretization module. The Cubic–Tent chaotic map was introduced to generate an initial population to improve the distribution of the initial solution set. The population update formula with the fusion of the optimal gene was used to increase the convergence efficiency. The population mutation with adaptive adjustment based on Wald and elite reverse learning was added to improve the algorithm’s accuracy and ability to escape local optima.
The improved results of the algorithm were verified through various test functions. MIBWOA exhibited excellent performance compared to other algorithms in both single-objective and multi-objective test functions. By using DGP in the IEEE-33 distribution network system, the optimal locations for distributed generation were determined. This enabled the distribution network to reduce active power loss by about 31.15 percent, improve voltage balance by 38.23 percent, and reduce carbon emissions by 23.26 percent under ideal operating conditions. The location selection scheme provided by MIBWOA can significantly optimize the operational state of the distribution network, thus providing a favorable initial environment for subsequent DNR. Furthermore, through two static DNR experiments, MIBWOA was shown to help the distribution network reduce active power loss by about 31.15%, increase voltage stability by 38.3%, and reduce carbon emissions by 52%. We compared and validated MIBWOA’s outstanding adaptability and superiority in solving the DNR problem. MIBWOA was then applied to the dynamic DNR problem based on DGP. Under the action of MIBWOA, the distribution network could reduce active power loss by about 45.11%, increase voltage stability by 52.6%, and reduce carbon emissions by 27.64%. It effectively obtained the Pareto solution set of the problem, which has a positive impact on engineering issues in the distribution network.
In the future, there are several directions that can be explored to further enhance the research presented in the paper: (1) Expansion to multiple distribution network systems—while the paper focused on the IEEE-33 distribution system, it would be valuable to extend the experimental evaluation to include other distribution network systems. This would provide a broader understanding of the proposed algorithm’s performance and applicability across different network configurations and sizes. (2) Optimizing the time intervals for the dynamic analysis of the distribution network can significantly impact its efficiency. Exploring methods for efficient time interval partitioning, considering factors such as load variations, DG output fluctuations, and control actions, would be beneficial. This would reduce the number of network actions required and improve the overall efficiency of the distribution system.

Author Contributions

Conceptualization, X.Y. and Q.Z.; methodology, X.Y. and Q.Z.; software, Q.Z.; validation, X.Y.; formal analysis and investigation, X.Y.; resources, X.Y.; data curation, X.Y. and Q.Z.; writing—original draft preparation, Q.Z.; writing—review and editing, X.Y.; supervision, X.Y.; funding acquisition, X.Y. All authors have read and agreed to the published version of the manuscript.

Funding

National Natural Science Foundation of China (61601212, 52177047) and Liaoning Provincial Department of Education Fund (LJ2019JL011, LJ2017QL012).

Institutional Review Board Statement

Not applicable.

Informed Consent Statement

Not applicable.

Data Availability Statement

Not applicable.

Conflicts of Interest

The authors declare no conflict of interest.

References

  1. Jabr, R.A.; Singh, R.; Pal, B.C. Minimum loss network reconfiguration using mixed-integer convex programming. IEEE Trans. Power Syst. 2012, 27, 1106–1115. [Google Scholar] [CrossRef]
  2. Meng, W.; Song, D.; Deng, X.; Dong, M.; Yang, J.; Rizk-Allah, R.M.; Snášel, V. Dynamic Optimal Power Flow of Active Distribution Network Based on LSOCR and Its Application Scenarios. Electronics 2023, 12, 1530. [Google Scholar] [CrossRef]
  3. Diaaeldin, I.; Abdel Aleem, S.; El-Rafei, A.; Abdelaziz, A.; Zobaa, A.F. Optimal network reconfiguration in active distribution networks with soft open points and distributed generation. Energies 2019, 12, 4172. [Google Scholar] [CrossRef] [Green Version]
  4. Ntombela, M.; Musasa, K.; Leoaneka, M.C. Power Loss Minimization and Voltage Profile Improvement by System Reconfiguration, DG Sizing, and Placement. Computation 2022, 10, 180. [Google Scholar] [CrossRef]
  5. Gong, L.; Wang, X.; Tian, M.; Yao, H.; Long, J. Multi-Objective Optimal Planning for Distribution Network Considering the Uncertainty of PV Power and Line-Switch State. Sensors 2022, 22, 4927. [Google Scholar] [CrossRef] [PubMed]
  6. Sellami, R.; Khenissi, I.; Guesmi, T.; Alshammari, B.M.; Alqunun, K.; Alshammari, A.S.; Tlijani, K.; Neji, R. Optimal Reconfiguration of Distribution Network Considering Stochastic Wind Energy and Load Variation Using Hybrid SAMPSO Optimization Method. Sustainability 2022, 14, 11208. [Google Scholar] [CrossRef]
  7. Nguyen, T.T.; Nguyen, T.T.; Truong, A.V.; Nguyen, Q.T.; Phung, T.A. Multi-objective electric distribution network reconfiguration solution using runner-root algorithm. Appl. Soft Comput. 2017, 52, 93–108. [Google Scholar] [CrossRef]
  8. Ehsan, A.; Yang, Q. State-of-the-art techniques for modelling of uncertainties in active distribution network planning: A review. Appl. Energy 2019, 239, 1509–1523. [Google Scholar] [CrossRef]
  9. Gao, Y.; Shi, J.; Wang, W.; Yu, N. Dynamic distribution network reconfiguration using reinforcement learning. In Proceedings of the 2019 IEEE International Conference on Communications, Control, and Computing Technologies for Smart Grids (SmartGridComm), Beijing, China, 21–23 October 2019; pp. 1–7. [Google Scholar]
  10. Kandasamy, M.; Thangavel, R.; Arumugam, T.; Jayaram, J.; Kim, W.W.; Geem, Z.W. Performance Enhancement of Radial Power Distribution Networks Using Network Reconfiguration and Optimal Planning of Solar Photovoltaic-Based Distributed Generation and Shunt Capacitors. Sustainability 2022, 14, 11480. [Google Scholar] [CrossRef]
  11. Gallego Pareja, L.A.; López-Lezama, J.M.; Gómez Carmona, O. Optimal Feeder Reconfiguration and Placement of Voltage Regulators in Electrical Distribution Networks Using a Linear Mathematical Model. Sustainability 2023, 15, 854. [Google Scholar] [CrossRef]
  12. Alorf, A. A survey of recently developed metaheuristics and their comparative analysis. Eng. Appl. Artif. Intell. 2023, 117, 105622. [Google Scholar] [CrossRef]
  13. Pang, X.; Zhang, X.; Liu, W.; Li, H.; Wang, Y. Optimal scheduling of cogeneration system with heat storage device based on artificial bee colony algorithm. Electronics 2022, 11, 1725. [Google Scholar] [CrossRef]
  14. Swaminathan, D.; Rajagopalan, A.; Montoya, O.D.; Arul, S.; Grisales-Noreña, L.F. Distribution Network Reconfiguration Based on Hybrid Golden Flower Algorithm for Smart Cities Evolution. Energies 2023, 16, 2454. [Google Scholar] [CrossRef]
  15. Chen, J.; Sun, B.; Li, Y.; Jing, R.; Zeng, Y.; Li, M. Credible capacity calculation method of distributed generation based on equal power supply reliability criterion. Renew. Energy 2022, 201, 534–547. [Google Scholar] [CrossRef]
  16. Sun, B.; Li, Y.; Zeng, Y.; Chen, J.; Shi, J. Optimization planning method of distributed generation based on steady-state security region of distribution network. Energy Rep. 2022, 8, 4209–4222. [Google Scholar] [CrossRef]
  17. Kashyap, M.; Mittal, A.; Kansal, S. Optimal placement of distributed generation using genetic algorithm approach. In Proceedings of the Second International Conference on Microelectronics, Computing & Communication Systems (MCCS 2017); Springer: Berlin/Heidelberg, Germany, 2019; pp. 587–597. [Google Scholar]
  18. Prakash, D.; Lakshminarayana, C. Multiple DG placements in distribution system for power loss reduction using PSO algorithm. Procedia Technol. 2016, 25, 785–792. [Google Scholar] [CrossRef] [Green Version]
  19. Reddy, P.D.P.; Reddy, V.V.; Manohar, T.G. Application of flower pollination algorithm for optimal placement and sizing of distributed generation in distribution systems. J. Electr. Syst. Inf. Technol. 2016, 3, 14–22. [Google Scholar] [CrossRef] [Green Version]
  20. Prakash, D.; Lakshminarayana, C. Multiple DG placements in radial distribution system for multi objectives using Whale Optimization Algorithm. Alex. Eng. J. 2018, 57, 2797–2806. [Google Scholar] [CrossRef]
  21. Quintero-Duran, M.J.; Candelo-Becerra, J.E.; Cabana-Jimenez, K. Distribution network reconfiguration with large number of switches solved by a modified binary bat algorithm and improved seed population. Teh. Vjesn. 2019, 26, 1284–1291. [Google Scholar]
  22. Salau, A.O.; Gebru, Y.W.; Bitew, D. Optimal network reconfiguration for power loss minimization and voltage profile enhancement in distribution systems. Heliyon 2020, 6, e04233. [Google Scholar] [CrossRef]
  23. Imran, A.M.; Kowsalya, M. A new power system reconfiguration scheme for power loss minimization and voltage profile enhancement using fireworks algorithm. Int. J. Electr. Power Energy Syst. 2014, 62, 312–322. [Google Scholar] [CrossRef]
  24. Wang, B.; Zhu, H.; Xu, H.; Bao, Y.; Di, H. Distribution network reconfiguration based on noisynet deep Q-learning network. IEEE Access 2021, 9, 90358–90365. [Google Scholar] [CrossRef]
  25. Shaheen, A.; El-Sehiemy, R.; Kamel, S.; Selim, A. Optimal Operational Reliability and Reconfiguration of Electrical Distribution Network Based on Jellyfish Search Algorithm. Energies 2022, 15, 6994. [Google Scholar] [CrossRef]
  26. Shariatkhah, M.H.; Haghifam, M.R.; Salehi, J.; Moser, A. Duration based reconfiguration of electric distribution networks using dynamic programming and harmony search algorithm. Int. J. Electr. Power Energy Syst. 2012, 41, 1–10. [Google Scholar] [CrossRef]
  27. Dong, Z.; Lin, L. Dynamic reconfiguration strategy based on partition of time intervals with improved fuzzy C-means clustering. In Proceedings of the 2018 China International Conference on Electricity Distribution (CICED), Tianjin, China, 17–19 September 2018; pp. 398–404. [Google Scholar]
  28. Jafari, A.; Ganjehlou, H.G.; Darbandi, F.B.; Mohammadi-Ivatloo, B.; Abapour, M. Dynamic and multi-objective reconfiguration of distribution network using a novel hybrid algorithm with parallel processing capability. Appl. Soft Comput. 2020, 90, 106146. [Google Scholar] [CrossRef]
  29. Mansour, H.S.; Elnaghi, B.E.; Abd-Alwahab, M.; Ismail, M. Optimal Distribution Networks Reconfiguration for Loss Reduction Via Black Widow Optimizer. In Proceedings of the 2021 22nd International Middle East Power Systems Conference (MEPCON), Assiut, Egypt, 14–16 December 2021; pp. 672–677. [Google Scholar]
  30. Yin, Y.; Liu, T.; He, C. Day-ahead stochastic coordinated scheduling for thermal-hydro-wind-photovoltaic systems. Energy 2019, 187, 115944. [Google Scholar] [CrossRef]
  31. Biswas, P.P.; Suganthan, P.N.; Qu, B.Y.; Amaratunga, G.A. Multiobjective economic-environmental power dispatch with stochastic wind-solar-small hydro power. Energy 2018, 150, 1039–1057. [Google Scholar] [CrossRef]
  32. Elgerd, O.I. Electric Energy Systems Theory: An Introduction. 1982. Available online: https://www.osti.gov/biblio/5599996 (accessed on 10 January 2022).
  33. Doagou-Mojarrad, H.; Gharehpetian, G.; Rastegar, H.; Olamaei, J. Optimal placement and sizing of DG (distributed generation) units in distribution networks by novel hybrid evolutionary algorithm. Energy 2013, 54, 129–138. [Google Scholar] [CrossRef]
  34. Guo, Z.; Lei, S.; Wang, Y.; Zhou, Z.; Zhou, Y. Dynamic distribution network reconfiguration considering travel behaviors and battery degradation of electric vehicles. In Proceedings of the 2017 IEEE Power & Energy Society General Meeting, Chicago, IL, USA, 16–20 July 2017; pp. 1–5. [Google Scholar]
  35. Ramsami, P.; King, R.T.A. Dynamic distribution network reconfiguration for distributed generation integration: A systematic review. In Proceedings of the 2021 IEEE 2nd China International Youth Conference on Electrical Engineering (CIYCEE), Chengdu, China, 15–17 December 2021; pp. 1–8. [Google Scholar]
  36. Gu, B.; Li, X.; Xu, F.; Yang, X.; Wang, F.; Wang, P. Forecasting and Uncertainty Analysis of Day-Ahead Photovoltaic Power Based on WT-CNN-BiLSTM-AM-GMM. Sustainability 2023, 15, 6538. [Google Scholar] [CrossRef]
  37. Zhang, Y.; Yang, Y.; Zhang, X.; Pu, W.; Song, H. Planning Strategies for Distributed PV-Storage Using a Distribution Network Based on Load Time Sequence Characteristics Partitioning. Processes 2023, 11, 540. [Google Scholar] [CrossRef]
  38. Song, P.; Zhang, Z. Research on Multiple Load Short-Term Forecasting Model of Integrated Energy Distribution System Based on Mogrifier-Quantum Weighted MELSTM. Energies 2023, 16, 3697. [Google Scholar] [CrossRef]
  39. Wang, D.; Li, M. Deep stochastic configuration networks with universal approximation property. In Proceedings of the 2018 International Joint Conference on Neural Networks (IJCNN), Rio de Janeiro, Brazil, 8–13 July 2018; pp. 1–8. [Google Scholar]
  40. Hayyolalam, V.; Kazem, A.A.P. Black widow optimization algorithm: A novel meta-heuristic approach for solving engineering optimization problems. Eng. Appl. Artif. Intell. 2020, 87, 103249. [Google Scholar] [CrossRef]
  41. Wu, Q. Another look at a proposed cubic chaotic mapping. In Proceedings of the Cyberspace Safety and Security: 11th International Symposium, CSS 2019, Guangzhou, China, December 1–3 2019; Proceedings, Part I 11. Springer: Berlin/Heidelberg, Germany, 2019; pp. 407–412. [Google Scholar]
  42. Li, Y.; Han, M.; Guo, Q. Modified whale optimization algorithm based on tent chaotic mapping and its application in structural optimization. KSCE J. Civ. Eng. 2020, 24, 3703–3713. [Google Scholar] [CrossRef]
  43. Ishibuchi, H.; Masuda, H.; Tanigaki, Y.; Nojima, Y. Modified distance calculation in generational distance and inverted generational distance. In Proceedings of the Evolutionary Multi-Criterion Optimization: 8th International Conference, EMO 2015, Guimarães, Portugal, March 29–April 1 2015; Proceedings, Part II 8. Springer: Berlin/Heidelberg, Germany, 2015; pp. 110–125. [Google Scholar]
  44. Coello, C.A.C.; Cortés, N.C. Solving multiobjective optimization problems using an artificial immune system. Genet. Program. Evolvable Mach. 2005, 6, 163–190. [Google Scholar] [CrossRef]
  45. Guerreiro, A.P.; Fonseca, C.M.; Paquete, L. The hypervolume indicator: Computational problems and algorithms. ACM Comput. Surv. 2021, 54, 1–42. [Google Scholar] [CrossRef]
  46. Zitzler, E.; Thiele, L.; Laumanns, M.; Fonseca, C.M.; Da Fonseca, V.G. Performance assessment of multiobjective optimizers: An analysis and review. IEEE Trans. Evol. Comput. 2003, 7, 117–132. [Google Scholar] [CrossRef] [Green Version]
  47. Yue, C.; Qu, B.; Liang, J. A multiobjective particle swarm optimizer using ring topology for solving multimodal multiobjective problems. IEEE Trans. Evol. Comput. 2017, 22, 805–817. [Google Scholar] [CrossRef]
  48. Yue, C.; Qu, B.; Yu, K.; Liang, J.; Li, X. A novel scalable test problem suite for multimodal multiobjective optimization. Swarm Evol. Comput. 2019, 48, 62–71. [Google Scholar] [CrossRef]
  49. Su, H.; Yang, J. Capacitors Optimization Placement in Distribution Systems Based on Improved Seeker Optimization Algorithm. Sens. Transducers 2013, 155, 180. [Google Scholar]
  50. Mirjalili, S. Dragonfly algorithm: A new meta-heuristic optimization technique for solving single-objective, discrete, and multi-objective problems. Neural Comput. Appl. 2016, 27, 1053–1073. [Google Scholar] [CrossRef]
  51. Li, S.; Chen, H.; Wang, M.; Heidari, A.A.; Mirjalili, S. Slime mould algorithm: A new method for stochastic optimization. Future Gener. Comput. Syst. 2020, 111, 300–323. [Google Scholar] [CrossRef]
  52. Mirjalili, S.; Gandomi, A.H.; Mirjalili, S.Z.; Saremi, S.; Faris, H.; Mirjalili, S.M. Salp Swarm Algorithm: A bio-inspired optimizer for engineering design problems. Adv. Eng. Softw. 2017, 114, 163–191. [Google Scholar] [CrossRef]
  53. Mirjalili, S.; Lewis, A. The whale optimization algorithm. Adv. Eng. Softw. 2016, 95, 51–67. [Google Scholar] [CrossRef]
  54. Dhiman, G.; Kumar, V. Spotted hyena optimizer: A novel bio-inspired based metaheuristic technique for engineering applications. Adv. Eng. Softw. 2017, 114, 48–70. [Google Scholar] [CrossRef]
  55. Arora, S.; Singh, S. Butterfly optimization algorithm: A novel approach for global optimization. Soft Comput. 2019, 23, 715–734. [Google Scholar] [CrossRef]
  56. Rashedi, E.; Rashedi, E.; Nezamabadi-Pour, H. A comprehensive survey on gravitational search algorithm. Swarm Evol. Comput. 2018, 41, 141–158. [Google Scholar] [CrossRef]
Figure 1. (a) The structure of DeepSCN for predicting DG; (b) The structure of DeepSCN for predicting load.
Sustainability 15 09580 g001aSustainability 15 09580 g001b
Figure 2. DeepSCN used to predict the power of solar DG.
Sustainability 15 09580 g002
Figure 3. DeepSCN used to predict the power of load.
Sustainability 15 09580 g003
Figure 4. BWOA mutation.
Sustainability 15 09580 g004
Figure 5. (a) PMLCM chaotic mapping; (b) Bernoulli chaotic mapping; (c) sine chaotic mapping; (d) Cubic-Tent chaotic mapping.
Sustainability 15 09580 g005
Figure 6. Flowchart of MIBWOA.
Sustainability 15 09580 g006
Figure 7. BWOA and MIBWOA iterative processes.
Sustainability 15 09580 g007
Figure 8. (a) Results of the F3 (ZDT1); (b) Results of the F4 (DTLZ2).
Sustainability 15 09580 g008
Figure 9. The structure of the IEEE-33.
Sustainability 15 09580 g009
Figure 10. The power of DG at different periods.
Sustainability 15 09580 g010
Figure 11. Active power of different nodes at different periods.
Sustainability 15 09580 g011aSustainability 15 09580 g011b
Figure 12. Reactive power of different nodes in different periods.
Sustainability 15 09580 g012aSustainability 15 09580 g012b
Figure 13. (a) DGP Pareto solution set of standard IEEE-33 distribution network; (b) DGP Pareto solution set of IEEE-33 distribution network with load forecasting.
Sustainability 15 09580 g013
Figure 14. (a) Sum of the active power of each node of the distribution network without load forecasting; (b) Sum of reactive power of each node of the distribution network without load forecasting.
Sustainability 15 09580 g014
Figure 15. (a) Sum of the active power of each node of the distribution network with load forecasting; (b) Sum of reactive power of each node of the distribution network with load forecasting.
Sustainability 15 09580 g015aSustainability 15 09580 g015b
Figure 16. Voltage comparison of each node.
Sustainability 15 09580 g016
Figure 17. Power loss comparison under different conditions.
Sustainability 15 09580 g017
Figure 18. (a) Node voltage distribution diagram without DG in the initial state; (b) Node voltage distribution diagram with DG in the initial state.
Sustainability 15 09580 g018
Figure 19. (a) Node voltage distribution diagram without DG after dynamic DNR; (b) Node voltage distribution diagram with DG after dynamic DNR.
Sustainability 15 09580 g019
Figure 20. Carbon emissions comparison under different conditions.
Sustainability 15 09580 g020
Figure 21. (a) Pareto solution from periods 1 to 6; (b) Pareto solution from periods 7 to 12; (c) Pareto solution from periods 13 to 18; (d) Pareto solution from periods 19 to 24.
Sustainability 15 09580 g021aSustainability 15 09580 g021b
Table 1. Classic test function.
NameFunctionInterval
F1   i = 1 D x i 2 10 cos 2 π x i + 10 [ 10 , 10 ]
F2   ( x 1 ) 2 + i = 2 D i x i 2 x i 1 2 [ 100 , 100 ]
F3   g f 1 , f 2 = 1 f 1 / f 2 f 1 x 1 = x 1 f 2 x 2 = 1 + 9 n 1 i = 2 n x i [ 0 , 1 ]
F4   h x i = i = 1 n x i 0.5 2 f 1 ( x ) = cos x 1 π 2 cos x 2 π 2 1 / 1 + h x 1 f 2 ( x ) = cos x 1 π 2 sin x 2 π 2 1 / 1 + h x 1 f 3 ( x ) = 1 + h x 1 sin x 1 π 2 [ 0 , 1 ]
Table 2. Algorithm performance comparison.
NameAlgorithmOptimum ValueIterationsTime/s
F1PSO3.27 × 10 1 167118
GA1.56 × 10 2 231182
GWO5.61 × 10 1 10482
BAS7.45 × 10 1 10775
BWOA7.45 × 10 5 5265
MIBWOA02637
F2PSO6.51 × 10 1 198125
GA2.67 × 10 2 241167
GWO8.10 × 10 0 12777
BAS3.12 × 10 1 11464
BWOA5.68 × 10 6 7674
MIBWOA01444
Table 3. Multi-objective indicator test results.
IndicatorsNamePSOGAGWOBASMIBWOABWOA
IGDF30.35570.20720.15130.16640.01090.1284
F40.851.07830.43470.27420.24700.3428
HYPF30.06570.08980.18850.33190.55010.3442
F40.78340.24011.38081.73112.13171.5477
PSPF31.74244.12855.25554.05256.19145.7467
F41.17390.92512.26473.63614.04782.9134
Table 4. Performance of distributed power generation placement scheme selection results with different algorithms on the IEEE-33 system without load forecasting comparison.
AlgorithmPower Loss/kWVoltage DeviationCarbon Emissions/kgSelect Node
112.860.9084,82531, 28, 13
MIBWOA113.690.9287,17715, 32, 29
Pareto114.521.0483,48513, 7, 31
solution set118.070.9888,60432, 14, 11
119.060.8788,44211, 32, 16
BWOA126.540.9397,33615, 16, 30
DA135.821.1498,44613, 11, 22
SMA135.840.9999,49314, 17, 25
SA144.470.94104,00014, 12, 11
WOA139.060.99102,06010, 11, 12
Table 5. Performance of distributed power generation placement scheme selection results with different algorithms on the IEEE-33 system with load forecasting.
AlgorithmPower Loss/kWVoltage DeviationCarbon Emissions/kgSelect Node
63.570.9674,28913, 16, 17
MIBWOA64.570.9774,16915, 16, 17
Pareto63.590.9774,33414, 15, 16
solution set63.720.9774,63213, 14, 15
63.880.9674,97112, 13, 14
BWOA66.041.0474,54814, 17, 31
DA66.521.0176,23813, 25, 30
SMA66.380.9875,22313, 14, 29
SA67.590.9976,1154, 9, 17
WOA65.851.0374,62514, 11, 17
Table 6. Algorithm performance comparison.
AlgorithmIterationsTime/sOptimum Probability/%
BOA2136.5470
SHO1724.6382
GSA1417.7486
BWOA1021.5584
MIBWOA311.32100
Table 7. Standard IEEE-33 system scheme without DG and load forecasting.
AlgorithmPower Loss/kWVoltage DeviationCarbon Emissions/kgOpen Circuit Code
144.581.0574,22328, 34, 9, 14, 32
MIBWOA142.431.0773,91128, 7, 10, 14, 37
Pareto140.711.0974,10128, 7, 10, 14, 32
solution141.921.0674,11028, 7, 9, 14, 37
set139.981.0874,29628, 7, 9, 14, 32
139.551.1574,38733, 7, 9, 14, 32
BWOA149.641.1976,58128, 6, 10, 14, 32
BOA152.981.1974,85527, 6, 9, 14, 37
SHO147.281.2174,43328, 7, 11, 14, 37
GSA145.031.2381,65828, 7, 10, 13, 32
Initial state202.681.7096,32133, 34, 35, 36, 37
Table 8. Standard IEEE-33 system scheme with DG and load forecasting.
AlgorithmPower Loss/kWVoltage DeviationCarbon Emissions/kgOpen Circuit Code
95.620.6642,22328, 34, 9, 14, 32
MIBWOA99.260.7240,91126, 7, 10, 14, 37
Pareto94.340.6741,07327, 7, 10, 14, 16
solution94.220.6741,14727, 7, 10, 14, 17
set97.820.7040,81927, 7, 10, 14, 37
89.80.6243,82028, 34, 10, 14, 17
BWOA106.040.8252,65928, 6, 10, 14, 32
BOA105.580.7552,76227, 6, 9, 14, 37
SHO104.980.7651,55028, 7, 11, 13, 37
GSA111.110.7847,25728, 7, 9, 13, 32
Initial state149.781.0781,07333, 34, 35, 36, 37
Table 9. Algorithm performance comparison.
AlgorithmIterationsTime/sOptimum Probability/%
BOA3328.4766
SHO2622.8378
GSA1513.8782
BWOA1215.7380
MIBWOA55.83100
Table 10. IEEE-33 dynamic DNR results, including DG and load forecasting.
PeriodPower Loss/kWVoltage DeviationCarbon Emissions/kgOpen Circuit Code
period 130.630.5355,973.7628, 34, 9, 14, 16
Initial state58.721.0883,400.9633, 34, 35, 36, 37
period 236.650.5860,639.9228, 34, 9, 14, 16
Initial state36.650.5860,639.9228, 34, 9, 14, 16
period 335.280.5758,325.4028, 7, 9, 14, 16
Initial state36.410.5760,504.4228, 34, 9, 14, 16
period 439.620.663,719.0628, 7, 10, 14, 17
Initial state43.380.6559,969.6128, 7, 9, 14, 16
period 539.90.6260,236.3828, 7, 9, 14, 17
Initial state40.340.662,923.7328, 7, 10, 14, 17
period 632.950.5557,093.8127, 34, 9, 14, 17
Initial state34.850.5854,383.9728, 7, 9, 14, 17
period 739.910.663,535.5828, 34, 9, 14, 17
Initial state40.880.6163,668.8427, 34, 9, 14, 17
period 8360.5857,810.3428, 7, 9, 14, 17
Initial state38.450.5861,374.5528, 34, 9, 14, 17
period 916.790.3941,052.6528, 34, 9, 14, 17
Initial state20.340.4541,856.5828, 7, 9, 14, 17
period 1035.560.5856,877.0928, 7, 10, 14, 16
Initial state41.80.6264,542.3728, 34, 9, 14, 17
period 1129.940.5252,874.2928, 7, 9, 14, 16
Initial state38.660.660,677.0228, 7, 10, 14, 16
period 1230.430.5355,337.4528, 34, 10, 14, 17
Initial state43.10.6461,941.5128, 7, 9, 14, 16
period 1334.370.5655,509.7628, 7, 10, 14, 37
Initial state47.640.6667,773.8728, 34, 10, 14, 17
period 1427.880.5150,240.6028, 7, 10, 14, 37
Initial state27.880.5150,240.6028, 7, 10, 14, 37
period 1537.220.5958,199.4228, 7, 10, 14, 16
Initial state37.340.658,548.9728, 7, 10, 14, 37
period 1639.210.6159,878.3328, 7, 9, 14, 37
Initial state39.670.659,966.6828, 7, 10, 14, 16
period 1735.240.5759,063.1628, 34, 9, 14, 37
Initial state39.920.6455,480.0128, 7, 9, 14, 37
period 1846.250.6665,336.8528, 7, 10, 14, 16
Initial state47.420.6668,341.2528, 34, 9, 14, 37
period 1919.60.4342,968.2728, 7, 9, 14, 17
Initial state19.840.4343,463.5728, 7, 10, 14, 16
period 2039.410.6162,370.9327, 34, 10, 14, 37
Initial state40.290.6358,356.0828, 7, 9, 14, 17
period 2141.510.6361,445.817, 7, 9, 14, 17
Initial state440.6464,484.536, 34, 10, 14, 37
period 2236.470.5859,390.086, 34, 9, 14, 37
Initial state36.80.656,262.977, 7, 9, 14, 17
period 2341.690.6264,852.937, 34, 9, 14, 17
Initial state43.030.6464,916.336, 34, 9, 14, 37
period 2443.50.6251,392.007, 7, 9, 14, 17
Initial state44.790.7853,482.007, 34, 9, 14, 17
Table 11. Algorithm performance comparison.
AlgorithmIterationsTime/sOptimum Probability/%
BOA35216.4352
SHO27205.3866
GSA31142.3470
BWOA21150.2264
MIBWOA663.11100
Disclaimer/Publisher’s Note: The statements, opinions and data contained in all publications are solely those of the individual author(s) and contributor(s) and not of MDPI and/or the editor(s). MDPI and/or the editor(s) disclaim responsibility for any injury to people or property resulting from any ideas, methods, instructions or products referred to in the content.