

Experimental Study and Modeling of the Fracture Behavior, Mechanical Properties, and Bonding Strength of Oil Well Cement


Abstract
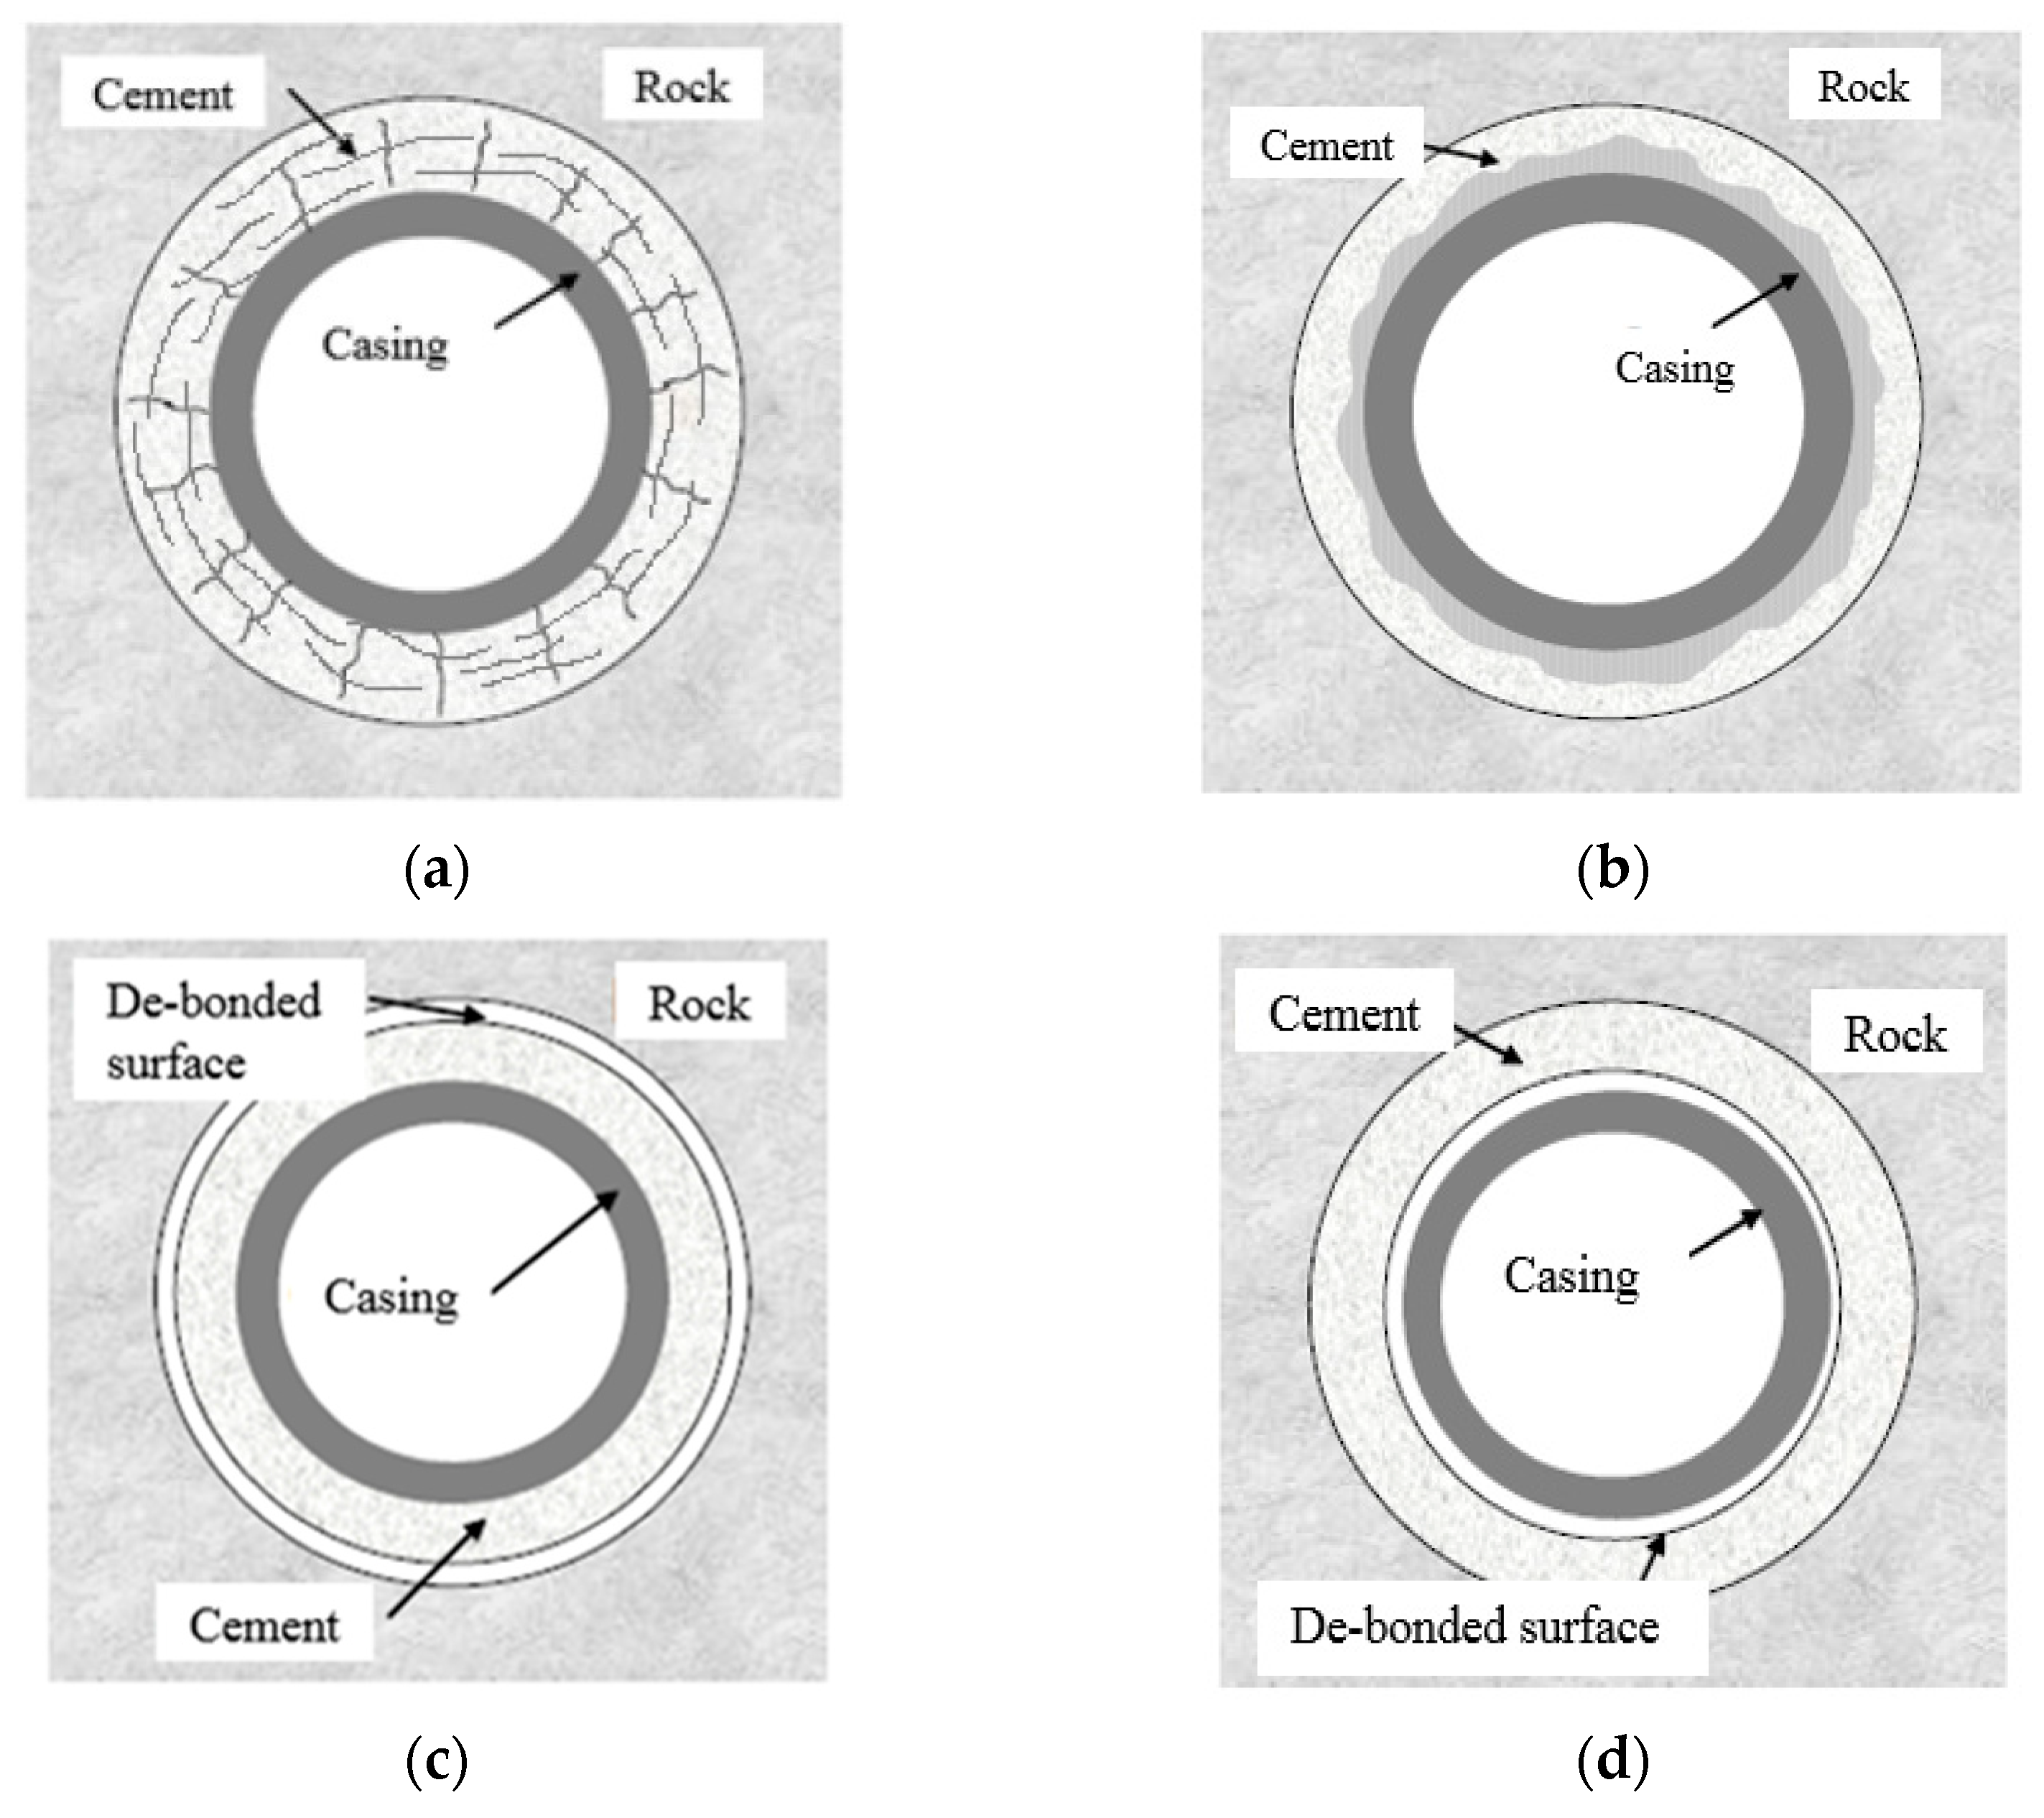
1. Introduction
Research Significance
- i.
- Identifying the mechanical properties of oil well cement at various curing times.
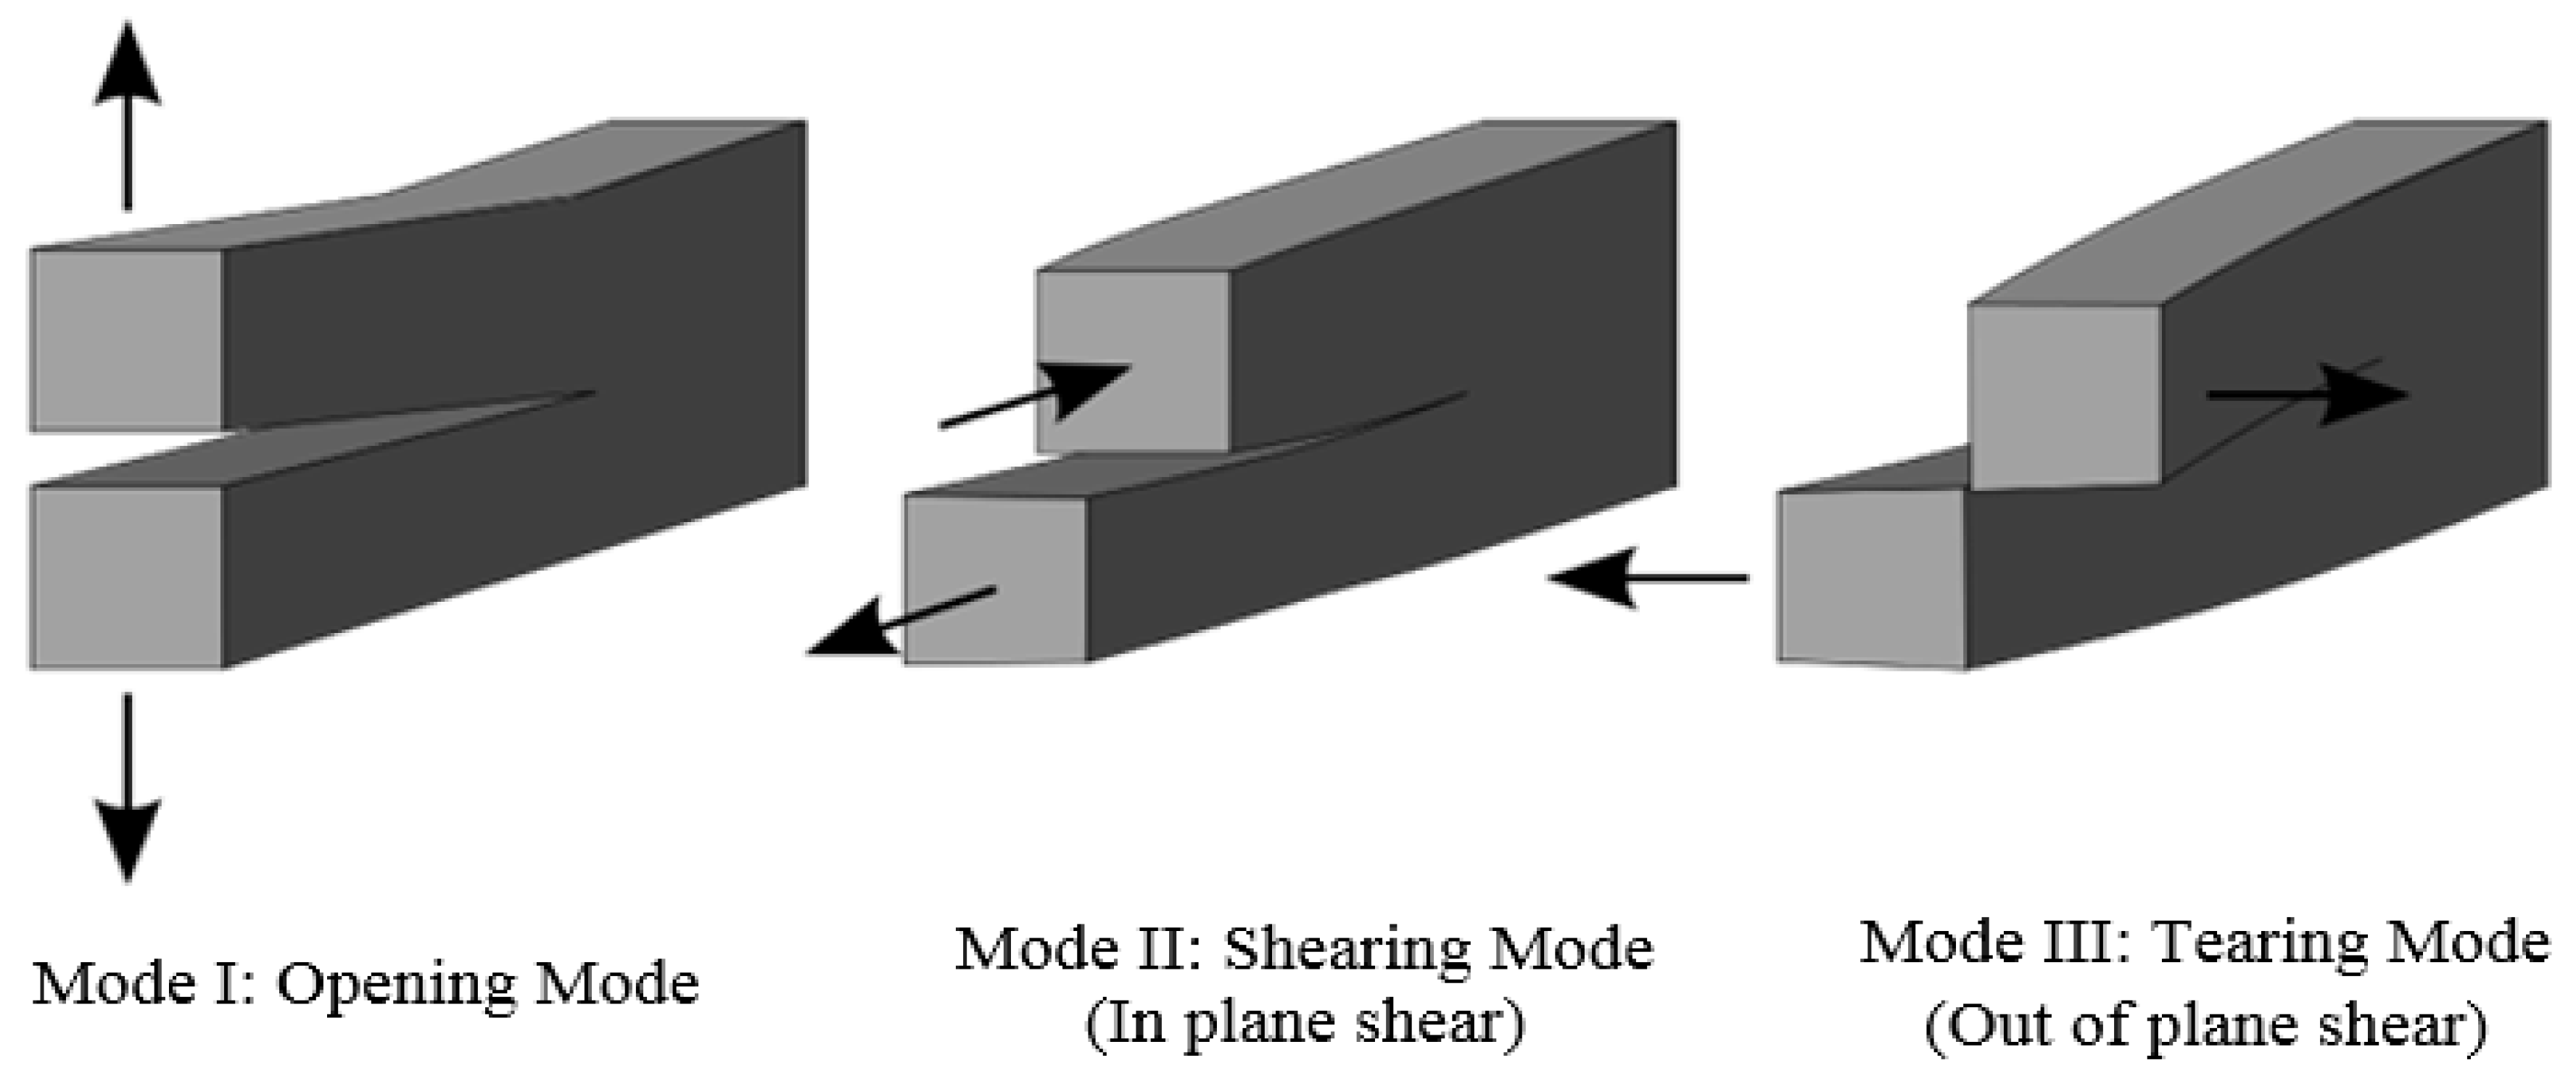
- ii.
- Researching Mode I and evaluating the fracture properties of oil well cement using three different a/d ratios.
- iii.
- Using the nonlinear Vipulanandan p-q to test and model the stress–strain behavior of oil well cement under compression and flexural stresses.
- iv.
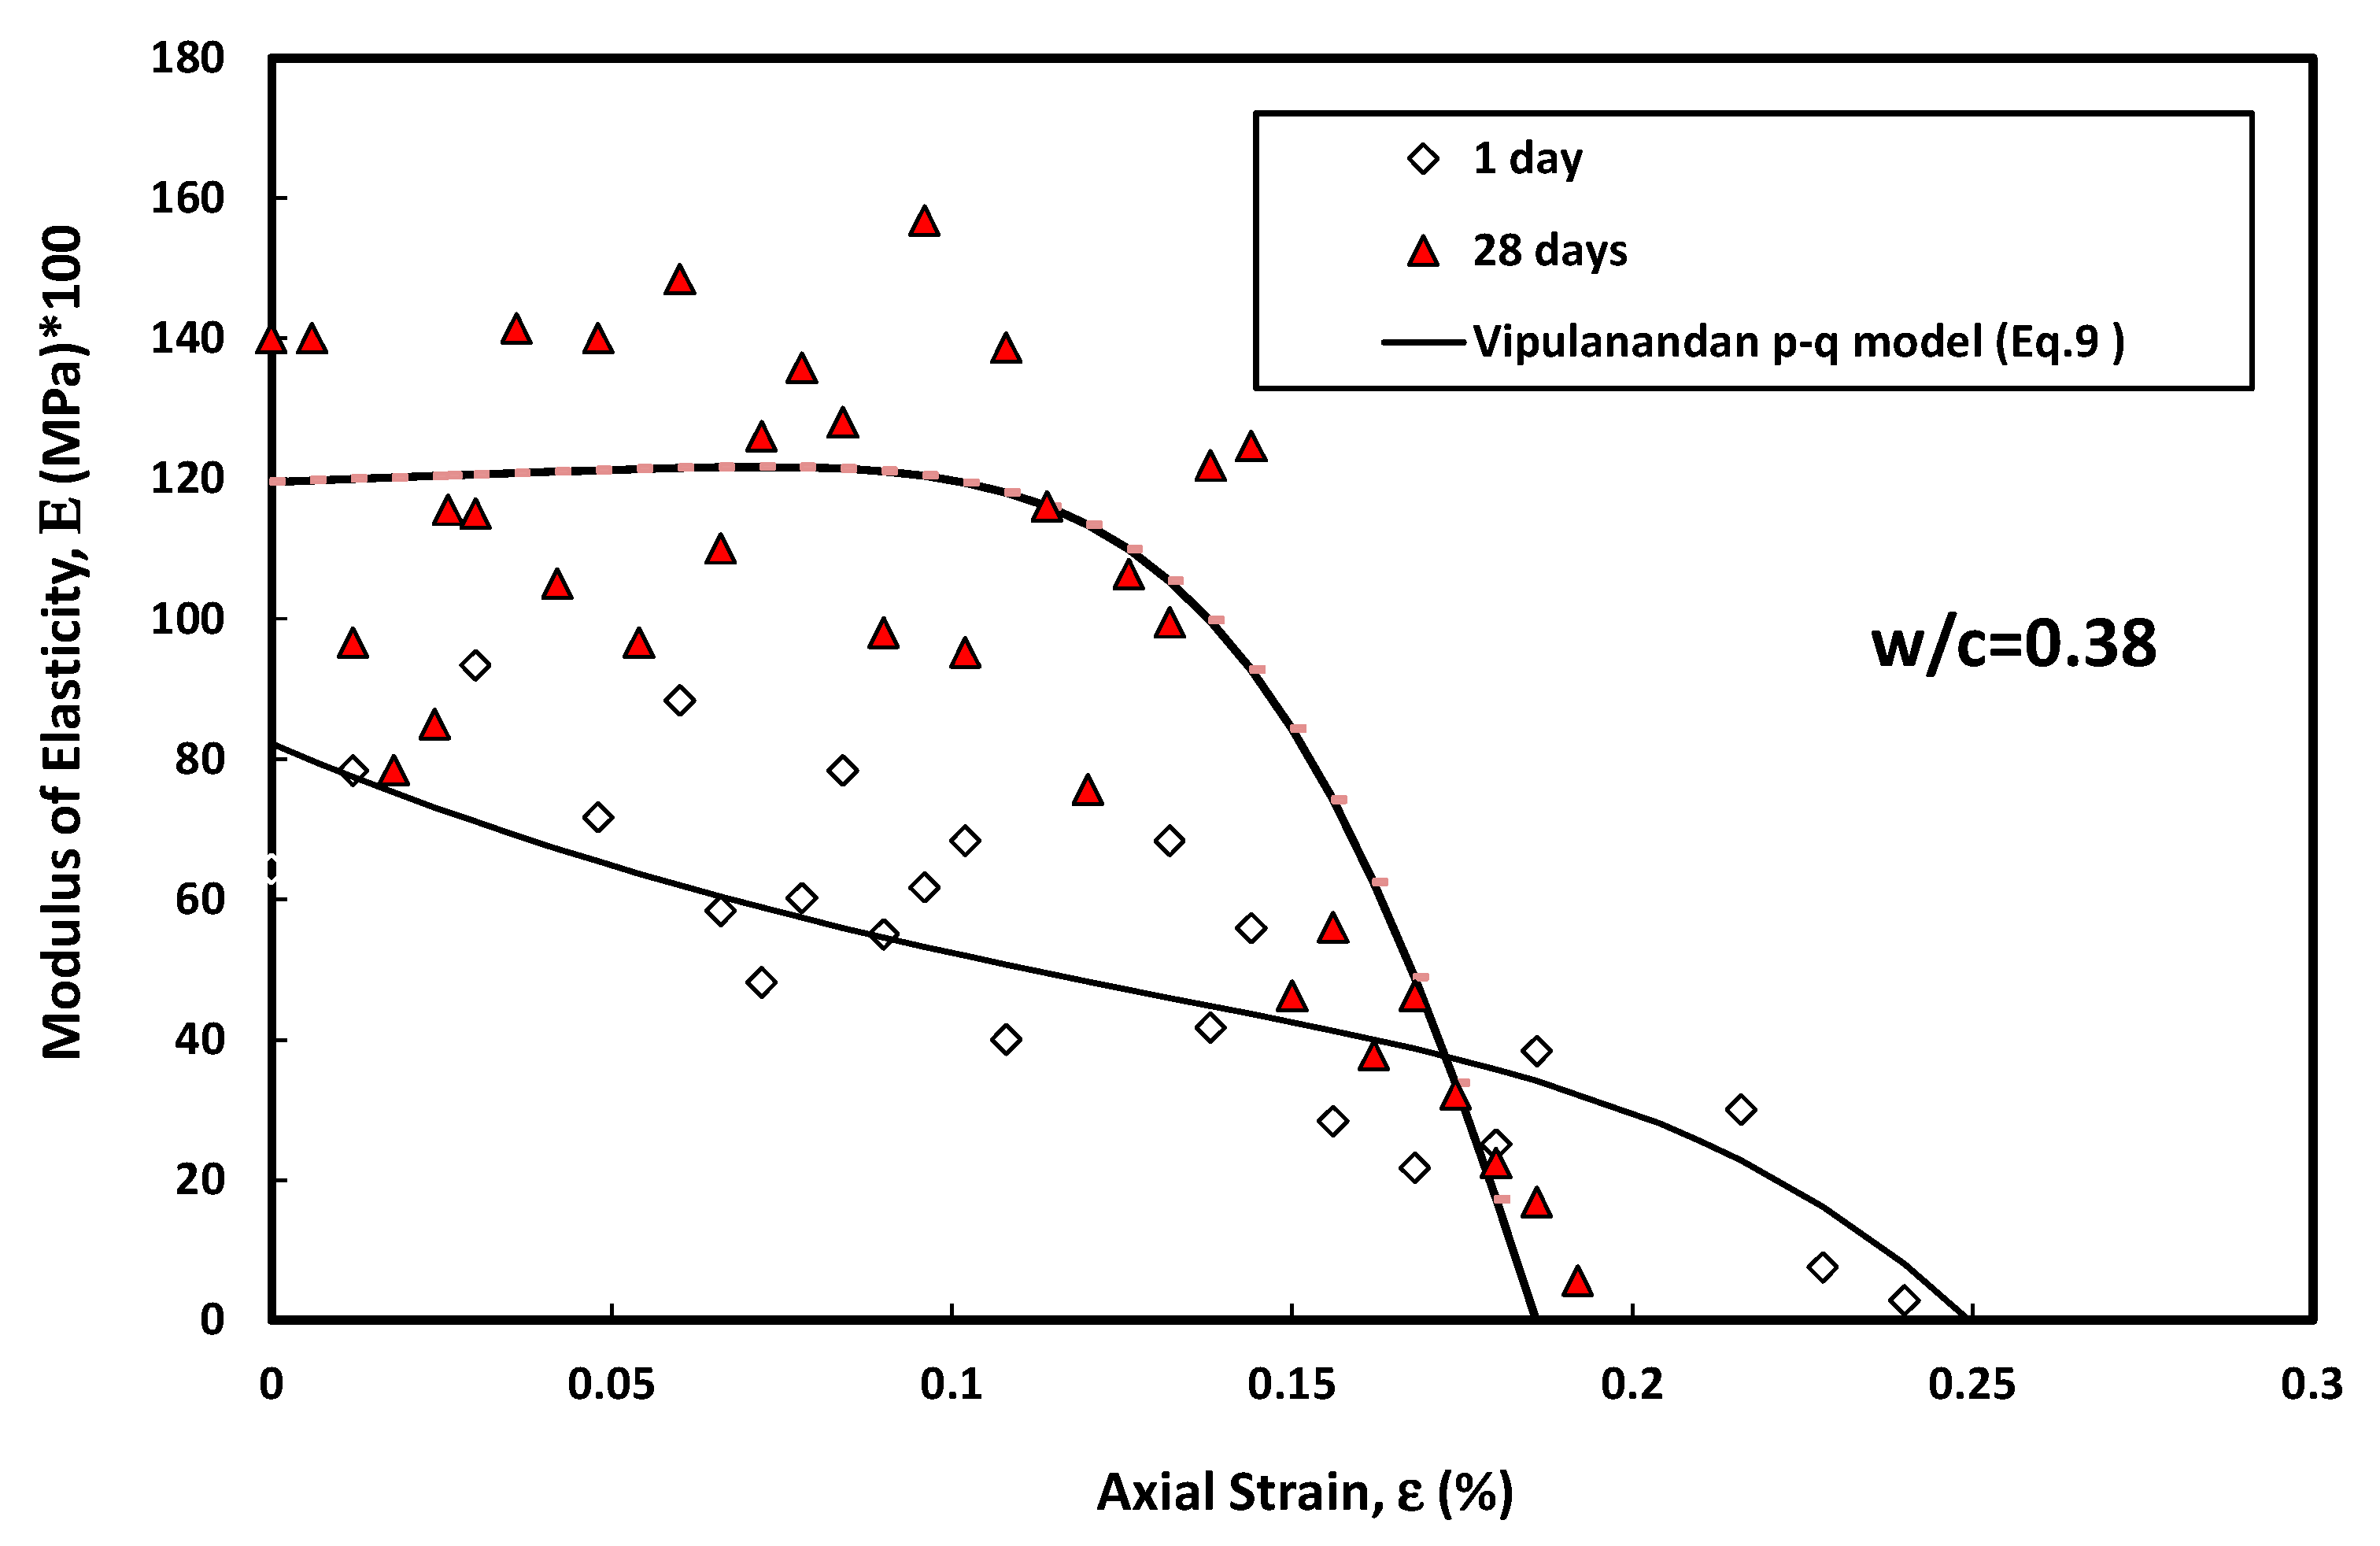
- Constructing a new model to predict the modulus of elasticity of cement under varying strains.
- v.
- Conducting a new protocol test to determine the bonding strength between the cement and steel casing in the oil well.
2. Methodology
2.1. Cement Characterization
2.2. Sample Mixture
2.3. Compressive Strength Test (ASTM C 39)
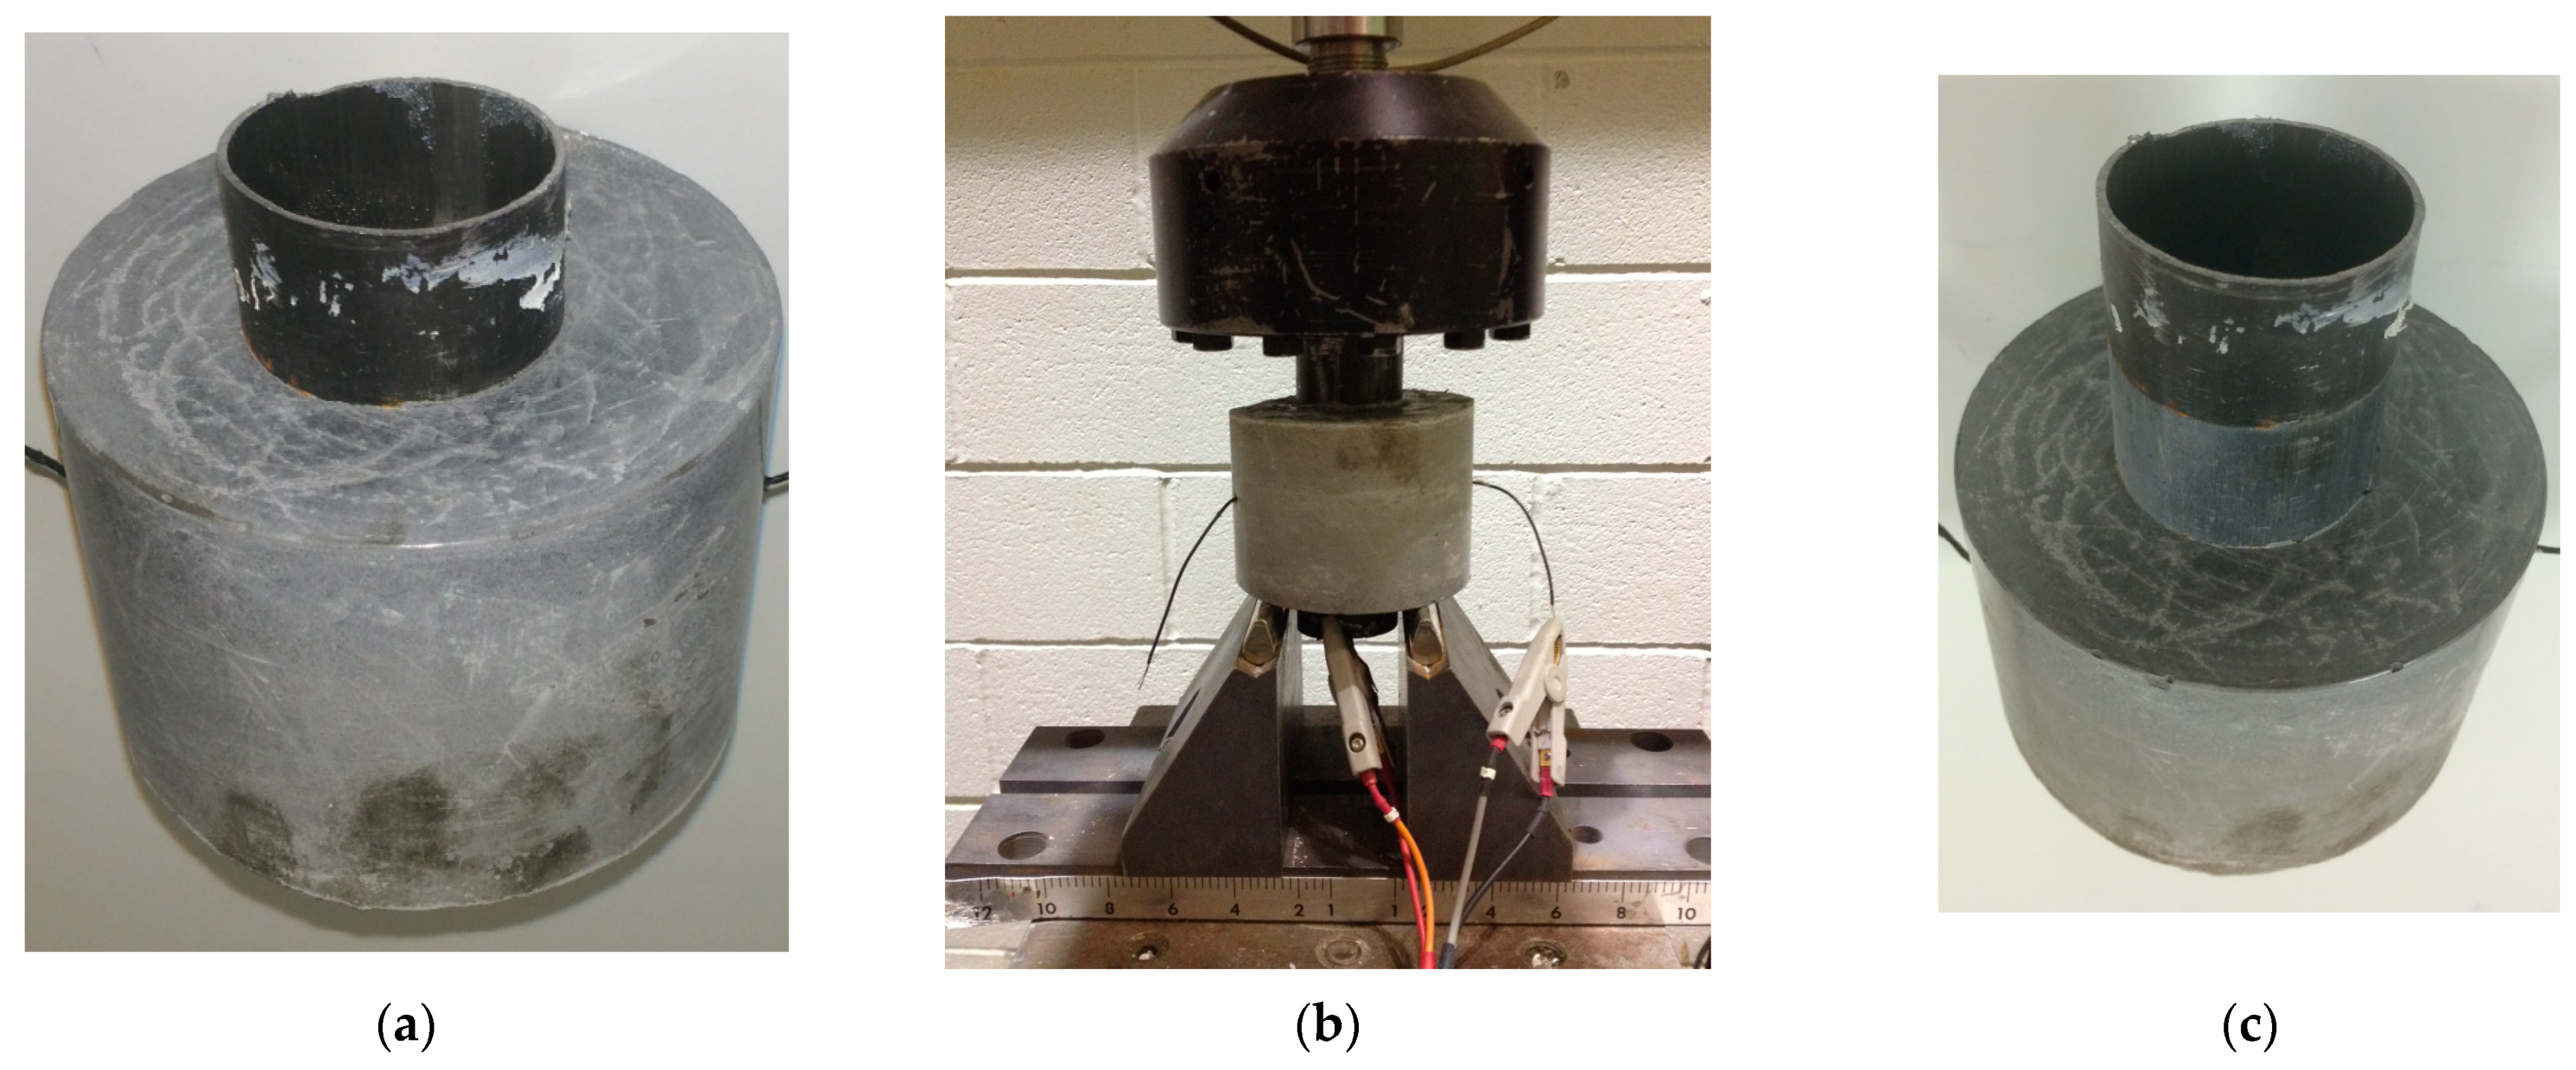
2.4. Bonding between Steel Casing–Cement
2.5. Flexural Strength Test
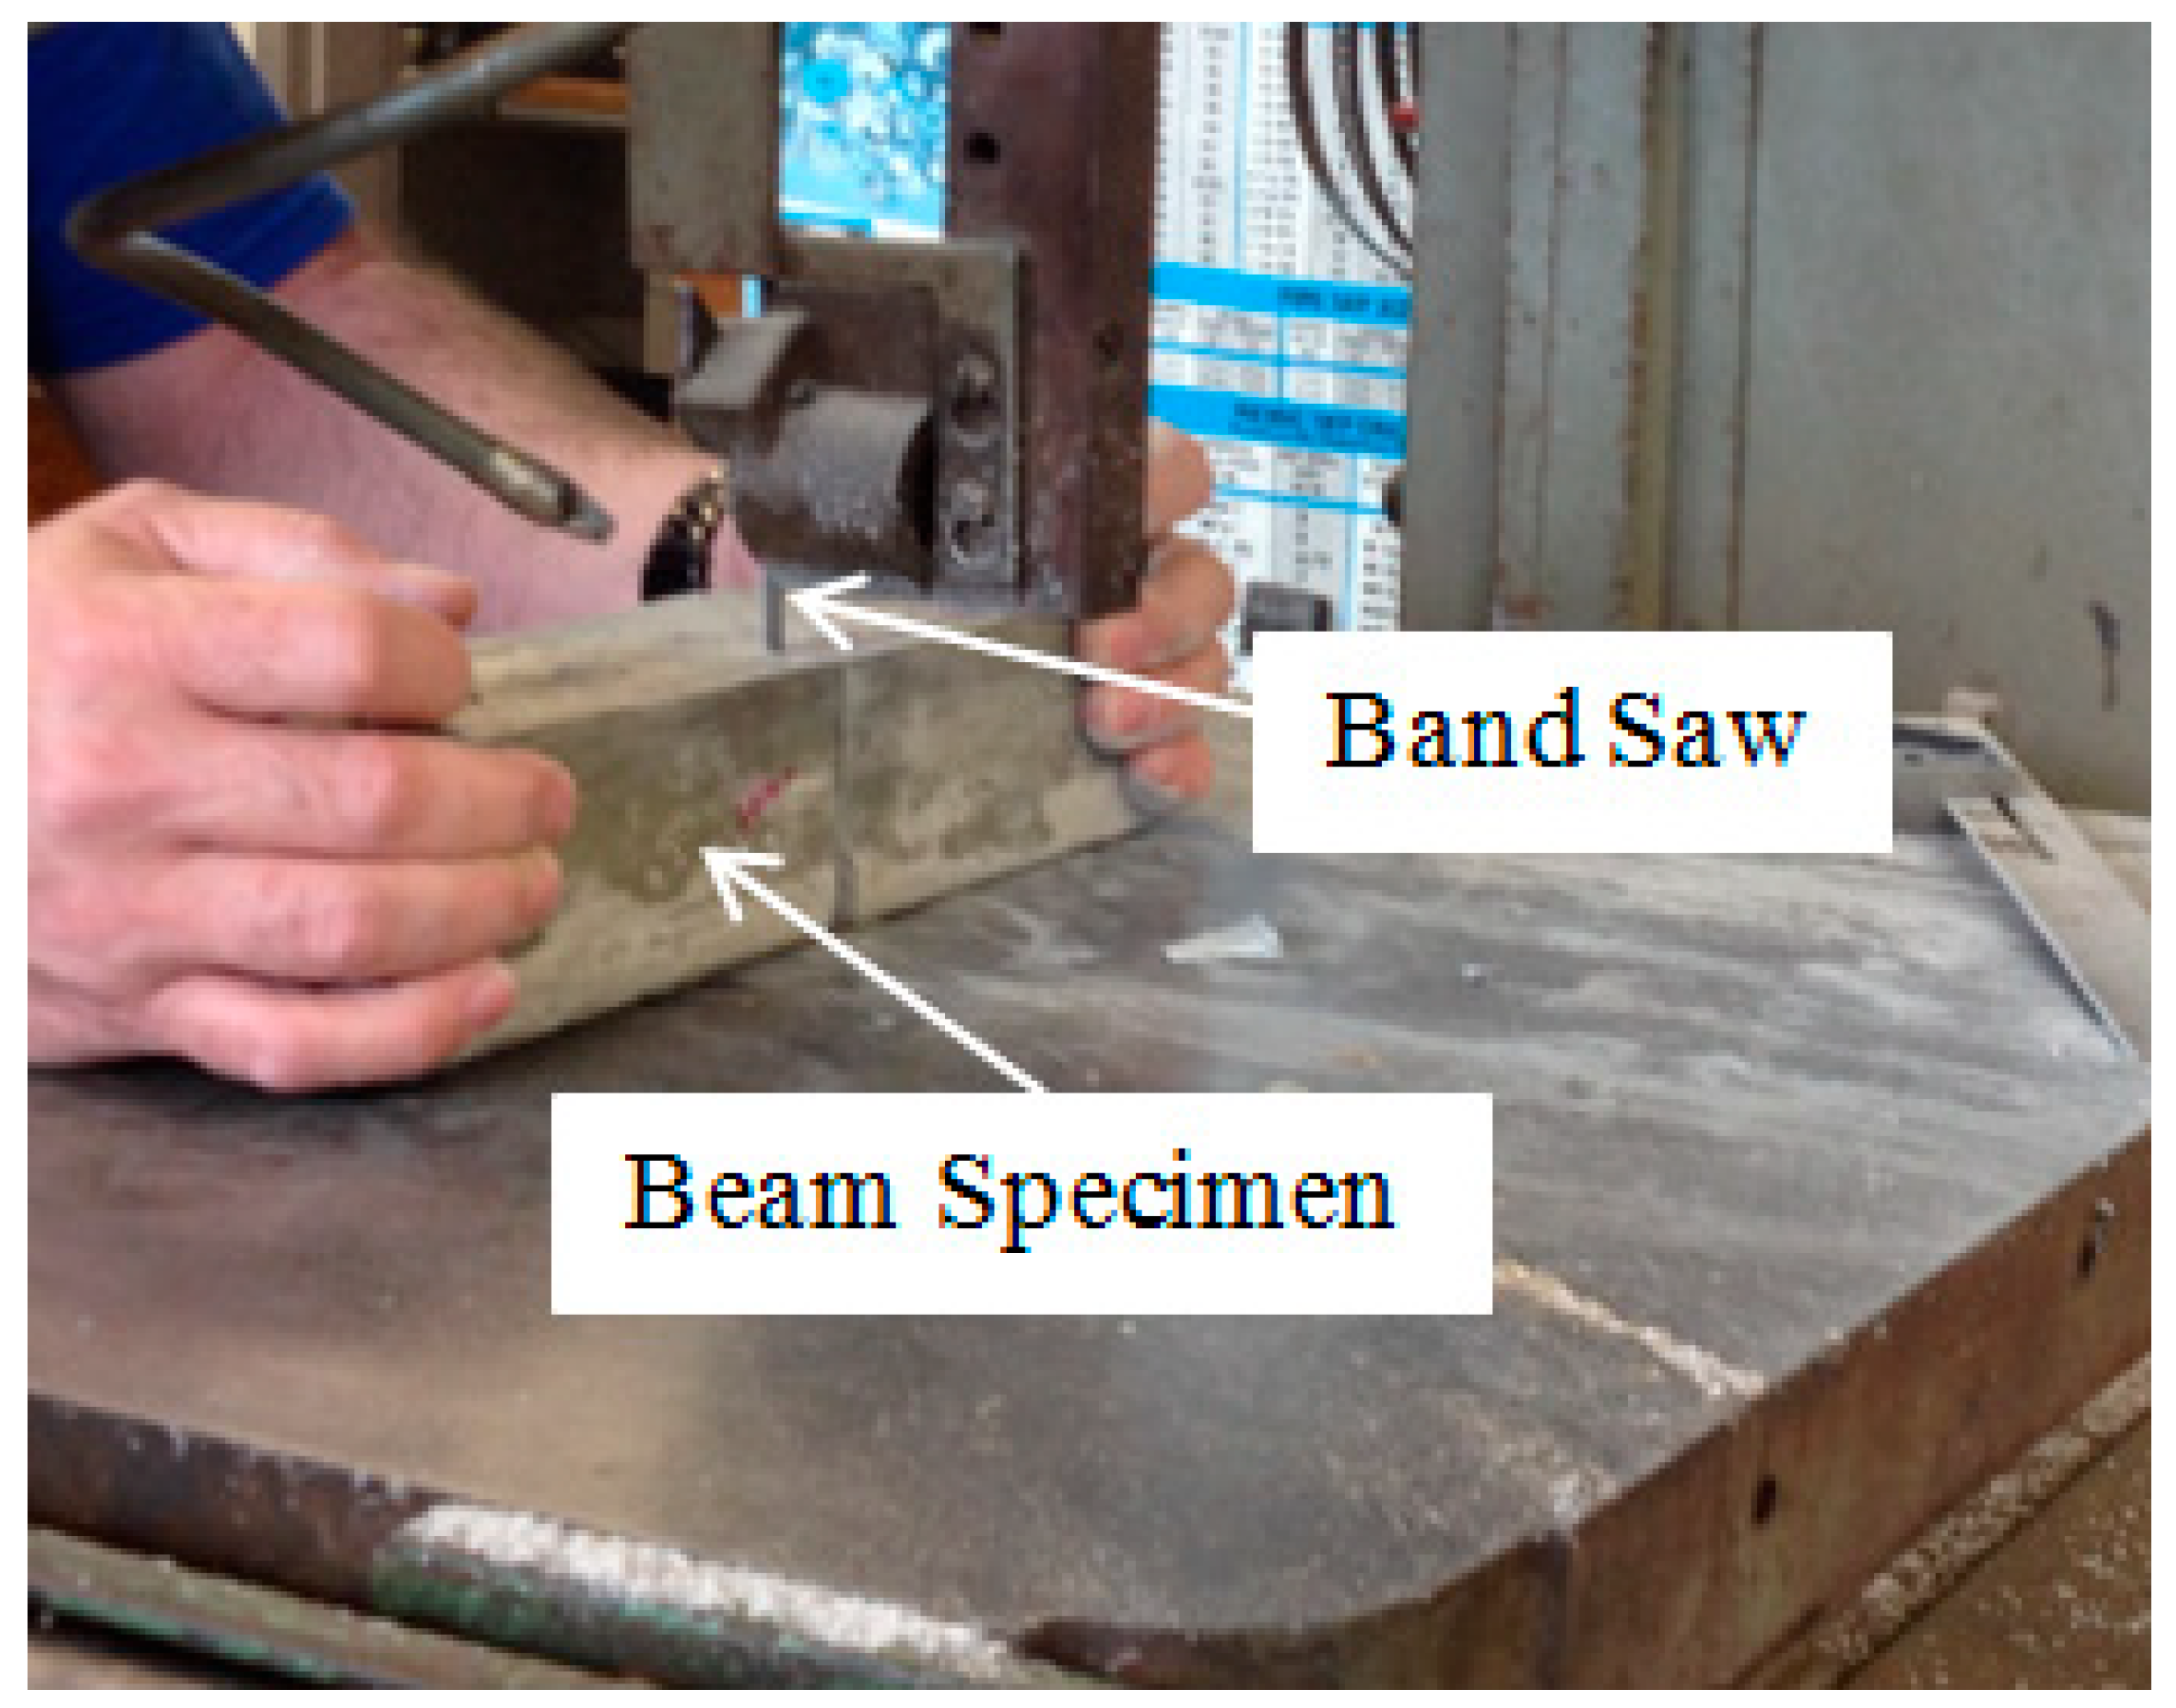
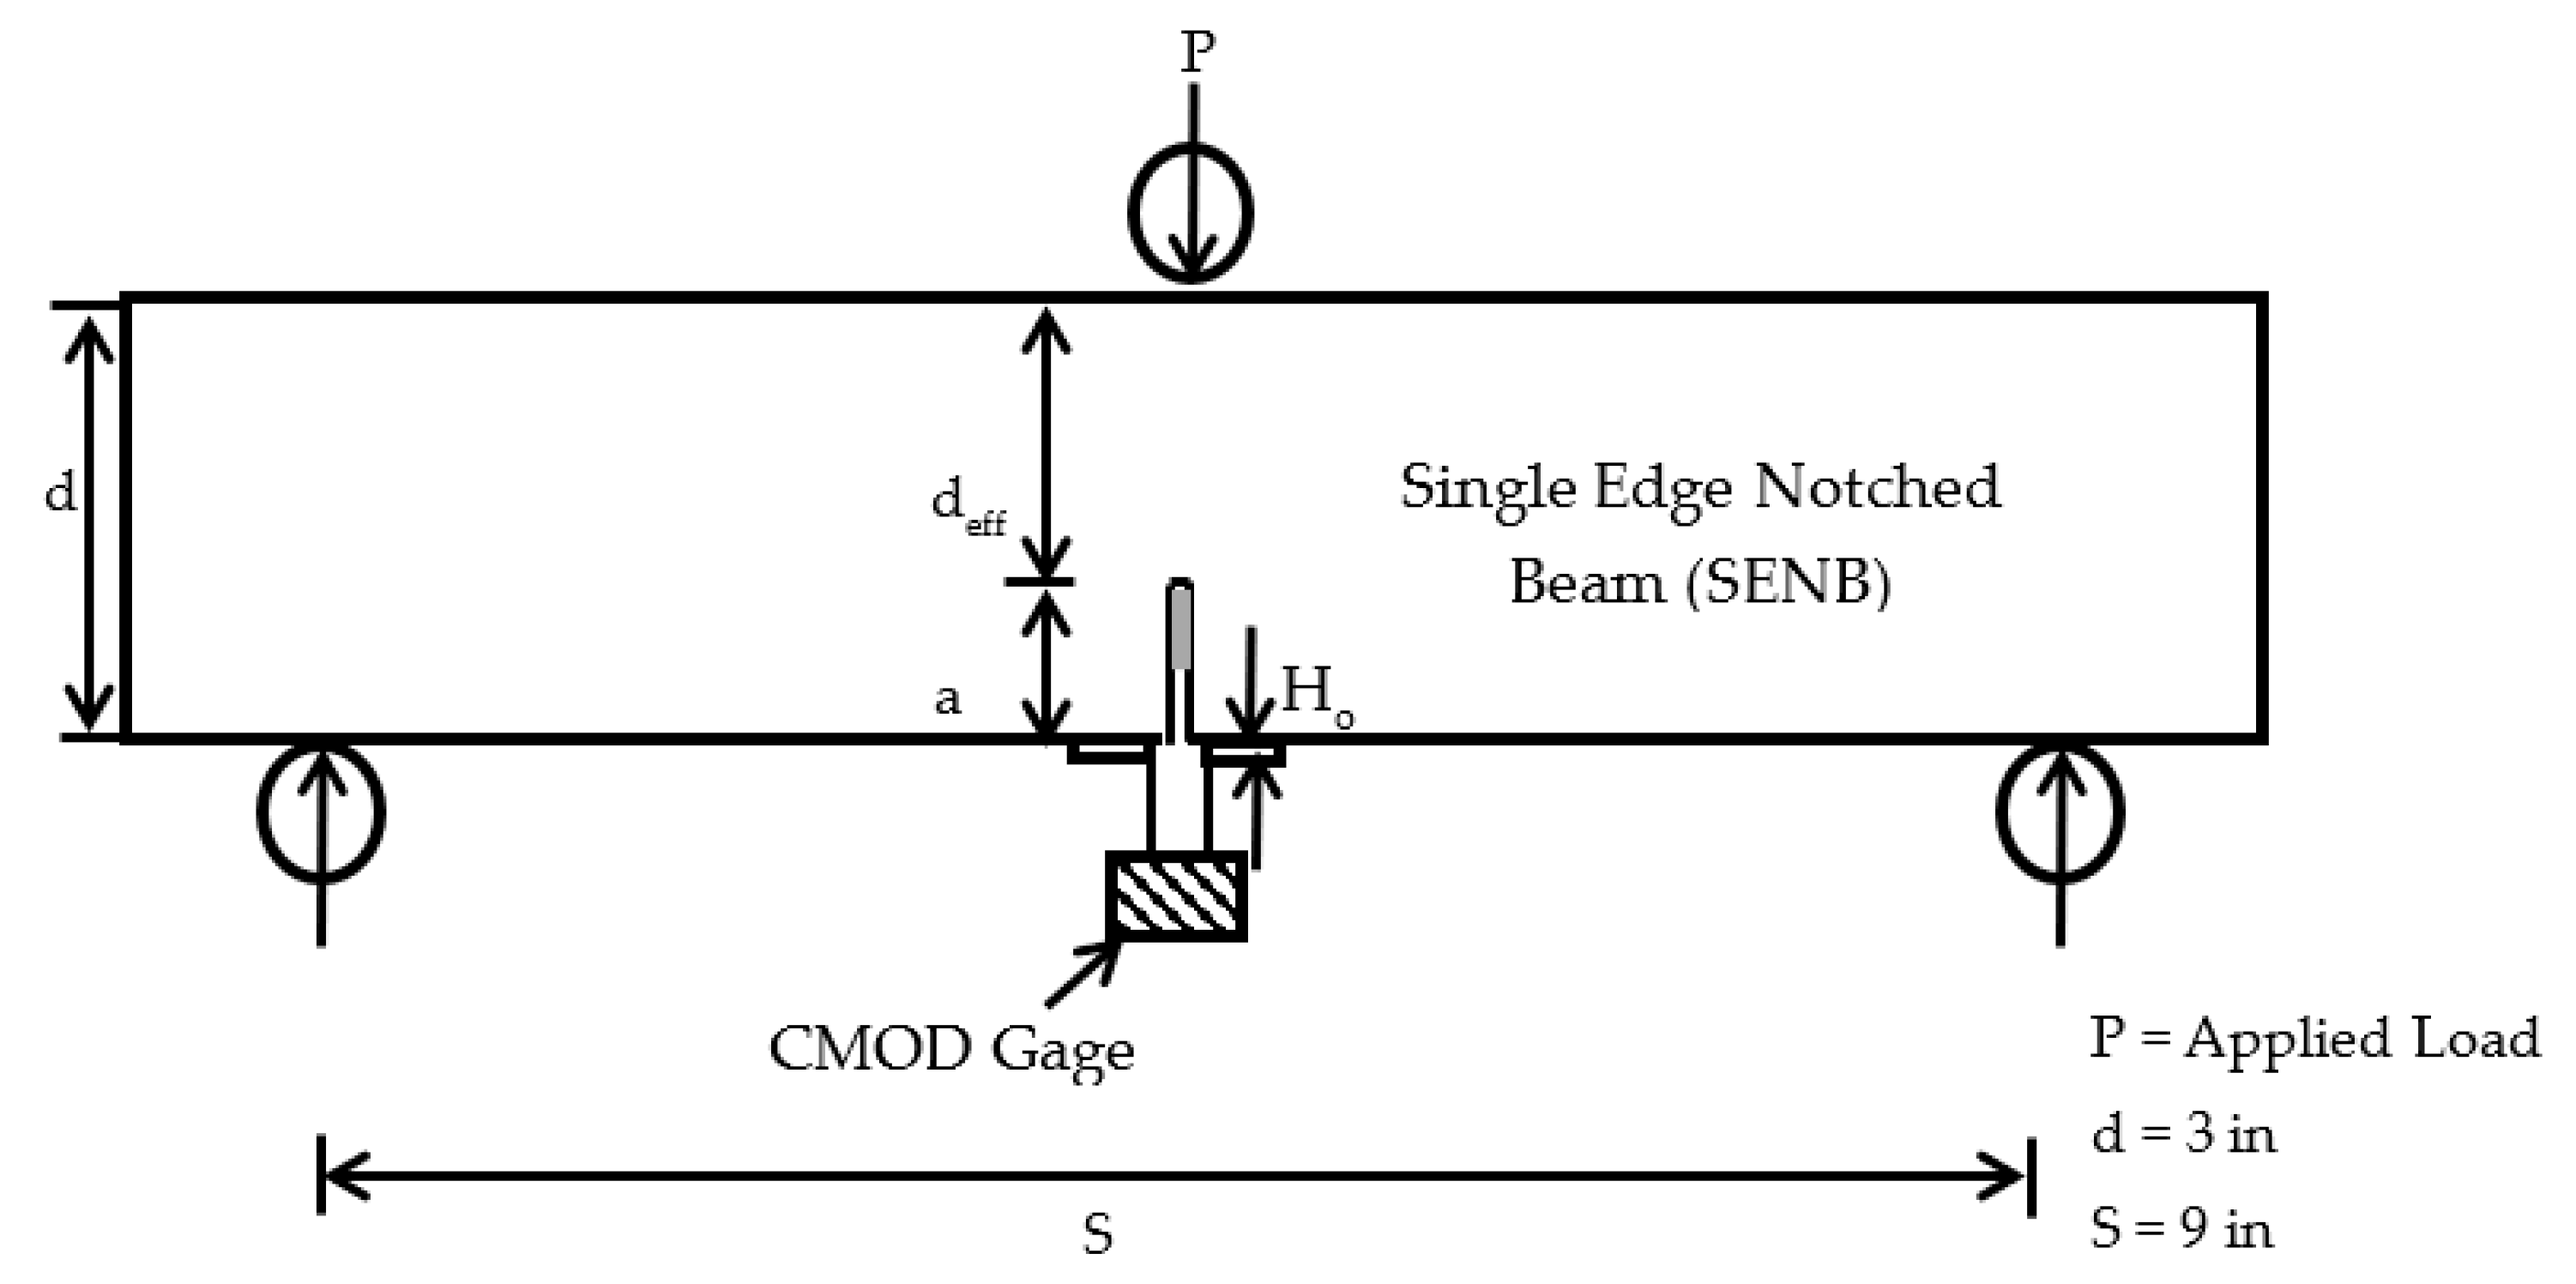
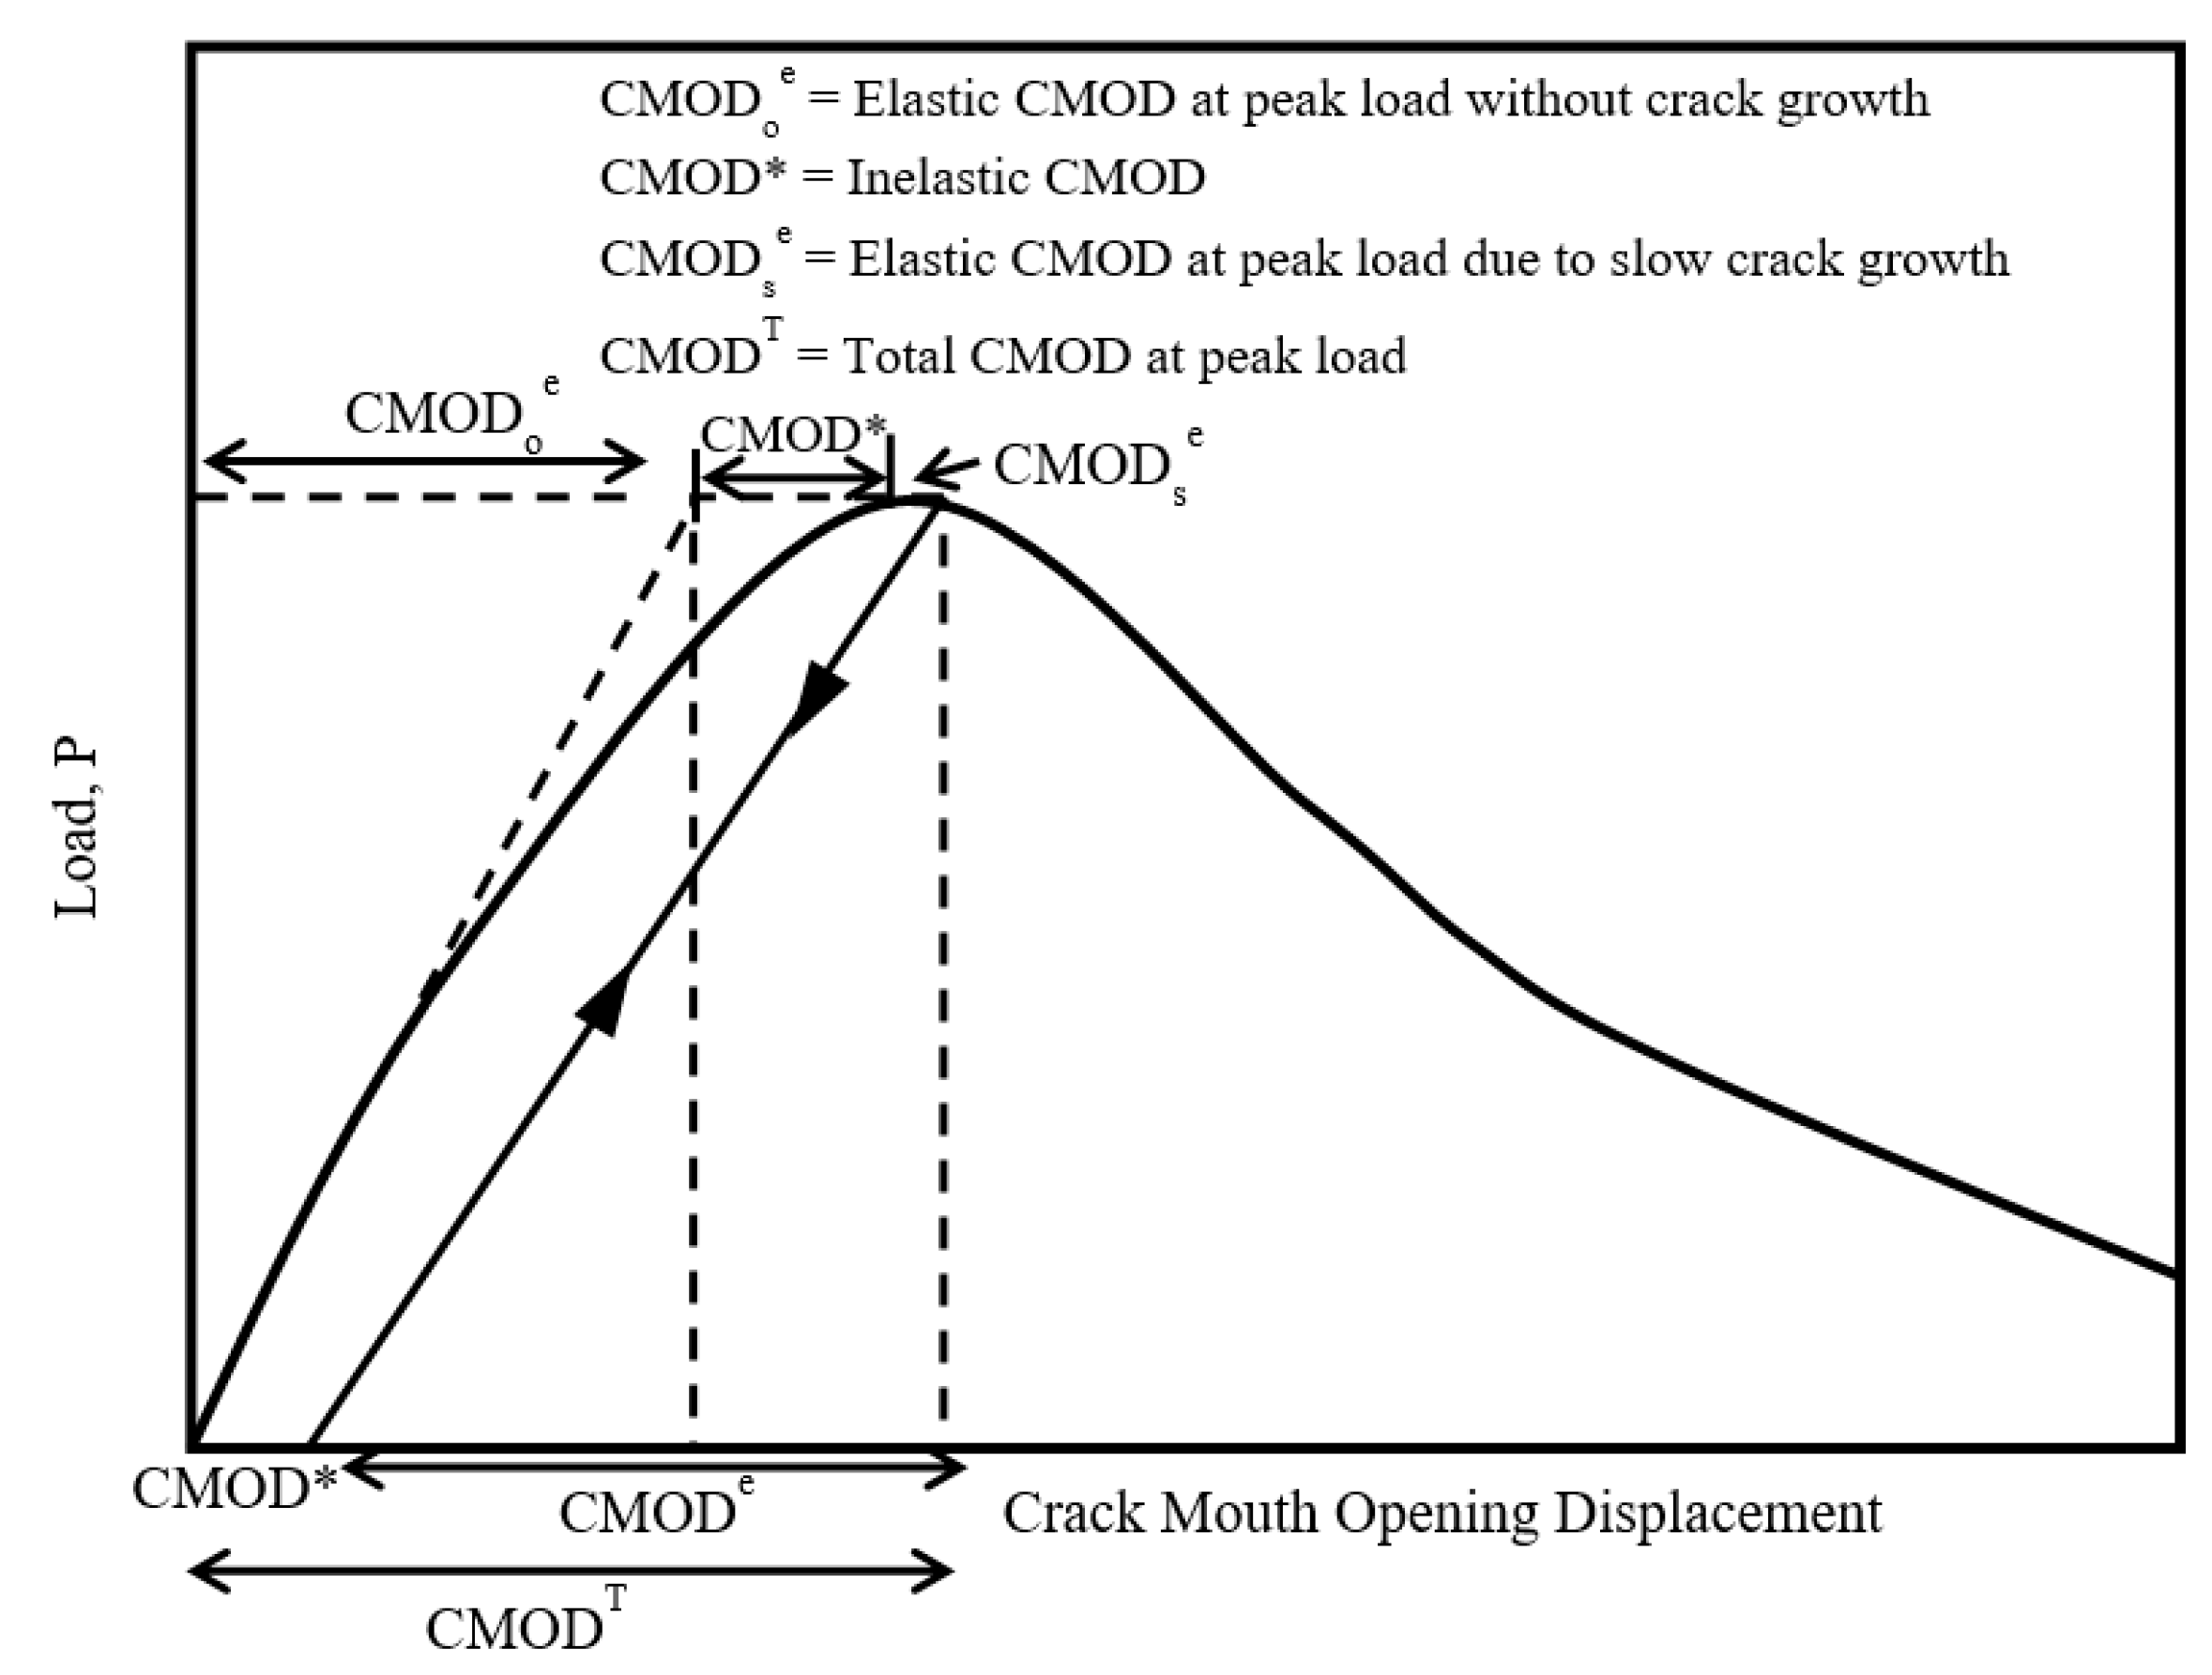
2.6. Fracture Toughness and CTOD
3. Results, Analysis, and Discussion
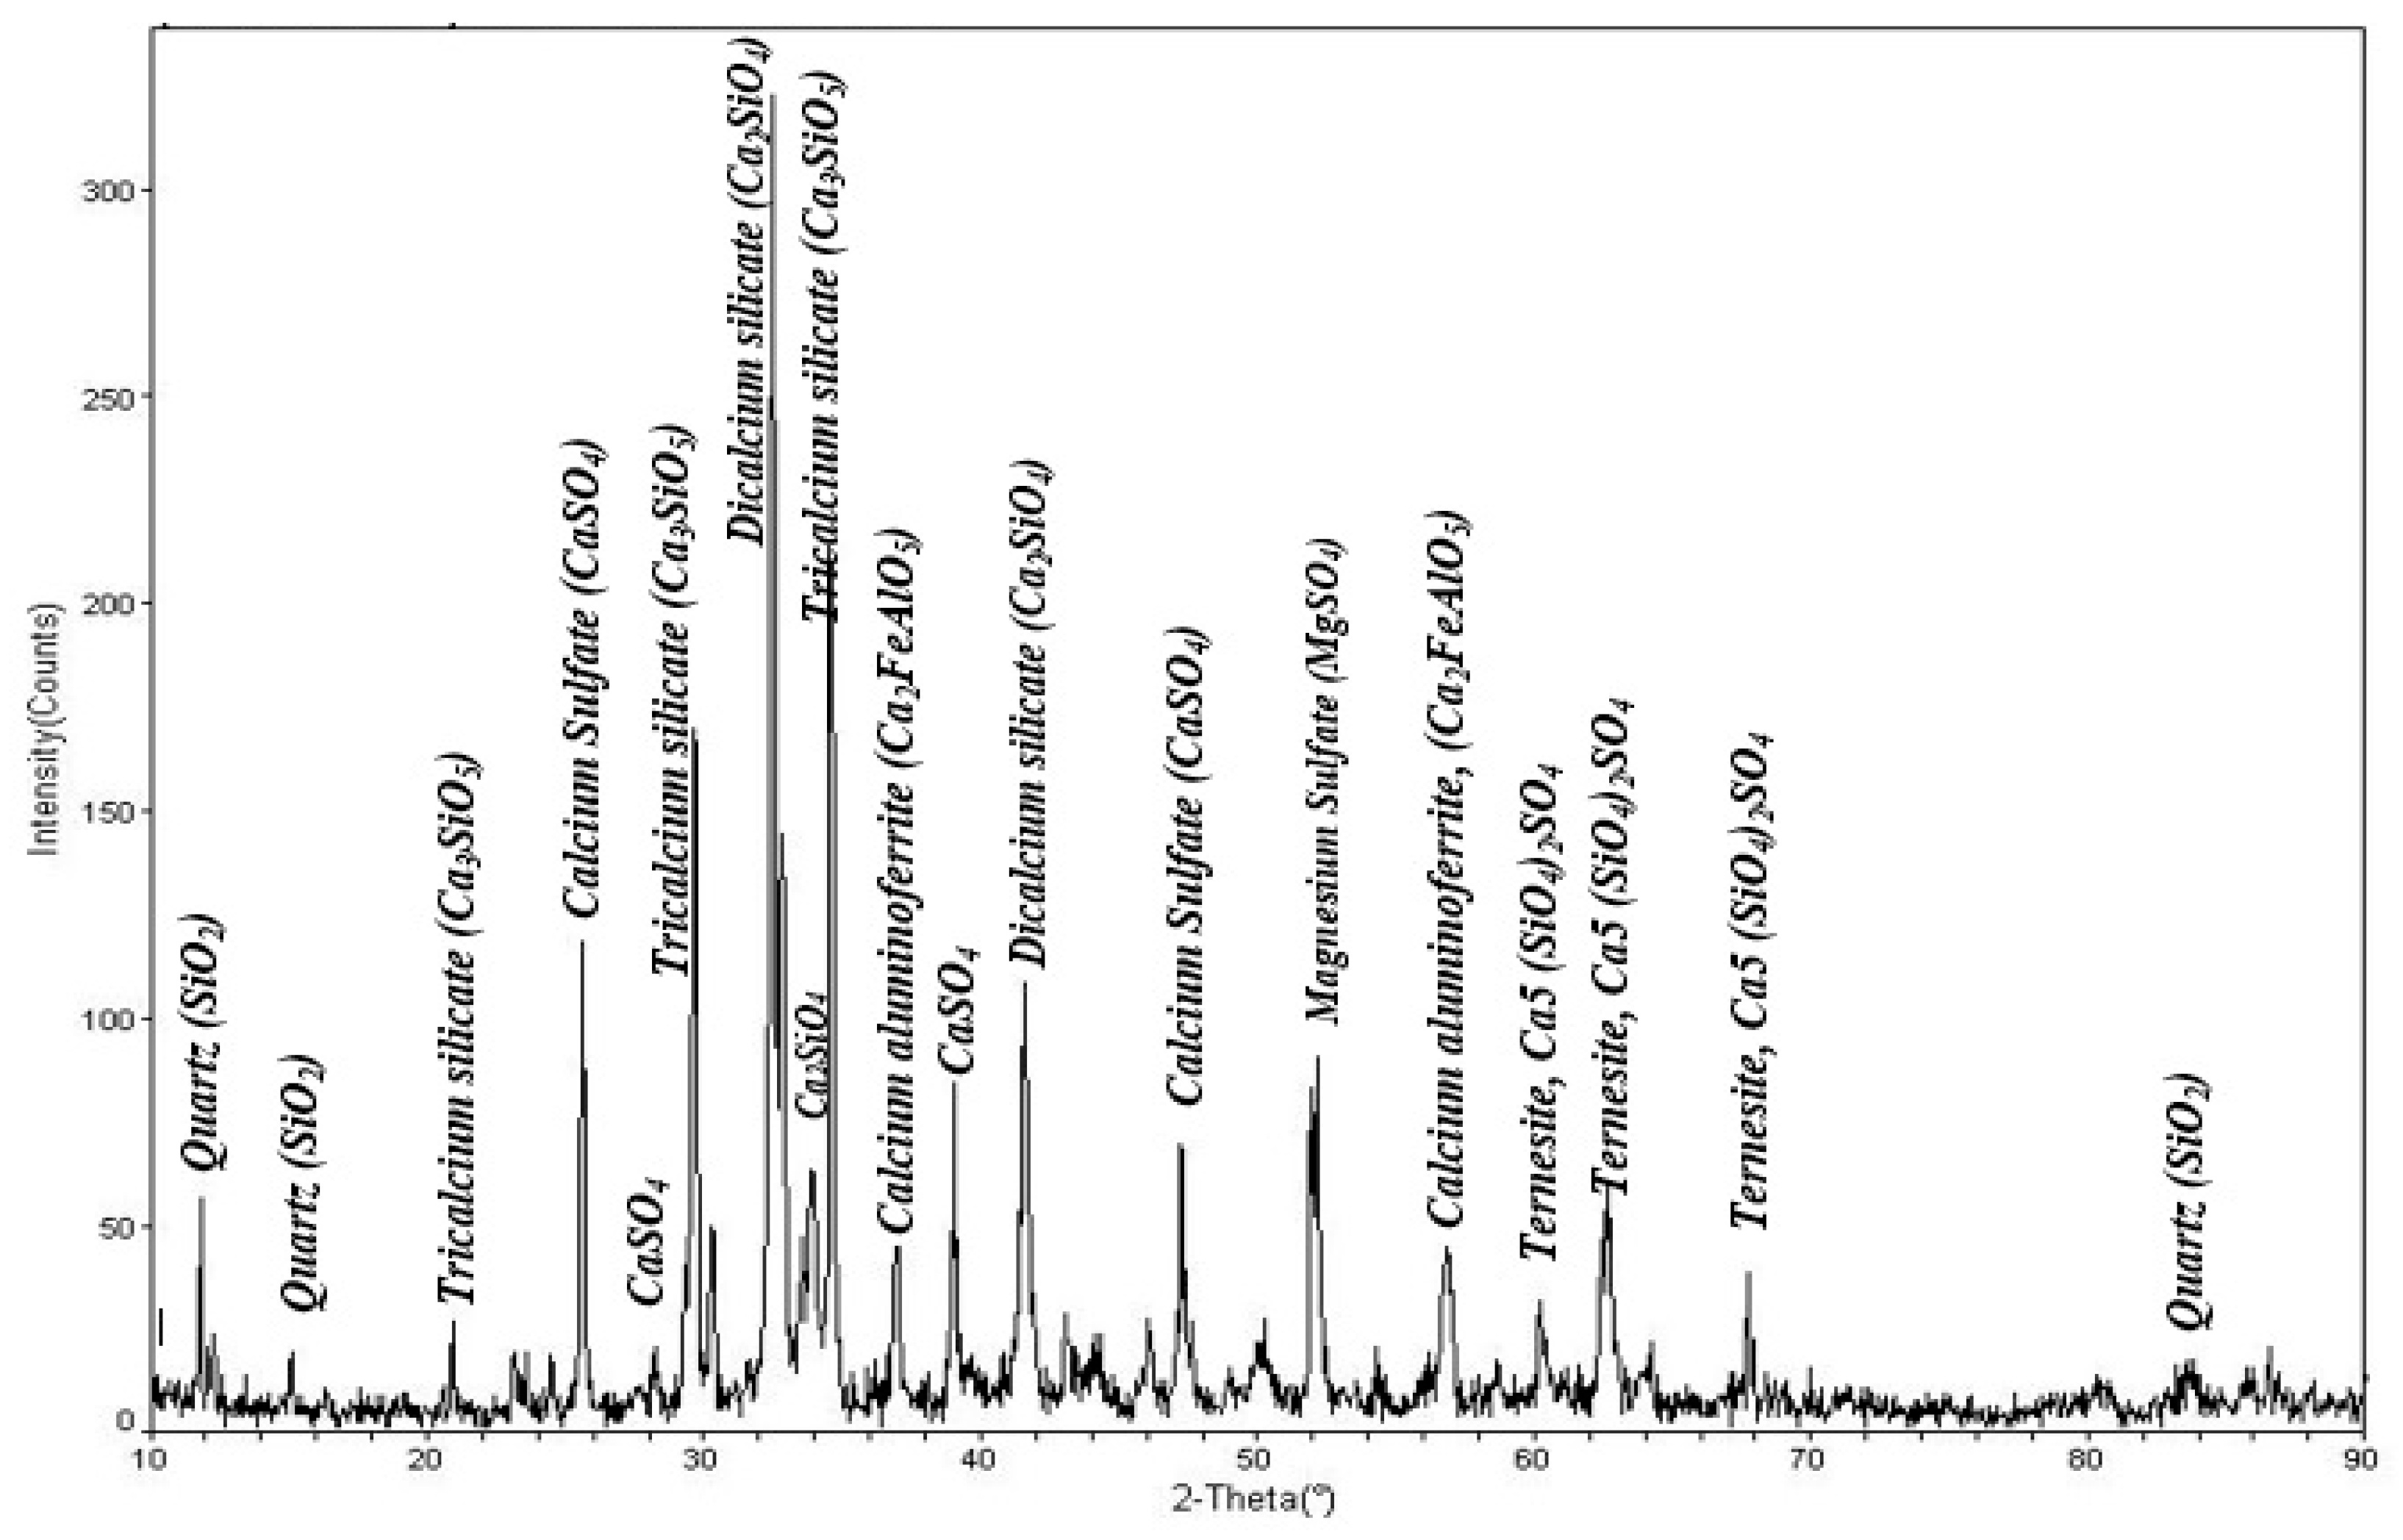
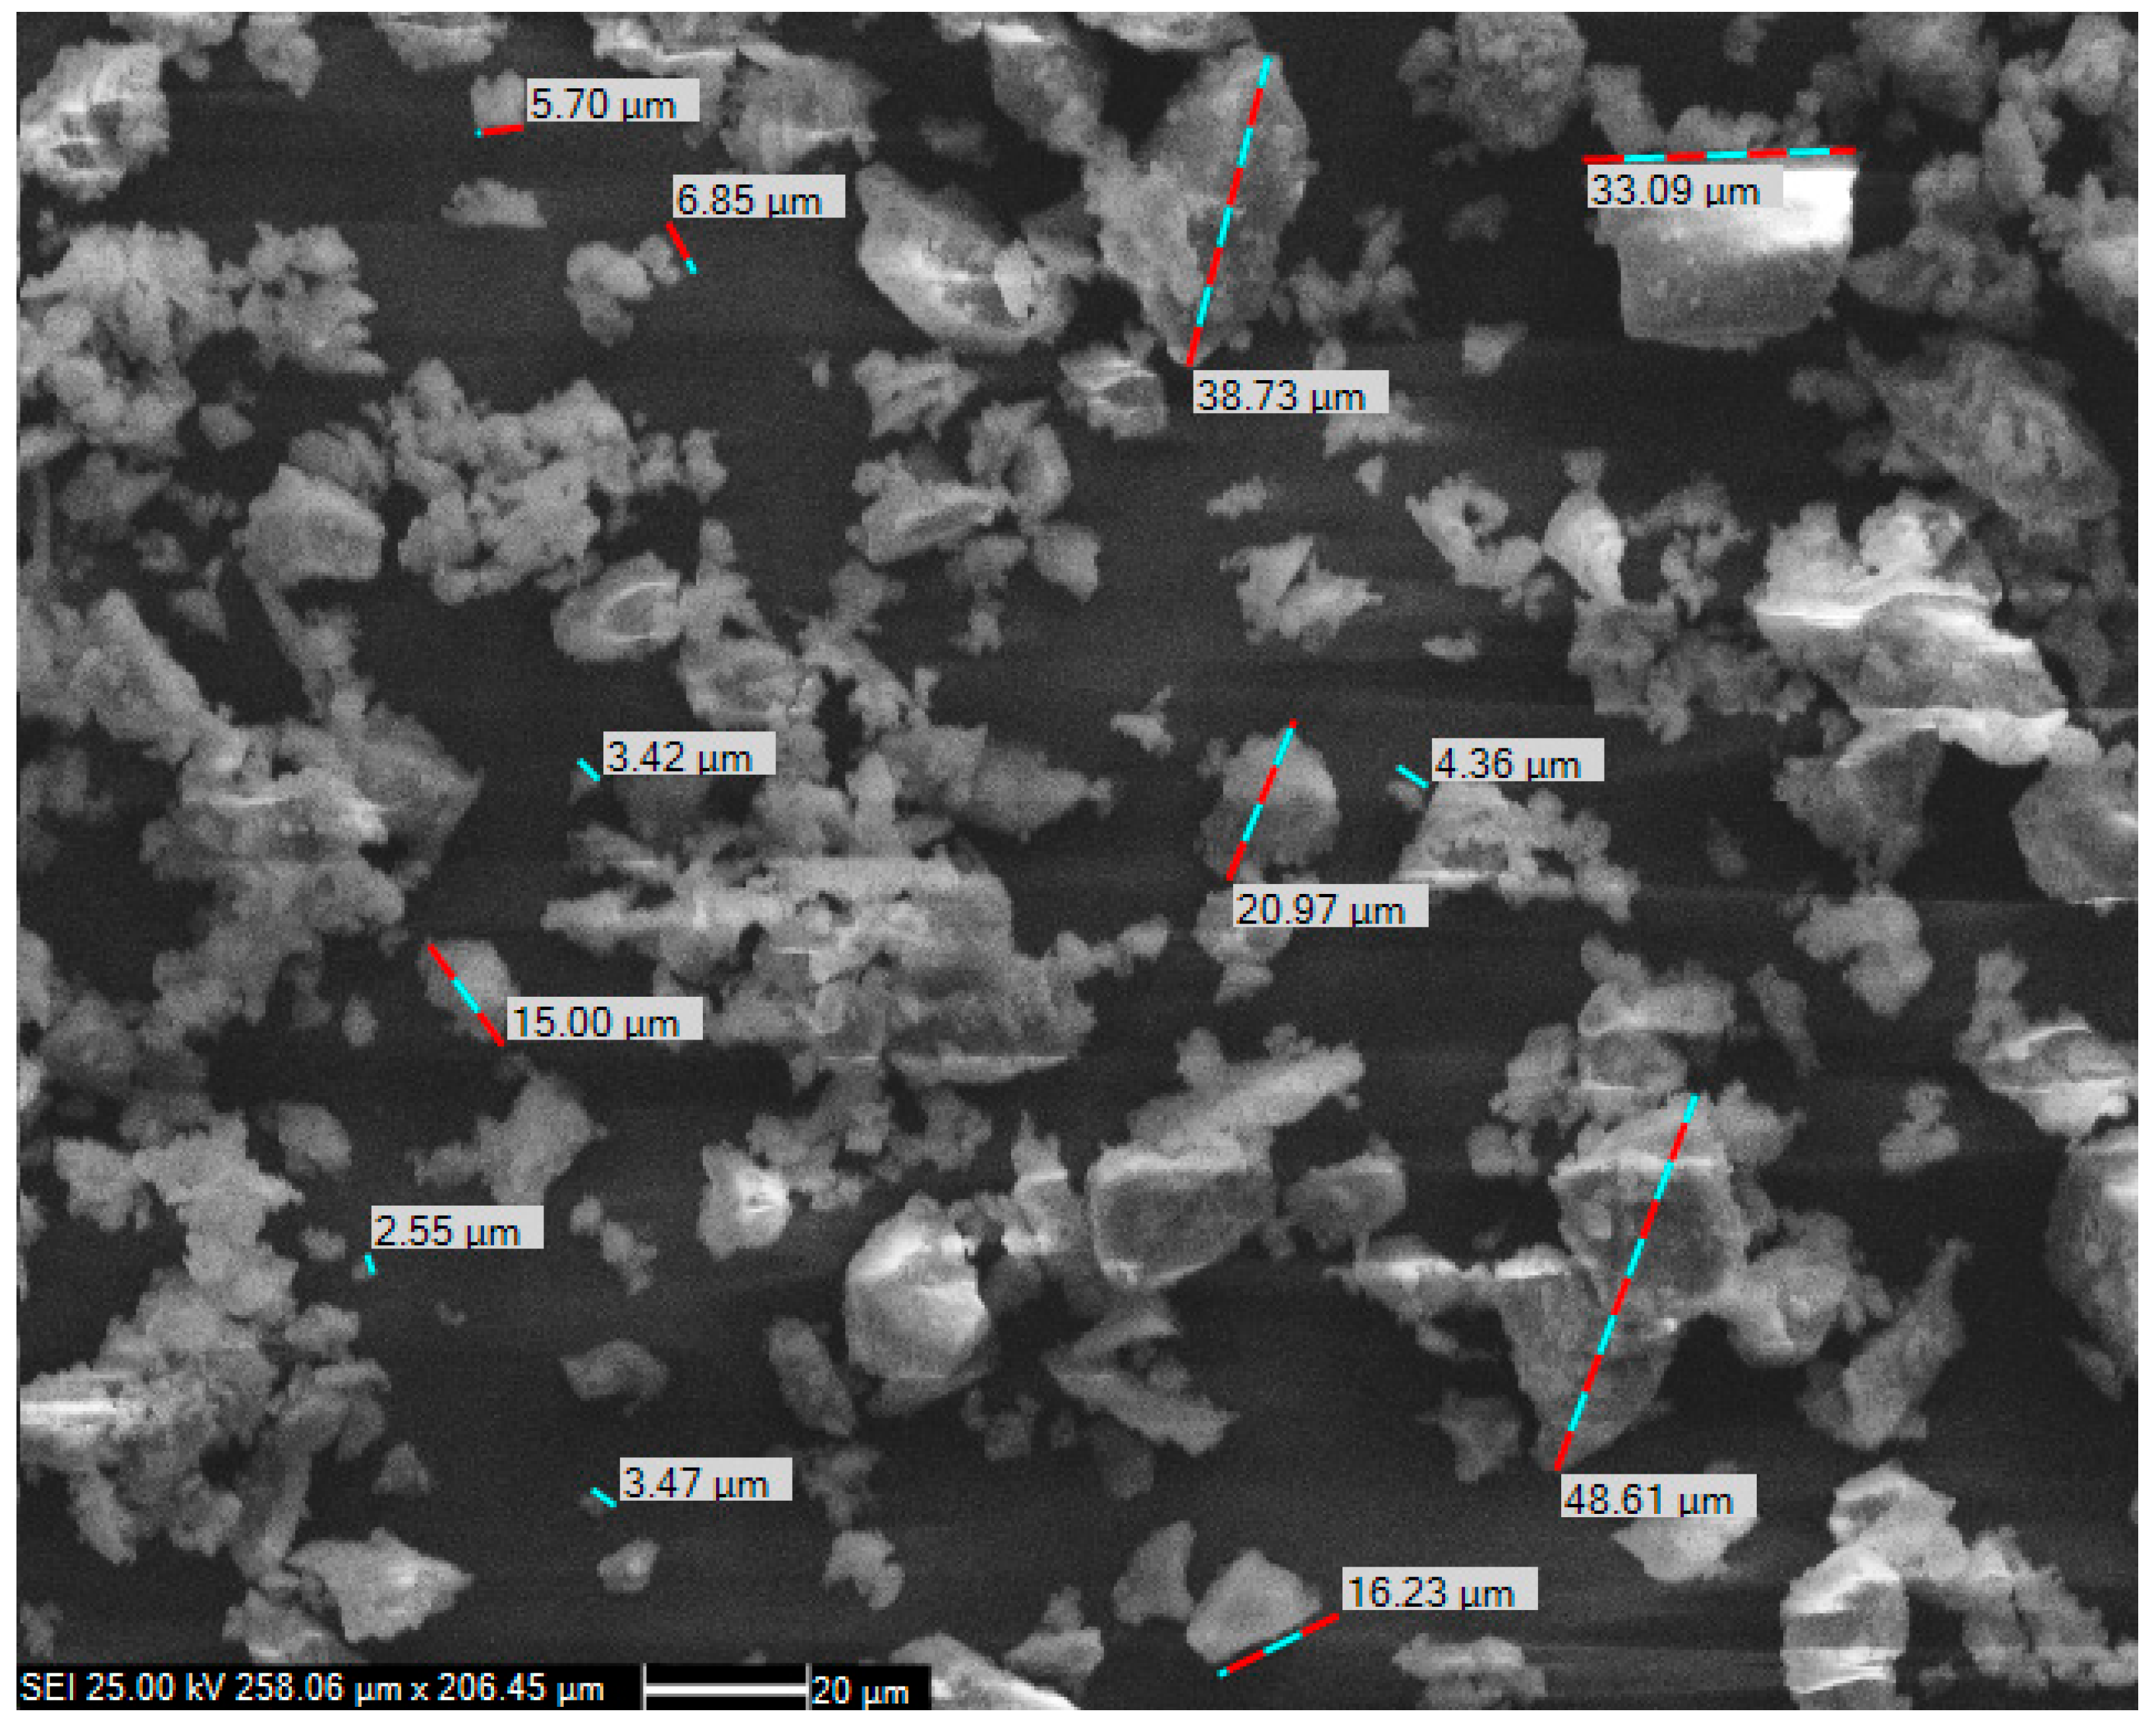
3.1. XRD and SEM
3.2. Vipulanandan p-q Model
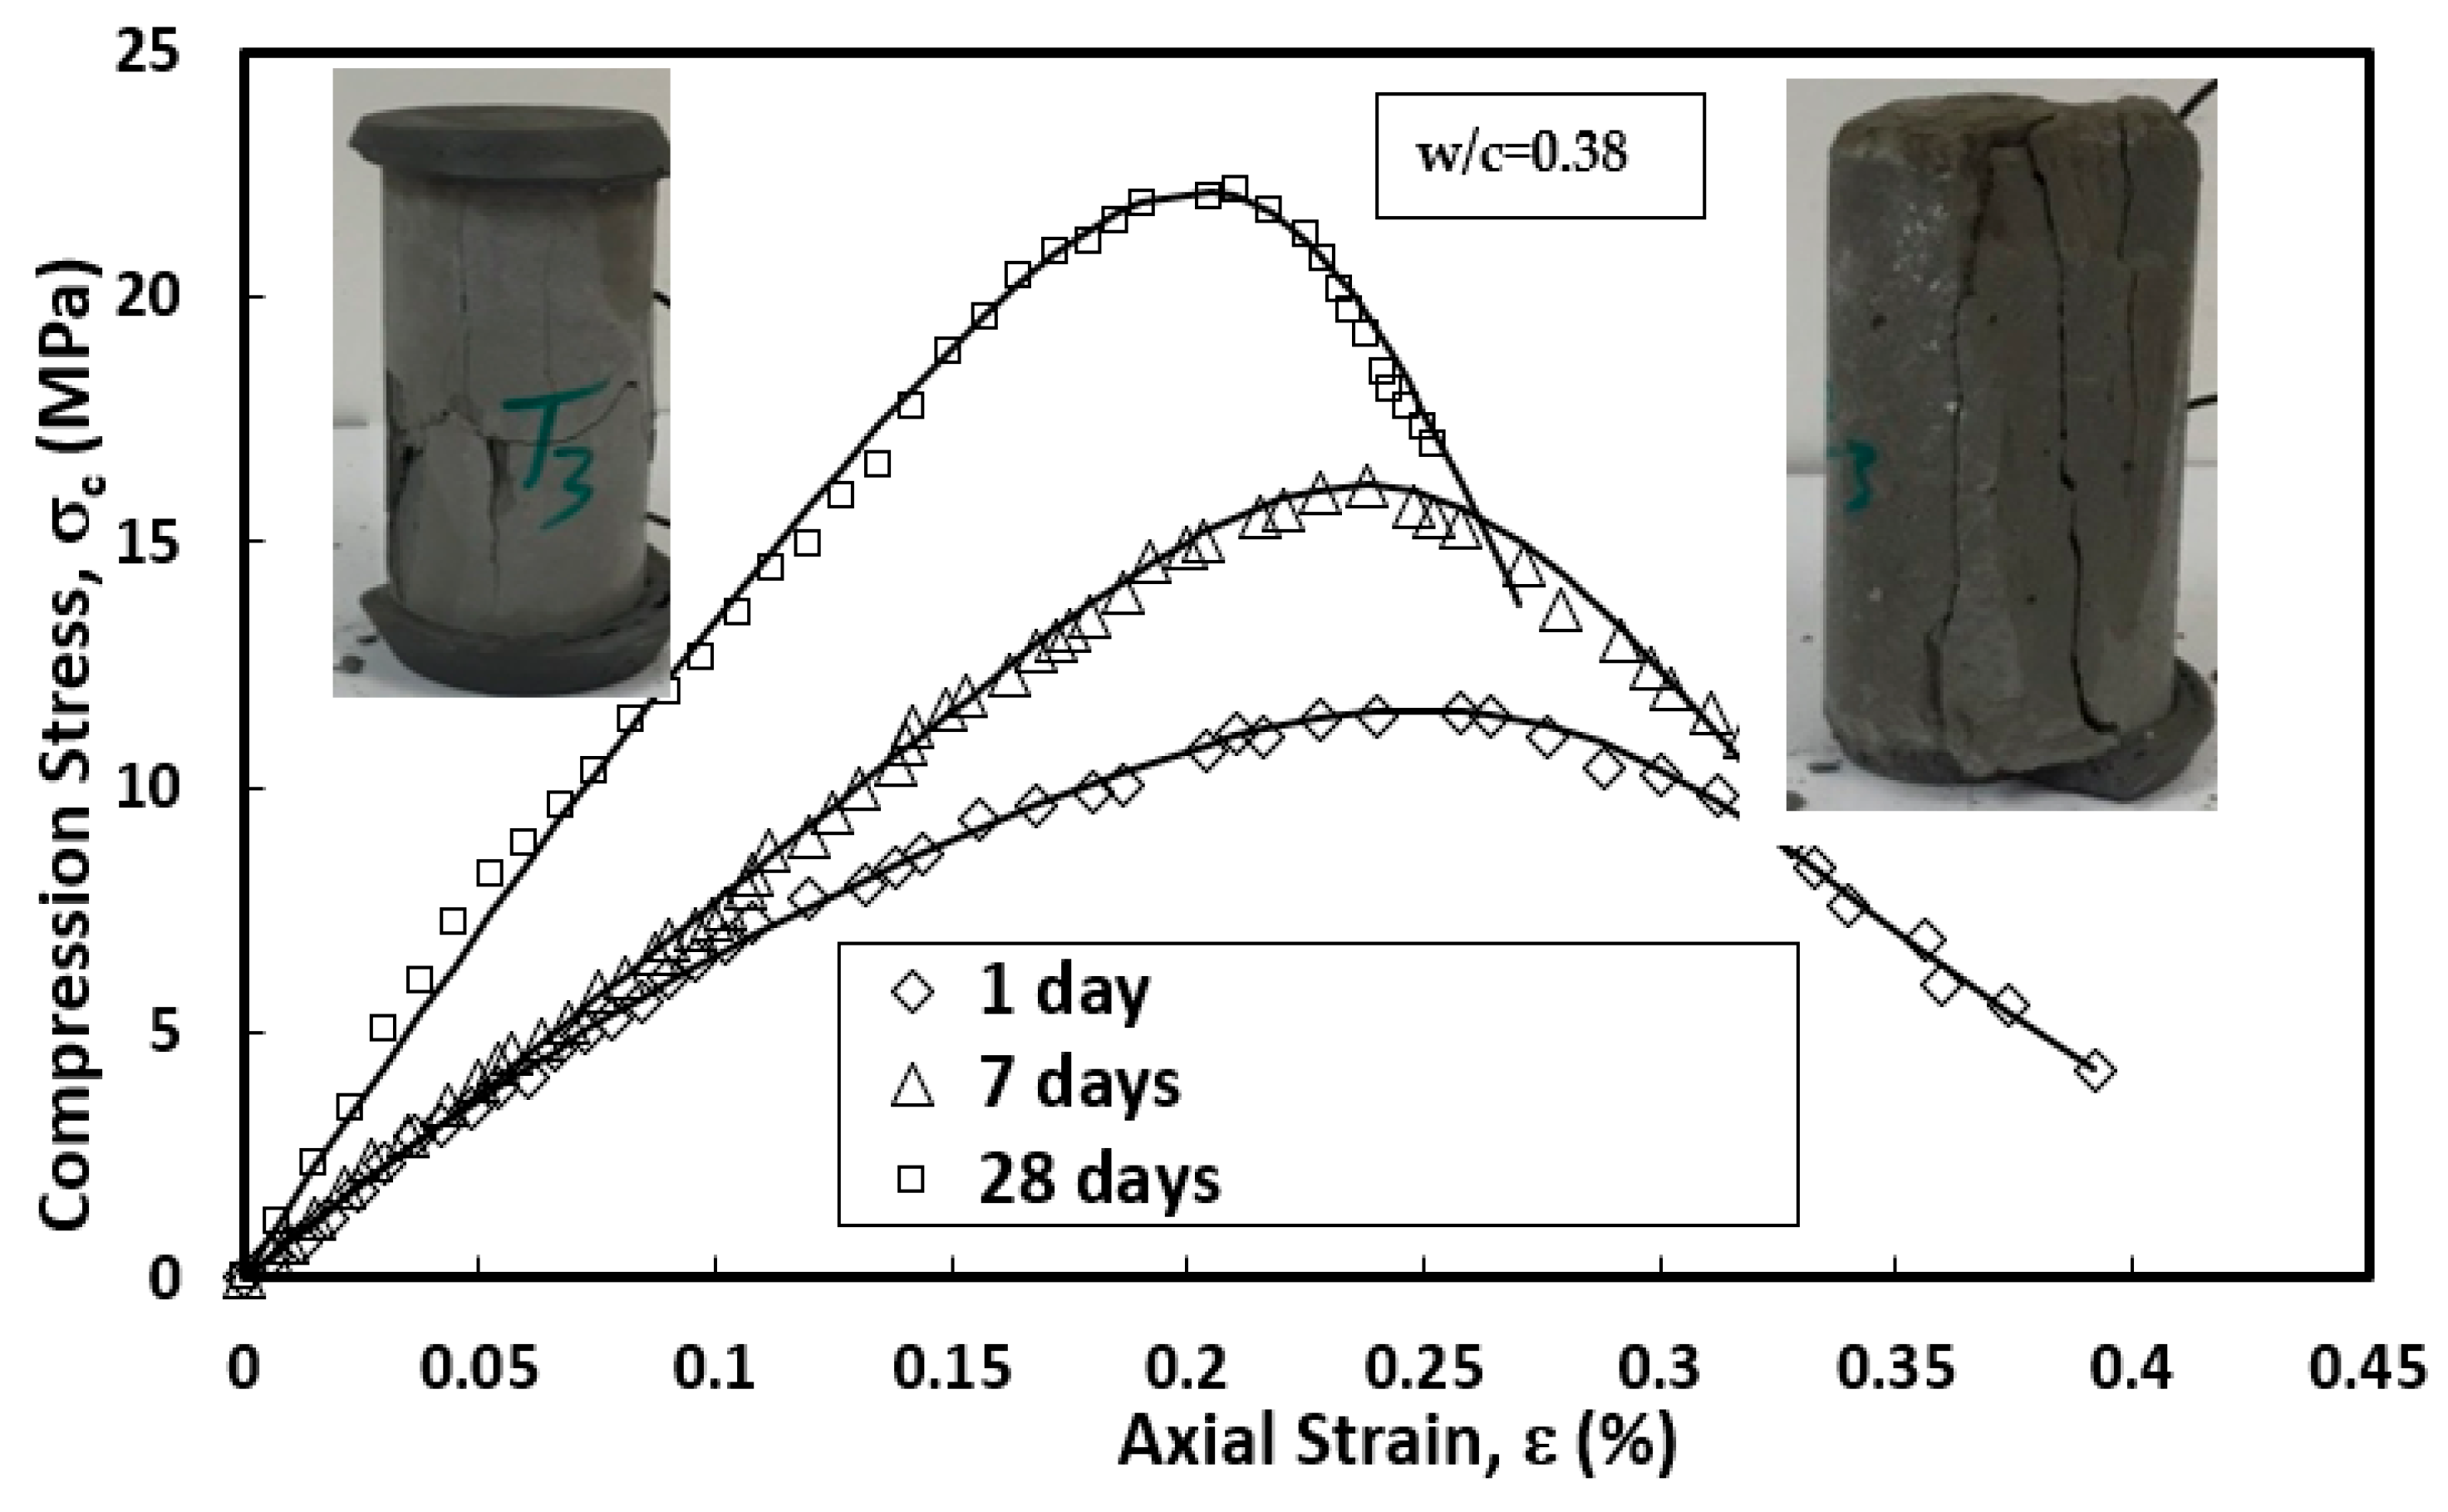
3.3. Compressive Strength
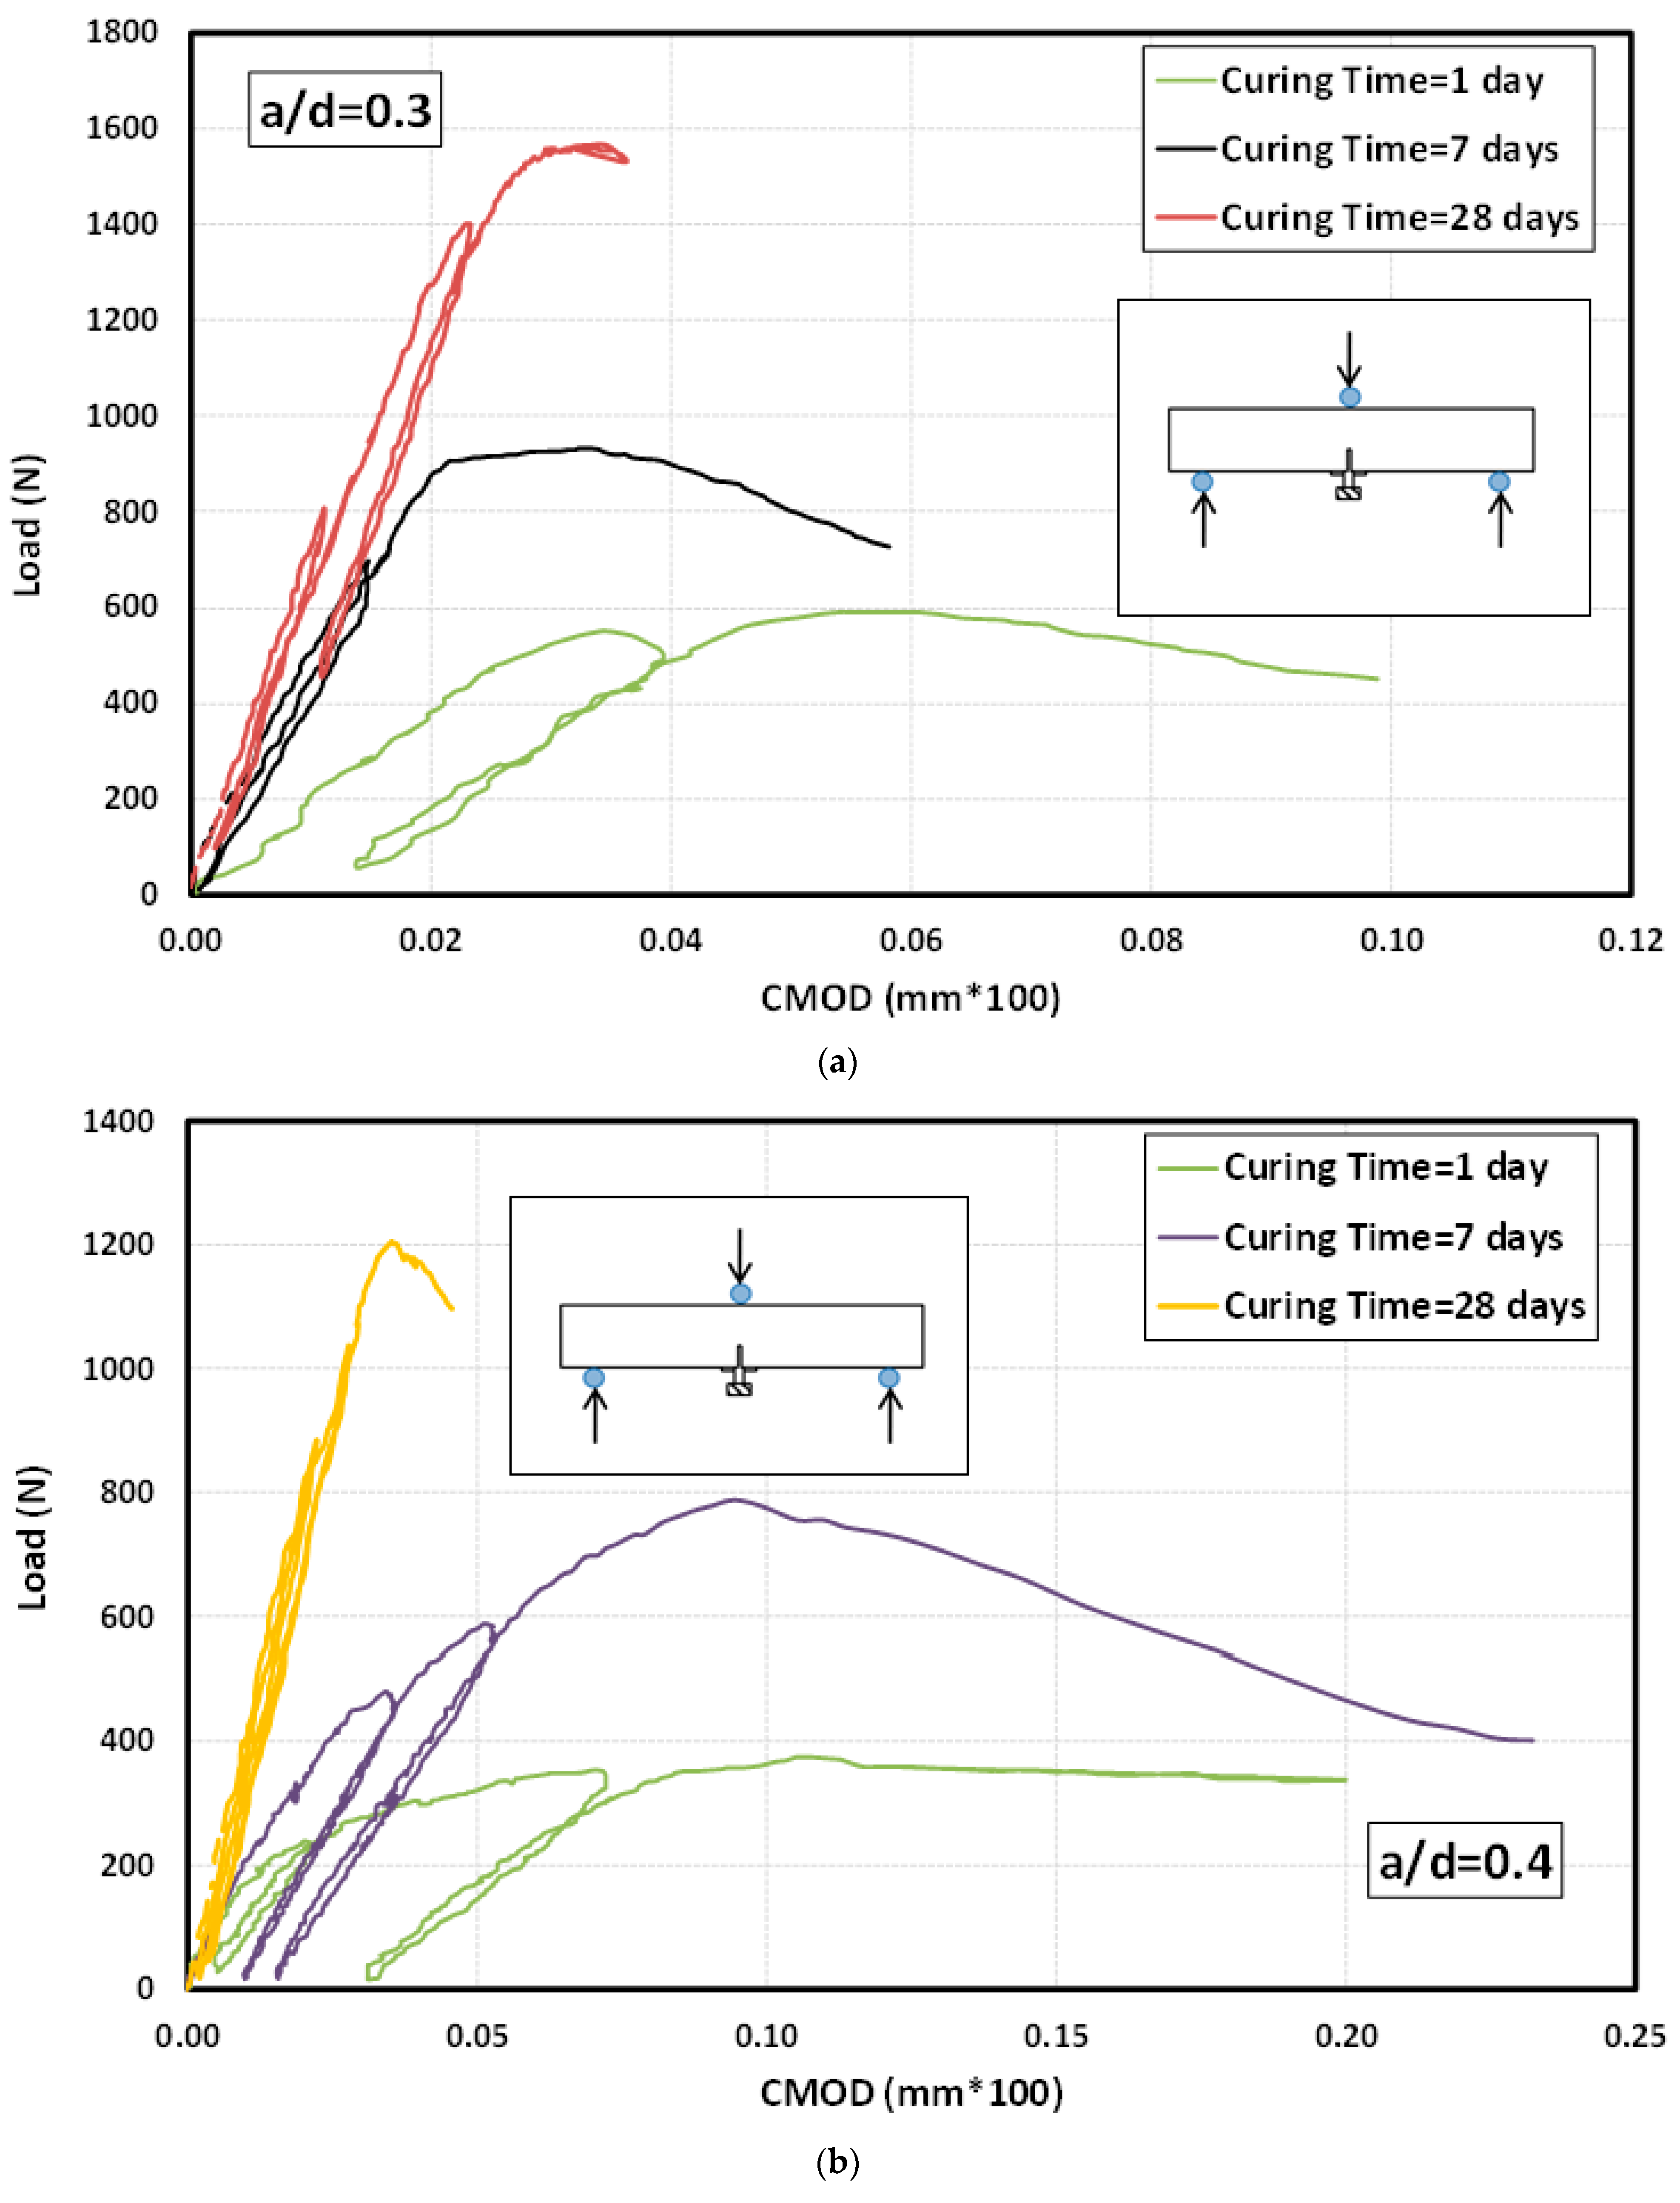
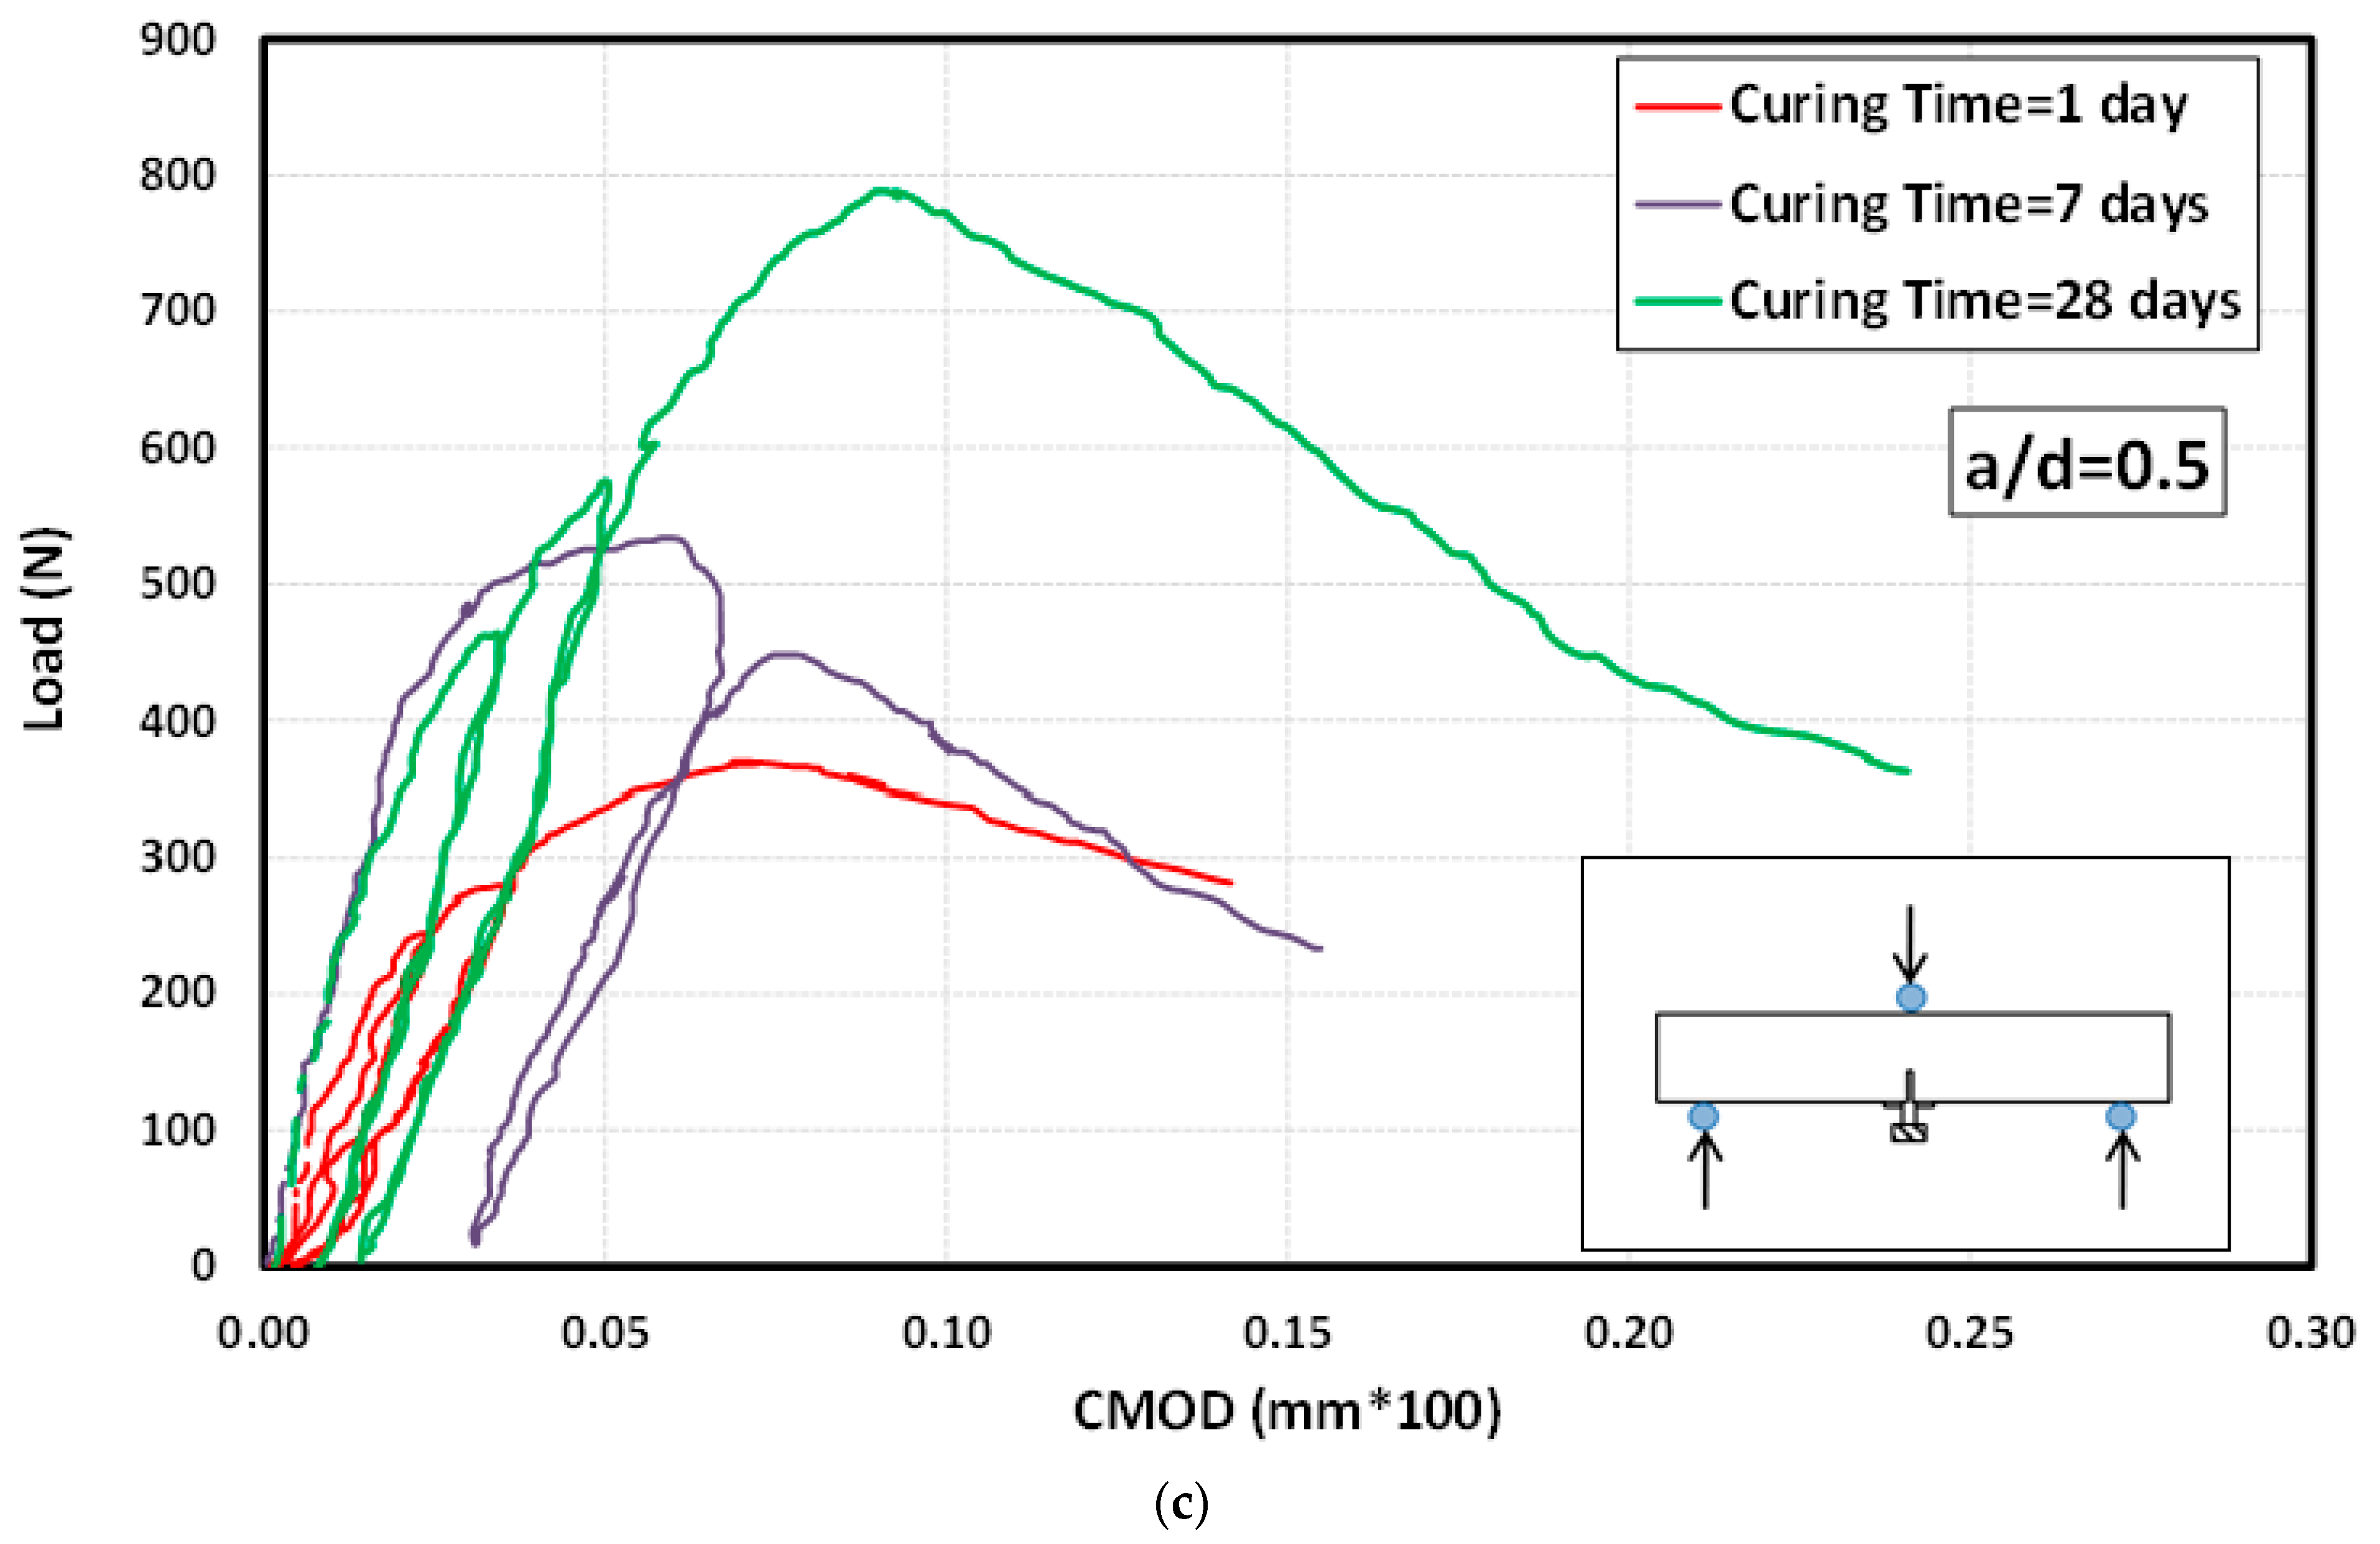
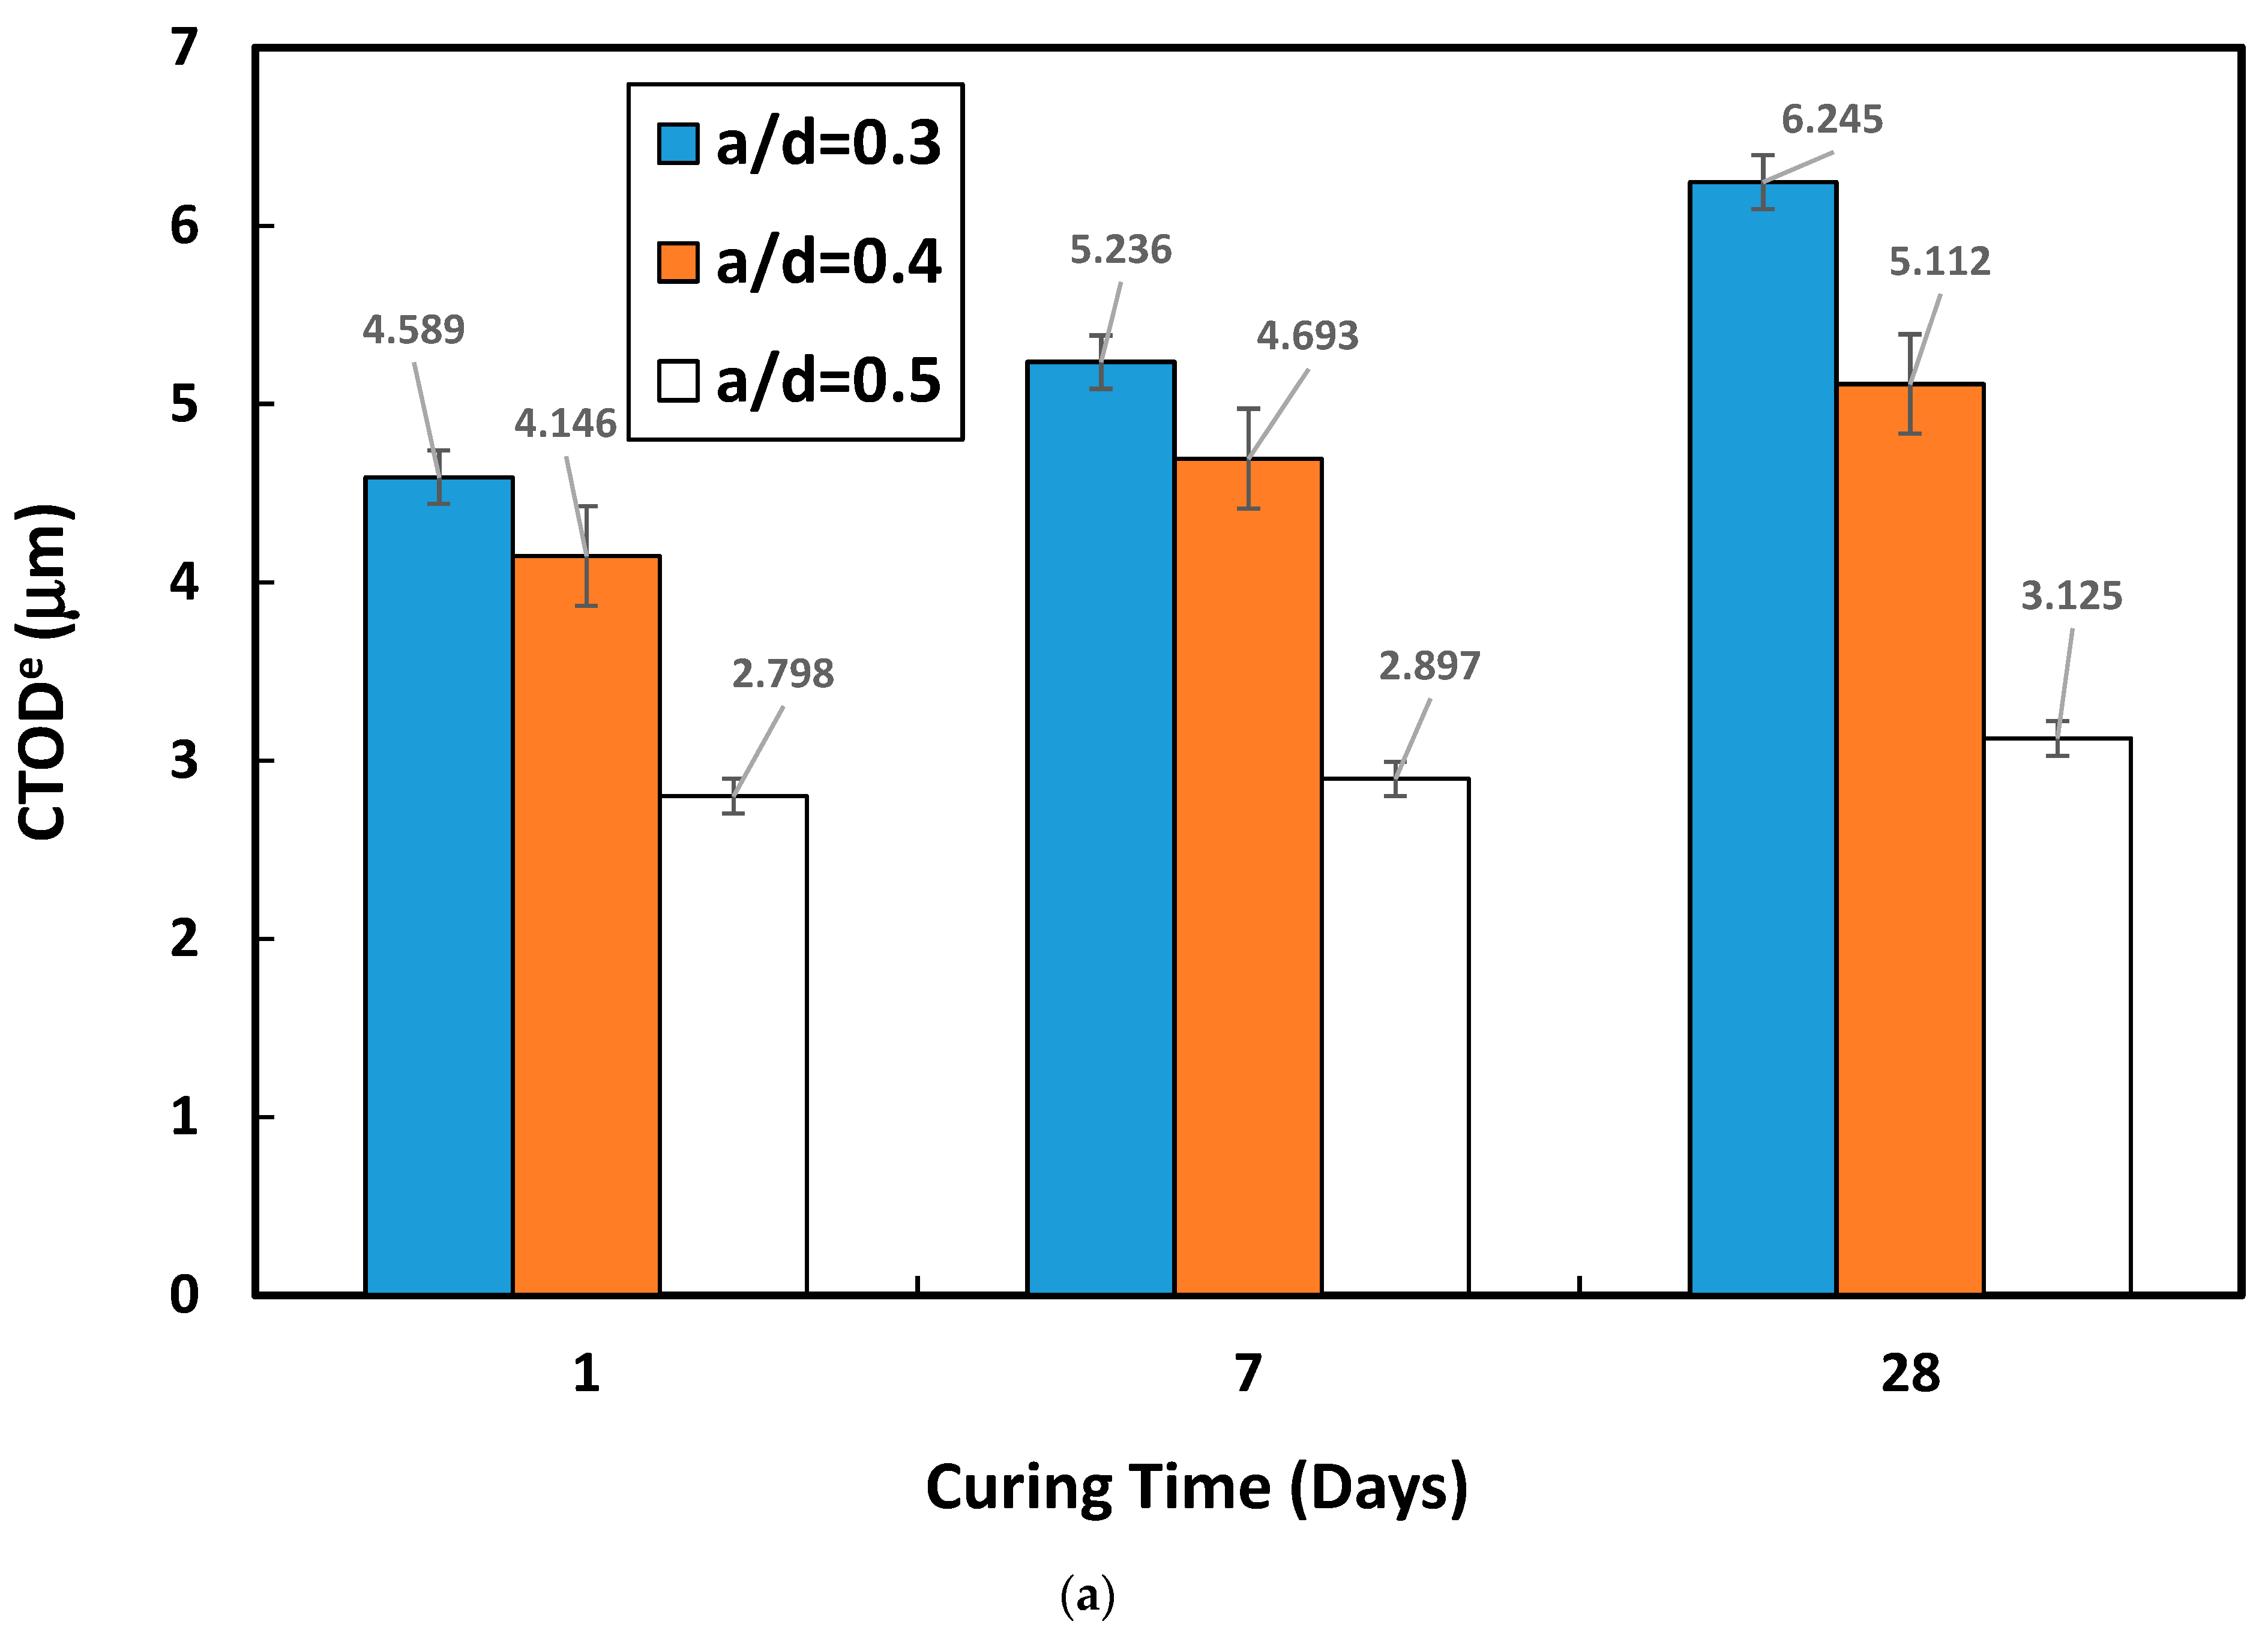
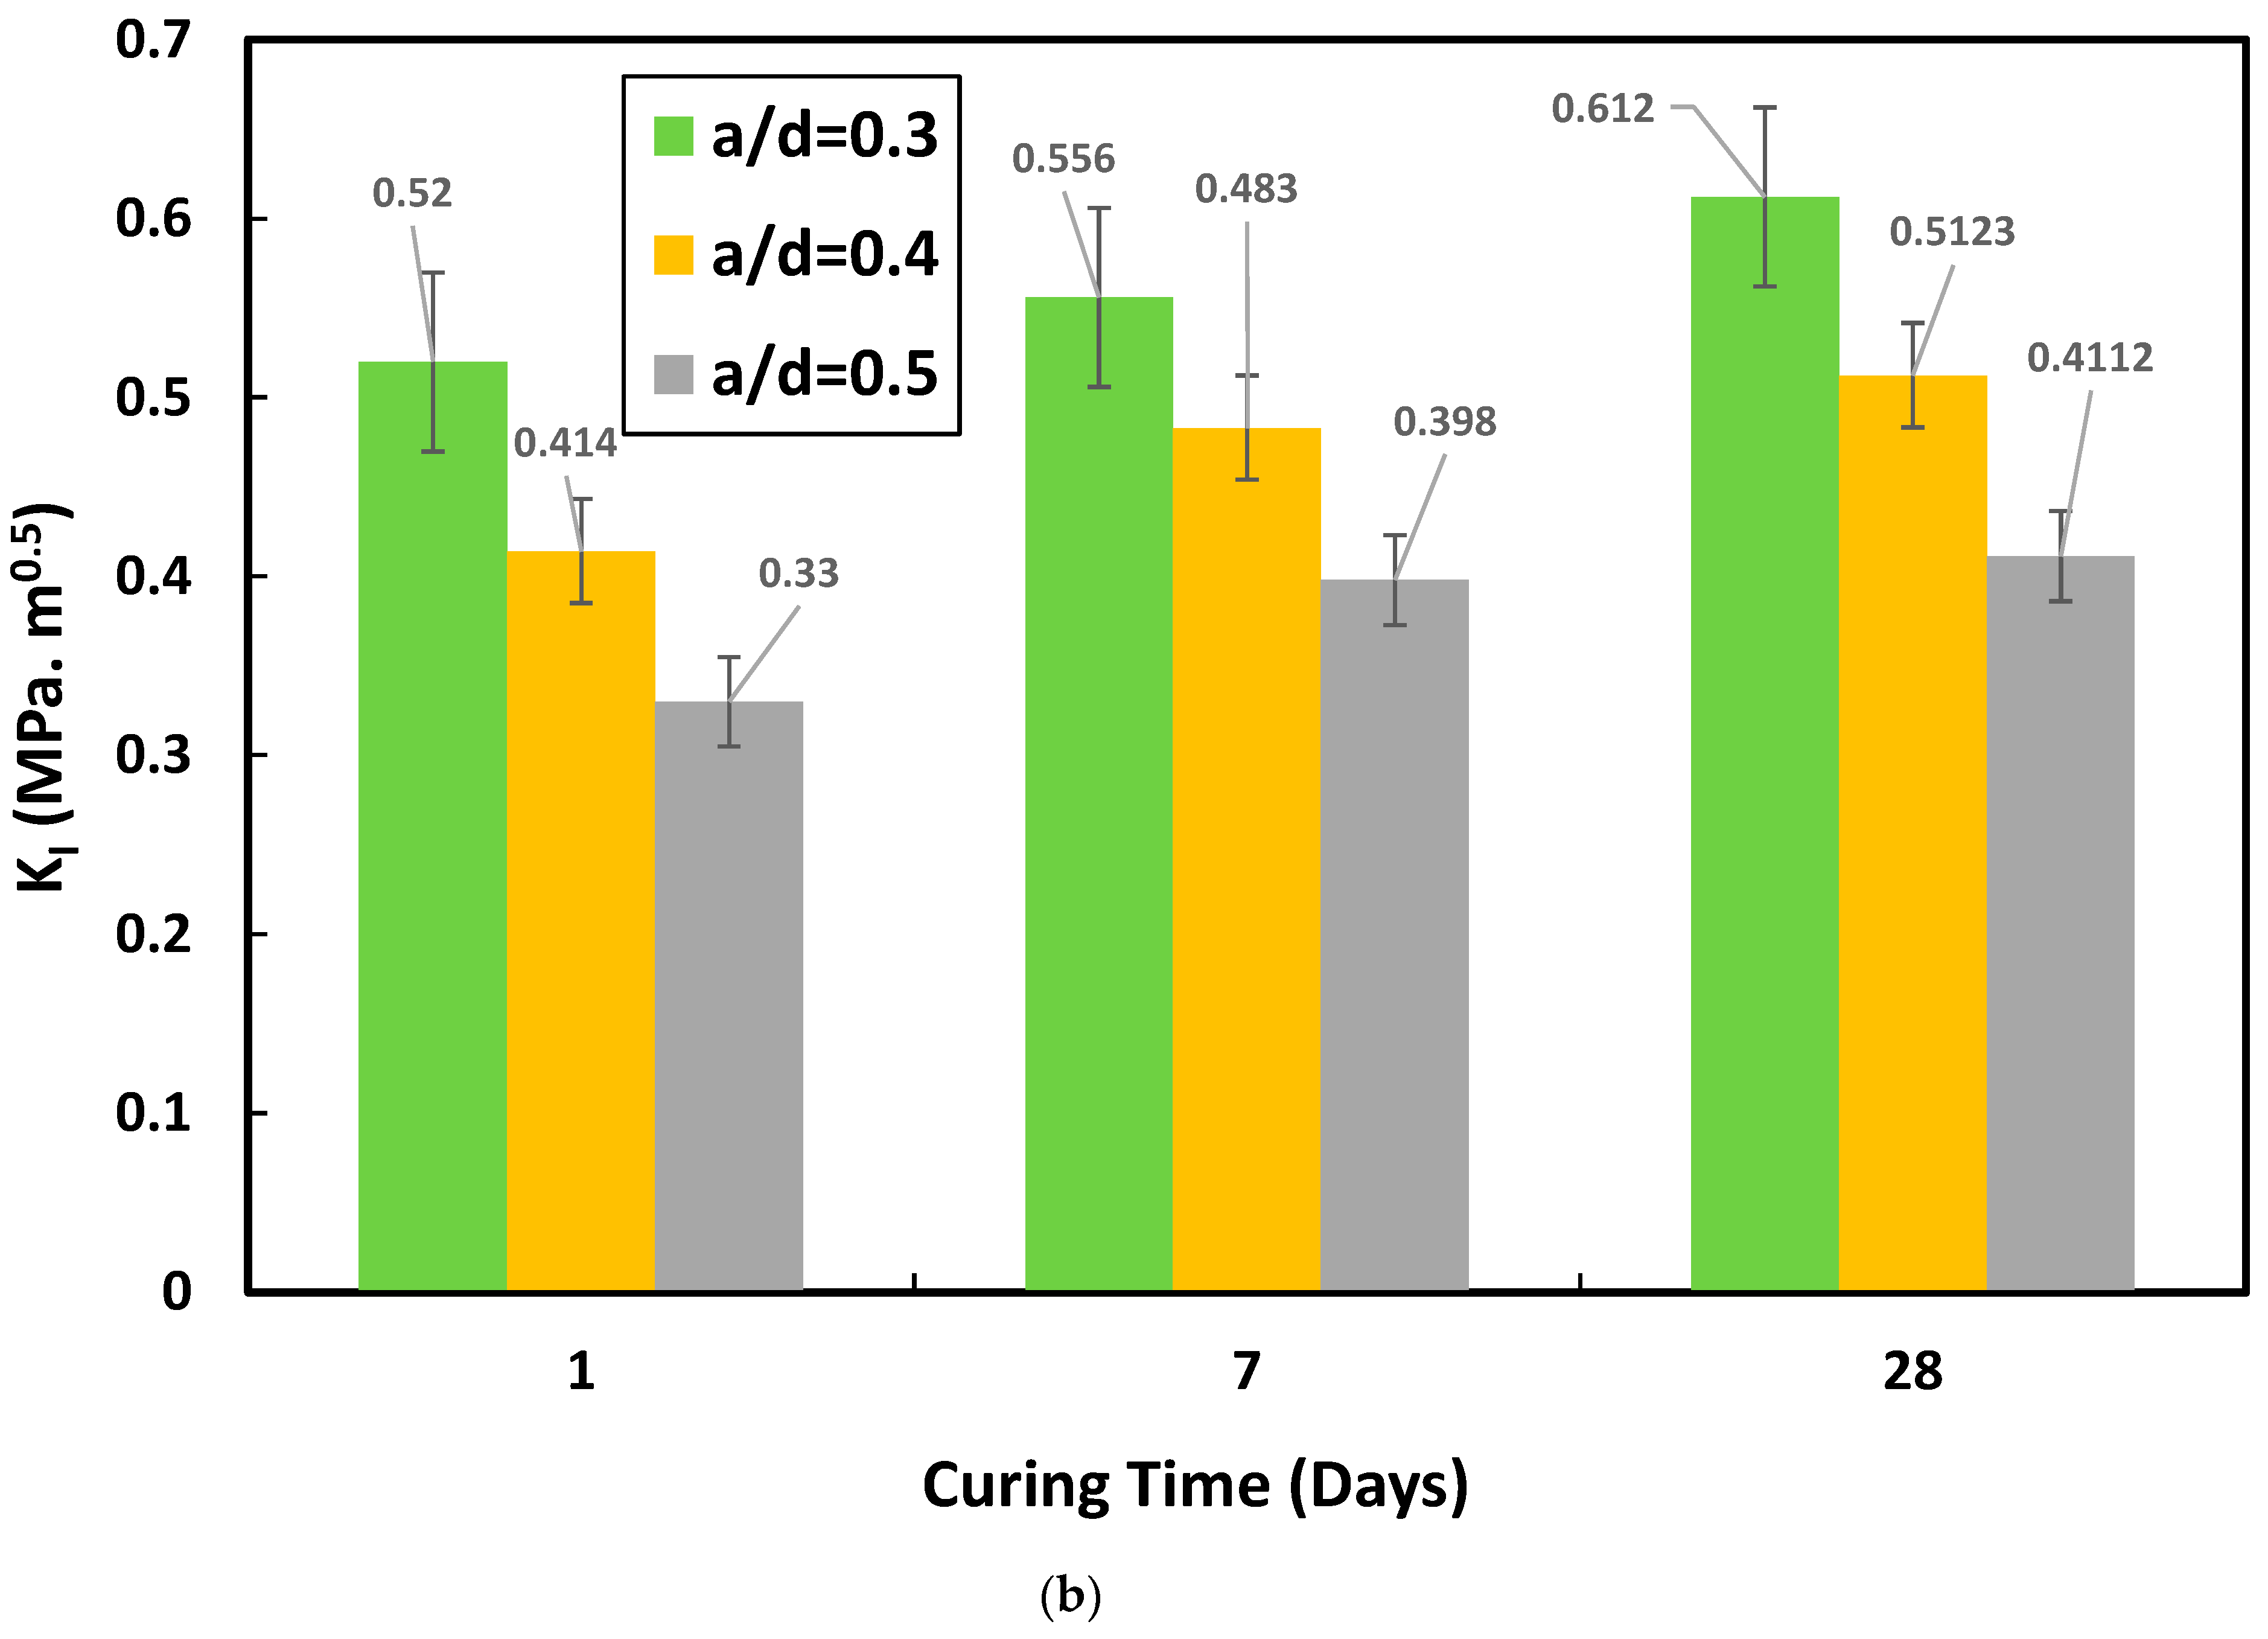
3.4. Fracture Properties of Cement
3.4.1. Experimental Calculations
- i.
- Crack length ;
- ii.
- Crack extension ();
- iii.
- Stress intensity factor ;
- iv.
- Crack tip opening displacement (CTOD).
3.4.2. Calculation Procedures
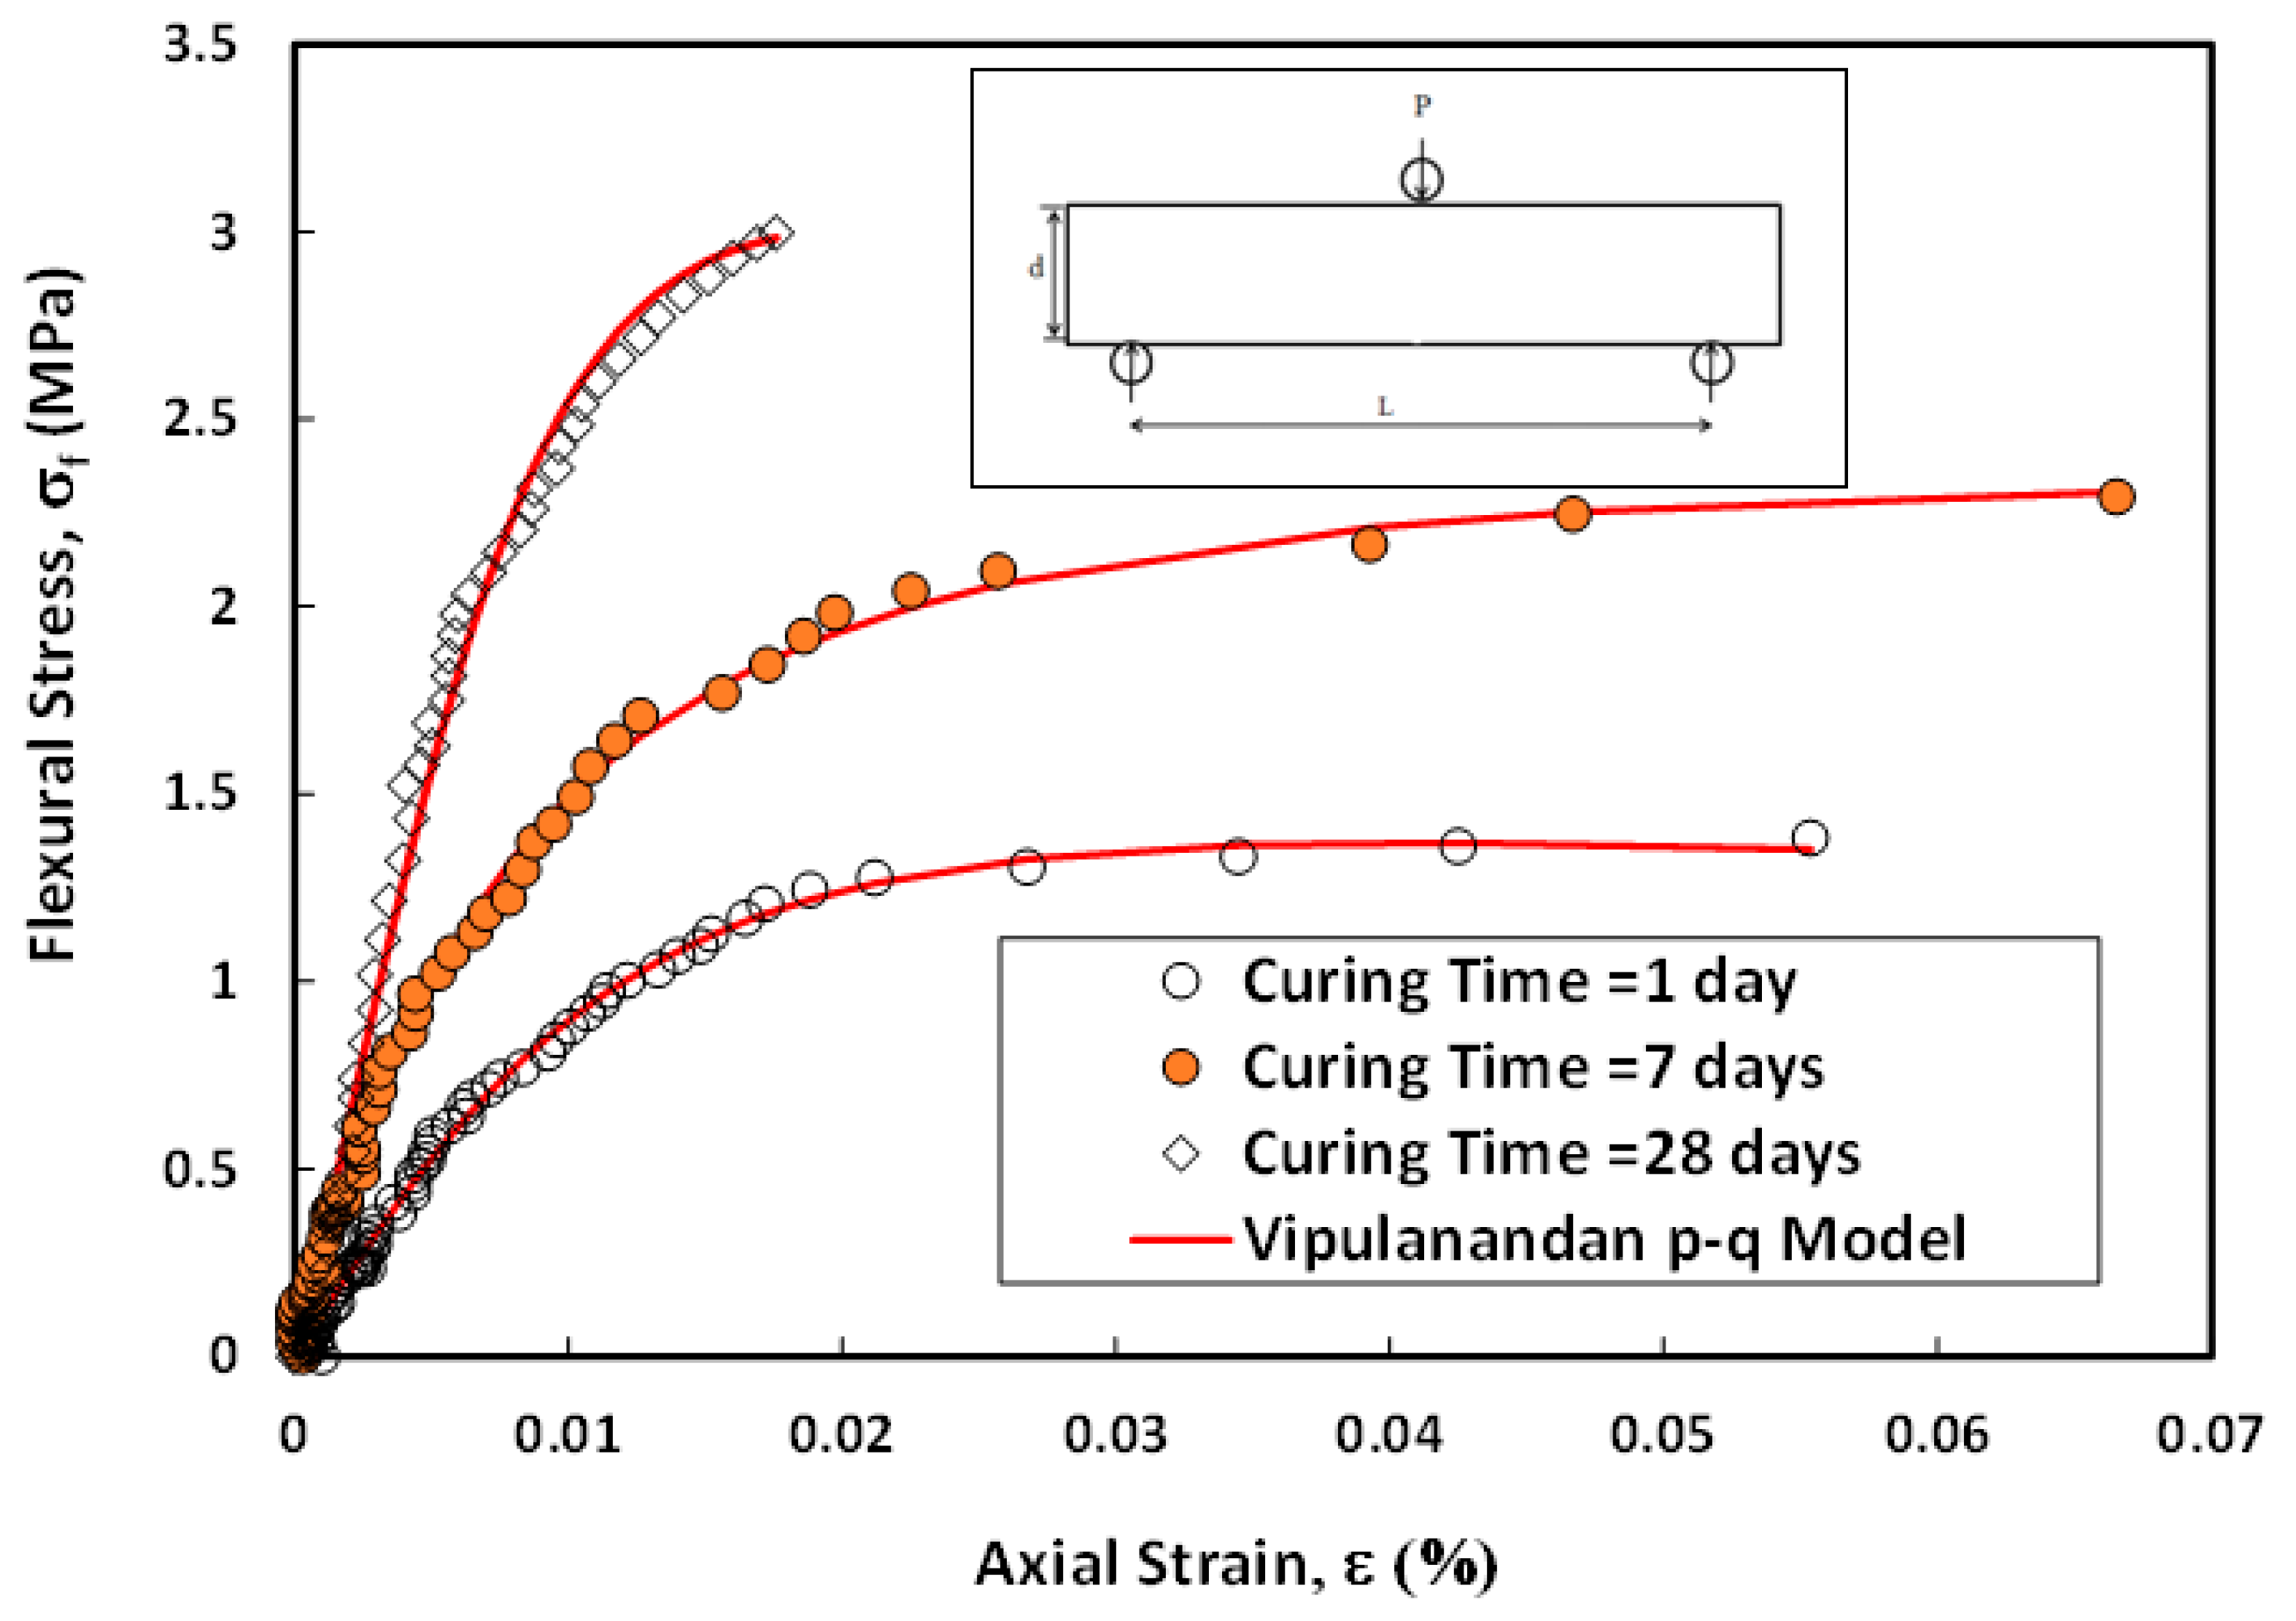
3.5. Flexural Stress–Strain

| Curing Age (Day) | σf (MPa) | εf (%) | Ei (MPa) | p | q | RMSE (MPa) | R2 | Figure No. | |
|---|---|---|---|---|---|---|---|---|---|
| Compressive | 1 | 10.6 ± 2 | 0.28 ± 0.01 | 9670 ± 21 | 0.034 ± 0.01 | 0.36 ± 0.02 | 0.128 | 0.99 | Figure 9 |
| 7 | 15.8 ± 1 | 0.3 ± 0.02 | 12,000 ± 25 | 0.03 ± 0.02 | 0.36 ± 0.02 | 0.02 | 0.99 | ||
| 28 | 18.3 ± 1.5 | 0.21 ± 0.02 | 19,360 ± 20 | 0.160 ± 0.03 | 0.87 ± 0.04 | 0.11 | 0.99 | ||
| Flexural | 1 | 1.36 ± 0.02 | 0.041 ± 0.002 | - | 71,199.4 ± 100 | 0.316 ± 0.02 | 0.03 | 0.99 | Figure 13 |
| 7 | 2.32 ± 0.01 | 0.101 ± 0.001 | - | 71,214.6 ± 95 | 0.082 ± 0.01 | 0.05 | 0.99 | ||
| 28 | 3.0 ± 0.02 | 0.02 ± 0.002 | - | 71,138.8 ± 105 | 0.550 ± 0.03 | 0.10 | 0.99 |
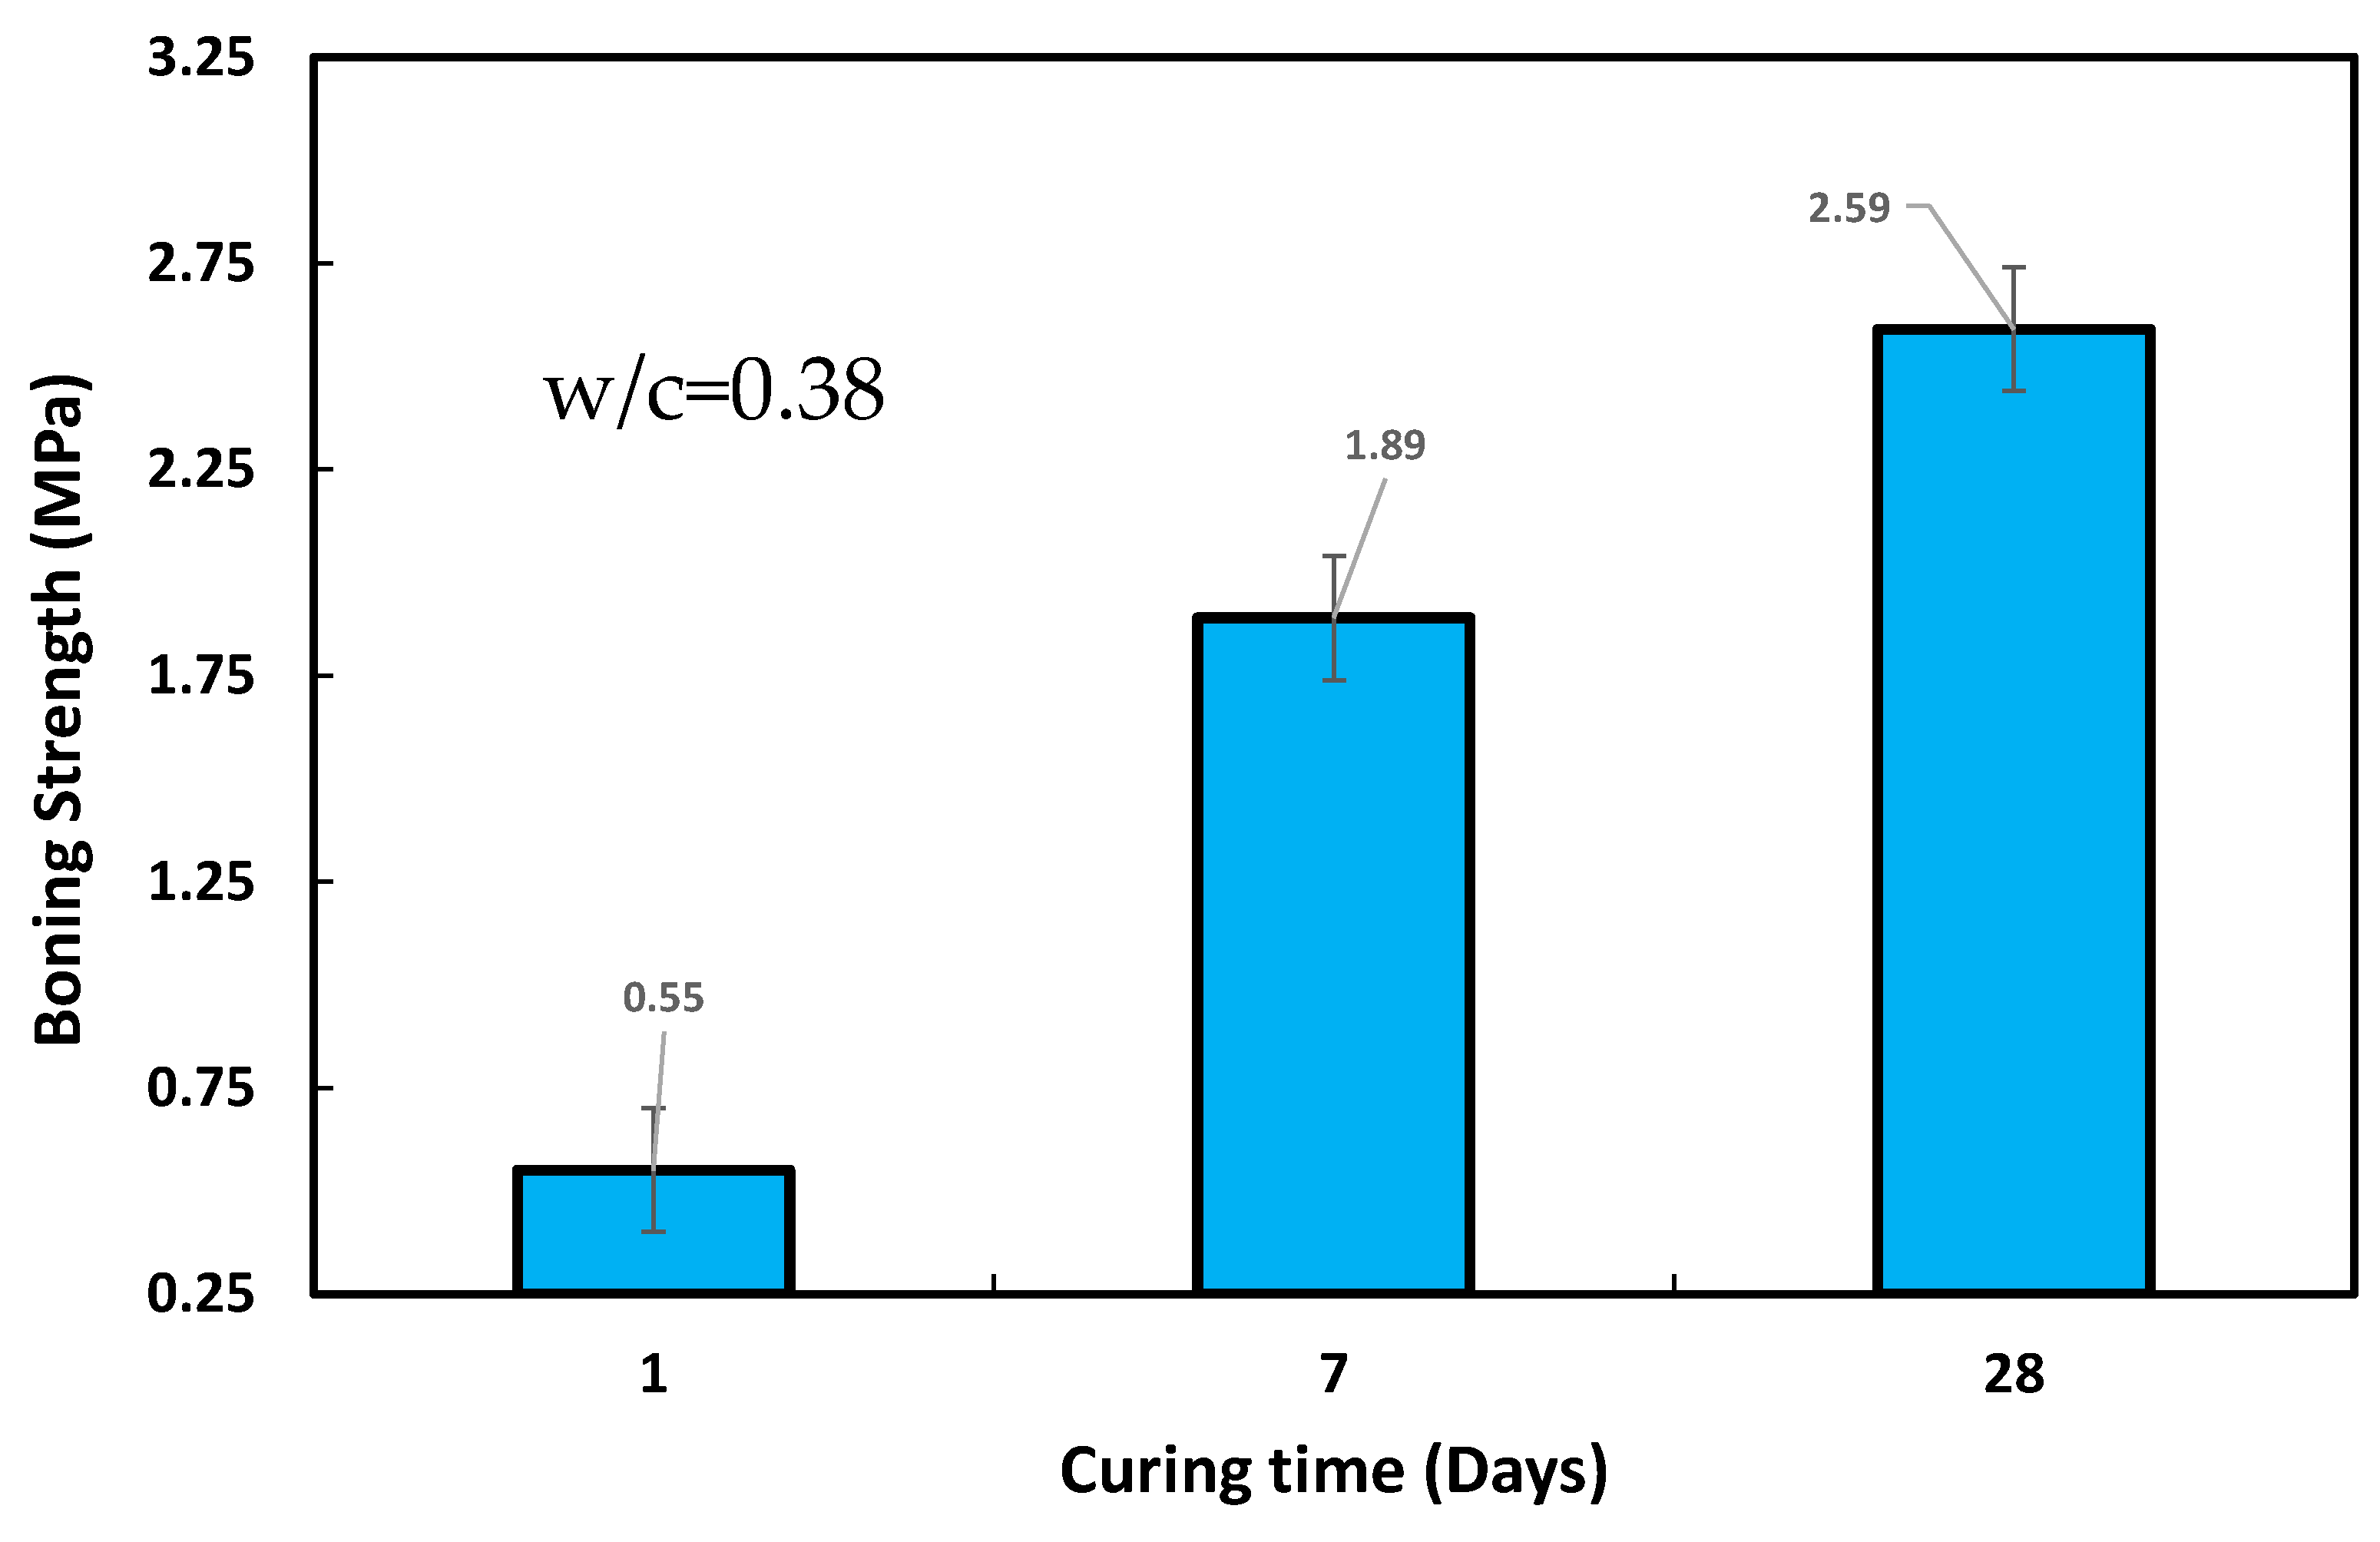
3.6. Bonding Strength
4. Conclusions
- The compressive and flexural strengths for the oil well cement at a w/c of 0.38 increased from 10.6 to 18.3 MPa and from 1.36 to 3 MPa, respectively, when the curing time was increased from 1 to 28 days of curing.
- Studies of fractures showed that the KI values ranged from 0.3 to 0.6 MPa.m, and the CMOD values ranged from 2 to 6 m.
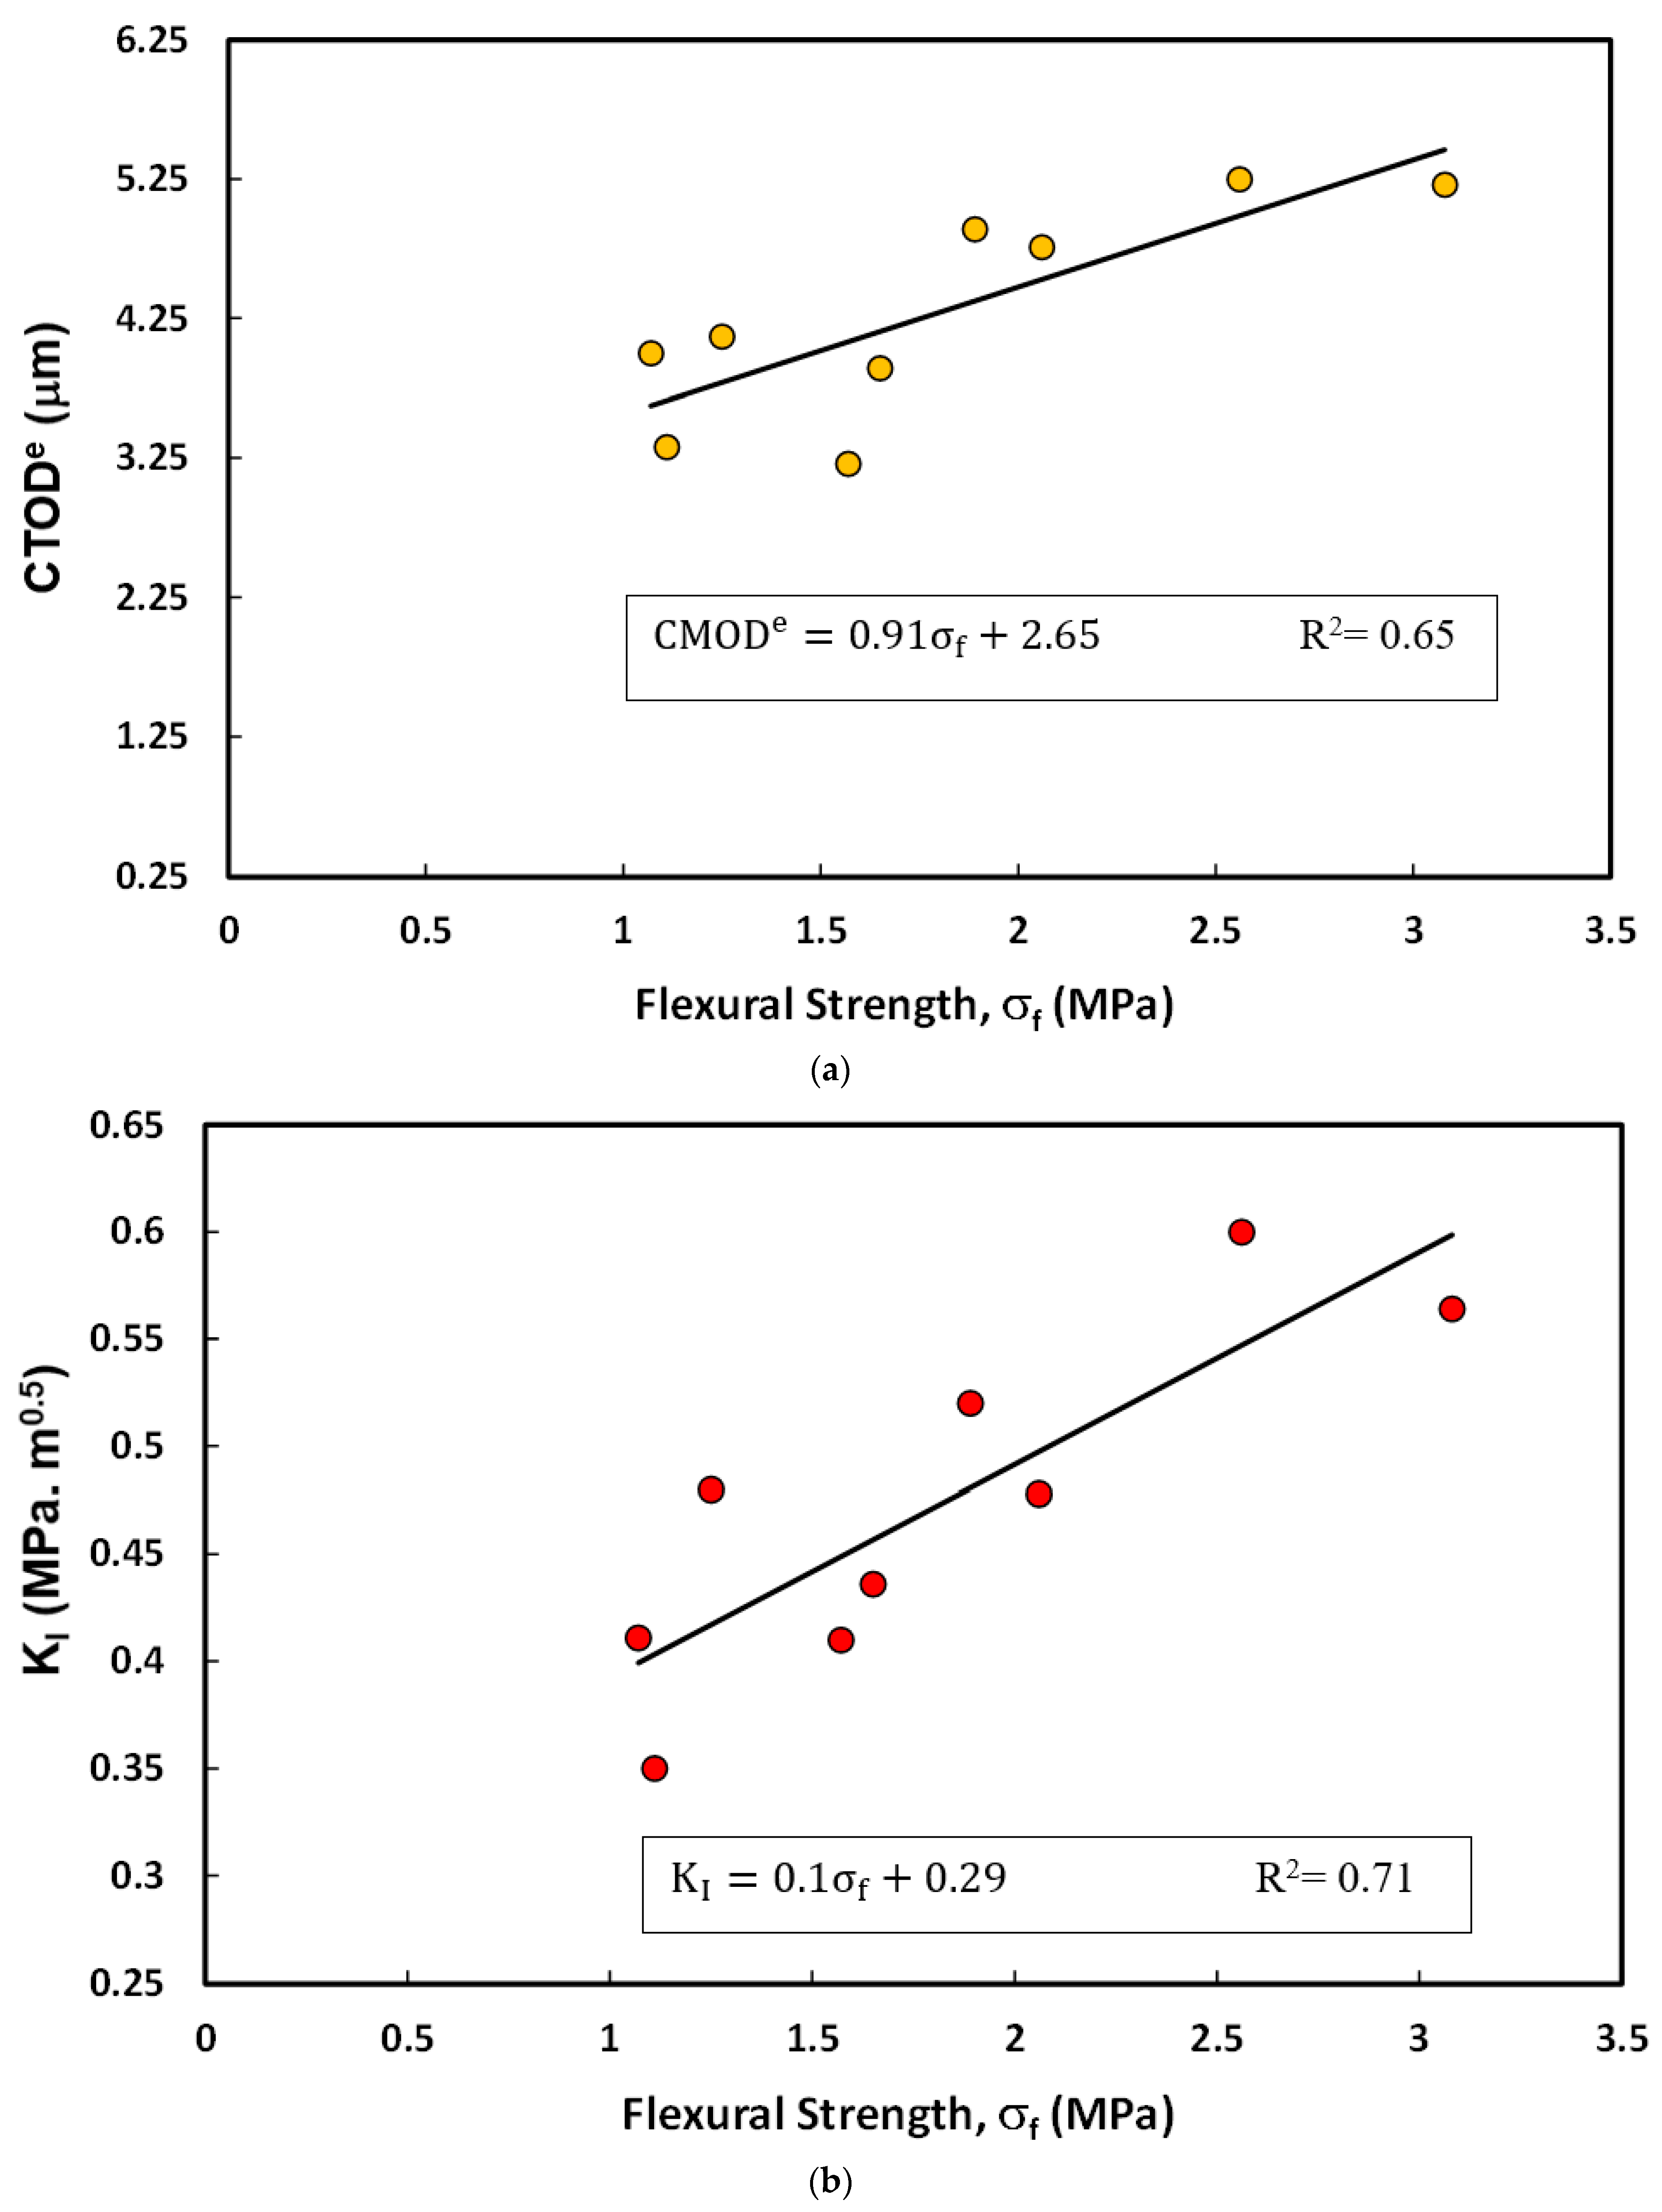
- Increasing the ratio of the crack mouth depth and the thickness of the beam (a/d) from 0.3 to 0.5 decreased the and the KI by 39–50% and 33–37% based on curing time, respectively. Based on the flexural strength of the oil well cement, the and KI could be estimated from the developed linear relationship.
- Based on the R2 and RMSE, the Vipulanandan p-q model accurately predicted the tested oil well cement’s compressive and flexural stress–strain behaviors.
- More studies on the effect of the w/c on the bonding, compression, and flexural strengths of oil well cement should be conducted to justify the behavior of the oil well cement under different environmental conditions in an oil well.
Author Contributions
Funding
Informed Consent Statement
Data Availability Statement
Acknowledgments
Conflicts of Interest
References
- Dou, H.; Dong, X.; Duan, Z.; Ma, Y.; Gao, D. Cement Integrity Loss due to Interfacial Debonding and Radial Cracking during CO2 Injection. Energies 2020, 13, 4589. [Google Scholar] [CrossRef]
- Lavagna, L.; Nisticò, R. An Insight into the Chemistry of Cement—A Review. Appl. Sci. 2023, 13, 203. [Google Scholar] [CrossRef]
- Wu, H.; Hu, R.; Yang, D.; Ma, Z. Micro-macro characterizations of mortar containing construction waste fines as replacement of cement and sand: A comparative study. Constr. Build. Mater. 2023, 383, 131328. [Google Scholar] [CrossRef]
- Labibzadeh, M.; Zahabizadeh, B.; Khajehdezfuly, A. Early-age compressive strength assessment of oil well class G cement due to borehole pressure and temperature changes. J. Am. Sci. 2010, 6, 1–7. [Google Scholar]
- Vipulanandan, C.; Dharmarajan, N. Fracture properties of particle filled polymer composites. J. Compos. Mater. 1989, 23, 846–860. [Google Scholar] [CrossRef]
- Vipulanandan, C.; Krishnamoorti, R.; Mohammed, A.; Boncan, V.; Narvaez, G.; Head, B.; Pappas, J.M. Iron Nanoparticle Modified Smart Cement for Real Time Monitoring of Ultra Deepwater Oil Well Cementing Applications. In Proceedings of the Annual Offshore Technology Conference 3, Houston, TX, USA, 4–7 May 2015; p. OTC-25842-MS. [Google Scholar]
- McCarter, W.J.; Chrisp, T.M.; Starrs, G.; Blewett, J. Characterization and monitoring of cement-based systems using intrinsic electrical property measurements. Cem. Concr. Res. 2003, 33, 197–206. [Google Scholar] [CrossRef]
- Han, B.; Zhang, L.; Zhang, C.; Wang, Y.; Yu, X.; Ou, J. Reinforcement Effect and mechanism of Carbon Fibers to Mechanical and Electrically Conductive Properties of Cement-Based Materials. Constr. Build. Mater. 2016, 125, 479–489. [Google Scholar] [CrossRef]
- Choolaei, M.; Rashidi, A.M.; Ardjmand, M.; Yadegari, A.; Soltanian, H. The effect of nanosilica on the physical properties of oil well cement. Mater. Sci. Eng. A 2012, 538, 288–294. [Google Scholar] [CrossRef]
- Li, H.; Xiao, H.G.; Ou, J.P. A study on mechanical and pressure-sensitive properties of cement mortar with nanophase materials. Cem. Concr. Res. 2004, 34, 435–438. [Google Scholar] [CrossRef]
- Sorathiya, J.; Shah, S.; Kacha, M.S. Effect on Addition of Nano “Titanium Dioxide”(TiO2) on Compressive Strength of Cementitious Concrete. ICRISET2017. Sel. Pap. Civ. Eng. 2017, 1, 219–225. [Google Scholar]
- Compendex, S.; Elsevier, G. Influence of Zinc Oxide Nanoparticle on Strength and Durability of Cement Mortar. Int. J. Earth Sci. Eng. 2016, 9, 175–181. [Google Scholar]
- Ramanathan, P. Mechanical, Piezoresistive and Fracture Behavior of Various Types of Smart Cements. Master’s Thesis, University of Houston, Houston, TX, USA, 2014. [Google Scholar]
- Teodoriu, C.; Amani, M.; Yuan, Z.; Schubert, J.; Kosinowski, C. Investigation of the mechanical properties of Class G cement and their effect on well integrity. Int. J. Eng. 2013, 3, 2305–8269. [Google Scholar]
- Vipulanandan, C.; Dharmarajan, N. Critical crack tip opening displacement for polymer composites. Eng. Fract. Mech. 1989, 33, 409–419. [Google Scholar] [CrossRef]
- Vipulanandan, C.; Dharmarajan, N. Effect of temperature on the fracture properties of epoxy polymer concrete. Cem. Concr. Res. 1988, 18, 265–276. [Google Scholar] [CrossRef]
- Feng, G.; Liu, W.; Du, X.; Wang, J.; Li, X.; Zheng, Y. Crack evolution characteristics of cemented-gangue–fly-ash backfill with different proportions of fly ash and cement. Constr. Build. Mater. 2023, 385, 131498. [Google Scholar] [CrossRef]
- Reis, J.M.L.; Ferreira, A.J.M. The influence of notch depth on the fracture mechanics properties of polymer concrete. Int. J. Fract. 2003, 124, 33–42. [Google Scholar] [CrossRef]
- de Luna, A.M.; Lozano JÁ, O.; Jaime, L.P.; Martínez, J.P.; Bernal, J.J.S.; Martínez, S.H.R.; Flores, J.A. Experimental mechanical characterization of steel and polypropylene fiber reinforced concrete. Rev. Tec. Fac. Ing. Univ. Zulia 2014, 37, 106–111. [Google Scholar]
- ASTM C293/C293M–10; Standard Test Method for Flexural Strength of Concrete. American Society for Testing and Materials: West Conshohocken, PA, USA, 2010.
- Vipulanandan, C.; Mohammed, A.; Qu, Q. Characterizing the hydraulic fracturing fluid modified with nano silica proppant. In Proceedings of the AADE Fluids Technical Conference and Exhibition, Houston, TX, USA, 15–16 April 2014; pp. 15–16. [Google Scholar]
- Wen, S.; Chung, D.D.L. Effect of moisture on piezoresistivity of carbon fiber-reinforced cement paste. ACI Mater. J. 2008, 105, 274. [Google Scholar]
- Huang, Y.; Wang, W.; Sun, Z.; Wang, Y.; Liu, P.; Liu, C. A multilayered flexible piezoresistive sensor for wide-ranged pressure measurement based on CNTs/CB/SR composite. J. Mater. Res. 2015, 30, 1869–1875. [Google Scholar] [CrossRef]
- Joel, O.F.; Ndubuisi, E.C.; Ikeh, L. Effect of cement contamination on some properties of drilling mud. In Proceedings of the Nigeria Annual International Conference and Exhibition, Lagos, Nigeria, 6–8 August 2012. [Google Scholar]


Disclaimer/Publisher’s Note: The statements, opinions and data contained in all publications are solely those of the individual author(s) and contributor(s) and not of MDPI and/or the editor(s). MDPI and/or the editor(s) disclaim responsibility for any injury to people or property resulting from any ideas, methods, instructions or products referred to in the content. |
© 2023 by the authors. Licensee MDPI, Basel, Switzerland. This article is an open access article distributed under the terms and conditions of the Creative Commons Attribution (CC BY) license (https://creativecommons.org/licenses/by/4.0/).
Share and Cite
Vipulanandan, C.; Mohammed, A.S.; Ramanathan, P. Experimental Study and Modeling of the Fracture Behavior, Mechanical Properties, and Bonding Strength of Oil Well Cement. Sustainability 2023, 15, 9566. https://doi.org/10.3390/su15129566
Vipulanandan C, Mohammed AS, Ramanathan P. Experimental Study and Modeling of the Fracture Behavior, Mechanical Properties, and Bonding Strength of Oil Well Cement. Sustainability. 2023; 15(12):9566. https://doi.org/10.3390/su15129566
Chicago/Turabian StyleVipulanandan, Cumaraswamy, Ahmed Salih Mohammed, and Praveen Ramanathan. 2023. "Experimental Study and Modeling of the Fracture Behavior, Mechanical Properties, and Bonding Strength of Oil Well Cement" Sustainability 15, no. 12: 9566. https://doi.org/10.3390/su15129566
APA StyleVipulanandan, C., Mohammed, A. S., & Ramanathan, P. (2023). Experimental Study and Modeling of the Fracture Behavior, Mechanical Properties, and Bonding Strength of Oil Well Cement. Sustainability, 15(12), 9566. https://doi.org/10.3390/su15129566