Abstract
Addressing the second priority of the Sendai Framework on Disaster Risk Reduction (SFDRR) for strengthening disaster risk governance, this paper considers coastal regions from a Socio-Ecological System (SES) perspective. It identifies the drivers of risk and critical linkages between various key components of coastal SESs that can potentially influence the resilience of coastal regions. The study considers that, in a coastal area, where the system is complex with numerous stakeholders, any decision taken in the form of developmental policy or as an adaptive practice is critical for system changes, thereby making risk anticipation and its management difficult. To further conduct a detailed investigation of this subject, seven settlements along the coastal Andhra Pradesh (India) region were methodically selected. Herein, focus group discussions were conducted to prepare fuzzy cognitive maps (FCM), which were further analyzed through the mental modeler online platform. By analyzing the structural metrics of the FCM, saltwater intrusion was identified as a significant system component. Furthermore, the study also analyzed the effects of change on the characteristics of selected SES components regarding the effectiveness of existing governance strategies and, conversely, the impact of implementing governance strategies on the identified critical components of SES. By critically examining the various scenarios thus generated, the research identifies various components, generating vulnerabilities in human systems. The derived results were cross-validated through community consultation, and the temporal variations in the state of system components were mapped. The study is expected to provide considerable input to policymakers for enhancing decision-making in coastal regions from an SES perspective.
1. Introduction
Climate action failure, described as the “failure of governments to enforce, enact or invest in effective climate change adaptation and mitigation measures” has been highlighted as a key global risk in terms of severity [1,2]. Failure in governance and policies often increases with rising uncertainty, changing dynamics, and complexity in the system [3]. Policy decisions and adaptation under complex scenarios frequently produce effects such as unsustainable outcomes, non-functionality, or increased risk [4] to a climatic phenomenon. For instance, in the case of the Mahanadi Delta in Odisha (India), hard infrastructure (hydraulic infrastructure) built as a short-term solution for flood defense disrupted the natural linkages between wetlands and water, which further exacerbated the vulnerability of people to flooding [5]. In a complex world where everything is interrelated [6], actions aiming for a particular factor often have repercussions on other interrelated factors. These repercussions change over time, are highly uncertain, and fluctuate, thereby increasing the overall vulnerability of any system to disasters. The complexity perspective is, therefore, imperative for achieving successful climate action.
Against the backdrop of disaster risk reduction planning, forecasting the nature of risk and its possible effects on various components of a system is a prerequisite. However, while dealing with complex systems, the lack of consistent data is a very common issue. Governments and institutions often face hurdles when identifying the indirect effects of climate extremities on policy implementation, largely because of the unavailability of data, complexity, and dynamics of the systems [7]. Understanding uncertainties and complexities, however, fundamentally supports informed decision-making [8], especially when planning for disaster risk reduction. Recently, the focus on dealing with indirect and uncertain effects or damage because of disasters has gained importance with respect to risk management [9,10,11]. Coastal SESs, for instance, are vulnerable to disaster risks through innumerable and unpredictable pathways. In the context of the governance and sustainability of such regions, where the health of ecosystems depends on interactions between humans and nature [12,13], the SES perspective proves to be highly relevant [14,15]. However, empirically dealing with feedback gained from interactions between governments, communities, and individuals regarding ecological changes is challenging [16]. Many global reports—for instance, the Sendai framework for disaster risk reduction, the IPCC SROC 2019 report, and others [4]—have stressed the important role of communities in improving disaster risk decision-making and unraveling the complexity and dynamic nature of SES. Although the importance of uncertainty is highlighted in many studies [17], only a few of these prioritize the uncertainty generated by individual influence [18], policy decisions [19], and sustainability at the global level. As a result, it is difficult to forecast how disaster-related policies will affect the future path of resilience and sustainability, especially in complex and dynamic SESs such as coastal rural systems.
Against that background, this study attempts to model the SES of a selected case study area (seven settlements in the East Godavari region of Andhra Pradesh) by breaking down and understanding its complexity, with a core objective of guiding the formulation, regulation, and supervision of policies related to disaster risk governance with respect to increasing the resilience of coastal SES. Fuzzy cognitive mapping (FCM)—a kind of recurrent neural network with features of fuzzy logic that enables the representation of a system and its processes with the help of components (also called concepts) and interrelations between these concepts [20]—is used to explore the relationships between components, gathering collective perceptions and the dynamics of the interrelatedness between the components of the study area.
The research question of the study is “What are the implications of the climate change-induced components of an SES for the effectiveness of governance strategies?” with the following hypothesis: “Climate change effects can potentially decrease the effectiveness of governance in an SES if their interrelationships in the SES is not understood fully”.
This study postulates that changes in a certain component of a system can have multiple indirect effects on the whole system, which could disrupt the system’s functioning, and, consequently, under the circumstances of rapidly changing components, there might be a deviation in the desired state of the system. With this understanding, the study critically examines the preferred state metrics [21] for achieving disaster resilience in a system. First, this research explores the impact of disaster risk governance policies on various SES components in the study area. Second, the effects on policy implementation upon variations in the key components of the SES are studied. To overcome a lack of data, this study considers the traditional knowledge and experience of the local community.
The study successfully tried to capture and integrate local knowledge and experiences despite illiteracy, remoteness, and technical limitations such as complexity and data lacunae by using fuzzy cognitive mapping and participant perception. The novelty of the study is that the study tried to capture the reasons for climate action failure, referred to as “governance effectiveness” reduction in this particular study. For this purpose, the study first tried to take on a scenario with climate-change-induced components, such as saltwater inundation, and understand its effect on various components of the SES. Secondly, governance strategies and their effects on various components of the SES were observed. The novelty lies in critically observing the variance between the scenario of governance and the scenario of governance under a saltwater inundation scenario, which shows climate action failure. The method provides an opportunity for policymakers to critically focus on certain components that can be a reason for reductions in governance effectiveness.
The introduction (Section 1) was one of four main sections that make up the entire essay. Section 2 covers the theoretical background useful for the research. The case study location and the research techniques used for this study are described in Section 3, and the study’s findings are shown in Section 4. Section 5 highlights the research’s future direction, major conclusions, and findings.
2. Theoretical Background
2.1. Resilience in Coastal SESs
Coastal regions are particularly susceptible to environmental change and disturbance, so resilience in coastal SES is a crucial topic of research. Numerous studies have focused on linkages between social and ecological components as well as the capacity of coastal systems to resist disruptions and recover from them. For instance, studies have looked at the adaptability of coastal communities to sea level rises and storm events [22,23], the resilience of coral reefs to climate change and ocean acidification, the function of ecosystem services in promoting coastal resilience [24], the dynamic behavior of infrastructure in coastal areas [25,26], and macro-zonation [27,28].
In order to improve coastal resilience, researchers have also looked at governance practices and legislative initiatives, such as integrated coastal zone management [29,30] and the establishment of marine protected areas [31,32]. According to studies [33,34], social-ecological feedback, community involvement, and adaptive governance are crucial for fostering resilience in coastal SESs. The literature on resilience in coastal SESs offers insightful information on the dynamics and management of these intricate systems, assisting in the creation of plans for sustainable coastal development and climate change adaptation.
2.2. Methods of Disaster Risk Decision-Making for Resilience in SESs
Using a variety of mature and robust approaches for disaster risk decision-making, substantial research has been conducted on resilience in SESs. This literature review aims to comprehensively understand various methods used in enhancing disaster risk decision-making with a focus on resilience in socio-ecological systems. According to Biggs et al., (2012) [35], a set of resilience indicators can be used to measure how well an SES can withstand disruptions while still performing its essential duties. To analyze the governance of common-pool resources, Ostrom’s SES framework [36] serves as a theoretical underpinning. Participatory techniques, as promoted by Berkes (2009) [37], place an emphasis on local expertise and community participation in decision-making procedures, which improves resilience.
Modeling and simulation methods allow for the examination of intricate SES dynamics and the assessment of prospective interventions [38]. The identification of key players and knowledge of system dynamics is made possible by network analysis [39], which provides insights into the structure and interactions of social-ecological networks.
Focusing on decision-making research methods, criteria decision analysis (MCDA) [40], cost–benefit analysis [41], Bayesian networks [42], and the analytical hierarchy process (AHP) [43] have focused on building frameworks for ranking alternatives, the economic viability of resilience methods, probabilistic models to examine causal linkages with uncertainty, and rankings according to hierarchical standards, respectively.
Collaboration and knowledge-sharing are made easier through “social network analysis”, which sheds light on social interactions and information flow inside SESs. Local stakeholders are empowered by “participatory decision-making processes”, which also improve their ability to manage risks. Scenario analysis examines conceivable future situations and how they might affect planning for resilience. In order to comprehend the dynamics of SESs, game theory, in particular, agent-based modeling, analyzes strategic interactions between decision-makers. Decision-making processes are represented visually in “decision trees” [44], which also evaluate potential actions. Addressing uncertainty and identifying solutions that are resilient across various scenarios are made easier with robust decision-making [45].
A case study has certain requirements and challenges for researching resilience in SESs. Challenges include data gaps, complexity, the remoteness of the area, and technological and economic hurdles in the region; the FCM method proved to be effective for accumulating all previous experiences as well as the present knowledge of local communities regarding the SES of the study area.
In addition, the study area is highly vulnerable to multiple types of climatic stressors such as cyclones, sea level rises, industrialization, urbanization, etc.; hence, fuzzy cognitive mapping was considered for the study, which is further discussed in Section 3.1 and Section 4.6.
3. Materials and Methods
3.1. Study Area
The case study location is situated in the Godavari Estuarine Region of the Indian state of Andhra Pradesh. The second-largest estuarine region in India is the Godavari Estuarine Region [10].
The local ecosystem provides a wide range of fisheries that are essential to the livelihoods of traditional fishing communities. These fisheries consist of multiple subvarieties of mollusks; fish; prawns; and crustaceans such as mangrove crab and yellow crab. Seven distinct settlements located in the Gautami–Godavari estuary region of Andhra Pradesh, specifically, the East Godavari region (as shown in Figure 1) were selected for this study. These settlements include Magasanitippa, Balusutippa, Pedavalasa, Lakshmipathpuram, Gogullanka, Bairavalanka, and Nillarevu. Over the past decade, this region has been noted to be one of the most disaster-affected areas in India, and the selected settlements were the ones that were declared most vulnerable to cyclones, storm surges, and floods. For the selection of the seven settlements within the delineated study area, factors such as the vulnerability of the settlement, remoteness, access to the basic resources, distance from the coast, etc., were also taken into consideration.
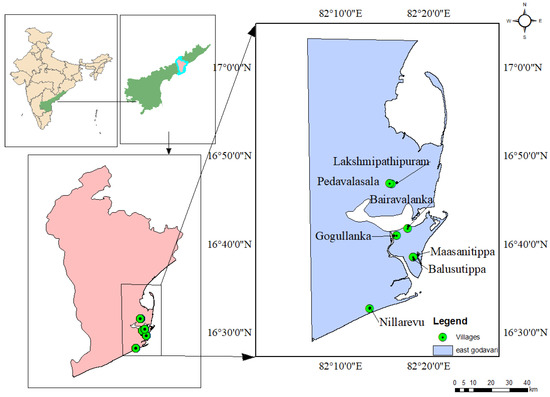
Figure 1.
Location of the selected settlements for analysis in the case study area of Andhra Pradesh.
3.2. Research Method
3.2.1. Mapping Method
For this study, fuzzy cognitive mapping is used as a tool to comprehend the intricate interrelationships between humans and nature, thereby unraveling the complexities of the SES. FCMs have previously been used to study human–nature interactions in complex system modeling [46], environmental decision-making [47], ecological models utilizing people’s knowledge [48], and defining the management objectives of complex ecosystems [49]. Recently, FCMs have also been used to explore resilient development strategies in diverse fields, including agricultural systems and COVID-19 [50], good public governance in agricultural systems, environment management [19], and traditional knowledge in SESs [51]. While FCMs have been utilized by disaster risk managers to help weigh the trade-offs of alternative decisions [52], temporal issue [9,52,53] and exploration of non-linear relation-ships of stakeholder perspectives [54,55,56] are few of the existing limitations which are addressed through this study by validating the results of the model with the stakeholder knowledge. The integrated dynamics of the study area were modeled with the help of “mental modeler” [57] software.
3.2.2. Derivation of Components or Analysis
The derivation of components is considered a critical part of modeling system dynamics and often involves discussions between stakeholders, who share their knowledge and beliefs about the overall functioning of the system. Determining the critical elements affecting the system’s performance requires harnessing the collective intellect of stakeholders to overcome data shortages and scientific knowledge constraints. Utilizing the collective intelligence of a community [21] to overcome data scarcity and scientific knowledge limitations [58] is essential for deriving the critical components affecting the system’s performance. Such methods help untangle the intertwined nature of interactions between humans and natural ecosystems [14], particularly in coastal regions, thereby supporting disaster governance [59]. Mapping exercises involve combining different approaches, such as expert-based and stakeholder consultations or expert-based and literature reviews to determine the components of the SES. This approach can help ensure that the mapping process is comprehensive and inclusive of various perspectives. The study, therefore, determines the components through a combination approach (Figure 2) based on the following: (i) A recovery map prepared through focus group discussions to generate a basic understanding of post-disaster system behavior. The components that require time for recovery and often end up creating vulnerabilities in the system in the event of upcoming disasters were identified through this method. (ii) Hindrance factors (i.e., pressing issues in villages) limiting the villagers’ capacity building and prepare coping or mitigation strategies. (iii) A literature review including studies (scientific/academic journals, websites, news related to the case study area, etc.) related to the collected components [15].
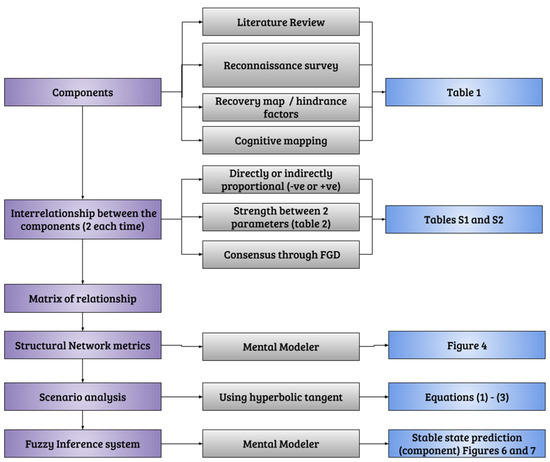
Figure 2.
Workflow of the paper.
3.2.3. Cognitive Maps and Inputs from Experts
Notably, the components with very low chances of fluctuation were neglected in the study.
The selected components are divided into cultural components; socio-economic components; ecological components; physical infrastructure; components related to anthropogenic and hydro-meteorological risk components; and governance for ease of display and to avoid missing relevant concepts. However, the socio-ecological parameters fit under one category in certain situations, which may also be related to other categories at times. Thus, the delineation is not very strict. For example, ecosystem-based livelihoods are basically under the ecological category since they utilize ecological resources. However, ecosystem-based livelihoods can also fall under cultural components, as the very basis of their existence is linked with cultural aspects and traditional knowledge. Further, concepts can fit into two components at a time, but this does not affect the analysis in any way.
SESs, which are usually considered interactions between social and ecological components, consist of numerous components that are a result of the interplay between humans and natural systems. Sometimes the components are part of an ecological system, for example, food production variety, or part of social aspects, such as components listed under anthropogenic activities, as shown in Table 1. Hydrometeorological hazards are components that influence the SES, for example, floods, saltwater inundation, etc. Governance and culture are path-defining components of the SES and generally fall under the social aspect of the SES. For example, decisions taken in the system can influence the path of resilience in the system, which is one of the major considerations of this study. However, cultural components are similar to the cultural services listed by the TEEB from a disaster risk perspective.

Table 1.
Finalized components for analyzing the coastal SES.
A coastal SES is often characterized by the complexity existing in the system. As mentioned above, the components do not always fall under a particular category and are often related in multiple ways to other components. Though processes such as the condensation of parameters exist in the fuzzy logic process, in this particular study, the researchers believe the condensation of parameters could create further complications, as there will be a larger role for the researcher, while condensing the concepts may not really suit participatory-planning-related studies. Further, the researchers’ role was more focused on inculcating the scientific data into the prepared mental model using a participatory approach. Hence, to reduce the errors as well as make the model more realistic as on the ground, this study has not opted for component condensations.
3.2.4. Establishing a Relationship between the Derived Components
The arrangement of nodes and edges and establishing the interrelationships of various components in the SES are of great importance in FCM. The interrelations between the components of the study area are represented as nodes (or concepts), generally as a reflection of the qualitative characteristics of the system (between 0 and 1). The components selected in Table 1 were chosen in such a way that their combination, interaction, and functioning determined the characteristics of the coastal rural SES in the case study area. The correlation between two variables was established based on how they are related and by coding them into a set between [0, 1] or [−1, +1].
3.2.5. Data Collection and Analysis Method
Figure 3 was prepared using mental modeler software v1.0, wherein the thickness indicates the strength of the relationships between the concepts.
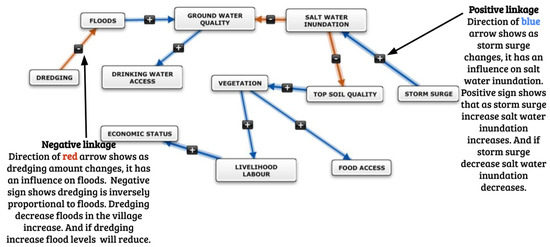
Figure 3.
Example figure showing interrelationships between components and linkages.
In Figure 3, the greater the thickness is, the greater the weight of the relationship between the concepts among the SES components. In the matrix, the values are provided according to Table S2 (Supplementary Material). The degree of significance of each key concept based on resident perceptions was recorded. The FCMs represent community experiences of previous cyclones, present sea level rises, and climatic extremities. This also reflects the participants’ understanding of human–nature interactions in the system. These mental models graphically portray the perceived cause-and-effect relationships [60] of human–nature interactions. Mental models from all 7 villages were collected individually. These models were combined using single-level aggregation similar to mathematical models from previous studies [51,61], which used one step. Equation (1) describes the process of aggregating individual models into a single FCM. These 7 FCMs are further added in such a way that similar linkage weights, when repeated, are considered the mode of the observed values. If there are no similar values, then the median of the data is considered while combining the 7 master models. In addition, scientific data, as well as the previous literature, were used to combine the components that lack data from the community perspective side. This is a rigorous exercise that, again, is conducted by a team of researchers (experts) and is based on the complexity of the system and the scientific data available. The more scientific observations, the more accurate the results of the final model. In addition, more participation from the citizens and active discussions can form a balance in the model thusly prepared. The scientific observations help decide the weight between the interrelationships. Data such as correlation data can easily be fit into a model when converted into weights and divided into data similar to Table S2 (Supplementary Material). The combination of these mental models was created using single-level aggregation. Mathematical methods from previous studies such as [51,61] used the single-level aggregation method (one step).
where represents the participant’s FCM with the corresponding adjacency matrix, . AFCMP represents the FCM of individual participants or participant groups. N is the total number of participants or groups. For the master model, the weights between the nodes or concepts of SESs are averaged when there are multiple different observations. The researchers have accordingly interpreted the values based on the component observations. The final mental model is a bit different from that of the combined mental model. This is because we further added the opinions of the researchers from the field, each of whom has a formal education, training, and scientific knowledge and understanding related to DRR, which included referring to case studies from the literature as well as the data. Using this team of researchers, we collected and added scientific data, such as sea level rise projections, etc.
Figure 4 represents the final master model (or FCM) for analysis, which was used as an input for the mental model software. The software converted the FCMs into a matrix format for further analysis. The final model was created by combining the matrices of the individual cognitive maps from the seven settlements, aggregated mathematically to create a model that represents the insights of all participants. It is important to note that in Figure 4, red lines represent Negative linkage and blue line represent positive linkage.
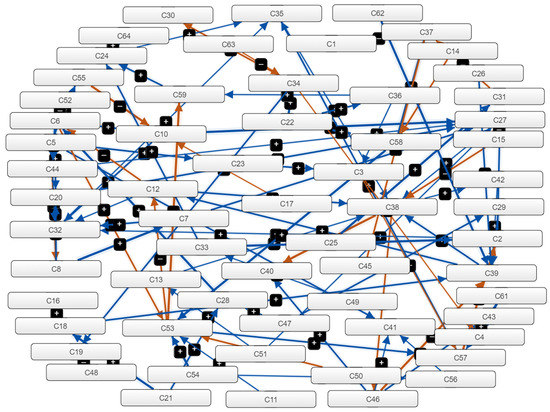
Figure 4.
Master Model for analysis using Fuzzy Cognitive Mapping.
Degree of centrality [62], a common graph theory measure [63] used to investigate the interrelationships between components, formed the basis of further evaluation [5] in the master model we prepared. Herein, centrality is described as the relative importance of a system component to the system’s operation [64]. Scenario analysis was used for analyzing resilience pathways, wherein the values of one or more critical concepts in the model were changed to create “what-if” scenarios representing the dynamic behavior of FCMs that contribute to the resilience of the system. The variations in the system state are then recorded with respect to the steady state. The value of each state is calculated using Equation (2):
where is the value of concept i at iteration step k + 1; is the value of concept j at iteration step k; and i j is the weightage of edge relationship between i and j [65]. Function f(x) is the “threshold function” used to squash the values at each step [62]. Here, the threshold function is a hyperbolic tangent function expressed as Equation (3). Hyperbolic tangents while analyzing FCMs were previously used by Liu et al. [66]
f(x) = tan h(λx) = eλx − e−λxeλx + e−λxe
This equation is used to quantify the state value of the individual nodes [67] in the interval [1, 1]. Note that the parameter λ > 0 in (2) and (3) controls the shape of the corresponding activation function, where λ is a real positive number (in this case) that determines the steepness of function f in Equation (4):
4. Results and Discussion
4.1. Structural Analysis of the Model
The structural analysis of the FCMs included centrality measures identifying drivers, ordinary components, and receiver components. Centrality analysis is a network analysis method that measures the significance or influence of particular nodes within a network. It aids in locating the crucial ideas or elements that are crucial to the system’s operation and significantly affect its dynamics. In this study, the FCM model is subjected to centrality analysis to ascertain the relative importance of each key concept based on participant perceptions. We obtain insights into the relative significance and influence of notions such as saltwater inundation, innovation, income, and the availability of ecosystem-based livelihoods, among others, by analyzing the centrality scores.
Figure 5 displays the centrality of each component in the analyzed system. The centrality results are achieved using mental modeler software. The software analyzes the significance of elements within an FCM using a single centrality measure called “Influence”. The mental modeler software’s influence measure quantifies how much one component influences other components in the network. It takes into account both a component’s direct and indirect effects on other map components. Higher influence scores are indicative of a component’s centrality or influence throughout the system.
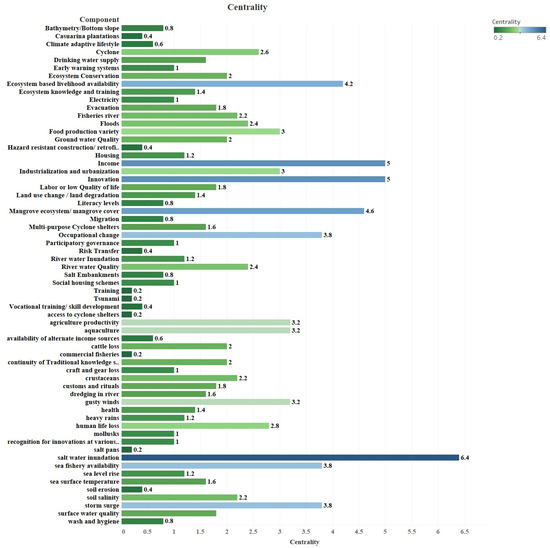
Figure 5.
Comparison of the centrality values of the components of the SES.
The influence measure offers a way to evaluate the relative importance of components in terms of their influence on the overall system. It is important to note that mental modeler software primarily focuses on visualizing and analyzing the causal relationships and dynamics within a fuzzy cognitive map.
The mental modeler software is utilized to analyze the centrality score of each component, with higher values indicating the importance of individual concepts within the overall model. To evaluate the concepts that influence the resilience of the system, decision concepts are examined based on centrality values, as illustrated in Figure 5. The degree of significance of each key concept based on participant perceptions was recorded, and it was found that saltwater inundation (SWI), innovation, income, mangrove ecosystem health, ecosystem-based livelihood availability, storm surges, occupational changes, and sea fishery availability are the most significant concepts with a considerable impact on the system. The concepts “saltwater inundation” and “governance strategies (vocational training, ecosystem conservation, participatory governance, early warning systems, ecosystem knowledge and training, evacuation, risk transfer, and ecosystem-based livelihood improvement training” are selected based on the convergence of both higher centrality scores and significance, indicated by participant perceptions. The governance parameters were chosen for the purposes of analysis. The two concepts are further explored to determine the impact of existing governance strategies on the other components of the SES.
4.2. What-If Scenarios
Using Equation (3), ‘what-if ‘scenarios were created, from which scenarios related to Figure 6 and Figure 7 were made. The investigation and analysis of potential hypothetical alternatives or conditions within an SES are referred to as “what-if” scenarios in mental modeler software. These scenarios entail altering a few model inputs, parameters, and variables in order to simulate alternative outcomes and gauge how the system will behave in various situations. Researchers and decision-makers can learn more about the potential effects of different interventions, policies, or external factors on the behavior, dynamics, and resilience of the system by looking at “what-if” scenarios [68,69,70,71]. These scenarios make it feasible to explore potential futures, assisting in decision-making and providing a way to evaluate various tactics or policy possibilities [68]. They aid in the comprehension of the interactions, complexities, and emergent aspects of systems, making it easier to identify important leverage points and assess trade-offs [69,70]. Additionally, “what-if” scenarios enable participative approaches, including stakeholders in the decision-making process and promoting group learning [71]. Decision-makers can assess the risks and results of various options, tactics, or future scenarios using these exploratory simulations, which can help them make more reliable decisions and practice adaptive management [69,71].
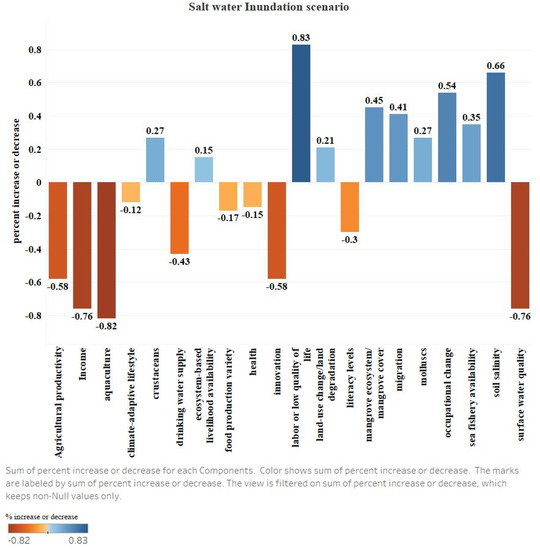
Figure 6.
Increased saltwater inundation scenario.
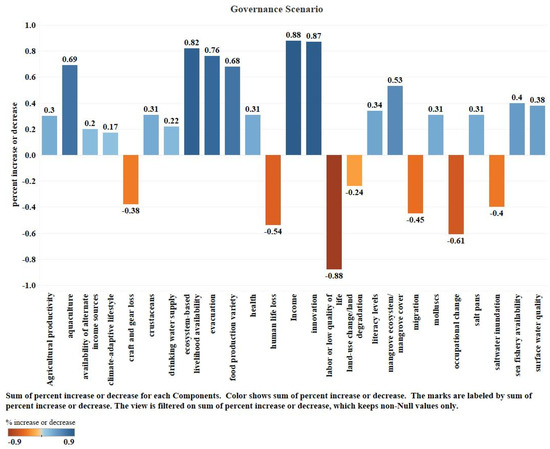
Figure 7.
Increased vocational training + ecosystem conservation + participatory governance + early warning systems + ecosystem knowledge and training + evacuation + risk transfer + ecosystem-based livelihood training.
4.3. Saltwater Inundation Scenario
In Figure 6, the percent increase or reduction in each component is shown visually. Darker hues denote greater values, while the color of the bars represents the size of the sum. The equivalent sum of percentage growth or reduction is indicated with the bars. Only non-null values for the sum of the percent increase or decrease are shown in the figure because of filtering. Bars are used to represent the marks in the visualization. The sum of the percentage increase or reduction in each component is indicated with the bars. The cumulative values are shown by stacking the marks. The “percent increase or decrease” dimension is on the row shelf, and the “components” dimension is on the columns shelf. To display only non-null values, the “percent increase or decrease” dimension has a filtering shelf applied. To label the bars with the “sum of percent increase or decrease” measure, we used a text shelf. The “sum of percent increase or decrease” measure is also represented by the color shelf. The 20 constituents of the “components” dimension are listed in ascending alphabetical order. The “sum of percent increase or decrease,” which runs from −0.82 to 0.83, is one of the measurements used in the visualization. This measure’s related filter makes sure that only non-null values are shown. This visualization, on the whole, offers a summary of the total percent rise or decrease in each component, enabling a visual comparison of their magnitudes.
A component-wise examination of the influence of saltwater inundation for different time duration was conducted using FCM. For this purpose, the time intervals were divided into four categories: saltwater inundation for a short duration, (1) a day or less, (2) a week or less, or (3) a month or less or considerably longer duration, such as (4) more than a year. It was found that aquaculture is highly sensitive to saltwater inundation, as indicated in Figure 6. The chances of sea fishery availability increase when the saltwater stays for a considerably longer duration of time or permanently; i.e., the seawater level increases. The probable assumption for this situation is that sea fishery is available even in mangrove ecosystems during their breeding time. In the villages of Nillarevu and Maasanitippa, the seawater level rose over the past few years, and this led to a shift in local occupations to saltwater aquaculture with mangrove crabs as an adaptation practice. During a storm surge, the land remains inundated with saltwater of 3–4 m and for a duration of no less than an hour. From this case, it can be understood that the duration of saltwater inundation is important for determining its effect on any other component of the system.
It is important to note that saltwater inundation has varying impacts for different durations. If SWI because of a storm surge did not last for more than a day, the fishing communities reported a loss in their daily wage income. Contrarily, the work of removing the saltwater from aquaculture farms, spraying gypsum over large areas of land, and many other recovery jobs opened new avenues for income. For SWI lasting more than a week, there was no immediate impact observed. However, SWI for more than a month moderately changed the vegetation of the impacted area.
4.3.1. Sea Fishery Availability
Sea fishery availability is a critical scenario because 87% of the population in the settlements of the case study area directly depend on fishing as an ecosystem-based livelihood, benefiting enormously from the health of ecosystems [13,72]. As per the resident’s perceptions, increased sea catches increase livelihood opportunities. However, this is possible only during a considerably longer duration of SWI or a permanent sea level rise.
4.3.2. Mangroves
Another concern noted regarding the ecosystem is that of the mangroves. The accretion rate of mangroves onto land is a commonly observed scenario in many cases around the world [73], especially because of sea level rises. Mangroves depend on the sea for their survival. Mangrove ecosystem health increases with increased saltwater inundation if and only if the sea level rises relative to the mangrove surface [74]. It is noteworthy that the salinity levels in mangroves have been previously studied; factors such as duration, levels, and the depth of saltwater inundation in mangroves were observed to be critical during the study and demand further research.
4.3.3. Occupational Change
Community perceptions reveal that increasing ecosystem-based livelihoods reduce occupational changes (Table S2). However, saltwater inundation increases the chances of occupational changes. Inundation for a shorter duration does not affect livelihoods and households, but for a longer duration of time, a considerable shift in the occupational change patterns in the village can be forecasted. This is because a longer duration of inundation can change the ecosystem health as well as biotic resources in the ecosystem and, hence, the population dependent on the resources. However, this needs to be investigated further for more specific observations.
4.3.4. Quality of Life
The concepts of quality of life and disaster resilience is highly interrelated [73]. Saltwater inundation can degrade the quality of life of people dependent on ecosystem-based livelihoods. It is a general consideration that ecosystem degradation can push people into persistent poverty. However, in this case, despite the slight increase in mangrove cover and increased saltwater inundation, degradation in the quality of life was observed.
4.3.5. Land Degradation and Agricultural Productivity
The salinity status of the inundated soil depends on the texture of the soil [75] and, therefore, the rate of infiltration of the soil, the soil moisture in the period immediately after inundation, the surface water quality, and the drinking water quality. In this case, surface water quality is highly sensitive to changes in saltwater. The surface water quality is affected by every storm surge affecting the area, and specifically, the people of Maasanitippa and Nillarevu face a severe threat.
4.3.6. Literacy Levels
A reduction in literacy levels is an indirect effect of saltwater inundation. On a temporal scale, saltwater inundation for a significantly longer duration, i.e., months to years, can certainly influence the literacy levels of the community.
4.3.7. Food Production Variety and Agricultural Productivity
Saltwater inundation significantly disturbs agricultural production and other vegetation, thereby reducing the food production variety of the region. Saltwater inundation and the resulting salinity have significantly affected agricultural production in the selected area. Similar findings were reported by Alam et al. [12]. Effects on health from saltwater inundation [13] have also been reported in other studies [16].
4.4. Governance Scenario
The National Policy on Disaster Management by the Ministry of Home Affairs, India, was adopted in 2009. Improving real-time forecasts and early warning systems, supported by responsive and fail-safe communication and information technology [76], is one of its major objectives. Regular estimations and forecasts of climatic risks can be observed with various laboratories and institutions. It was assumed that the capacities of early warning systems were raised to 100% using the model. Thus, the frequency of receiving forecasts relevant to extreme weather by the general public is less uncertain, and they can schedule their events, such as sowing a particular variety of crop or investing in a particular ecosystem service. This was further supported by the National Policy for Farmers (2007) [77] by the Ministry of Agriculture and Farmers’ Welfare. This policy initiative also supported the risk transfer of farmers. The National Environment Policy (2006) [78] by the Ministry of Environment, Forest and Climate Change supports the objective of ecosystem conservation. Vocational training was recommended in the National Cyclone Risk Management Plan and NDMP (National Disaster Management Plan 2019) [79]. Evacuation in villages happens prior to a climate extremity, such as a cyclone. This was supported at all levels by the district magistrate, revenue departments, other relevant government officials, village panchayats, and community heads of the villages. Vocational training/skill development is one of the sub-thematic areas for disaster resilience, suggested by NDMP 2019 [79], India. It specifically suggests fostering expertise for multi-hazard-resistant fabrications in cyclone risk zones for multiple housing types and critical infrastructure. Risk transfer involves formally or informally shifting the financial consequences of risks from one party to another. In total, 25 components were found to either increase or decrease when the governance strategies selected for this study were increased or 100% implemented.
4.5. Combined Scenarios
Concepts, as shown in Table 1, were used to model the combined scenario of governance and saltwater inundation (Figure 8). The governance targets of various policies under the influence of sea level rise were observed and are critically discussed in this section.
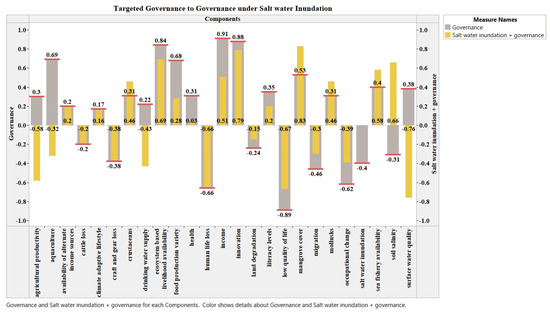
Figure 8.
Compared scenarios of governance under saltwater inundation scenarios.
Under increased governance components, Figure 7 shows a scenario of fluctuation in the selected components of the coastal SES. However, upon the introduction of increased saltwater inundation, the governance scenarios do not work as planned, as shown in Figure 8. The study chose to observe the variance in Table 2 between the components by using the following formula, Equation (5):
S2 = Σ (xi − x)2/n – 1
Table 2.
Variance between the two scenarios.
In the formula, S2 represents the variance, n stands for the observation count, and xi represents the average value of all observations. As variance is mostly considered for calculating between two numbers (observation count), we divided the result by the first value and then multiplied the outcome by 100.
The variance here represents the probable failure percent of the policies selected under the category of governance. Agricultural productivity, drinking water supply, surface water quality, and aquaculture have higher variability compared with the other components under the influence of saltwater inundation in the presence of the effective implementation of governance components: >100% variance—high chances of the failure of the policies, 50–99%—medium chances of the failure of the policies, and 1–49—low chances of the failure of the policies. Therefore, the above-addressed components should be given prior consideration during planning for disaster risk reduction and, hence, contribute to resilience in SESs.
4.6. Superiority of FCM over Other Methods
4.6.1. Scenario Generation
Based on the results, it can be said that fuzzy cognitive mapping has advantages over other methods in terms of assisting in generating disaster risk decision-making scenarios. Though scenarios can be generated using other models, such as agent-based modeling, system dynamics modeling, Bayesian networks, and other mathematical models, the scenarios generated through FCM are said to capture the intrinsic fuzziness and ambiguity of decision-making criteria, which can thus be easily addressed, making it suitable in situations of data lacunae, whereas other methods, such as system dynamics modeling [80], require crisp data sets. In addition, the FCM of the coastal SES in this study, which involved subjective and uncertain information, can assist policymakers in disaster risk governance of the SES by identifying variance in multiple future scenarios, which were output by the study.
4.6.2. Dealing with Complexity
This research unpacks the complexity of the SES in the selected case study area through the fuzzy cognitive mapping of seven settlements with the assistance of local communities. The capacity of FCM to deal with complex and often dynamically changing systems over time is another benefit. According to Sarah Henly-Shepard et al. (2014) [62], FCM can model the consequences of various interventions, policy changes, or potential future scenarios on the behavior of the system, which matches the results of this study. This capability is especially helpful in disaster risk governance because making decisions in real time requires long-term planning and taking changing risk profiles into account. In a recent study, Eppinga et al., 2023 [81], analyzed the dynamics of SESs critically using mathematical modeling, wherein focus was placed on system behavior when socio-economic dynamic dependency on local ecosystem processes declined. It is important to note that FCM too excels at analyzing and representing complex systems with a multitude of feedback loops and interactions, while mathematical models make it difficult to address complexity, especially in data-uncertain cases.
Parker et al., 2023 [82] in their study, made a socio-ecological assessment of land use changes, addressing complexity as one of the research gaps in their study, which focused on land use changes related to cannabis models, with co-variates of the model based on interviewees.
4.6.3. Hybridization, Data Types, and Indirect Effects
Fuzzy cognitive mapping, though quantitative to an extent, provides scope to qualitative data, such as correlation data between every two components in a system (values similar to Table S2). Furthermore, the calculation of variance, which was performed in this study was a qualitative method making it a hybrid model in a way (described as a combination approach in Figure 2 of the study), as does scenario analysis, which includes centrality and hyperbolic tangents. Camila Jahel et al. 2023 [83] specify the need for a combination of qualitative and quantitative methods or hybrid methods to deal with SES.
Disaster risk decision-making, since time immemorial, has followed a linear approach, but multi-dimensional analysis is catching up with the aid of recently trending technologies. The present research falls in this bracket in the process of unraveling complexity, considering multi-dimensionality and focusing on indirect effects.
Furthermore, linear approaches to disaster risk decision-making often result in neglecting indirect effects, and in systems such as SESs, where levels of human–nature interactions decide the path of resilience, feedback loops are always possible in any decision made. FCM excels at analyzing and representing complex systems with a multitude of feedback loops and interactions. It enables decision-makers to fully understand the causal connections and nonlinear correlations between diverse elements [84]. This is especially useful in disaster risk management because of how intricately risk factors, vulnerabilities, and mitigation strategies can interact.
The application of this method could assist governments and agencies working toward the identification of indirect risks and build resistance to uncertainties by incorporating local experiences. By comprehensively incorporating the protection of ecosystem services, the model has the potential to identify research requirements that have a positive influence on the trajectories of sustainable development and resilience. This study proves that the temporal dimension of fuzzy cognitive mapping, which is a huge limitation of the model [52], can be addressed through the method presented in this paper using community participation and accurate scientific observations, as per their availability.
4.6.4. Community Participation
The lens of human–nature interactions supports unlocking the hidden but rapidly changing components of the coastal SES [17], which is partly in the hands of local communities and their choices [72]. It was found that despite the existing illiteracy, remoteness, and technological and economic hurdles in the region, the FCM method proves to be effective for accumulating all previous experiences as well as the present knowledge of local communities regarding the SES of the study area.
Section VI, “Investing in disaster risk reduction for resilience”, of the Sendai framework recognizes the significance of engaging with local communities and empowering them as agents of change. It encourages the participation of various stakeholders, including citizens, in the design and implementation of disaster risk reduction strategies and initiatives. The framework emphasizes the importance of building inclusive governance structures that involve citizens in risk assessment, planning, and monitoring activities. Furthermore, section IV emphasizes the need for their active involvement in decision-making processes, planning, and the implementation of policies and actions. Under such situations of collaborative environments, FCM offers a multi-stakeholder, expert-involved, participatory method of decision-making. FCM fosters a cooperative environment for comprehending and mitigating disaster risks by integrating stakeholders in the development and assessment of the cognitive map [5]. It makes it possible to include many viewpoints, skills, and beliefs in the decision-making process, resulting in more inclusive and consensus-driven results. The case is the same in coastal SESs, which include multiple types of stakeholders, and hence, fuzzy cognitive mapping was selected for the study.
5. Conclusions
To sum up, this study has provided information about the interrelations between components of coastal SESs and their susceptibility to disaster risks by making a fuzzy cognitive map.
First, this research employed fuzzy cognitive mapping to unravel the complexity of the SES of seven villages in Andhra Pradesh, India, using community participation. The model was then transferred to mental modeler software to analyze it further (Figure 4). Second, based on centrality scores, concepts influencing the system were identified, the one with the highest centrality value being saltwater inundation (Figure 5). This “saltwater inundation” component is thus considered a driver, and the impact of its increase on the system is identified using a hyperbolic tangent performed in the mental modeler software (Figure 6). Third, governance scenarios were also increased to their highest possible value in the model, which simulated and identified the components that were being influenced. Finally, a combined scenario of governance (Figure 8) under saltwater inundation was prepared. A targeted bar graph demonstrated the impact of saltwater inundation on various components of the SES.
The findings of the study highlighted the importance of considering the impact of climate change, such as from saltwater inundation, on the functioning of governance strategies. The results suggest the need for effective policies and interventions that address the identified components and prioritize actions to mitigate the adverse effect of saltwater inundation. This process serves as a dual-regulated solution, not just for mitigating saltwater inundation but also improving governance strategies by understanding how climate action failure happens. This paper clearly demonstrates the effect of saltwater inundation on various components of an SES, which is a climate change effect. Furthermore, the governance strategies considered are related to disaster risks.
In terms of future perspectives, the findings of this study can inform decision-making processes aimed at enhancing disaster risk resilience in coastal areas. Policymakers and stakeholders can utilize the identified key components and their interrelationships to design targeted interventions and strategies that address vulnerabilities and promote sustainable development.
Overall, this study offers insightful perspectives of intricate interactions between the components of an SES and contributes to the existing knowledge by unpacking the complexity of coastal SESs and providing insights into their resilience to disaster risks. However, it is crucial to note that there are several research gaps in this study that call for additional research. First of all, future research should examine the interactions and interdependence between the various components with respect to similar case studies in order to acquire a more thorough knowledge of the process of fuzzy cognitive mapping and its applications for resilience in SESs. Moreover, this study was limited to testing the impacts on governance effectiveness under situations of saltwater inundation. The study concentrated on the component with the highest centrality and simulated its modifications. ’Similar components that do not have high centrality are yet to affect the system’s dynamics and hence, they are to be monitored and researched further.
Additionally, this study primarily focused on the coastal SES of a specific case study area. It would be valuable to replicate the analysis in other coastal regions to examine the generalizability of our findings and explore the contextual nuances that may exist.
Furthermore, although the fuzzy cognitive mapping approach provided a robust framework for understanding system dynamics, there may be alternative modeling techniques and methodologies that could offer advanced insights. Comparative studies involving different modeling approaches would contribute to a more comprehensive understanding of resilience in coastal SESs. Further, working on modifying fuzzy cognitive mapping or integrating it with models such as agent-based modeling would add much accuracy to the models.
Further research is recommended to investigate specific aspects such as enhancing governance strategies based on the affected components, which are the results of the study. Furthermore, by integrating community participation and advanced techniques, such as machine learning and artificial neural networks, this study can be made more precise. Specific studies on projections of climate change effects, such as saltwater inundation, and their calibration with the present model in the study would provide more effective results. Moreover, synchronizing such projections would also satisfy the temporal dimension of the model, which is a research gap in the study. Such calibrations would possibly make it more accurate, to an extent, without neglecting citizen perceptions, which consider previous experiences and help to perfect the synchronous model.
Supplementary Materials
The following supporting information can be downloaded at: https://www.mdpi.com/article/10.3390/su15129565/s1, Table S1. Eleven grades considered for describing the influences among the components of the socio-ecological system. Table S2. Causal interrelations in the coastal socio-ecological system (based on community interactions, literature and expert opinions).
Author Contributions
Conceptualization, S.D. (Shruthi Dakey); Methodology, S.D. (Shruthi Dakey); Formal analysis, S.D. (Shruthi Dakey); Investigation, S.D. (Shruthi Dakey); Writing—original draft, S.D. (Shruthi Dakey); Writing—review & editing, S.D. (Sameer Deshkar), S.J. and V.S.; Visualization, S.D. (Shruthi Dakey). All authors have read and agreed to the published version of the manuscript.
Funding
This research received no external funding.
Institutional Review Board Statement
Not applicable.
Informed Consent Statement
Informed consent was waived off as no personal data was collected from respondents and only a general opinion was collected.
Data Availability Statement
Relevant data is already added in supplementary tables.
Acknowledgments
The authors would like to thank the local community members of all the selected case study settlements for their support and cooperation during field studies.
Conflicts of Interest
The authors declare no conflict of interest.
References
- McLennan, M.; SK Group; Zurich Insurance Group. Global Risks Report 2021; World Economic Forum: Cologny, Switzerland, 2021. [Google Scholar]
- Mcbean, G.; Kovacs, P.; Voogt, J.; Kopp, G.; Guilbault, S. Building Climate Resilient Communities: Living Within the Earth’s Carrying Capacity; Western Libraries: London, ON, Canada, 2021. [Google Scholar]
- Hudson, B.; Hunter, D.; Peckham, S. Policy failure and the policy-implementation gap: Can policy support programs help? Policy Des. Pract. 2019, 2, 1–14. [Google Scholar] [CrossRef]
- Doswald, N.; Janzen, S.; Nehren, U.; Vervest, M.J.; Sans, J.; Edbauer, L.; Chavda, S.; Sandholz, S.; Renaud, F.; Ruiz, V.; et al. Words into Action: Nature-Based Solutions for Disaster Risk Reduction; United Nations Office for Disaster Risk Reduction: Cairo, Egypt, 2021. [Google Scholar]
- Kosko, B. Fuzzy cognitive maps. Int. J. Man-Mach. Stud. 1986, 24, 65–75. [Google Scholar] [CrossRef]
- Nations, U. Transforming Our World: The 2030 Agenda for Sustainable Development; United Nations: New York, NY, USA, 2015. [Google Scholar]
- IPCC. Special Report, IPCC 2012; IPCC: Geneva, Switzerland, 2018. [Google Scholar]
- Gray, S.A.; Gray, S.; Cox, L.J.; Henly-Shepard, S. Mental modeler: A fuzzy-logic cognitive mapping modeling tool for adaptive environmental management. In Proceedings of the 46th Hawaii International Conference on System Sciences, Wailea, HI, USA, 7–10 January 2013; pp. 965–973. [Google Scholar]
- Park, K.S.; Kim, S.H. Fuzzy cognitive maps considering time relationships. Int. J. Hum.-Comput. Stud. 1995, 42, 157–168. [Google Scholar] [CrossRef]
- Satapathy, D.R.; Krupadam, R.J.; Kumar, L.P.; Wate, S.R. The application of satellite data for the quantification of mangrove loss and coastal management in the Godavari estuary, East Coast of India. Environmental monitoring and assessment. Environ. Monit. Assess. 2007, 134, 453–469. [Google Scholar] [CrossRef] [PubMed]
- Frey, J.; Berkes, F. Can partnerships and community-based conservation reverse the decline of coral reef social-ecological systems? Int. J. Commons 2014, 8, 27–43. [Google Scholar] [CrossRef]
- Alam, M.Z.; Carpenter-Boggs, L.; Haque, M.S.; Halsey, M.; Rokonuzzaman, J.; Saha, M.; Moniruzzaman, B.M. Effect of salinity intrusion on food crops, livestock, and fish species at Kalapara Coastal Belt in Bangladesh. J. Food Qual. 2017, 2017, 2045157. [Google Scholar] [CrossRef]
- Shammi, M.; Rahman, M.; Bondad, S.E.; Bodrud-Doza, M. Impacts of salinity intrusion in community health: A review of experiences on drinking water sodium from coastal areas of Bangladesh. Healthcare 2019, 7, 50. [Google Scholar] [CrossRef]
- Giabbanelli, P.J.; Crutzen, R. Creating groups with similar expected behavioural response in randomized controlled trials: A fuzzy cognitive map approach. BMC Med. Res. Methodol. 2014, 14, 130. [Google Scholar] [CrossRef]
- Pérez-Teruel, K.; Leyva-Vázquez, M.; Estrada-Sentí, V. Mental models consensus process using fuzzy cognitive maps and computing with words. Ing. Univ. 2015, 19, 173–188. [Google Scholar]
- Azizullah, A.; Khattak, M.N.K.; Richter, P.; Häder, D.P. Water pollution in Pakistan and its impact on public health—A review. Environ. Int. 2011, 37, 479–497. [Google Scholar] [CrossRef]
- Dakey, S.; Joshi, S.; Sukhwani, V.; Deshkar, S. A community-based approach to mainstream human-nature interactions into coastal risk governance: A case of Katrenikona, India. Geogr. Pannonica 2022, 26, 65–78. [Google Scholar] [CrossRef]
- Carvalho, J.P.; Tome, J.A.B. Rule based fuzzy cognitive maps-expressing time in qualitative system dynamics. In Proceedings of the 10th IEEE International Conference on Fuzzy Systems (Cat No 01CH37297), Melbourne, VIC, Australia, 2–5 December 2001. [Google Scholar]
- Stojanovic, T.; Mcnae, H.M.; Tett, P.; Potts, T.W.; Reis, J.; Smith, H.D. The “social” aspect of social-ecological systems: A critique of analytical frameworks and findings from a multisite study of coastal sustainability. Ecol. Soc. 2016, 21, 15. [Google Scholar] [CrossRef]
- Papageorgiou, E.; Kontogianni, A. Using fuzzy cognitive mapping in environmental decision making and management: A methodological primer and an application. Int. Perspect. Glob. Environ. Chang. 2012, 427–450. [Google Scholar] [CrossRef]
- Aminpour, P.; Gray, S.A.; Jetter, A.J.; Introne, J.E.; Singer, A.; Arlinghaus, R. Wisdom of stakeholder crowds in complex social-ecological systems. Nat. Sustain. 2020, 3, 191–199. [Google Scholar] [CrossRef]
- Adger, W.N.; Hughes, T.P.; Folke, C.; Carpenter, S.R.; Rockstrom, J. Social-ecological resilience to coastal disasters. Science 2005, 309, 1036–1039. [Google Scholar] [CrossRef]
- Marshall, N.R. Signature of Recent Sediment Accumulating in Prince William Sound, Alaska: A Record of Storms, Earthquakes, and Seasonal Inputs; William & Mary: Williamsburg, VA, USA, 2015. [Google Scholar]
- Arkema, K.K.; Griffin, R.; Maldonado, S.; Silver, J.; Suckale, J.; Guerry, A.D. Linking social, ecological, and physical; science to advance natural and nature-based protection for coastal communities. Ann. N. Y. Acad. Sci. 2017, 1399, 5–26. [Google Scholar] [CrossRef]
- Li, Q.; Fan, W.; Huang, M.; Jin, H.; Zhang, J.; Ma, J. Machine Learning-Based Prediction of Dynamic Responses of a Tower Crane under Strong Coastal Winds. J. Mar. Sci. Eng. 2023, 11, 803. [Google Scholar] [CrossRef]
- Li, Q.; Jia, H.; Qiu, Q.; Lu, Y.; Zhang, J.; Mao, J.; Fan, W.; Huang, M. Typhoon-Induced Fragility Analysis of Transmission Tower in Ningbo Area Considering the Effect of Long-Term Corrosion. Appl. Sci. 2022, 12, 4774. [Google Scholar] [CrossRef]
- Farahani, S.; Behnam, B.; Tahershamsi, A. Macrozonation of seismic transient and permanent ground deformation of Iran. Nat. Hazards Earth Syst. Sci. 2020, 20, 2889–2903. [Google Scholar] [CrossRef]
- Karnaen, M.; Suriamihardja, D.A.; Maulana, A.; Jaya, A. Earthquake Macro-zonation Based Peak Ground Acceleration, Modified Mercalli Intensity, And Type of Rocks around Matano Fault. Int. J. Phys. Conf. Ser. 2018, 979, 012050. [Google Scholar] [CrossRef]
- Douvere, F. The importance of marine spatial planning in advancing ecosystem-based sea use management. Mar. Policy 2008, 32, 762–771. [Google Scholar] [CrossRef]
- Jessin, J.; Heinzlef, C.; Long, N.; Serre, D. A Systematic review of UAVs for Island coastal Environment and Risk Monitoring: Towards a Resilience Assessment. Drones 2023, 7, 206. [Google Scholar] [CrossRef]
- Klein, R.J.; Nicholls, R.J.; Thomalla, F. Resilience to natural hazards: How useful is this concept? Environ. Hazards 2010, 9, 249–265. [Google Scholar] [CrossRef]
- Gill, D.A.; Mascia, M.B.; Ahmadia, G.N.; Glew, L.; Lester, S.E.; Barnes, M.; White, A.T. Capacity shortfalls hinder the performance of marine protected areas globally. Nature 2017, 543, 665–669. [Google Scholar] [CrossRef]
- Berkes, F.; Colding, J.; Folke, C. (Eds.) Navigating Social-Ecological Systems: Building Resilience for Complexity and Change; Cambridge University Press: Cambridge, UK, 2003. [Google Scholar]
- Cinner, J.E.; McClanahan, T.R.; MacNeil, M.A.; Graham, N.A.; Daw, T.M.; Mukminin, A.; Barnes, M.L. Comanagement of coral reef social-ecological systems. Proc. Natl. Acad. Sci. USA 2012, 109, 5219–5222. [Google Scholar] [CrossRef]
- Biggs, R.; Schlüter, M.; Biggs, D.; Bohensky, E.L.; BurnSilver, S.; Cundill, G.; Dakos, V.; Daw, T.M.; Evans, L.S.; Kotschy, K.; et al. Toward principles for enhancing the resilience of ecosystem services. Annu. Rev. Environ. Resour. 2012, 37, 48. [Google Scholar] [CrossRef]
- Ostrom, E. A general framework for analyzing sustainability of social-ecological systems. Science 2009, 325, 22. [Google Scholar] [CrossRef]
- Berkes, F. Evolution of Co-Management: Role of Knowledge Generation, Bridging Organizations and Social Learning. J. Environ. Manag. 2009, 90, 1692–1702. [Google Scholar] [CrossRef]
- Binder, C.R.; Hinkel, J.; Bots, P.W.; Pahl-Wostl, C. Comparison of frameworks for analyzing social-ecological systems. Ecol. Soc. 2013, 18, 4. [Google Scholar] [CrossRef]
- Bodin, Ö.; Crona, B.I. The Role of Social Networks in Natural Resource Governance: What Relational Patterns Make a Difference? Glob. Environ. Chang. 2006, 16, 308–317. [Google Scholar] [CrossRef]
- Roy, B. The Outranking Approach and the Foundations of ELECTRE Methods. Theory Decis. 1991, 31, 49–73. [Google Scholar] [CrossRef]
- Boardman, A.E.; Greenberg, D.H.; Vining, A.R.; Weimer, D.L. Cost-Benefit Analysis: Concepts and Practice; Cambridge University Press: Cambridge, UK, 2018. [Google Scholar]
- Jensen, F.V.; Nielsen, T.D. Bayesian Networks and Decision Graphs; Springer Science & Business Media: Berlin/Heidelberg, Germany, 2007. [Google Scholar]
- Saaty, T.L. The Analytic Hierarchy ProcessTM; McGraw-Hill: New York, NY, USA, 1980. [Google Scholar]
- Breiman, L.; Friedman, J.; Olshen, R.; Stone, C. Classification and Regression Trees; CRC Press: Boca Raton, FL, USA, 1984. [Google Scholar]
- Lempert, R.J.; Popper, S.W.; Bankes, S.C. Shaping the Next One Hundred Years: New Methods for Quantitative, Long-Term Policy Analysis; RAND: Santa Monica, CA, USA, 2003. [Google Scholar]
- Roy, K.; Sasada, K.; Kohno, E. Salinity status of the 2011 Tohoku-oki tsunami affected agricultural lands in northeast Japan. Int. Soil Water Conserv. Res. 2014, 2, 40–50. [Google Scholar] [CrossRef]
- Cantre, C.G.; Pulhin, J.M.; Peras, R.J.J.; Tapia, M. Coastal communities and mangrove forest in the face of a changing climate: The case of Bacacay, Albay, Philippines. In Proceedings of the International Conference on Forestry Education and Research for the Asia Pacific Region, Laguna, Philippines, 23–25 November 2010; p. 46. [Google Scholar]
- Duarte, C.M.; Agusti, S.; Barbier, E.; Britten, G.L.; Castilla, J.C.; Gattuso, J.P. Rebuilding marine life. Nature 2020, 580, 39–51. [Google Scholar] [CrossRef]
- Deshkar, S.; Hayashia, Y.; Mori, Y. An alternative approach for planning the resilient cities in developing countries. Int. J. Urban Sci. 2011, 15, 1–14. [Google Scholar] [CrossRef]
- Stylios, C.D.; Groumpos, P.P. Modeling complex systems using fuzzy cognitive maps. IEEE Trans. Syst. Man Cybern.-Part A Syst. Hum. 2004, 34, 155–171. [Google Scholar] [CrossRef]
- Özesmi, U.; Özesmi, S.L. Ecological models based on people’s knowledge: A multi-step fuzzy cognitive mapping approach. Ecol. Model. 2004, 176, 43–64. [Google Scholar] [CrossRef]
- Hobbs, B.F.; Ludsin, S.A.; Knight, R.L.; Ryan, P.A.; Biberhofer, J.; Ciborowski, J.J. Fuzzy cognitive mapping as a tool to define management objectives for complex ecosystems. Ecol. Appl. 2002, 12, 1548–1565. [Google Scholar] [CrossRef]
- Yuan, K.; Liu, J.; Yang, S.; Wu, K.; Shen, F. Time series forecasting based on kernel mapping and high-order fuzzy cognitive maps. Knowl.-Based Syst. 2020, 206, 106359. [Google Scholar] [CrossRef]
- Goswami, R.; Roy, K.; Dutta, S.; Ray, K.; Sarkar, S.; Brahmachari, K. Multi-faceted impact and outcome of COVID-19 on smallholder agricultural systems: Integrating qualitative research and fuzzy cognitive mapping to explore resilient strategies. Agric. Syst. 2021, 189, 103051. [Google Scholar] [CrossRef]
- Folke, C. Traditional knowledge in social-ecological systems. Ecol. Soc. 2004, 9, 7. [Google Scholar] [CrossRef]
- Schlüter, M.; Müller, B.; Frank, K. The potential of models and modeling for social-ecological systems research. Ecol. Soc. 2019, 24, 31. [Google Scholar] [CrossRef]
- Felix, G.; Nápoles, G.; Falcon, R.; Froelich, W.; Vanhoof, K.; Bello, R. A review on methods and software for fuzzy cognitive maps. Artif. Intell. Rev. 2019, 52, 1707–1737. [Google Scholar] [CrossRef]
- Poczeta, K.; Papageorgiou, E.I.; Gerogiannis, V.C. Fuzzy cognitive maps optimization for decision making and prediction. Mathematics 2020, 8, 2059. [Google Scholar] [CrossRef]
- Gray, S.; Cox, L. Mentalmodeler. 2015. Available online: http://www.mentalmodeler.com (accessed on 11 May 2022).
- Papageorgiou, K.; Singh, P.K.; Papageorgiou, E.; Chudasama, H.; Bochtis, D.; Stamoulis, G. Fuzzy cognitive map-based sustainable socio-economic development planning for rural communities. Sustainability 2019, 12, 305. [Google Scholar] [CrossRef]
- Kok, K. The potential of Fuzzy Cognitive Maps for semi-quantitative scenario development, with an example from Brazil. Glob. Environ. Chang. 2009, 19, 122–155. [Google Scholar] [CrossRef]
- Henly-Shepard, S.; Gray, S.A.; Cox, L.J. The use of participatory modeling to promote social learning and facilitate community disaster planning. Environ. Sci. Policy 2015, 45, 109–131. [Google Scholar] [CrossRef]
- Biggs, N.; Lloyd, E.K.; Wilson, R.J. Graph Theory 1736–1936; Oxford University Press: Oxford, UK, 1986; pp. 1736–1936. [Google Scholar]
- Konti, A.; Damigos, D. Exploring strengths and weaknesses of bioethanol production from bio-waste in Greece using Fuzzy Cognitive Maps. Energy Policy 2018, 112, 4–11. [Google Scholar] [CrossRef]
- Alipour, M.; Hafezi, R.; Papageorgiou, E.; Hafezi, M.; Alipour, M. Characteristics and scenarios of solar energy development in Iran: Fuzzy cognitive map-based approach. Renew. Sustain. Energy Rev. 2019, 116, 109410. [Google Scholar] [CrossRef]
- Liu, J.; Dietz, T.; Carpenter, S.R.; Alberti, M.; Folke, C.; Moran, E.; Pell, A.N.; Deadman, P.; Kratz, T.; Lubchenco, J.; et al. Complexity of coupled human and natural systems. Science 2007, 317, 1513–1519. [Google Scholar] [CrossRef] [PubMed]
- Feng, G.; Lu, W.; Pedrycz, W.; Yang, J.; Liu, X. The learning of fuzzy cognitive maps with noisy data: A rapid and robust learning method with maximum entropy. IEEE Trans. Cybern. 2019, 51, 2080–2092. [Google Scholar] [CrossRef] [PubMed]
- Müller, B.; Bohn, F.; Dreßler, G.; Groeneveld, J.; Klassert, C.; Martin, R.; Weise, H.; Schulze, J.; Weise, H.; Schwarz, N. Describing human decisions in agent-based models—ODD+ D, an extension of the ODD protocol. Environ. Model. Softw. 2013, 48, 37–48. [Google Scholar] [CrossRef]
- Gray, S.; Sterling, E.J.; Aminpour, P.; Goralnik, L.; Singer, A.; Wei, C.; Akabas, S.; Jordan, R.C.; Giabbanelli, P.J.; Hodbod, J.; et al. Assessing (social-ecological) systems thinking by evaluating cognitive maps. Sustainability 2019, 11, 5753. [Google Scholar] [CrossRef]
- Voinov, A.; Bousquet, F. Modelling with stakeholders. Environ. Model. Softw. 2010, 25, 1268–1281. [Google Scholar] [CrossRef]
- Janssen, M.A.; Ostrom, E. Empirically based, agent-based models. Ecol. Soc. 2006, 11, 37. [Google Scholar] [CrossRef]
- Dakey, S.; Deshkar, S. Investigating Socio-Ecological Systems for Gianing Resilience in Rural Settlements. In Proceedings of the World Congress on Disaster Management, Mumbai, India, 24–27 November 2021; Macmillan: New York, NU, USA, 2021; Volume 2, pp. 307–320. [Google Scholar]
- Hoque, M.M.; Hena, A.; Osumanu, M.K.; Hanafi, H.A.M.; Rafiqul, I.; Md, A.; Masum, B. Can mangroves help combat sea level rise through sediment accretion and accumulation? Malays. J. Sci. 2015, 34, 78–86. [Google Scholar]
- Spalding, M.; Mcivor, A.; Tonneijck, F.; Tol, S.; Eijk, P.V. Mangroves for Coastal Defense Guidelines for Coastal Managers & Policy Makers; Wetlands International and the Nature Conservancy: Ede, The Netherlands, 2014. [Google Scholar]
- Taylor, M.; Krüger, N. Changes in salinity of a clay soil after a short-term salt water flood event. Geoderma Reg. 2019, 19, 239. [Google Scholar] [CrossRef]
- Ghawana, T.; Pashova, L.; Zlatanova, S. Geospatial Data Utilisation in National Disaster Management Frameworks and the Priorities of Multilateral Disaster Management Frameworks: Case Studies of India and Bulgaria. ISPRS Int. J. Geo-Inf. 2021, 10, 610. [Google Scholar] [CrossRef]
- Ministry of Agriculture. National Policy for Farmers, 2007; Ministry of Agriculture: New Delhi, India, 2007. [Google Scholar]
- Ministry of Environment and Forests. National Environment Policy 2006; Ministry of Environment and Forests: Delhi, India, 2006. [Google Scholar]
- NDMA. National Disaster Management Plan 2019; NDMA: New Delhi, India, 2019. [Google Scholar]
- Bayer, S.; Sterman, J. Business dynamics: Systems thinking and modeling for a complex world. Interfaces 2004, 34, 324–327. [Google Scholar]
- Eppinga, M.B.; Boer, H.J.D.; Reader, M.O.; Anderies, J.M.; Santos, M.J. Environmental change and ecosystem functioning drive transitions in social-ecological systems: A stylized modelling approach. Ecol. Econ. 2023, 211, 107861. [Google Scholar] [CrossRef]
- Parker-Shames, P.; Bodwitch, H.; Brashares, J.; Butsic, V. Where money grows on trees: A socio-ecological assessment of land use change in an agricultural frontier. Landsc. Urban Plan. 2023, 237, 104783. [Google Scholar] [CrossRef]
- Jahel, C.; Bourgeois, R.; Bourgoin, J.; Lattre-Gasquet, D.; Delay, E.; Dumas, P.; Le Page, C.; Piraux, M.; Prudhomme, R. The future of social-ecological systems at the crossroads of quantitative and qualitative methods. Technol. Forecast. Soc. Chang. 2023, 193, 122624. [Google Scholar] [CrossRef]
- Papageorgiou, E.; Stylios, C.; Groumpos, P. Fuzzy cognitive map learning based on non-linear Hebbian rule. In Proceedings of the AI 2003: Advances in Artificial Intelligence, 16th Australian Conference on AI, Perth, Australia, 3–5 December 2003; Springer: Berlin/Heidelberg, Germany, 2003; Volume 16, pp. 256–268. [Google Scholar]
Disclaimer/Publisher’s Note: The statements, opinions and data contained in all publications are solely those of the individual author(s) and contributor(s) and not of MDPI and/or the editor(s). MDPI and/or the editor(s) disclaim responsibility for any injury to people or property resulting from any ideas, methods, instructions or products referred to in the content. |
© 2023 by the authors. Licensee MDPI, Basel, Switzerland. This article is an open access article distributed under the terms and conditions of the Creative Commons Attribution (CC BY) license (https://creativecommons.org/licenses/by/4.0/).