
Re-Thinking Ecological Flow in Romania: A Sustainable Approach to Water Management for a Healthier Environment


Abstract
1. Introduction
2. Methodology
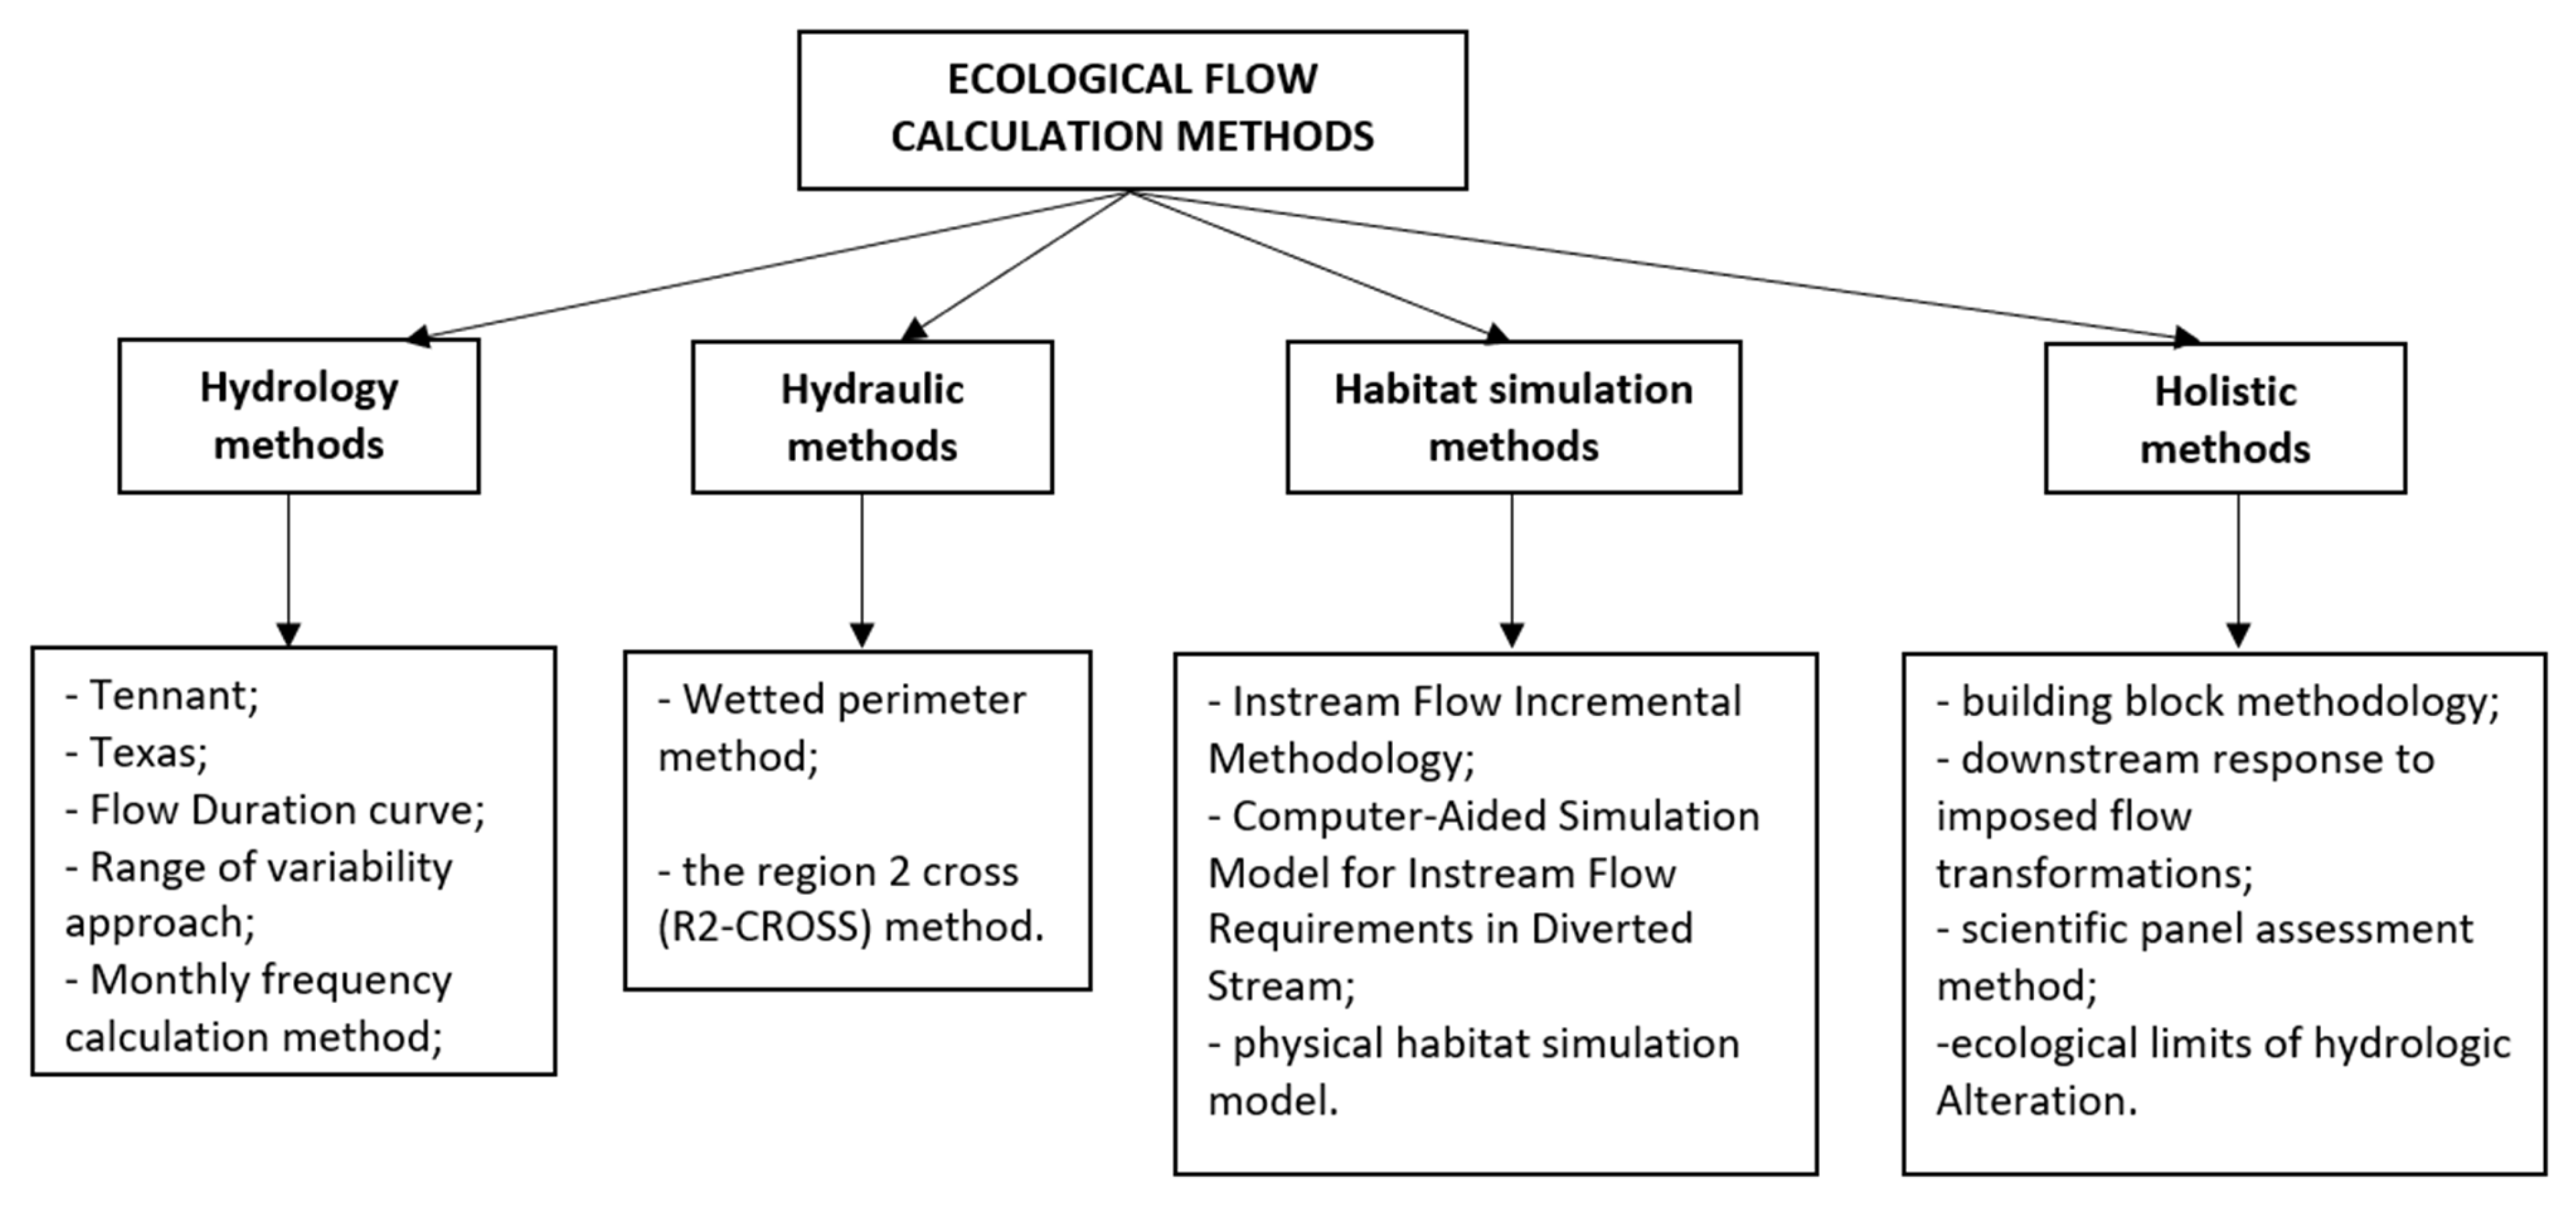
2.1. The Existing Methodology
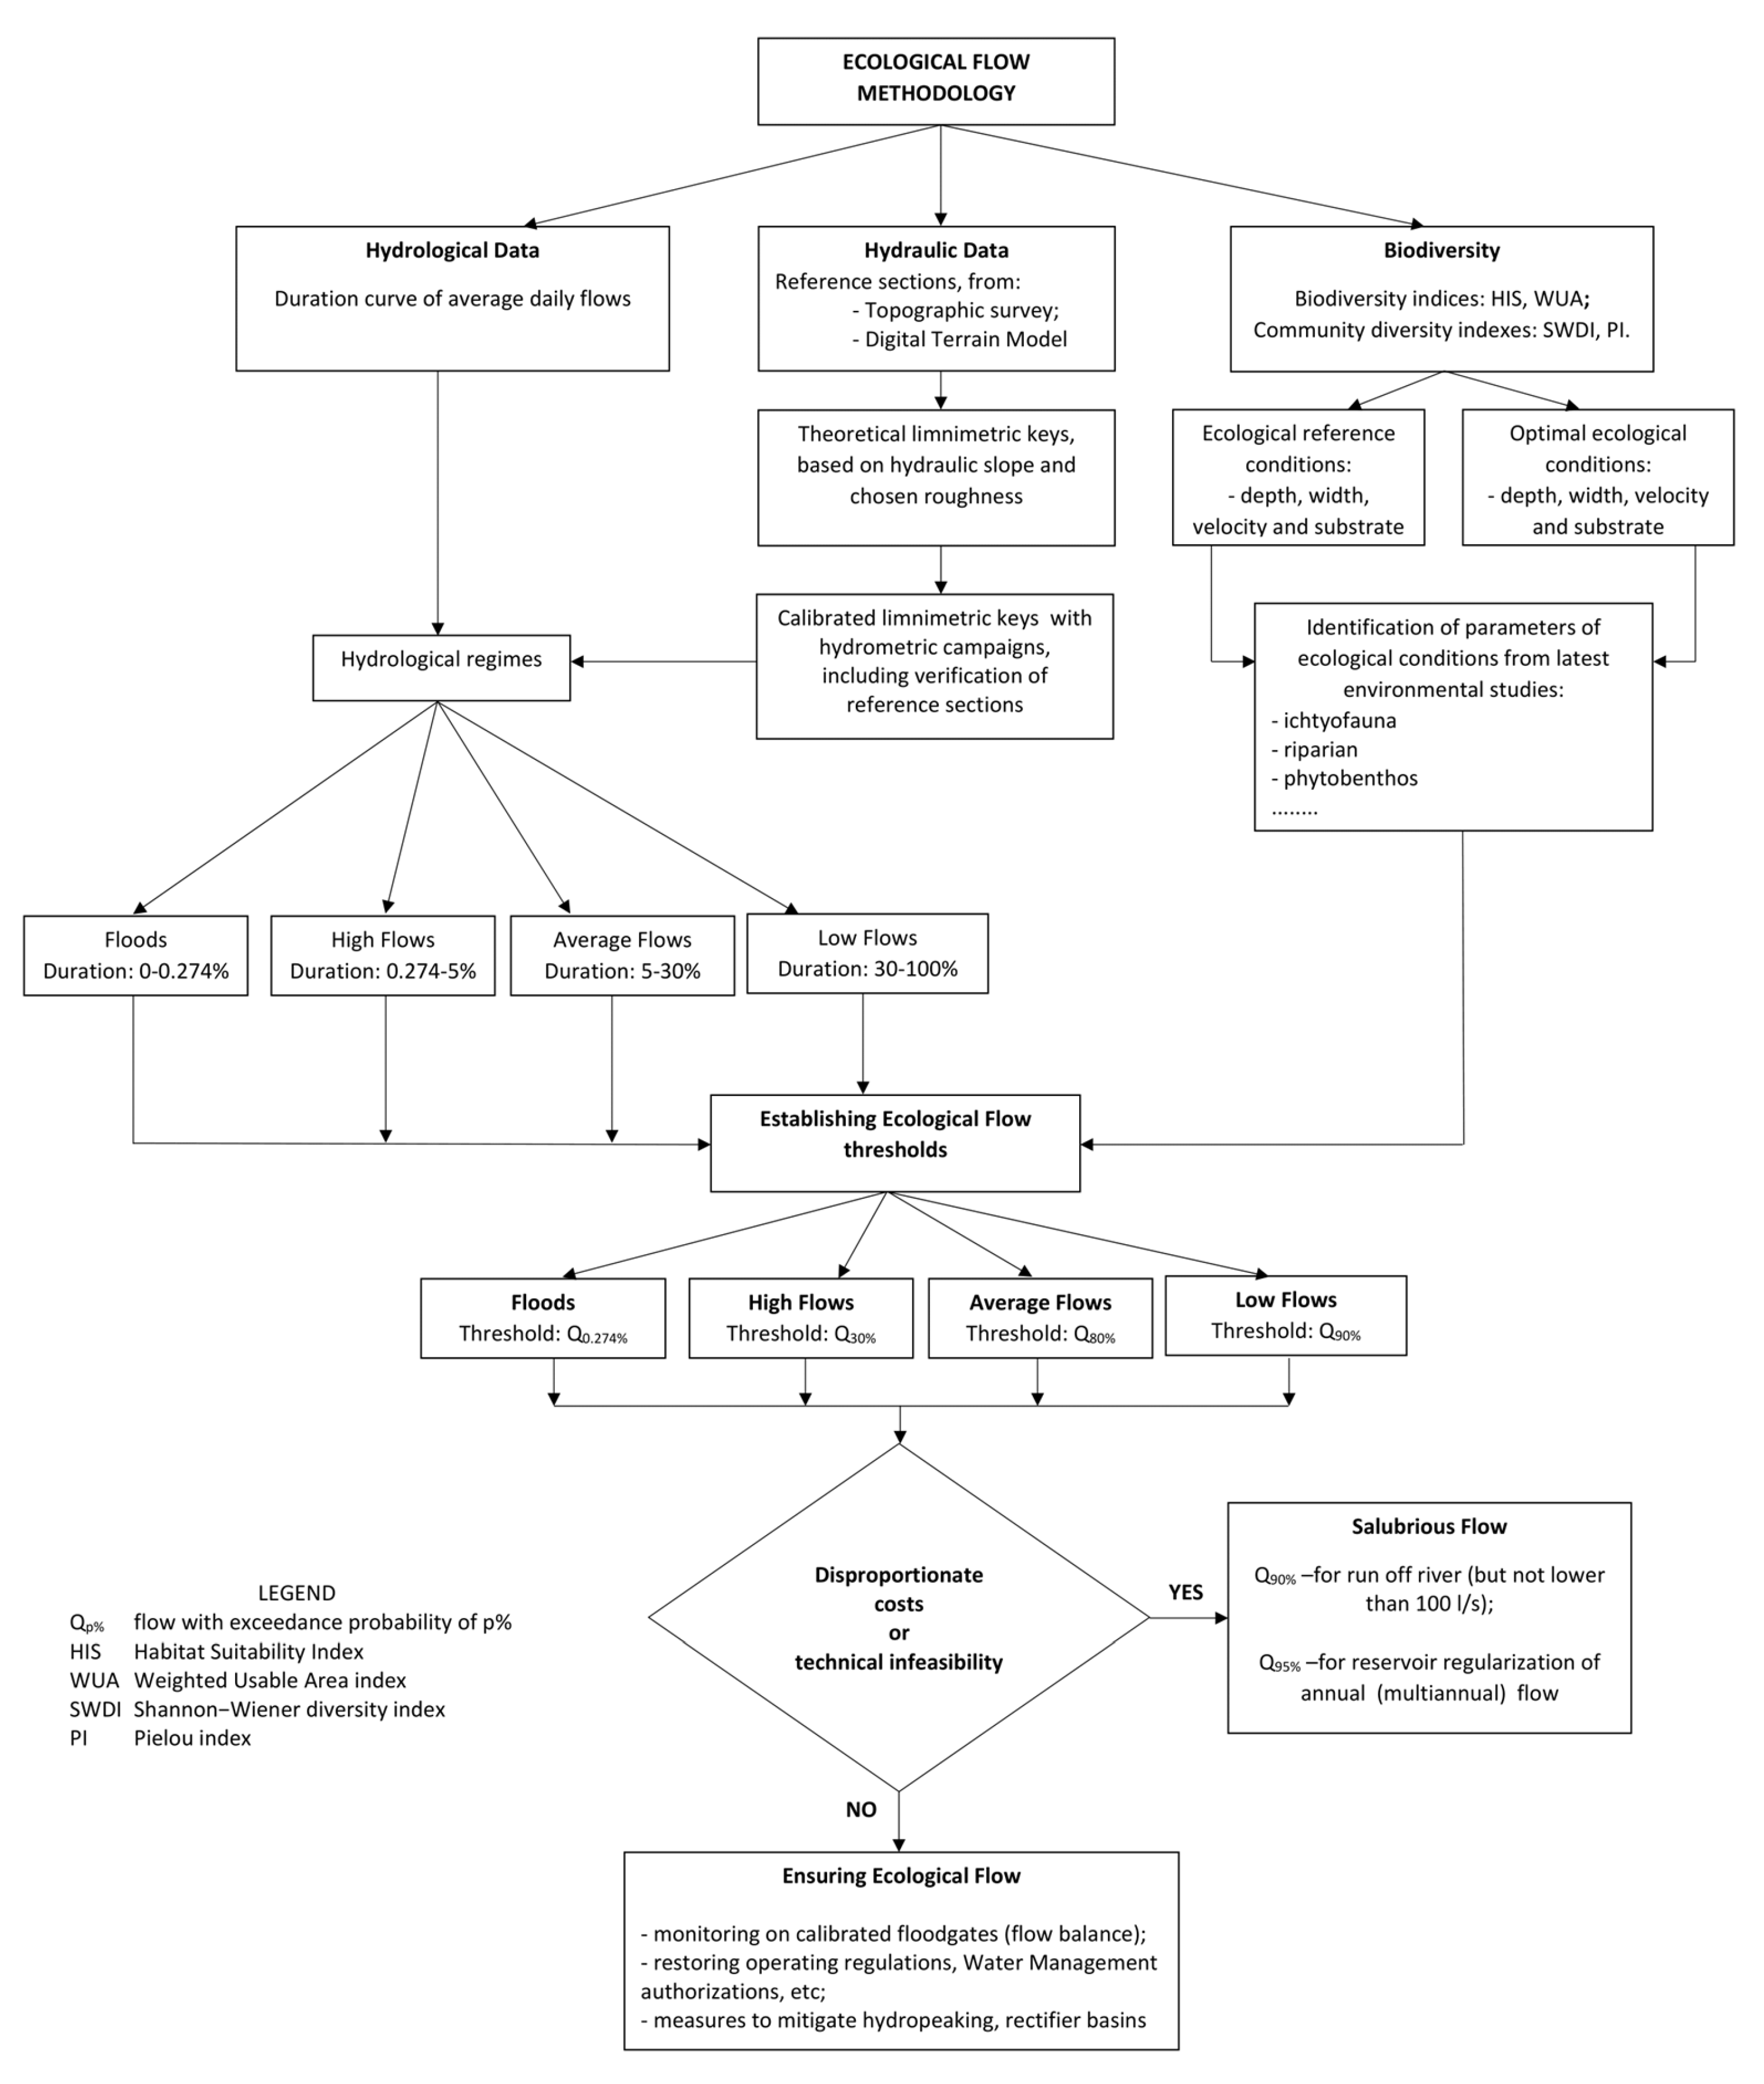
2.2. The Proposed Methodology
3. Case Study
4. Results
5. Discussions
6. Conclusions
- (1)
- The proposed methodology took a holistic approach, and the calculation methods presented were simple, concise, and unambiguous.
- (2)
- From the point of view of the hydrological component, the methodology respected and ensured the natural variability of the flow, characterized by four hydrological regimes: floods, high waters, medium waters, and low waters. The methodology used the duration curve of average daily flows, which provided a higher degree of confidence than the duration curve of average monthly flows regarding the hydrological regimes of the rivers.
- (3)
- The biodiversity component was of particular importance in the development and application of the methodology, which took into account both the potential biodiversity and the capacity to sustain it, as well as the existing environmental studies regularly conducted for the majority of rivers in Romania, clearly highlighting the real biodiversity situation in the rivers and the measures necessary to support it.
- (4)
- The application and monitoring of ecological flows were carried out in real time according to the hydrological regime, which was based on the limnimetric key calibrated via the hydrometric measurement campaigns of the hydrotechnical construction evacuators.
- (5)
- The opportunity to apply ecological flow is provided following the analysis of costs, thus taking into account the recommendations of the European Guidance Document No. 31. If the analysis results in disproportionate costs (thus supporting the maintenance of the environmental flow), the methodology proposed in this article provides for increasing the environmental flow from to (but no less than 100 L/s) for the run of river, and for the reservoir regularization of annual and multiannual flow, the environmental flow is still increased to . These increases are implemented once every 6 years with 1% of the multiyear average flow until the target values are reached.
- (6)
- Additional measures are required to reduce hydropeaking by creating rectifier basins or abandoning the exploitation of weightage. This is a measure specific to the hydropower sector.
Author Contributions
Funding
Institutional Review Board Statement
Informed Consent Statement
Data Availability Statement
Conflicts of Interest
Abbreviations
| HG (in Romanian) | Government decision |
| Qm | Multiannual average flow |
| Qp% | Flow with exceedance probability of p% |
| Qmam95– | Minimum annual average monthly flow with 95% exceedance probability |
| Qday | Average daily flow |
| Qsal | Enviromental flow (salubrious flow) |
| Qec | Ecological flow |
| INHGA | National Institute of Water Management |
| HIS | Habitat suitability index |
| WUA | Weighted usable area index |
| SWDI | Shannon–Wiener diversity index |
| PI | Pielou index |
| FBH | Watershed area |
| Hm | Average altitude |
| FDC | Flow duration curve |
| SHPP | Small hydro power plant |
| L/s | Liters per second |
| m3/s | Cubic meters per second |
References
- CIS. Guidance Document No. 31—Ecological Flows in the Implementation of the Water Framework Directive; Technical Report 086; European Union: Luxembourg, 2015; 106p. [Google Scholar]
- Gonzalez, J.M.; Tomlinson, J.E.; Martínez Ceseña, E.A.; Basheer, M.; Obuobie, E.; Padi, P.T.; Addo, S.; Baisie, R.; Etichia, M.; Hurford, A.; et al. Designing diversified renewable energy systems to balance multisector performance. Nat. Sustain. 2023, 6, 415–427. [Google Scholar] [CrossRef]
- Water Framework Directive. Available online: https://eur−lex.europa.eu/resource.html?uri=cellar:5c835afb−2ec6−4577−bdf8−756d3d694eeb.0004.02/DOC_1&format=PDF (accessed on 16 March 2023).
- Mezger, G.; De Stefano, L.; González del Tánago, M. Assessing the Establishment and Implementation of Environmental Flows in Spain. Environ. Manag. 2019, 64, 721–735. [Google Scholar] [CrossRef]
- Ramos, V.; Formigo, N.; Maia, R. Environmental flows under the WFD implementation. Water Resour. Manag. 2018, 32, 5115–5149. [Google Scholar] [CrossRef]
- Książek, L.; Woś, A.; Florek, J.; Wyrębek, M.; Młyński, D.; Wałęga, A. Combined use of the hydraulic and hydrological methods to calculate the environmental flow: Wisloka river, Poland: Case study. Environ. Monit. Assess. 2019, 191, 254. [Google Scholar] [CrossRef] [PubMed]
- Pulido−Calvo, I.; Gutiérrez−Estrada, J.C.; Sanz−Fernández, V. Drought and Ecological Flows in the Lower Guadiana River Basin (Southwest Iberian Peninsula). Water 2020, 12, 677. [Google Scholar] [CrossRef]
- Ibáñez, C.; Caiola, N.; Belmar, O. Environmental Flows in the Lower Ebro River and Delta: Current Status and Guidelines for a Holistic Approach. Water 2020, 12, 2670. [Google Scholar] [CrossRef]
- De Strasser, L. Nexus Assessment of the Drina River Basin Concept Note of the Phase II Nexus Assessment Report, Global Water Partnership. Ghana. 2021. Available online: https://policycommons.net/artifacts/2181825/nexus-assessment-of-the-drina-river-basin-concept-note-of-the-phase-ii-nexus-assessment-report/2937802/ (accessed on 16 March 2023).
- Papadaki, C.; Dimitriou, E. River Flow Alterations Caused by Intense Anthropogenic Uses and Future Climate Variability Implications in the Balkans. Hydrology 2021, 8, 7. [Google Scholar] [CrossRef]
- Jekabsone, J.; Abersons, K.; Kolcova, T.; Tirums, M. First steps in the ecological flow determining for Latvian rivers. Hydrol. Res. 2022, 53, 1063–1074. [Google Scholar] [CrossRef]
- Nádudvari, Á.; Czajka, A.; Wyżga, B.; Zygmunt, M.; Wdowikowski, M. Patterns of Recent Changes in Channel Morphology and Flows in the Upper and Middle Odra River. Water 2023, 15, 370. [Google Scholar] [CrossRef]
- Operacz, A.; Wałęga, A.; Cupak, A.; Tomaszewska, B. The comparison of environmental flow assessment—The barrier for investment in Poland or river protection? J. Clean. Prod. 2018, 193, 575–592. [Google Scholar] [CrossRef]
- H.G. 148/2020; The Method of Determining and Calculating the Ecological Flow. The Government of Romania: Bucharest, Romania, 2020.
- Stanca, S.C.; Dimache, A.N.; Ilinca, C.; Anghel, C.G. Methodology for determining hydromorphological indicators for rivers with hydropower uses. IOP Conf. Ser. Earth Environ. Sci. 2023, 1136, 012032. [Google Scholar] [CrossRef]
- Merritt, D.M.; Scott, M.L.; Poff, N.L.; Auble, G.T.; Lytle, D.A. Theory, methods and tools for determining environmental flows for riparian vegetation: Riparian vegetation−flow response guilds. Freshw. Biol. 2010, 55, 206–225. [Google Scholar] [CrossRef]
- Poff, N.L.; Allan, J.D.; Bain, M.B.; Karr, J.R.; Richter, B.; Sparks, R.; Stromberg, J. The natural flow regime: A new paradigm for riverine conservation and restoration. BioScience 1997, 47, 769–784. [Google Scholar] [CrossRef]
- Richter, B.D.; Baumgartner, J.V.; Wigington, R.; Braun, D.P. How much water does a river need? Freshw. Biol. 1997, 37, 231–249. [Google Scholar] [CrossRef]
- Stanford, J.A.; Ward, J.V.; Liss, W.J.; Frissell, C.A.; Williams, R.N.; Lichatowich, J.A.; Coutant, C.C. A general protocol for restoration of regulated rivers. Regul. Rivers Res. Manag. 1996, 12, 391–413. [Google Scholar] [CrossRef]
- Wei, N.; Xie, J.; Lu, K.; He, S.; Gao, Y.; Yang, F. Dynamic Simulation of Ecological Flow Based on the Variable Interval Analysis Method. Sustainability 2022, 14, 7988. [Google Scholar] [CrossRef]
- Karakoyun, Y.; Dönmez, A.H.; Yumurtacı, Z. Comparison of environmental flow assessment methods with a case study on a runoff river–type hydropower plant using hydrological methods. Environ. Monit. Assess. 2018, 190, 722. [Google Scholar] [CrossRef] [PubMed]
- Arthington, A.H.; Pusey, B.J. Flow restoration and protection in Australian rivers. River Res. Appl. 2003, 19, 377–395. [Google Scholar] [CrossRef]
- Arthington, A.H. Environmental Flows. In Saving Rivers in the Third Millennium; University of California Press: Berkeley, CA, USA, 2012; p. 406. [Google Scholar]
- Lytle, D.; Poff, N. Adaptation to natural flow regimes. Trends Ecol. Evol. 2004, 9, 94–100. [Google Scholar] [CrossRef]
- Richter, B.D.; Baumgartner, J.V.; Braun, D.P.; Powell, J. A spatial assessment of hydrologic alteration within a river network. Regul. Rivers Res. Manag. 1998, 14, 329–340. [Google Scholar] [CrossRef]
- Schäfer, R.B.; Bundschuh, M. Ecotoxicology. In Riverine Ecosystem Management; Aquatic Ecology Series; Schmutz, S., Sendzimir, J., Eds.; Springer: Cham, Swizerland, 2018; Volume 8. [Google Scholar] [CrossRef]
- Marius, N.; Alexandra, D.; Marcel, T.; Attila, N.; Diana, C.; Gavril Marius, B.; Cornel, I. Guide to Good Practices Regarding the Planning and Implementation of Investments in the Microhydropower Sector; Asociaţia ”Grupul Milvus”: Bucharest, Romania, 2016; ISBN 978-973-0-23320-9. [Google Scholar]
- Xia, R.; Sun, H.; Chen, Y.; Wang, Q.; Chen, X.; Hu, Q.; Wang, J. Ecological Flow Response Analysis to a Typical Strong Hydrological Alteration River in China. Int. J. Environ. Res. Public Health 2023, 20, 2609. [Google Scholar] [CrossRef]
- Acreman, M.C.; Dunbar, M.J. Defining environmental river flow requirements—A review. Hydrol. Earth Syst. Sci. 2004, 8, 861–876. [Google Scholar] [CrossRef]
- Palmer, M.; Ruhi, A. Linkages between flow regime, biota, and ecosystem processes: Implications for river restoration. Science 2019, 365, eaaw2087. [Google Scholar] [CrossRef]
- Thomas, P. The Concept of Weighted Usable Area as Relative Suitability Index; IFIM Users Workshop: Fort Collins, CO, USA, 2003. [Google Scholar]
- Szałkiewicz, E.; Kałuża, T.; Grygoruk, M. Environmental Flows Assessment for Macroinvertebrates at the River Reach Scale in Different Degrees of Hydromorphological Alteration. Front. Environ. Sci. 2022, 10, 286. [Google Scholar] [CrossRef]
- Ochs, K.; Rivaes, R.P.; Ferreira, T.; Egger, G. Flow Management to Control Excessive Growth of Macrophytes—An Assessment Based on Habitat Suitability Modeling. Front. Plant Sci. 2018, 9, 356. [Google Scholar] [CrossRef]
- Štefunková, Z.; Macura, V.; Škrinár, A.; Majorošová, M.; Doláková, G.; Halaj, P.; Petrová, T. Evaluation of the Methodology to Assess the Influence of Hydraulic Characteristics on Habitat Quality. Water 2020, 12, 1131. [Google Scholar] [CrossRef]
- Muhammed, K.; Anandhi, A.; Chen, G. Comparing Methods for Estimating Habitat Suitability. Land 2022, 11, 1754. [Google Scholar] [CrossRef]
- Luo, Y.; Gong, Y. α Diversity of Desert Shrub Communities and Its Relationship with Climatic Factors in Xinjiang. Forests 2023, 14, 178. [Google Scholar] [CrossRef]
- Tian, Y.; Fu, G. Quantifying Plant Species α−Diversity Using Normalized Difference Vegetation Index and Climate Data in Alpine Grasslands. Remote Sens. 2022, 14, 5007. [Google Scholar] [CrossRef]
- Meng, X.; Fan, S.; Dong, L.; Li, K.; Li, X. Response of Understory Plant Diversity to Soil Physical and Chemical Properties in Urban Forests in Beijing, China. Forests 2023, 14, 571. [Google Scholar] [CrossRef]
- Amy, C.; Noël, G.; Hatt, S.; Uyttenbroeck, R.; Van de Meutter, F.; Genoud, D.; Francis, F. Flower Strips in Wheat Intercropping System: Effect on Pollinator Abundance and Diversity in Belgium. Insects 2018, 9, 114. [Google Scholar] [CrossRef]
- Diaconu, C.; Serban, P. Syntheses and Hydrological Regionalization; Technical Publishing House: Bucharest, Romania, 1994. [Google Scholar]
- Constantinescu, M.; Golstein, M.; Haram, V.; Solomon, S. Hydrology; Technical Publishing House: Bucharest, Romania, 1956. [Google Scholar]
- Teodorescu, I.; Filotti, A.; Chiriac, V.; Ceausescu, V.; Florescu, A. Water Management; Ceres Publishing House: Bucharest, Romania, 1973. [Google Scholar]
- Tatomir, A.; Zhou, D.; Gao, H.; Dimache, A.-N.; Iancu, I.; Sauter, M. Modelling of kinetic interface sensitive tracers reactive transport in 2D two-phase flow heterogeneous porous media. E3S Web Conf. 2019, 85, 07003. [Google Scholar] [CrossRef]
- Leopold, L.B.; Maddock, T., Jr. The Hydraulic Geometry of Stream Channels and Some Physiographic Implications; US Geological Survey Professional Paper; US Government Printing Office: Washington, DC, USA, 1953; Volume 252.
- Singh, V. Handbook of Hydraulic Geometry: Theories and Advances; Cambridge University Press: Cambridge, UK, 2022. [Google Scholar] [CrossRef]
- Singh, V.P.; Sivakumar, B.; Cui, H. Tsallis Entropy Theory for Modeling in Water Engineering: A Review. Entropy 2017, 19, 641. [Google Scholar] [CrossRef]
- The Romanian Water Classification Atlas, Part I—Morpho−Hydrographic Data on the Surface Hydrographic Network; Ministry of the Environment: Bucharest, Romania, 1992.
- Council Directive 92/43/EEC of 21 May 1992 on the Conservation of Natural Habitats and of Wild Fauna and Flora. Available online: https://eur−lex.europa.eu/legal−content/RO/TXT/PDF/?uri=CELEX:01992L0043−20130701&from=EN (accessed on 10 January 2023).
- O.U.G. 57/2007; The Regime of Natural Protected Areas, Conservation of Natural Habitats, Flora and Fauna. The Government of Romania: Bucharest, Romania, 2007.
- The IUCN Red List of Threatened Species. Available online: https://www.iucnredlist.org/ (accessed on 10 January 2023).
- LAW 13/1993; Conservation of Wild Life and Natural Habitats in Europe. The Government of Romania: Bucharest, Romania, 1993.
- Imecs, I.; Nagy, A.A. Monitoring of fish populations in the Uz, Bașca and Bârzăuta rivers in the area of microhydropower plants, Technical report, Harghita, Romania, 2022.
- Takács, P.; Ferincz, Á.; Imecs, I.; Kovács, B.; Nagy, A.A.; Ihász, K.; Vitál, Z.; Csoma, E. Increased spatial resolution of sampling in the Carpathian basin helps to understand the phylogeny of central European stream-dwelling gudgeons. BMC Zool. 2021, 6, 3. [Google Scholar] [CrossRef] [PubMed]
- Nagy, A.; Imecs, I.; Hegyeli, Z. A Maros Halfaunája a Gyergyói−Medencében—Az Utóbbi Évtizedekben Bekövetkezett Változások és Védelmi Javaslatok. 2011. Available online: https://www.researchgate.net/publication/283268040_A_Maros_halfaunaja_a_Gyergyoi-medenceben_-_az_utobbi_evtizedekben_bekovetkezett_valtozasok_es_vedelmi_javaslatok (accessed on 10 January 2023).
- Banarescu, P. Fauna of the Romanian People’s Republic. 13. Pisces—Osteichthyes: (Ganoid and Bony Fishes); Academy of the Romanian People’s Republic: Bucharest, Romania, 1964. [Google Scholar]
- O.U.G. 78/2017; The Amending and Supplementing the Water Law no. 107/1996. The Government of Romania: Bucharest, Romania, 2017.


| River | Watershed Area (FBH) | Average Altitude (Hm) | |
|---|---|---|---|
| (km2) | (m) | (m3/s) | |
| Viseu | 1555 | 1020 | 34.6 |
| Crisul Negru | 3750 | 351 | 30.3 |
| Mures | 27,056 | 618 | 186 |
| Capra | 79.4 | 1625 | 2.72 |
| Prigor | 141 | 729 | 1.71 |
| Badeni | 27.6 | 1438 | 0.455 |
| Ialomita | 6233 | 494 | 33.8 |
| River | Length (km) | Average Slope (‰) | Sinuosity Coefficient (−) | Average Altitude (m) | Watershed Area (km2) |
|---|---|---|---|---|---|
| Uz | 50 | 17 | 1.26 | 972 | 469 |
| Oreg | 6 | 29 | 1.3 | 1124 | 12 |
| Başca | 10 | 27 | 1.32 | 1123 | 25 |
| Copuria | 6 | 113 | 1.12 | 1001 | 10 |
| Bârzăuţa | 26 | 22 | 1.31 | 1091 | 156 |
| Apa Lina | 15 | 17 | 1.22 | 1030 | 48 |
| Flows from the Duration Curve of Average Daily Flows | |||
|---|---|---|---|
| 9.37 | 1.01 | 0.297 | 0.207 |
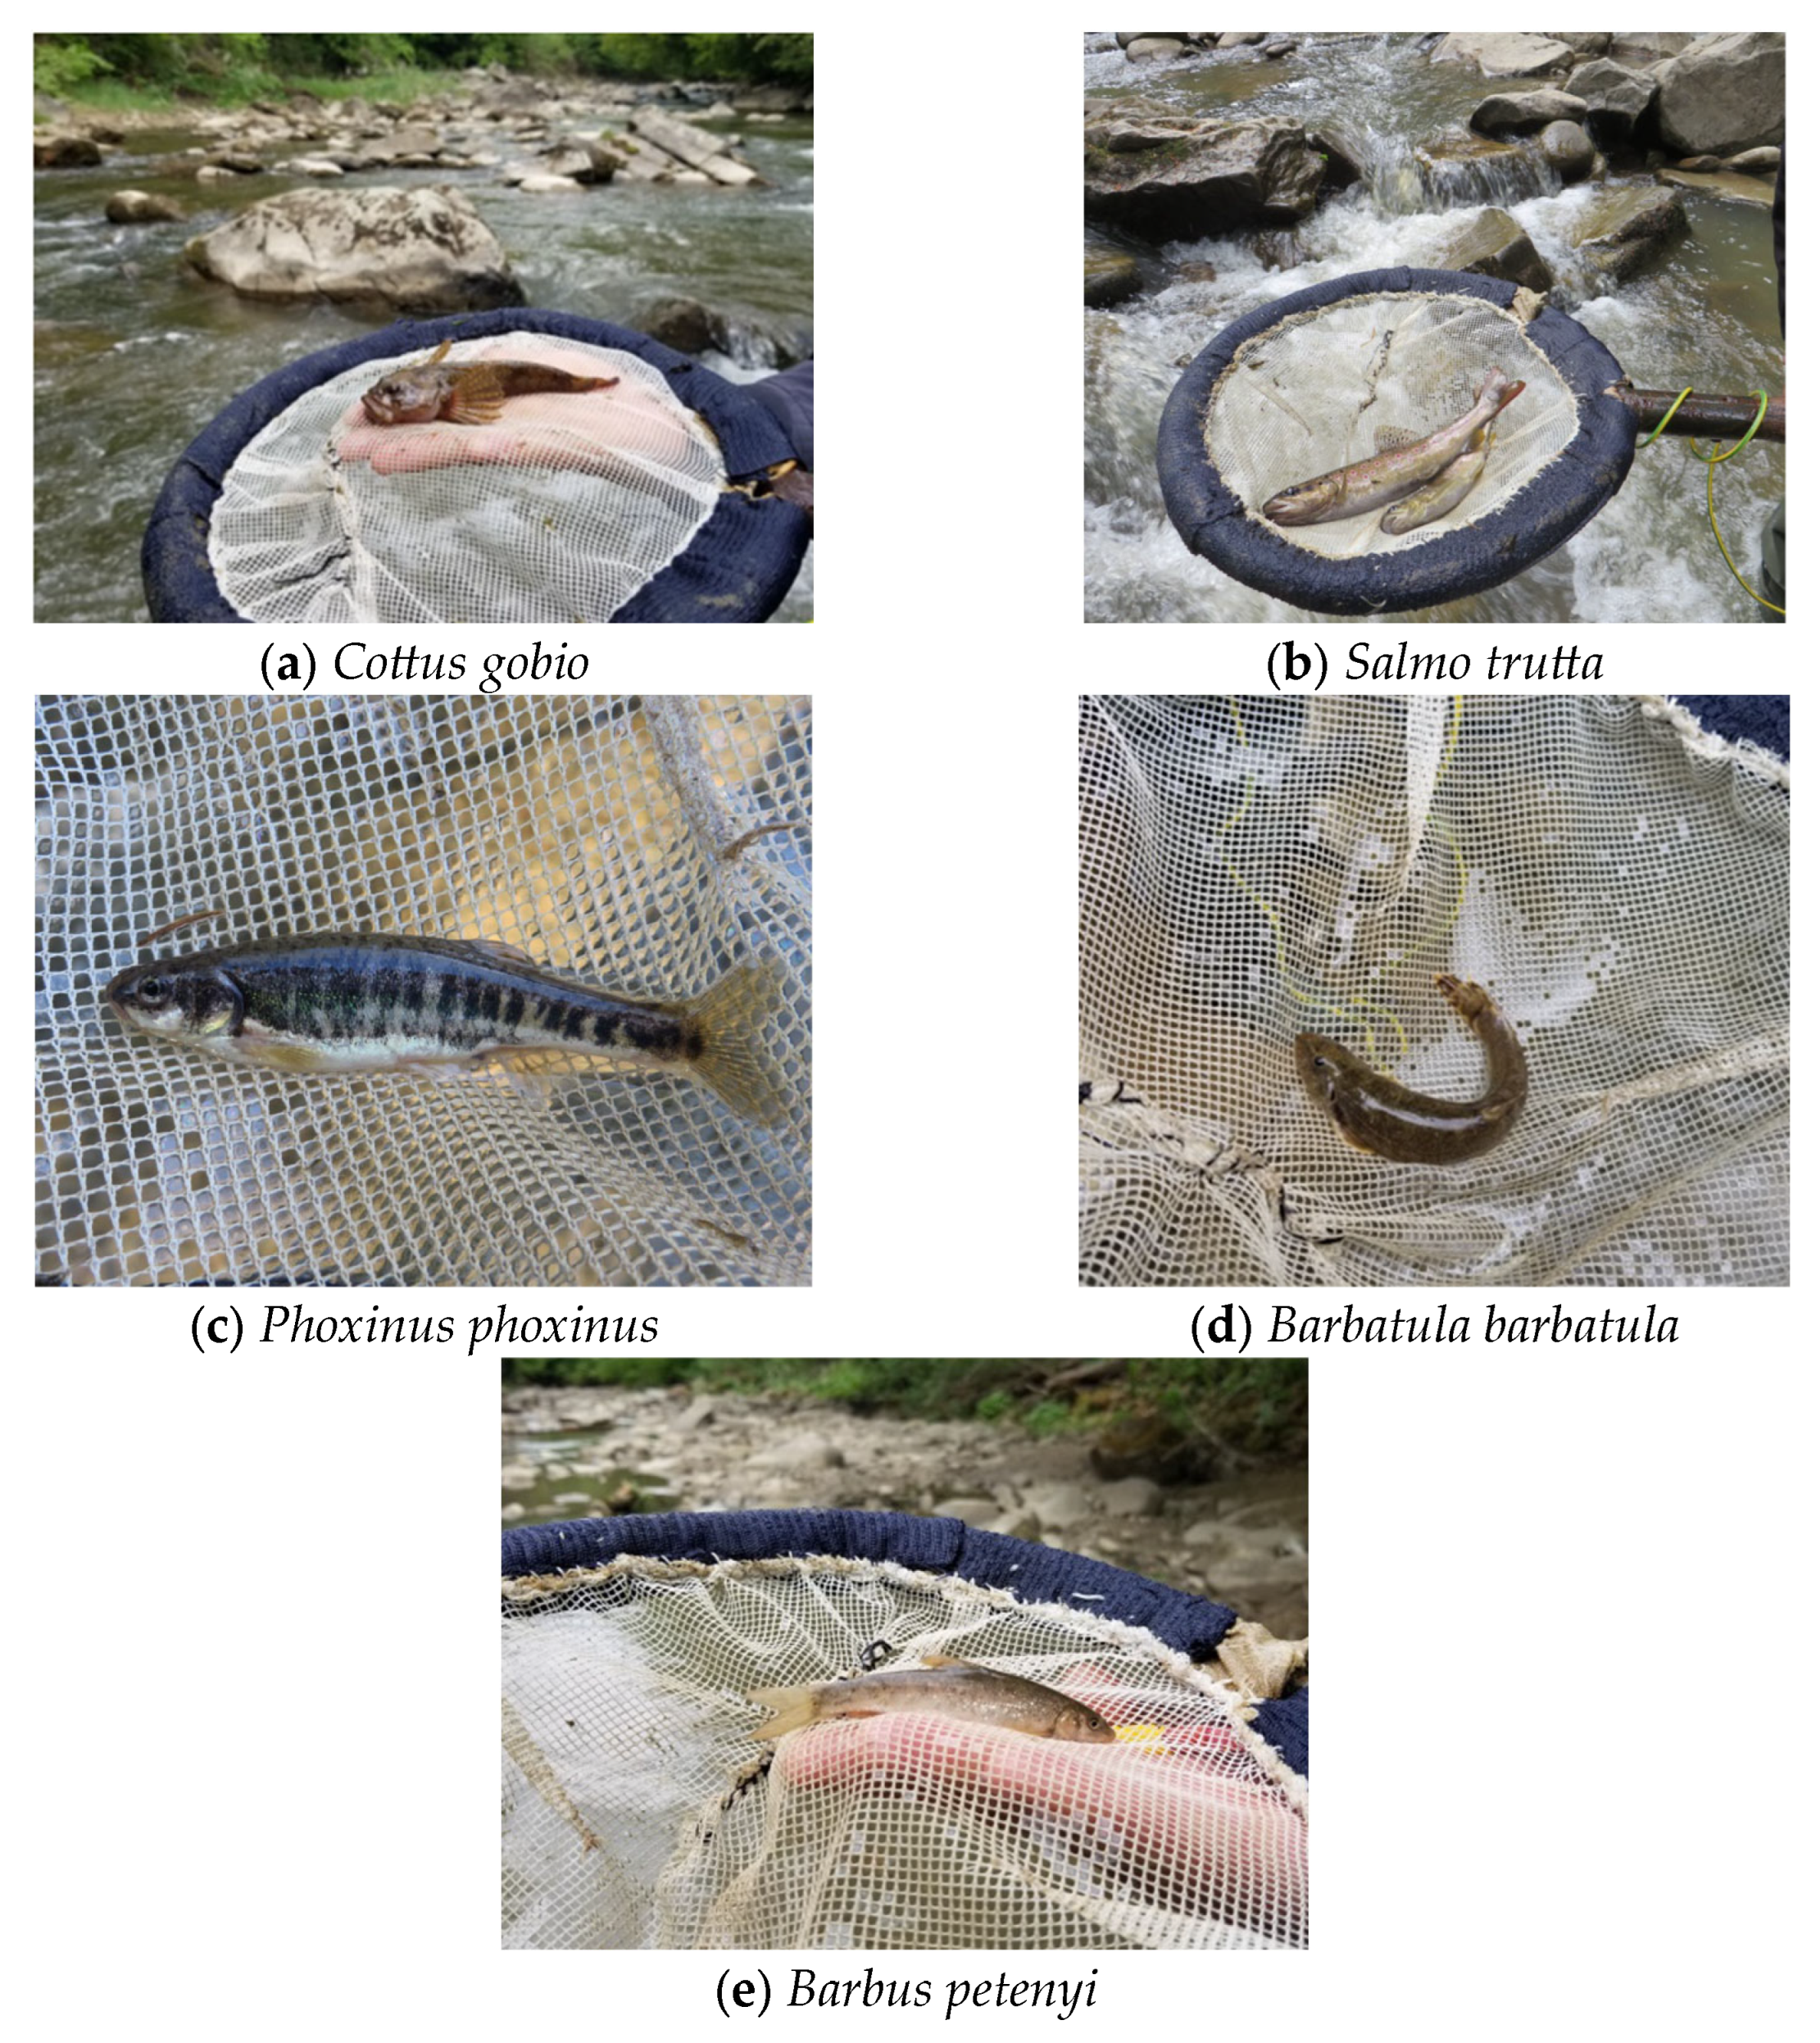
| Fish Species Name | Breeding Period | |||||||||||
|---|---|---|---|---|---|---|---|---|---|---|---|---|
| Months of the Year | ||||||||||||
| 1 | 2 | 3 | 4 | 5 | 6 | 7 | 8 | 9 | 10 | 11 | 12 | |
| Cottus gobio | X | X | X | |||||||||
| Barbus petenyi | X | X | X | |||||||||
| Salmo trutta | X | X | X | |||||||||
| Phoxinus phoxinus | X | X | X | |||||||||
| Barbatula barbatula | X | X | X | |||||||||
| Class of forecast | Months of year | |||||||||||
| I | II | III | IV | V | VI | VII | VIII | IX | X | XI | XII | |
| >100% | 62% | 29% | ||||||||||
| 80–100% | ||||||||||||
| 50–80% | 13% | |||||||||||
| 30–80% | ||||||||||||
| <30% | ||||||||||||
| River/Section | Location (Stereo 70 Coordinates) | Qsal | Qec | Relative Decrease | |
|---|---|---|---|---|---|
| X | Y | (m3/s) | (m3/s) | (%) | |
| Uz, S1 | 588,177 | 535,287 | 0.187 | 0.100 | 47 |
| Uz, S2 | 591,789 | 535,387 | 0.250 | 0.131 | 48 |
| Baska | 594,435 | 533,770 | 0.055 | 0.034 | 38 |
| Uz, S4 | 594,186 | 535,746 | 0.351 | 0.183 | 48 |
| Uz, S5 | 596,901 | 538,721 | 0.457 | 0.220 | 52 |
| Barzauta | 598,123 | 533,676 | 0.375 | 0.211 | 44 |
| Vistea | 467,134 | 480,336 | 0.202 | 0.107 | 47 |
| Sâmbăta | 483,838 | 460,648 | 0.138 | 0.058 | 58 |
| Viștișoara | 481,882 | 461,806 | 0.078 | 0.036 | 56 |
| Porumbacu | 462,540 | 457,880 | 0.152 | 0.122 | 20 |
| Călinești | 441,401 | 433,684 | 0.152 | 0.113 | 26 |
| Taia | 375,799 | 447,525 | 0.114 | 0.098 | 14 |
| Ausel | 377,447 | 448,071 | 0.251 | 0.189 | 25 |
Disclaimer/Publisher’s Note: The statements, opinions and data contained in all publications are solely those of the individual author(s) and contributor(s) and not of MDPI and/or the editor(s). MDPI and/or the editor(s) disclaim responsibility for any injury to people or property resulting from any ideas, methods, instructions or products referred to in the content. |
© 2023 by the authors. Licensee MDPI, Basel, Switzerland. This article is an open access article distributed under the terms and conditions of the Creative Commons Attribution (CC BY) license (https://creativecommons.org/licenses/by/4.0/).
Share and Cite
Ilinca, C.; Anghel, C.G. Re-Thinking Ecological Flow in Romania: A Sustainable Approach to Water Management for a Healthier Environment. Sustainability 2023, 15, 9502. https://doi.org/10.3390/su15129502
Ilinca C, Anghel CG. Re-Thinking Ecological Flow in Romania: A Sustainable Approach to Water Management for a Healthier Environment. Sustainability. 2023; 15(12):9502. https://doi.org/10.3390/su15129502
Chicago/Turabian StyleIlinca, Cornel, and Cristian Gabriel Anghel. 2023. "Re-Thinking Ecological Flow in Romania: A Sustainable Approach to Water Management for a Healthier Environment" Sustainability 15, no. 12: 9502. https://doi.org/10.3390/su15129502
APA StyleIlinca, C., & Anghel, C. G. (2023). Re-Thinking Ecological Flow in Romania: A Sustainable Approach to Water Management for a Healthier Environment. Sustainability, 15(12), 9502. https://doi.org/10.3390/su15129502