Article

Influence of Illumination Parameters on Night Sky Observation in Rural Areas

by
Alejandro Martínez-Martín
1,
Adrián Bocho-Roas
1,
Diego Carmona-Fernández
2,*,
Manuel Calderón-Godoy
2,
Miguel Ángel Jaramillo-Morán
2 and
Juan Félix González
1
1
Department of Applied Physic, School of Industrial Engineering, Avda, de Elvas, S/N, 06006 Badajoz, Spain
2
Department of Electrical Engineering, Electronics and Automation, School of Industrial Engineering, University of Extremadura, Avda, Elvas s/n, 06006 Badajoz, Spain
*
Author to whom correspondence should be addressed.
Sustainability 2023, 15(12), 9359; https://doi.org/10.3390/su15129359
Submission received: 3 May 2023 / Revised: 2 June 2023 / Accepted: 7 June 2023 / Published: 9 June 2023

Abstract

:
Currently, there are concerns about the significant increase in the level of night-time light pollution, which has become more dramatic in recent years. This causes several environmental problems and makes it impossible to observe the starry night sky, especially in rural areas where observatories are often located. Incorrect orientation and arrangement of lighting are often responsible for this pollution. This study quantified the level of interference of lighting parameters in the night sky. The influence of other environmental factors which may interfere with observation was also evaluated. A predictive model was developed to determine the level of darkness in rural areas. It was concluded that the distance from the emission point to the observation site is critical for sky observation. A series of guidelines were proposed for designing the lighting around observatories, which could help reduce light pollution and increase the stars’ perception. The conclusions and guidelines obtained could also be applied to designing the lighting in other areas, such as protected natural areas, historical monuments, urban lighting, and computer tools used for lighting. Globally, the results obtained in this study could help to reduce the level of night-time light pollution in rural areas, leading to improvements in the environment and in the observation of the night sky. This finding is of great relevance for astronomical observatories, which are spread around the world in strategic positions for sky observation, usually in rural areas.

1. Introduction

The visibility of celestial objects in the night sky is affected by light pollution. In ancient times, the main obstacle to correct observation of the sky was the Moon. Due to the high presence of artificial light sources in urban areas, light pollution represents the main problem astronomers encounter when performing visible light astronomical observations (via optical telescopes).
In the last decade, the average increase in the global illumination level was 2% per year [1,2]. That rate is about twice the rate of global population growth. The worldwide increase in artificial night-time illumination has led to a decrease in the observability of the starry sky [3]. The major contributing factors to the increase in the level of light pollution include economic growth, population growth, and reduction in the cost of illumination [4,5].
Light pollution also affects the behaviour of animals. Insects belonging to the base of the trophic chain of ecosystems are attracted by artificial light sources, dying when they come into contact with them [6,7,8,9]. This prevents plant pollination [10] and causes a behavioural change in the rest of the animals that feed on these insects, modifying migratory patterns and habitat formation [11,12,13,14,15].
Currently, a series of saving measures are being carried out to reduce energy expenditure due to the energy crisis. One of the main measures proposed is reducing the illumination level of public lighting [16]. Several studies [3,17,18,19,20,21,22] associate the level of existing lighting with the amount of light pollution in the area. This reduction in illumination could improve the level of perception of the starry sky. Additionally, studies link a reduction of up to 50% [17] in the level of night-time glare to switching off street lighting in cities. This implies that, in cities, a large amount of light energy emitted to the sky comes from poorly designed street lighting, hence the importance of a correct arrangement and orientation of these installations (Figure 1). By using an optimal design, it is possible to avoid this waste, both of light and of the electricity needed to create it [23], which are wasted by being directed to the sky instead of to the area that is intended to be illuminated.
By using different types of lighting and filters, light pollution in urban areas can be reduced. Commonly used outdoor lighting sources include low-pressure sodium (LPS), high-pressure sodium (HPS), metal halide and, more recently, light-emitting diodes (LEDs) [25,26].
LPS technology is now obsolete and is no longer manufactured, although its use around observatories and environmentally sensitive areas has been promoted. HPS technology is commonly used for street lighting in many cities. Although it emits an amber light, it is more similar to daylight than LPS.
In areas where white light is required, there are two commonly used options: metal halide and LED. One of the advantages of LED lighting is that it can be modulated. So, instead of always illuminating an empty area at maximum brightness, LEDs can be dimmed or even switched off when they are not needed and then switched back to maximum brightness as required. This feature provides significant energy savings and reduces night-time light pollution [27,28,29]. Due to their long lifetime and energy efficiency, the use of LED technology is becoming popular, replacing existing lighting in many cities. However, it is important to note that, compared to other technologies, both LED and metal halide luminaires have a predominance of short wavelengths in their spectrum (blue light). This type of light has a much higher potential to illuminate the night sky compared to lights of a different colour, thus increasing the level of light pollution. Therefore, it is important to minimise the amount of blue light emitted [3,25].
It is reasonable to assume that there is a higher observing capacity in rural areas [17] as they have a lower level of light pollution compared to large population centres. Many professional observatories were built decades ago in these initially sparsely populated rural locations. However, the population of these areas has been increasing in recent years, and the level of light pollution has increased accordingly [4,30]. This light pollution can affect the measurements made at these observatories [4,31]. Thus, the protection of these observation sites is of great scientific importance [32,33,34,35].
For this reason, a detailed study has been proposed to quantify the level of interference represented by the different lighting parameters (power, height, inclination, distance) on the level of light pollution in rural areas. From the results, it is possible to determine the optimal design and layout of the luminaire to minimise the influence and guarantee the correct visualisation of the starry sky. The results of such a study could be very relevant in environments close to astronomical observatories, where a low level of night-time brightness is required. There is a great interest in space observation, so an improvement in the ability to perceive the stars could be a relevant improvement in this field. In addition, this study could have a broad impact in the field of environmental care and sustainability as the conclusions could also be applied in rural areas where a lower level of light pollution is desired (while avoiding the environmental problems derived from it).

2. Materials and Methods

The experimental process aims to assess the level of light pollution in rural areas due to several external illumination parameters. For this purpose, the surface brightness of the night sky was measured in apparent magnitudes per square arcsecond (mag/arcsec2). This measurement unit, used in astronomy to quantify the relative darkness of astronomical objects, represents the brightness of a square sky area that is one arcsecond per side [36]. In the text, the measured darkness level is designated by the acronym MDL. A higher MDL value will imply a higher level of darkness in the night sky, which is also associated with a lower level of light pollution and better observability of celestial bodies. The measurement of MDL was performed with a Sieltec Canarias SKYGLOW V3.1 photometer (described in Appendix A).
For an optimal observation of the night sky, the MDL should reach a value close to 24 mag/arcsec2. At this point, the observation is considered perfect as there is no interference. As the MDL decreases, the number of divisible celestial objects simultaneously decreases, up to a level of 10.5 mag/arcsec2, at which point the ability to observe is completely lost [4]. This observation is shown in the graph in Figure 2, obtained from [4], where the impact of light pollution on the ability to see the stars was graphically represented. The skyglow weighting factor is a dimensionless parameter used to weigh the level of light pollution. A higher skyglow weighting factor will imply a higher level of night skyglow, and, therefore, a lower ability to observe the sky. Figure 2 shows how, as the skyglow weighting factor increases (vertical axis), the level of darkness of the recorded sky (horizontal axis) progressively decreases. The process of calculating the skyglow weighting factor is explained in detail in the cited article [4], where night sky brightness images were used based on The National Park Service Sky Quality Index.
The experiment was performed in rural areas without light pollution, away from population centres (detailed in Section 2.2: Research Area) and with clear weather conditions. These conditions ensured that other external factors did not interfere with the experiment. To simulate the effect caused by light pollution, a lamp was used in different arrangements to simulate the lighting effect of an urban street lamp. The factors evaluated were power, height, inclination, and distance to the observation point of the lighting equipment. (These factors are detailed in Section 2.3: Data Collection.)
The objective was to evaluate the influence of these factors on the measured level of darkness. From these results, it is possible to determine the luminaire arrangement which maximises the level of darkness. These results can be extrapolated to urban lighting, particularly streetlamps, as they represent the main source of light irradiance into the night sky [17,19]. In this way, a reduction of the light interference exerted by this type of lighting on the level of darkness in the night sky can be achieved. The application of these measures is conditional on maintaining the previous level of comfort and performance.
In addition, the influence of several other factors that could also influence the observation, such as the presence of the Moon, the presence of light-shielding elements in nearby areas, direct illumination, and ambient illumination of the observation site, were evaluated. These factors may also be relevant for optimising the observation.

2.1. Experimental Design

Two simultaneous measurements were made to evaluate the level of interference produced by the lighting in the experiment. The first measurement, used as a reference, was made at a position away from the light sources. In this way, it was possible to determine the original level of darkness in the sky in the area without the influence of the experiment’s lighting equipment. The second measurement was used to evaluate the incidence of the different light sources. All the technical characteristics of the luminaire used during the experimental phase are shown in Appendix A. The light sources used had the same colour characteristics, colour temperature, and colour rendering index, with the only difference being their power. The first lamp had a power of 30 W, corresponding to a luminous flux of 4800 lm. The second lamp had a wattage of 60 W and a luminous flux of 7200 lm. A link to the marketer’s website was added to provide all the technical characteristics. By comparing the two, it was possible to eliminate the influence of other variables, such as weather conditions, on the study. Both measurements were performed with a Sieltec Canarias SKYGLOW V3.1 photometer (described in Appendix A).

2.2. Research Area

The optimal places for starry sky observation are usually located away from the main population centres as they have lower levels of light pollution [17]. A series of small rural municipalities in the province of Cáceres were selected for the measurements. The selection of these municipalities is part of the GLOBALTUR EUROACE project [37], which aims to support tourism development in the Tagus International cross-border biosphere reserve by exploiting the resources of the starry sky (Figure 3). Specifically, experiments were carried out in three representative municipalities in the following areas: Herreruela, Zarza la Mayor, and Santiago de Alcántara. The exact locations of the selected measurement points and levels of light pollution in the area are shown in Appendix B.
Regarding the specific location of the measuring equipment, we ensured that it was positioned far away from the urban centre to avoid the influence of local illumination. The site was decided together with the mayors of the respective municipalities by consensus, particularly looking for those points where there was a specific interest in evaluating the level of darkness due to the existence of an observation point or elements of particular historical importance. Furthermore, all the locations were situated in free open-air places without any external light source that could affect the experiment.

2.3. Data Collection

To avoid the possible influence of weather, the experiments were carried out under similar weather conditions in all three cases. The initial darkness conditions present in the three cases were also identical. However, a previously installed reference photometer was used to measure the level of darkness in the area (which was not affected by any light from the experiment’s luminaire) and to subsequently calculate the difference between the experimental measurement and the base level. Both measurements were performed with a Sieltec Canarias SKYGLOW V3.1 photometer (described in Appendix A).
The measurement period of the photometer was set at one minute. One of the parameters was modified every 5 min, keeping the rest constant. In this way, a total of 5 measurements were available at each specific position, which made it possible to eliminate those that were not representative or those in which there had been an error in the recording. In the subsequent data analysis, the initial and final measurements of each period were eliminated to avoid the possible influence of one set of data on the next.
The experiments were carried out similarly in the three selected municipalities. In all cases, the following lighting parameters were evaluated:
  • Power: Three different power values were set at 30, 60, and 90 W, corresponding to a lighting power of 4800, 7200, and 12,000 lumens, respectively. These values were selected based on the commonly used commercial lighting equipment values.
  • Height: Two different heights at which the emitting lamp was placed were established. The first position was at the same level as the photometer (0.7 m above ground level, a in Figure 4). This position made it possible to evaluate the influence on the observer of lighting placed at the same height, for example, ones that are used to mark a road or emergency signs. The second position (b in Figure 4) was raised to 1.6 m, simulating the effect that the light emitted by a street lamp would have on an observer.
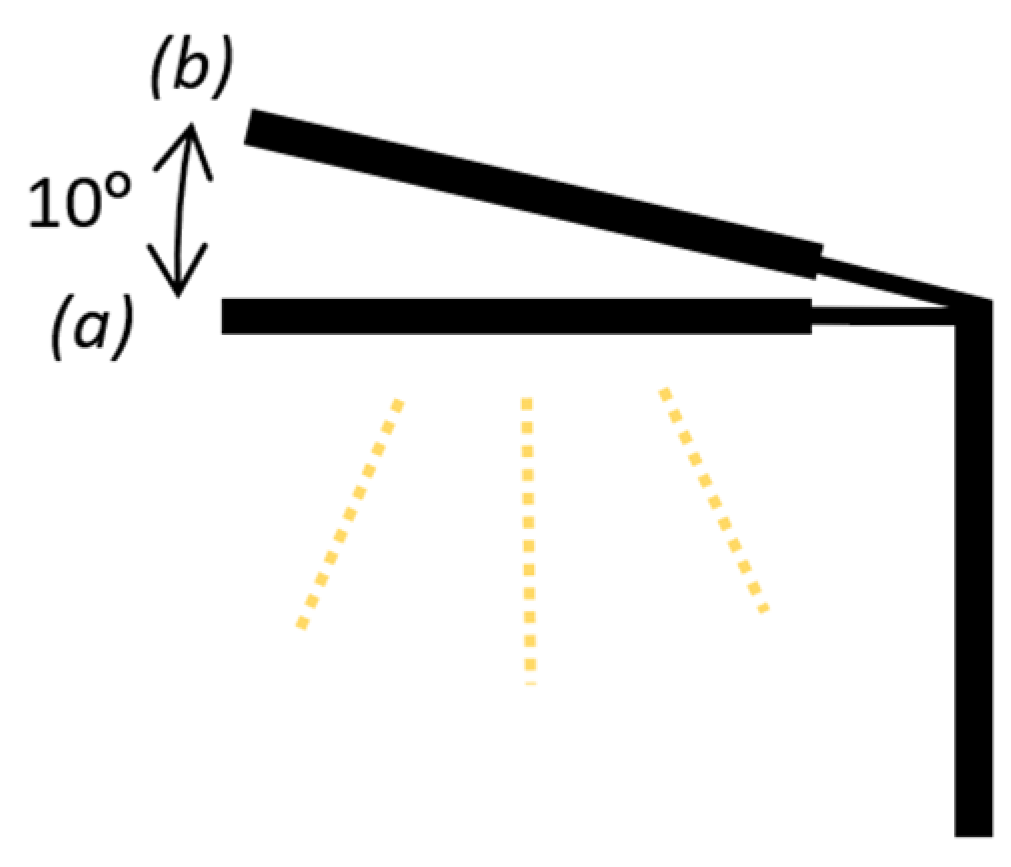
  • Tilt: The commonly used tilts for street lamps and lighting equipment were used. In the first position (a in Figure 5), the lantern was pointed directly towards the ground. In the second position (b inFigure 5), it was also pointed towards the ground but with a slight inclination of 10 degrees in the opposite direction of the observation point.
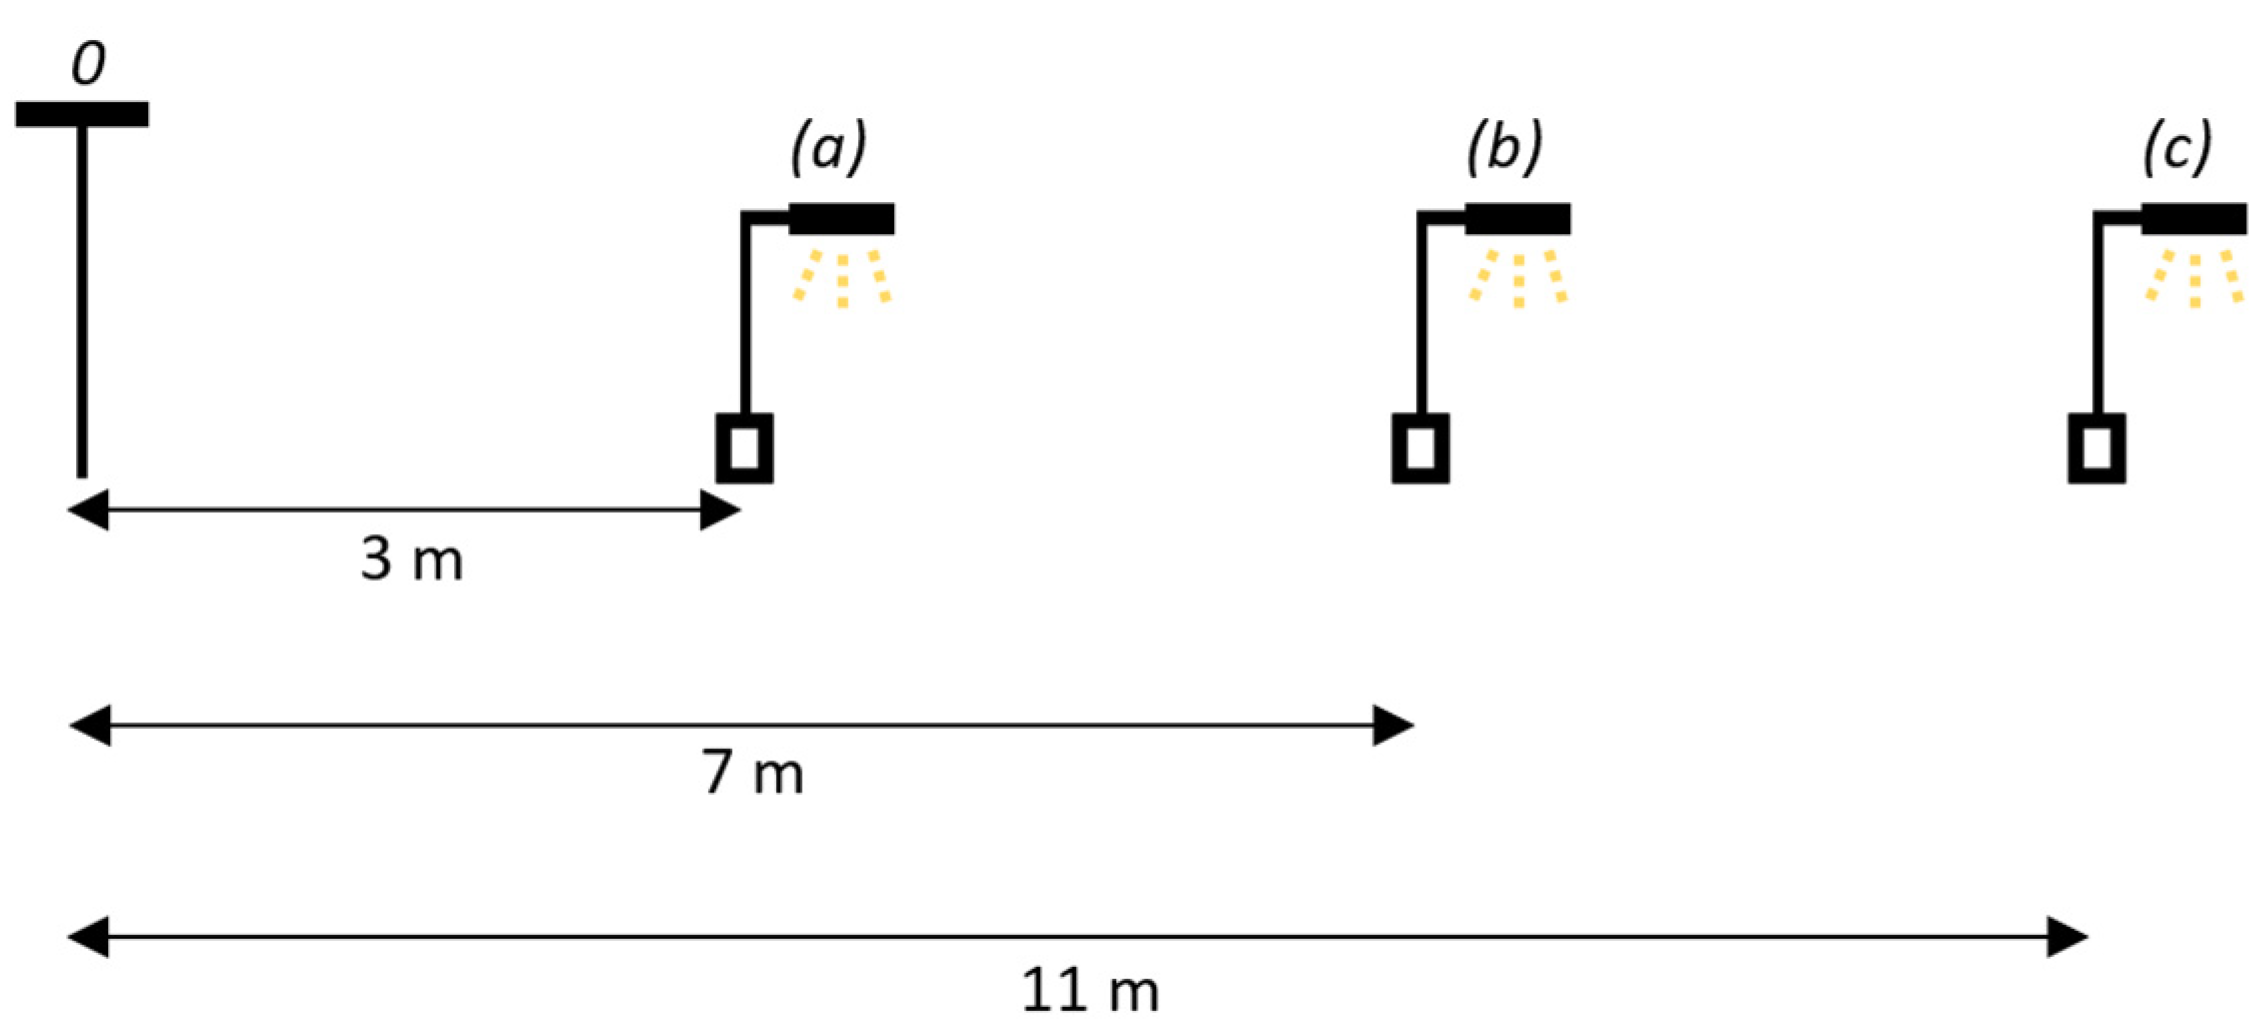
  • Distance to the observation point: Before the start of the experiments, different distances were tested until three representative positions were reached. The closest distance at which the luminaire was placed was 3 m from the sensor (a in Figure 6). Closer distances to the sensor caused a drastic decrease in MDL and were thus discarded. The second position was set at an intermediate distance of 7 m (b in Figure 6). Finally, the furthest distance was 11 m (c in Figure 6) as other more distant measurements (15 and 20 m) showed little influence and were therefore discarded.
Once these parameters had been measured, it was decided to assess the influence of several other factors that could also affect the observation and whose influence needs to be considered when designing the layout for optimisation. These factors are as follows:
  • Illumination due to the Moon: The level of affection due to the presence of the Moon was evaluated as well as the influence of the change in its relative position throughout the night. Two complete experimental series were carried out for this purpose. During the first series, the Moon was present and its position changed as the experiment progressed, causing a variation in the brightness of the area. By the time the second series was performed, the Moon had disappeared. The position of the Moon was recorded using the Oculus All Sky camera (Appendix A). Using this recording, the position of the Moon was determined for each of the measurements taken. By comparing both experimental series, the influence of the level of darkness in the area was made.
  • Direct illumination: The lighting equipment was aimed directly at the sensor, increasing the distance between both equipments to 20 (a in Figure 7) and 50 m (b in Figure 7). The illumination power was 90 W, keeping the light vertical. This simulates the effect that direct illumination of the area, for example, the type of lighting used in the vicinity of a heritage building, would have on the observation [39].
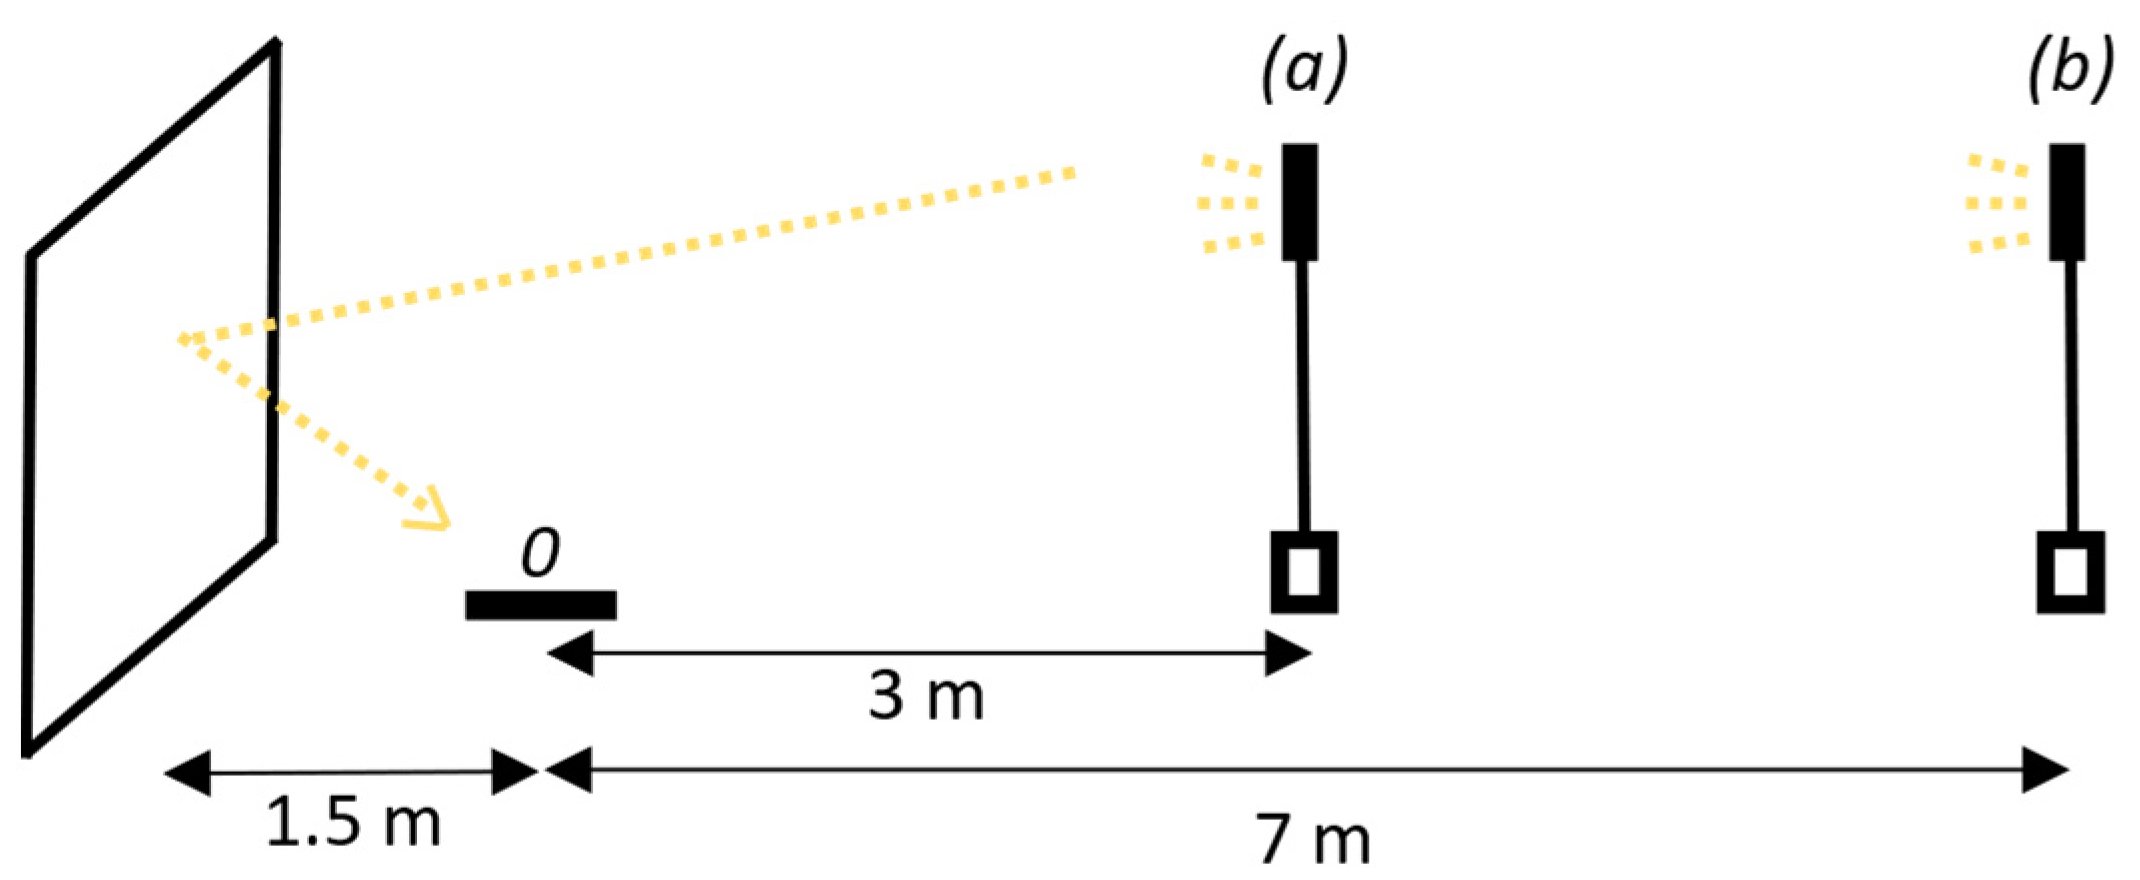
  • Presence of elements that produce a light shielding effect in nearby areas: A white reflective screen (dimensions of 150 × 200 cm, described in Appendix A) was placed around the sensor at a distance of 1.5 m. This screen caused the reflection of part of the light emitted by the lighting equipment, which was positioned at a distance of 3 m (a in Figure 8) and 7 m (b in Figure 8). This experiment simulated the presence of a vehicle or building close to the observation site.
  • Illumination of the environment of the observation site: The lighting equipment was placed horizontally at ground level pointing towards the sky so that the environment of the area was illuminated. The distance to the measurement point was set to 20 (a in Figure 9) and 50 m (b in Figure 9).
  • Photometer above the emission point: The photometer was raised above the lighting equipment. The lamp was held horizontally toward the ground. The distance, power, and tilt were successively varied (Figure 10). This experiment simulated the effect of placing the observation point at an elevated location, e.g., on a mountain or on the roof of a building.

3. Results

A batch of measurements was carried out for all possible combinations of the parameters described above, resulting in 36 possible positions (three distances × two heights × two inclinations × three powers). This process was repeated in each of the three selected municipalities. In the graphs shown below, the municipalities of Zarza, Herreruela, and Santiago correspond to locations A, B and C, respectively. During the execution of the experimental series, it was found that in the “11 m down” configuration, the MDLs recorded by the experimental photometer were equal to the corresponding values of the reference photometer. This implies that, for the luminaire arrangement, there is no effect on the MDL. For this reason, the values are not shown in the set of results.
Figure 11, Figure 12 and Figure 13, shown below, demonstrate the graphical representation of the results obtained in the different experimental series described. In all cases, the level of darkness recorded increased as the distance between the emitting source and the data collection point was increased. The result changed when a low emitting height of the spotlight (0.7 m) was used. In this case, the approach curves are similar in both tilt/horizontal configurations and have a low slope.
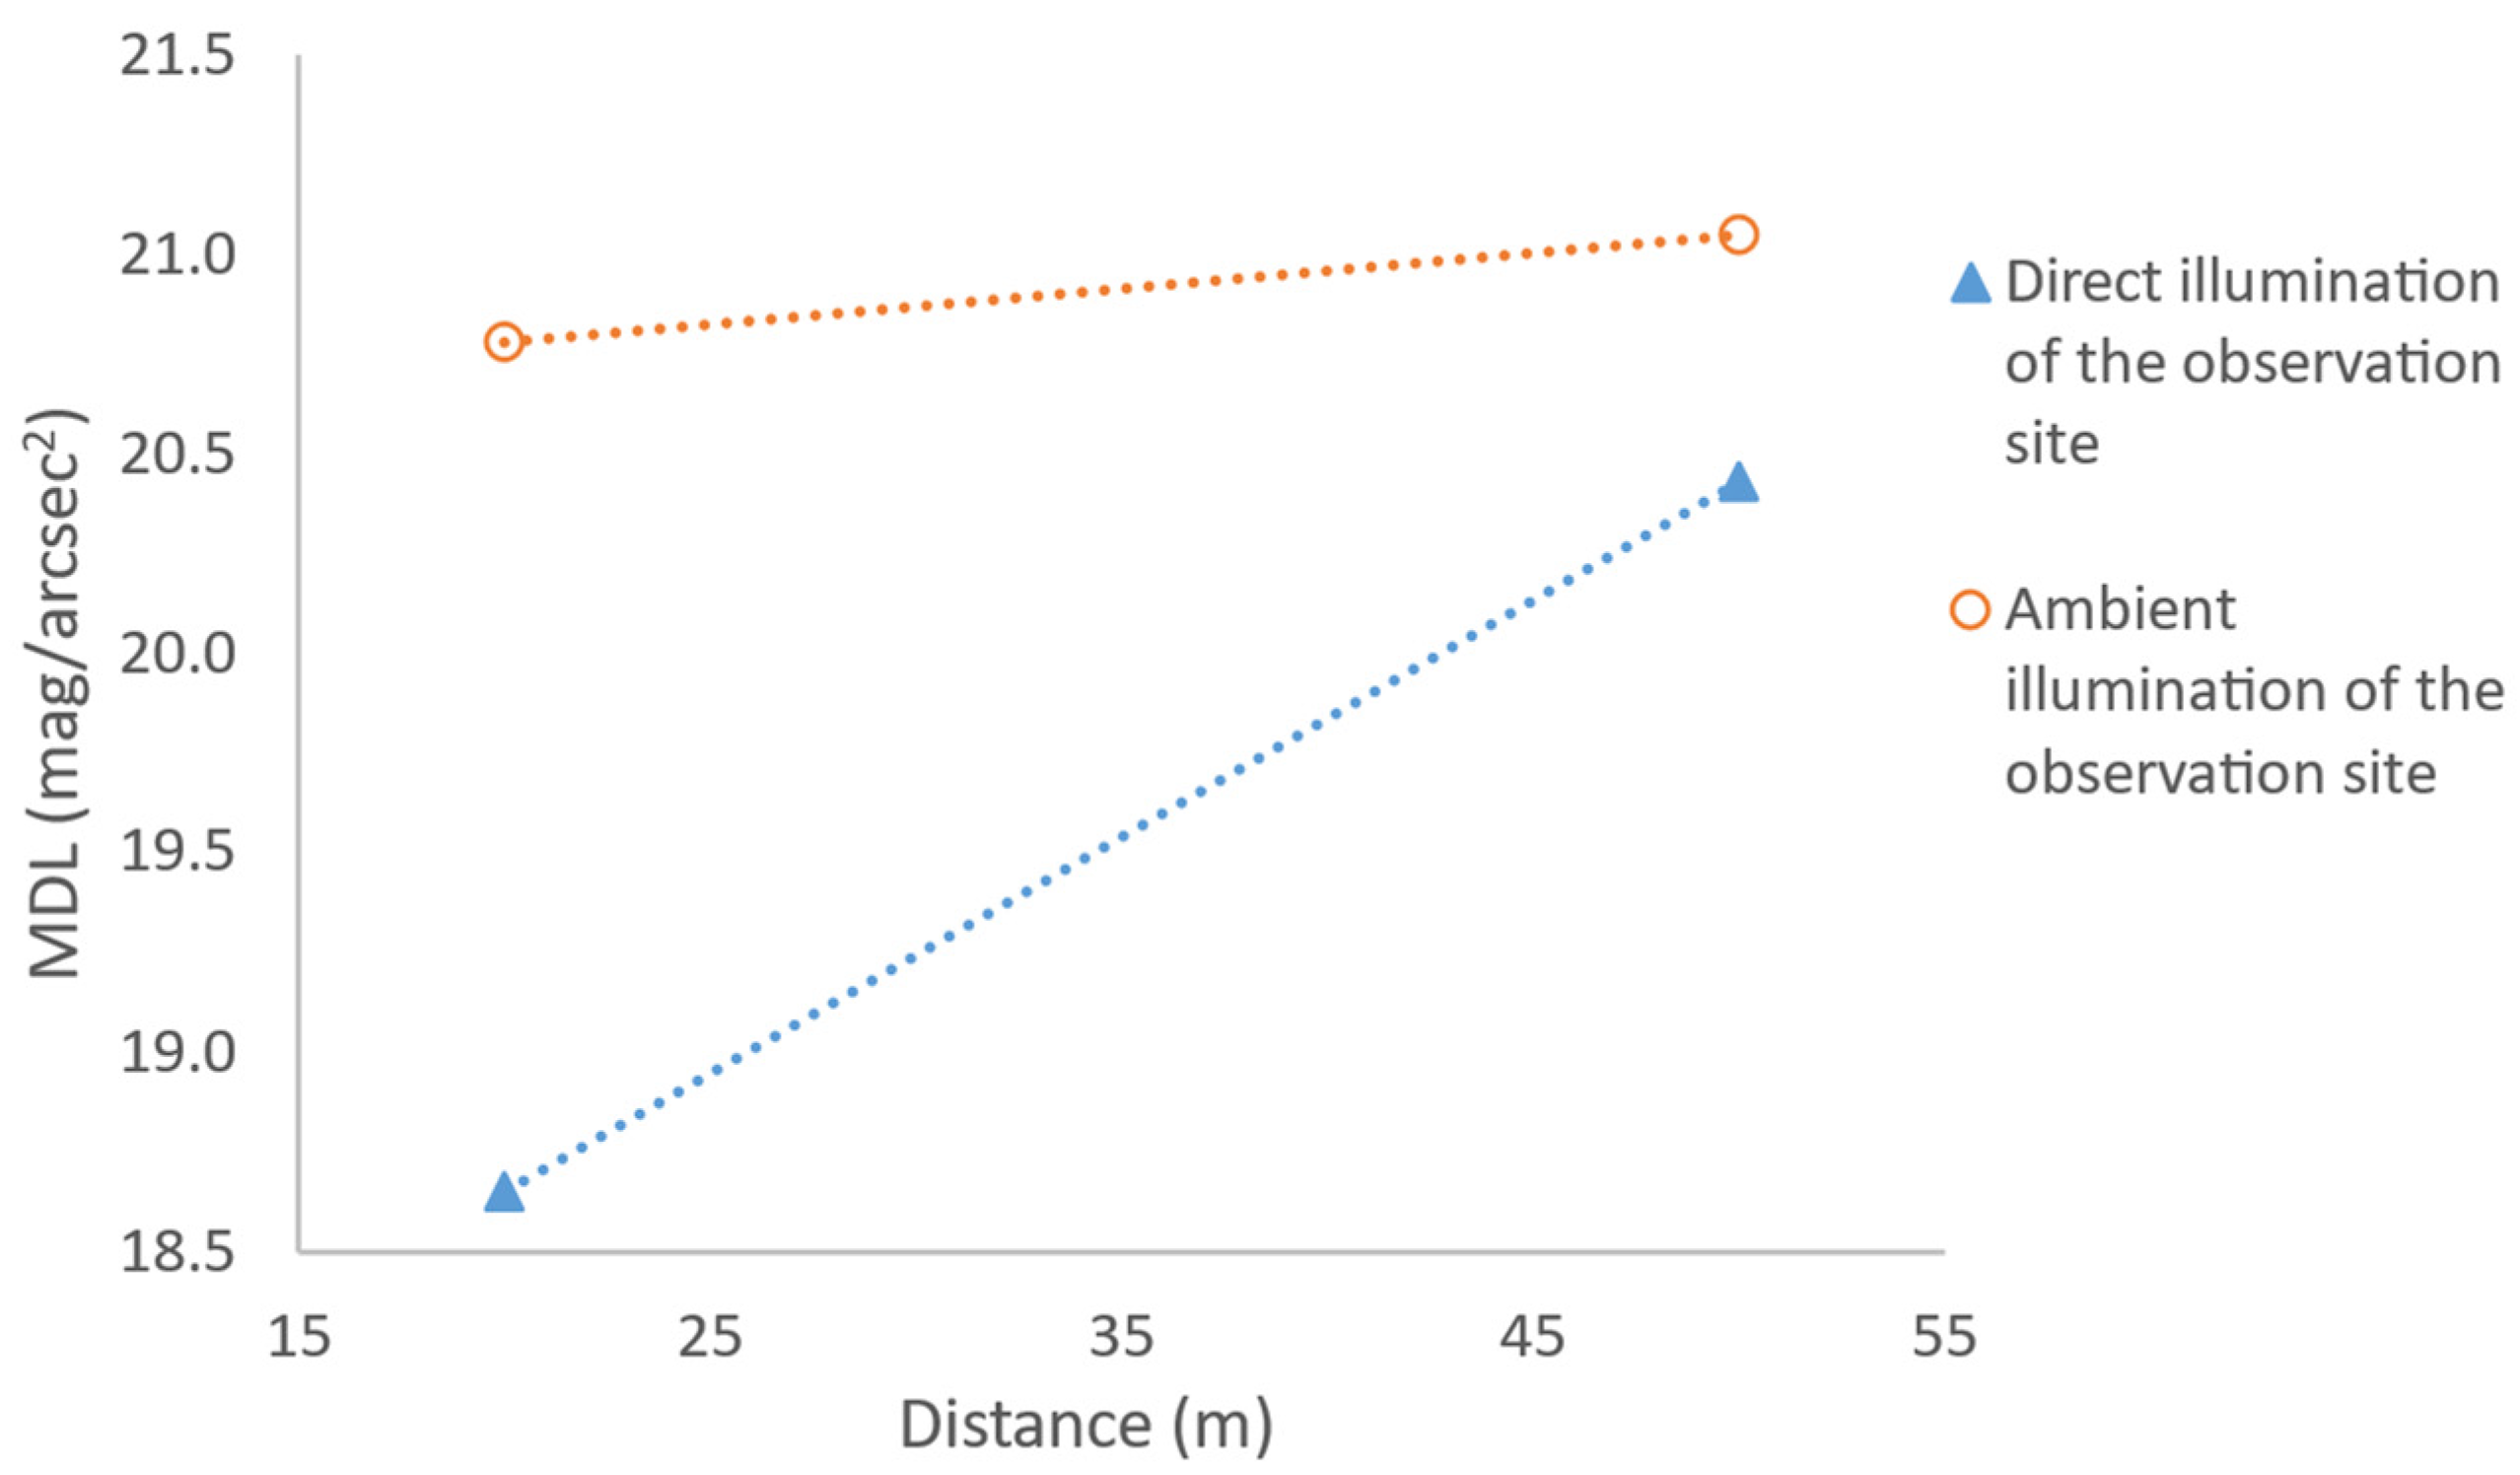
Table 1 and Table 2 show the MDLs recorded by the two photometers in the measurements taken when directly illuminating the observation site and the environment of the experiment, respectively. These results are also plotted in Figure 14. Figure 15 shows the variation in the MDL for the two emission heights (0.7 and 1.6 m) during the measurements taken in the presence of light shielding elements in the proximity of the sensor.

4. Discussion

4.1. Analysis of the Lighting Parameters Evaluated

Once the results of the different experiments had been collected, a statistical analysis of the results was carried out. This study aimed to determine the influence of each of these variables separately on the level of existing light pollution. This can be used to determine which parameters are most relevant for reducing this level. The statistical analysis developed and the graphical representations of the results of the analysis are shown below.
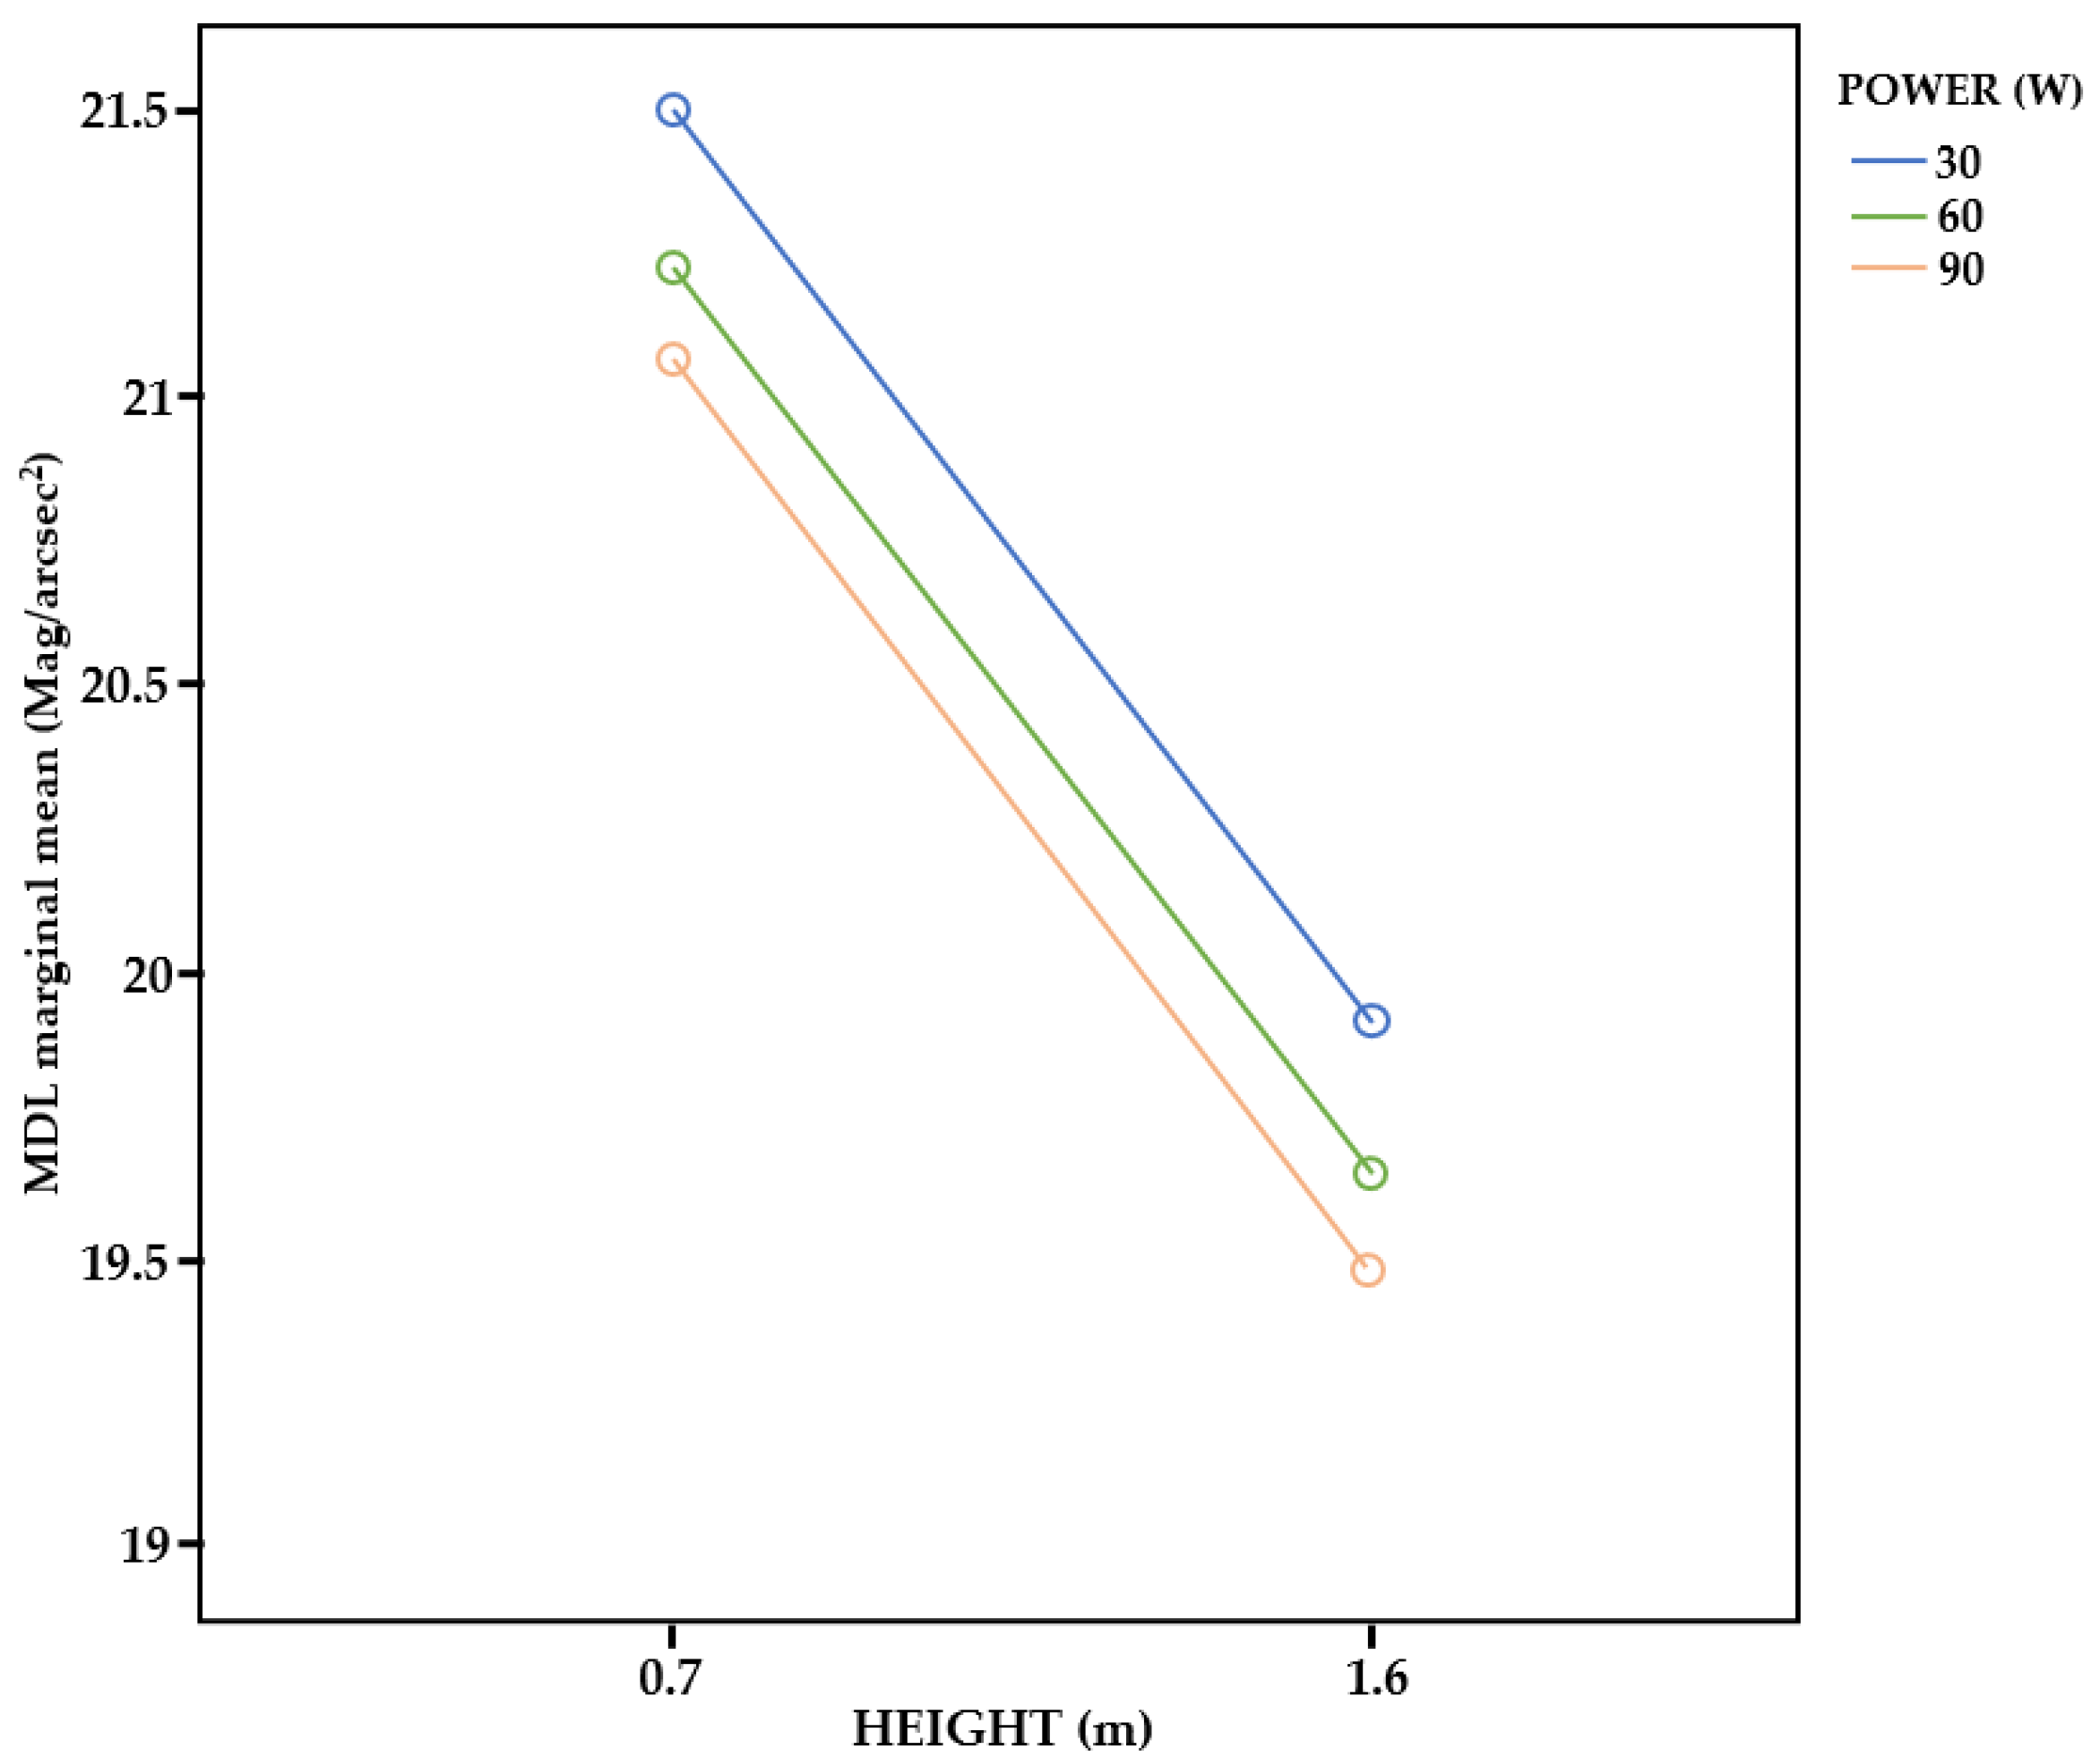
Firstly, the marginal averages of the MDLs were plotted for the following variables: distance (Figure 16), height (Figure 17), and inclination (Figure 18) for the three lighting powers selected (30, 60, and 90 W). These figures show the response of the dependent variable analysed when the other independent parameters are modified individually.
When analysing the change in the distance between the emitting source and the observation point, the MDL does not decrease linearly as the focus reaches closer to the observation point. Figure 16 shows that by decreasing the distance from 11 to 7 m, there is a reduction in the MDL of 1.5 mag/arsec2. Reducing the distance from 7 to 3 m results in a further drop in the MDL of 1 mag/arsec2, reaching an MDL value of 19 to 19.5 mag/arsec2 (depending on the selected power). For this reason, it is advisable to maintain a minimum distance of at least 7 m from the emitting source to the observing site, and the observation is optimised by increasing the distance to 11 m. In the measurements performed by placing the light source above 11 m, the decrease in the MDL was found to be negligible, but placing the light source at this distance could cause a reduction in the illumination performance of the area. The curves shown for the three powers used have the same slope so that the behaviour of MDL as the distance changes is independent of the power used.
Regarding the height at which the light source is placed, there is a notable difference between the MDL measured for the low (0.7 m) and high (1.6 m) levels. By increasing the emission height to 1.6 m, the average MDL reduction is approximately 1.5 mag/arsec2. Therefore, it is convenient to place the light source at heights below 0.7 m in the closest possible position to the ground. As shown in Figure 17, the MDL reduction due to the increase in lamp power is equal at both selected heights.
Figure 18 shows the MDL as the tilt of the light source was increased. By increasing the angle of the lamp, we also observed an incremental increase in the MDL of approximately 1 mag/arsec2. For this reason, it can be concluded that it is advisable to keep the light source with a slight tilt pointing in the opposite direction of the observation site to reduce the level of interference.
The SPSS tool [40] was then used to perform an analysis of variance (Table 3) and to calculate the correlation between the different variables of the experiment using the Pearson’s matrix (Table 4). Based on this analysis, the correlation between the variables and the significance level was determined.
From the results obtained in Table 4, the variable “distance” has the highest correlation (0.418) with MDL. Hence, this should be the first factor to be considered when designing the luminaire layout as it will influence MDL the most. The variables “height” and “tilt” are equally correlated with MDL (−0.353 and 0.329, respectively), so these should be considered in second place. Finally, the illuminant power is the least interfering variable in the observation (−0.115). In this sense, a high illumination power will have little influence on the level of darkness as long as the illumination source is placed at a far distance (11 m), a low height (0.7), and in a horizontal position (0°).

4.2. Development of a Predictive Model Based on the Parameters Evaluated

The variables marked with two asterisks “**” in the Pearson correlation matrix (Table 4) have a significance level of 1%. When analysing the correlation between the independent variables (power, distance, height, and inclination), it is concluded that there is a low correlation between them. For this reason, it is possible to develop a regression model to obtain the value of the dependent variable analysed (MDL) as a function of the rest of the independent variables.
First, a linear regression model with interactions between variables was developed. This model is made up of three elements. The first is the linear component, consisting of the variables present in the experiment, each affected by a weighting coefficient of their influence (a1, a2, a3, and a4). The second component corresponds to the interactions between the different variables, and is also affected by a weighting coefficient (a5, a6, a7, a8, a9, and a10). The final component is the independent term (a0). The formula of this model (Equation (1)) and the calculated values of the different coefficients (Table 5) are shown below. The parameters “P”, “H”, “I”, and “D” in the equation represent, respectively, the luminous flux in lumens, the height in metres, the inclination to the horizontal in degrees, and the distance from the emitting source to the sensor in metres. The parameter “light power” has been replaced by the luminous flux parameter, so that the model can be used and reproduced for luminaires with different efficiency. The mean square error of this approximation is 0.802.
MDL = a 0 + a 1 P + a 2 D + a 3 H + a 4 I + a 5 P D + a 6 P H + a 7 P I + a 8 D H + a 9 D I + a 10 H I
The calculated values of the various weighting coefficients were obtained after running six evaluations of the model and three evaluations of the derivatives since, at that point, the sum of the squares of the residuals was less than 10−8.
A quadratic model was then developed to test whether a more accurate approximation could be achieved using this model. This model includes the three elements indicated in the previous one (Equation (1), lines 340 to 348) plus a fourth element corresponding to the quadratic component affected by a weighting coefficient (a11 and a12). In this case, a mean square error of 0.693 was obtained. The expression of the model (Equation (2)) and the calculated parameters (Table 6) are shown below.
MDL   =   a 0 + a 1 P + a 2 D + a 3 H + a 4 I + a 5 P D + a 6 P H + a 7 P I + a 8 D H   + a 9 D I + a 10 H I + a 11 P 2 + a 12 D 2
The calculated values of the various weighting coefficients were obtained after running six evaluations of the model and three evaluations of the derivatives since, at that point, the sum of the squares of the residuals was less than 10−8.
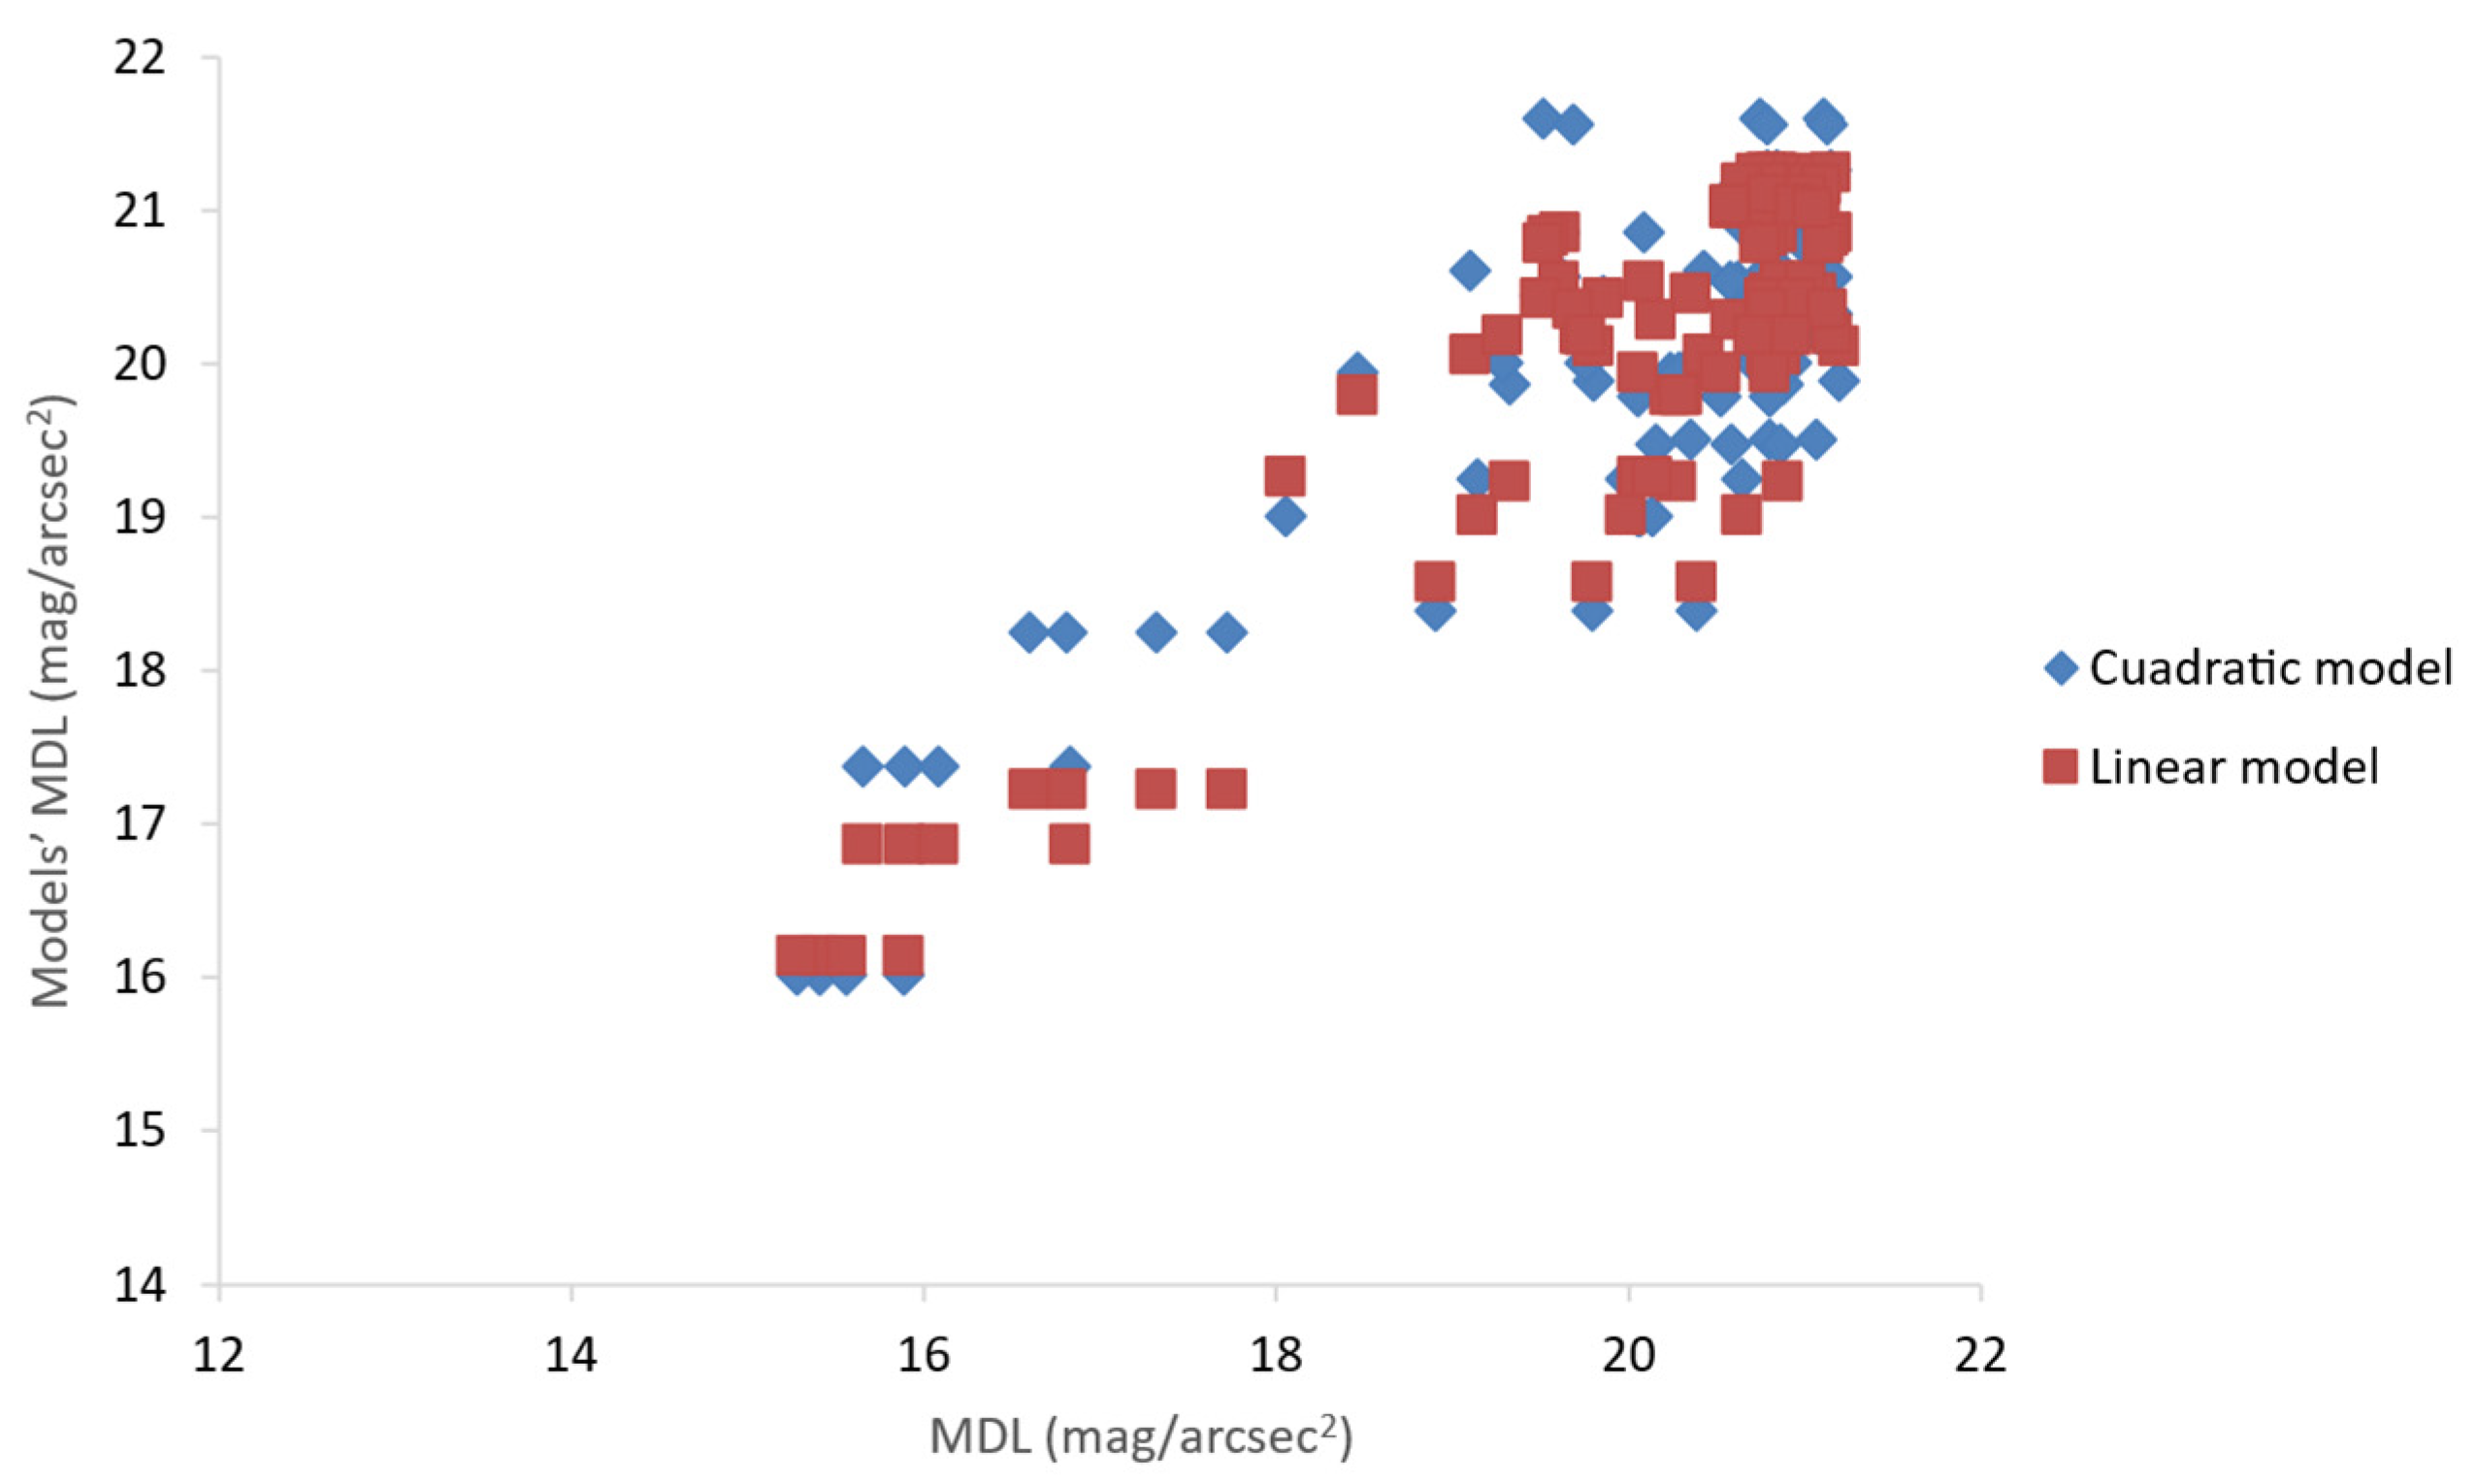
The values obtained in both models were plotted against the MDL obtained during the experimental phase (Figure 19). In both models, the quadratic error is close to one, which implies that the developed model fits correctly to the real MDL of the experiments. This can be seen in the graph as the point cloud resembles a straight line.

4.3. Analysis of the Influence of Environmental Lighting Elements

The results of other evaluated parameters that can influence the observation are described below. The control of these parameters may be necessary for optimal compliance.

4.3.1. Illumination Due to the Presence of the Moon

The experimental phase was carried out analogously in the three selected municipalities. In Location A (Zarza la Mayor, 5/6 September 2022), the Moon was in a waxing gibbous phase, so the influence of its illumination was elevated. In Location B (Herreruela, 21/22 September 2022), the lunar phase was in the waning quarter and the lunar lighting was moderate. In Location C (Santiago de Alcántara, 26/27 September 2022), the lunar phase was new moon, so there was no influence from the Moon’s illumination.
By having measurements with strong (Location A), moderate (Location B), and no lunar influence (Location C), it is possible to compare them to evaluate the level of impact on the MDL. In this sense, given the results shown in Figure 9, Figure 10 and Figure 11, the MDL recorded in Location A is always lower than the one recorded in Location C. More specifically, this decrease is set to a range of approximately 0.5 to 1.5 mag/arsec2, depending on the configuration setting. This implies that the lunar illumination causes a decrease in MDL, making it harder to observe the night sky. As for the record made in Location B, the data collected by the meteorological station indicate that the presence of clouds was considerable, so these data were inconclusive.

4.3.2. Direct Lighting of the Observation Site

Table 1 shows the MDLs recorded by the reference photometer (away from the light sources) and the experiment’s photometer in the measurements taken when directly illuminating the observation site (Figure 12). In both cases, there was a decrease in the MDL, which is very significant when the light source was placed 20 m away from the observation site (in this case, the MDL descended to 18.6 mag/arsec2). In view of these results, when designing the illumination of the observation site, it is highly advisable to avoid direct lighting of the area.

4.3.3. Environmental Illumination of the Observation Site

Table 2 shows the MDL in the measurements performed when illuminating the environment of the observation site (Figure 9). The decrease in the MDL in this case is lower than that produced by directly illuminating the area (Figure 12). For an emission distance of 20 m, an MDL of 20.75 mag/arsec2 is achieved, compared to 18.6 mag/arsec2 in Section 4.3.2. This effect is attenuated by increasing the emission distance to 50 m, where the MDL difference between the two configurations is only 0.75 mag/arsec2. Therefore, if a wide illumination of the zone is desired, it is much more favourable to illuminate the environment (Figure 9) instead of directly lighting the area (Figure 7), especially for short-emission distances.

4.3.4. Presence of Light-Shielding Elements in the Proximity of the Observation Site

Figure 13 shows the data obtained during the experimental series carried out in the presence of light-shielding elements near the sensor (Figure 8). The reflection of the light directly impinged the sensor, which caused a significant decrease in the MDL. The slopes of the approach lines are similar in all the set configurations, which implies that the height at which the emitting lamp is placed becomes less relevant when there are reflective elements in the vicinity. Compared to the other experimental series performed, the MDL is significantly lower, so it can be concluded that it is advisable to place the observation site in a clean, free-of-obstacles place, avoiding any object that could reflect the light in the vicinity.

4.3.5. Photometer above the Emission Point

In the experimental series in which the emitting source was located below the observation position (Figure 10), no difference was found between the data recorded by the photometer used in the test series and those recorded by the reference photometer (located far away from the light sources), which implies that by placing the observation site above the light sources, it is possible to avoid the influence of the light sources.

5. Conclusions

This study made it possible to quantify the level of interference that the different lighting parameters (power, height, inclination, distance) represent in the light pollution level in rural areas. From the results, it is concluded that the “distance” variable is critical when achieving a proper visualisation of the starry sky (correlation of 0.418). The variables of “height” and “tilt” are equally correlated with MDL (−0.353 and 0.329, respectively), so these should be considered in second place. The variable of illuminant “power” is the least interfering variable in the observation (−0.115).
In addition, the influence of other factors, such as the Moon presence (MDL decrease of approximately 0.5 to 1.5 mag/arsec2, depending on the configuration setting), environmental illumination of the observation site (decrease of MDL to 20.75 mag/arsec2), and direct illumination of the observation site (decrease of MDL to 18.6 mag/arsec2), which may act as an obstacle to observation, was also evaluated.
Finally, a predictive model was developed to determine the MDL in rural observation areas depending on the different illumination parameters measured.

5.1. Practical Value

The results and conclusions obtained in this study are oriented towards the illumi-nation design near an astronomical observatory in rural areas as light pollution repre-sents a threat to them [4]. Nowadays, there is a growing interest in sky observation, both for scientific purposes and for tourism in rural areas.
On the other hand, environmental light pollution is a serious problem due to the inconvenience it causes. The recommendations provided can help to reduce this level of pollution and reduce the associated inconveniences.
The model developed could help astronomers to predict the level of darkness in the observation area depending on the arrangement of the luminaire, which would also allow measures to be taken to optimise the illumination.
These guidelines and recommendations may also be used to complement similar lighting studies aimed at reducing the light impact on natural protected areas [41,42], historical monuments [39,43], and urban lighting [44,45]. The models developed to predict the level of light pollution can also be applied to several software tools used for lighting optimisation [46].

5.2. Future Research Lines

Once the study has been completed, it is possible to consider new lines of future research to extend or complement the current study. First, the study of the influence of meteorological conditions on the level of light pollution in the area could be considered. This would also make it possible to assess the ability to observe the stars in the area since both factors, the light pollution level and the observing ability, are directly related. Atmospheric parameters such as temperature, humidity, pressure, and cloud conditions should be addressed in this study. Previous studies were found where such an experiment was carried out but these focused on urban areas rather than rural areas (where the level of light pollution is lower). Therefore, the study of meteorological conditions on the level of light pollution in rural areas is vital.
Another possible line of research would be to carry out a study similar to the current one, but in this case, applied to an urban environment. Different cities would be selected according to their number of inhabitants and level of pollution, selecting measurement points located in and around the city. In this way, it would be possible to make a comparison between the two studies and determine guidelines and design advice for optimising urban lighting.
The proposed studies could be promising as the topics addressed (environmental protection and astronomical observations) have become of great importance in today’s society, and interest in them has been increasing in recent years.

5.3. Limitations of the Study

Our work is original in that it is based on the study of lighting conditions in rural environments and there are no specific studies in the literature that deal with such an exploration in rural areas. There are other studies that apply to other natural protected areas [41,42], historical monuments [39,43], and urban lighting [44,45]. There are important differences between the study and experimental approach. Indeed, the main factor of discrepancy is the level of light pollution in the study area. Therefore, the results obtained in the present study are not comparable to those mentioned above.

Author Contributions

Conceptualisation, J.F.G., D.C.-F., M.C.-G. and M.Á.J.-M.; methodology, A.M.-M. and A.B.-R.; software, A.M.-M. and A.B.-R.; validation, A.M.-M.; formal analysis, A.M.-M.; investigation, A.M.-M.; resources, J.F.G., D.C.-F., M.C.-G. and M.Á.J.-M.; data curation, A.M.-M., A.B.-R. and M.Á.J.-M.; writing—original draft preparation, A.M.-M.; writing—review and editing, A.M.-M.; visualisation, J.F.G.; supervision, J.F.G.; project administration, J.F.G., D.C.-F., M.C.-G. and M.Á.J.-M.; funding acquisition, J.F.G., D.C.-F., M.C.-G. and M.Á.J.-M. All authors have read and agreed to the published version of the manuscript.

Funding

This research was funded by the project titled “Overall Strategy for Tourism Development in EUROACE”, 0476_GLOBALTUR_EUROACE_4_E. The funds for this project come from the European Regional Development Fund (ERDF).

Institutional Review Board Statement

Not applicable.

Informed Consent Statement

Not applicable.

Data Availability Statement

Unavailable data due to privacy restriction.

Acknowledgments

We thank the local authorities for their help and attention during the pilot phase. We also thank the GLOBALTUR EUROACE project [37] for their non-financial and financial support.

Conflicts of Interest

The authors declare no conflict of interest.

Appendix A

Appendix A contains the description of the equipment used in the experimental phase.
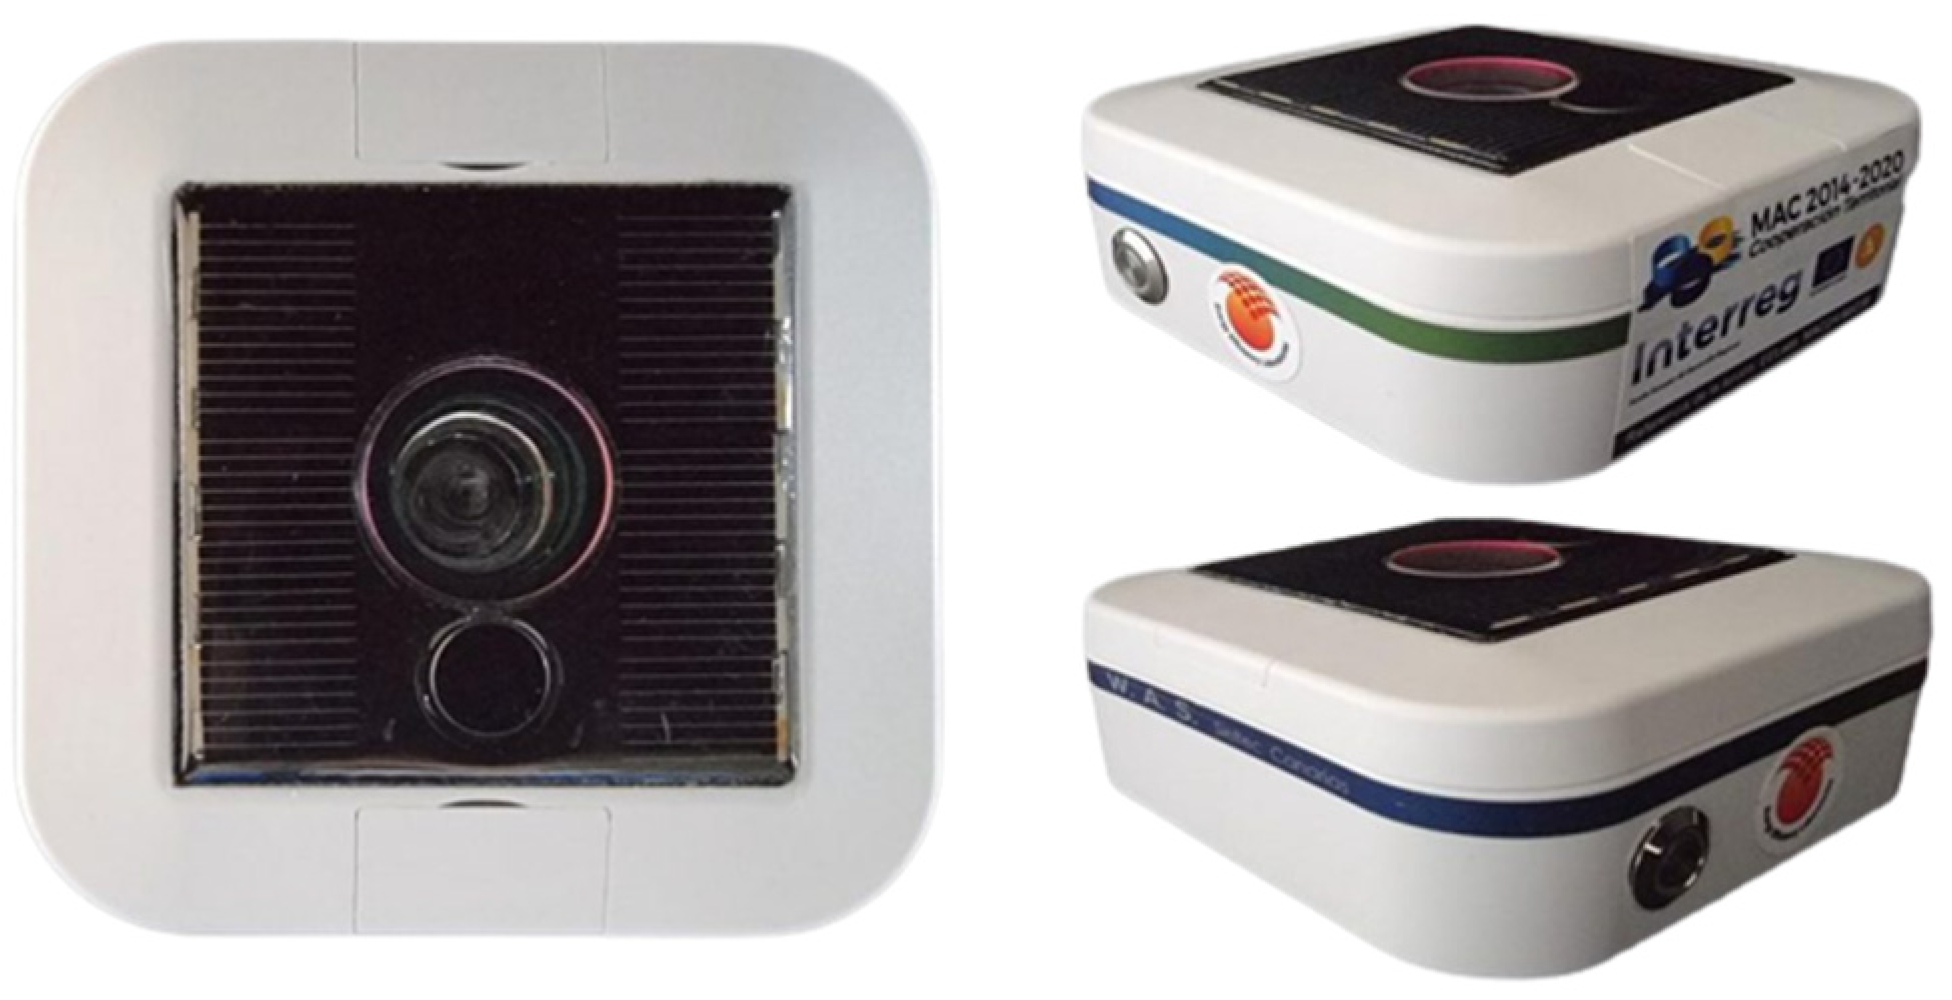
The Sieltec Canarias SKYGLOW V3.1 photometer, shown in Figure A1, was used to determine the reference MDL in the area (without the influence of the experiment’s lighting equipment). It has a wireless connection (Wi-Fi or mobile network), which allows data to be uploaded to a web server for subsequent downloading. Its dimensions are 10 cm × 10 cm × 4 cm, and its weight is 100 g. Additionally, the solar panel on the top of the device allows it to be charged, guaranteeing the autonomy of the equipment. The characterisation and establishment of the device’s parameters were based on the cited study [47].
Figure A1. Sieltec Canarias SKYGLOW V3.1 photometer [48].
Sustainability 15 09359 g0a1
For the experimental series, a mobile weather station was designed to record the atmospheric conditions during the experiment (Figure A2). To guarantee the autonomy of these elements, an external battery was installed together with a photovoltaic solar panel to charge them. The different models selected are detailed below, along with a reference to the manufacturer’s website where their technical characteristics are described.
  • Solar panel: BlueSolar 175 W–12 V Poly [49]
  • Charge controller: BlueSolar PWM Light 12/24 V [50]
  • Inverter: Phoenix 12 I 375 [51]
  • Battery: Gel 12 V–90 A BAT 412800104 [52]
  • Weather station: Davis Vantage Vue + Weatherlink Live [53]
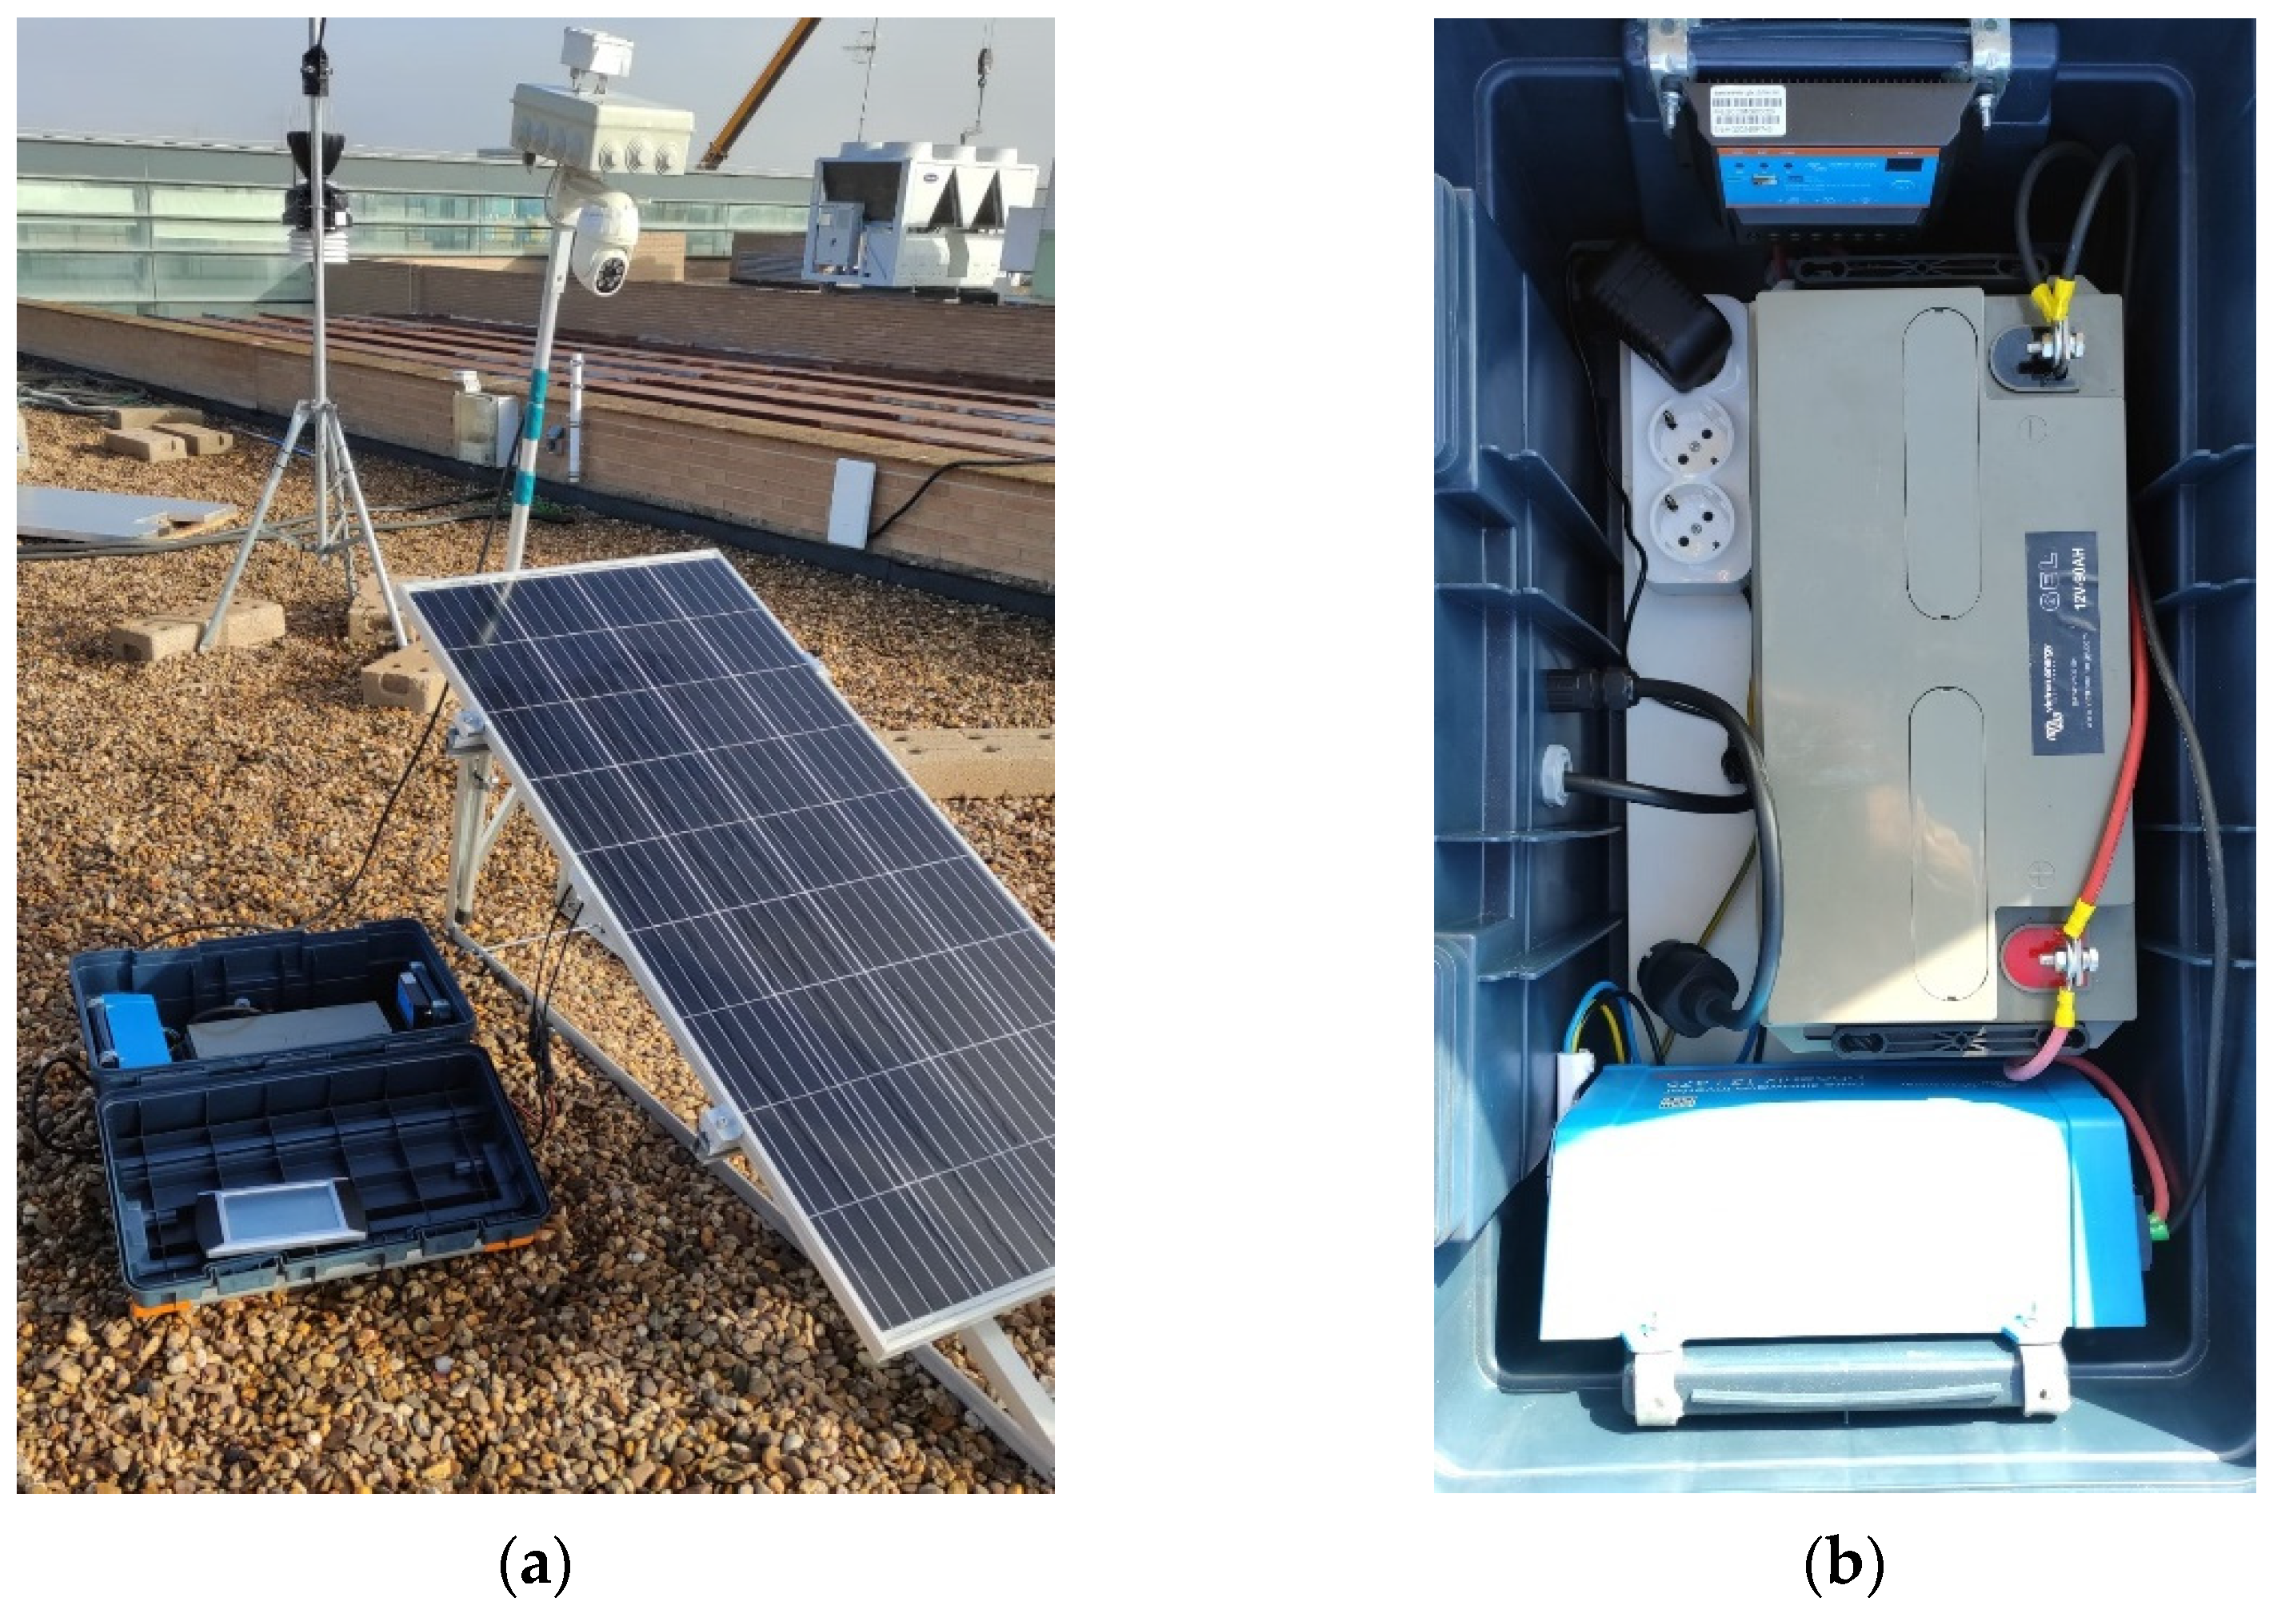
The battery, inverter, and charge controller were placed inside a box to protect them from inclement weather. The whole assembly was placed on a metal structure for its support.
Figure A2. (a) Weather station assembly used in the experimental phase. (b) Inside of the protection box housing the battery, inverter, and charge controller.
Sustainability 15 09359 g0a2
The camera Oculus All Sky camera-Starlight Xpress [54] was used to monitor the night sky (Figure A3). Capturing pictures makes it possible to monitor the position of the stars throughout the night. The camera was used to record the Moon’s relative position in each of the measurements made (Figure A4).
Figure A3. Oculus All Sky camera [54].
Sustainability 15 09359 g0a3
Figure A4. Examples of some of the images taken during the experimental phase. In image (a), an example image of the night sky can be seen. In image (b), the position of the Moon can be seen on the left side of the image.
Sustainability 15 09359 g0a4
To simulate the effect of light pollution, two different lamps were used (Figure A5), the first with a power of 30 W and the second with a power of 60 W, with a lamp temperature of 4800 K and a brightness of 4800 and 7200 lm, respectively. By connecting both lamps simultaneously, a power of 90 W could be achieved. The bracket used allowed variation in the height and inclination of the emitting bulbs. Tilts of 0° and 10° were used in the experimental series. Attached is a link to the website of the supplier of the lamp [55] and reflective panel [56] used during the experimentation.
  • Luminous flux: 4800 lm (30 W)/7200 lm (60 W)
  • Protection rating: IP65
  • Colour: Neutral white
  • Voltage: 230 Volt
  • EU energy label: A+
  • Colour temperature: 5200 K
  • Colour rendering index: 80.00
Figure A5. Lamps used for simulating light pollution.
Sustainability 15 09359 g0a5

Appendix B

Appendix B contains the exact location of the selected measurement points and the light pollution level in each of the three study areas (Figure A6, Figure A7 and Figure A8). The images were obtained from NASA’s Blue Marble navigator [57].
Figure A6. Location and light pollution level in Zarza la Mayor (39.87873, −6.84645).
Sustainability 15 09359 g0a6
Figure A7. Location and light pollution level in Herreruela (39.46199, −6.89838).
Sustainability 15 09359 g0a7
Figure A8. Location and light pollution level in Santiago de Alcántara (39.58176, −7.24536).
Sustainability 15 09359 g0a8

References

  1. Kyba, C.C.M.; Kuester, T.; Sánchez De Miguel, A.; Baugh, K.; Jechow, A.; Hölker, F.; Bennie, J.; Elvidge, C.D.; Gaston, K.J.; Guanter, L. Artificially Lit Surface of Earth at Night Increasing in Radiance and Extent. Sci. Adv. 2017, 3, e1701528. [Google Scholar] [CrossRef] [PubMed] [Green Version]
  2. Falchi, F.; Cinzano, P.; Duriscoe, D.; Kyba, C.C.M.; Elvidge, C.D.; Baugh, K.; Portnov, B.A.; Rybnikova, N.A.; Furgoni, R. The New World Atlas of Artificial Night Sky Brightness. Sci. Adv. 2016, 2, e1600377. [Google Scholar] [CrossRef] [PubMed] [Green Version]
  3. de Miguel, A.S.; Bennie, J.; Rosenfeld, E.; Dzurjak, S.; Gaston, K.J. First Estimation of Global Trends in Nocturnal Power Emissions Reveals Acceleration of Light Pollution. Remote Sens. 2021, 13, 3311. [Google Scholar] [CrossRef]
  4. Green, R.F.; Luginbuhl, C.B.; Wainscoat, R.J.; Duriscoe, D. The Growing Threat of Light Pollution to Ground-Based Observatories. Astron. Astrophys. Rev. 2022, 30, 1. [Google Scholar] [CrossRef]
  5. Tsao, J.Y.; Saunders, H.D.; Creighton, J.R.; Coltrin, M.E.; Simmons, J.A. Solid-State Lighting: An Energy-Economics Perspective. J. Phys. D Appl. Phys. 2010, 43, 354001. [Google Scholar] [CrossRef]
  6. Owens, A.C.S.; Lewis, S.M. The Impact of Artificial Light at Night on Nocturnal Insects: A Review and Synthesis. Ecol. Evol. 2018, 8, 11337–11358. [Google Scholar] [CrossRef] [Green Version]
  7. Owens, A.C.S.; Cochard, P.; Durrant, J.; Farnworth, B.; Perkin, E.K.; Seymoure, B. Light Pollution Is a Driver of Insect Declines. Biol. Conserv. 2020, 241, 108259. [Google Scholar] [CrossRef]
  8. Mcdonnell, M.J.; Hahs, A.H.; Breuste, J.H. Chapter 15. Light Pollution and the Impact of Artificial Night Lighting on Insects; Cambridge University Press: Cambridge, UK, 2009. [Google Scholar]
  9. Altermatt, F.; Ebert, D. Reduced Flight-to-Light Behaviour of Moth Populations Exposed to Long-Term Urban Light Pollution. Biol. Lett. 2016, 12, 20160111. [Google Scholar] [CrossRef] [Green Version]
  10. Knop, E.; Zoller, L.; Ryser, R.; Gerpe, C.; Hörler, M.; Fontaine, C. Artificial Light at Night as a New Threat to Pollination. Nature 2017, 548, 206–209. [Google Scholar] [CrossRef]
  11. Light Pollution Effects on Wildlife and Ecosystems. Available online: https://www.darksky.org/light-pollution/wildlife/ (accessed on 16 December 2022).
  12. Hölker, F.; Wolter, C.; Perkin, E.K.; Tockner, K. Light Pollution as a Biodiversity Threat. Trends Ecol. Evol. 2010, 25, 681–682. [Google Scholar] [CrossRef]
  13. Gaston, K.J.; Bennie, J.; Davies, T.W.; Hopkins, J. The Ecological Impacts of Nighttime Light Pollution: A Mechanistic Appraisal. Biol. Rev. 2013, 88, 912–927. [Google Scholar] [CrossRef]
  14. Gaston, K.J.; Visser, M.E.; Hölker, F. The Biological Impacts of Artificial Light at Night: The Research Challenge. Philos. Trans. R. Soc. B Biol. Sci. 2015, 370, 20140133. [Google Scholar] [CrossRef] [Green Version]
  15. Grubisic, M.; Haim, A.; Bhusal, P.; Dominoni, D.M.; Gabriel, K.M.A.; Jechow, A.; Kupprat, F.; Lerner, A.; Marchant, P.; Riley, W.; et al. Light Pollution, Circadian Photoreception, and Melatonin in Vertebrates. Sustainability 2019, 11, 6400. [Google Scholar] [CrossRef] [Green Version]
  16. Las Medidas Del Gobierno Para Reducir Hasta Un 13.5% El Consumo de Gas; Agencia EFE: 2022. Available online: https://efe.com/economia/2022-10-11/gobierno-aprueba-plan-contingencia-energetica/ (accessed on 16 December 2022).
  17. Ściężor, T. Effect of Street Lighting on the Urban and Rural Night-Time Radiance and the Brightness of the Night Sky. Remote Sens. 2021, 13, 1654. [Google Scholar] [CrossRef]
  18. Espey, B.R. Empirical Modelling of Public Lighting Emission Functions. Remote Sens. 2021, 13, 3827. [Google Scholar] [CrossRef]
  19. Kyba, C.C.M.; Ruby, A.; Kuechly, H.U.; Kinzey, B.; Miller, N.; Sanders, J.; Barentine, J.; Kleinodt, R.; Espey, B. Direct Measurement of the Contribution of Street Lighting to Satellite Observations of Nighttime Light Emissions from Urban Areas. Light. Res. Technol. 2021, 53, 189–211. [Google Scholar] [CrossRef]
  20. Zielińska-Dabkowska, K.M.; Xavia, K.; Bobkowska, K. Assessment of Citizens’ Actions against Light Pollution with Guidelines for Future Initiatives. Sustainability 2020, 12, 4997. [Google Scholar] [CrossRef]
  21. Pothukuchi, K. City Light or Star Bright: A Review of Urban Light Pollution, Impacts, and Planning Implications. J. Plan Lit. 2021, 36, 155–169. [Google Scholar] [CrossRef]
  22. Brons, J.A.; Bullough, J.D.; Rea, M.S. Outdoor Site-Lighting Performance: A Comprehensive and Quantitative Framework for Assessing Light Pollution. Light. Res. Technol. 2008, 40, 201–224. [Google Scholar] [CrossRef]
  23. Isobe, S.; Hamamura, S. Light Pollution and Its Energy Loss. Astrophys. Space Sci. 2000, 273, 289–294. [Google Scholar] [CrossRef]
  24. Gocova, A. The Night Issue. Alternat. J. 2013, 39, 5. [Google Scholar]
  25. Outdoor Lighting Basics. Available online: https://www.darksky.org/our-work/lighting/lighting-for-citizens/lighting-basics/ (accessed on 16 December 2022).
  26. Jägerbrand, A.K. New Framework of Sustainable Indicators for Outdoor LED (Light Emitting Diodes) Lighting and SSL (Solid State Lighting). Sustainability 2015, 7, 1028–1063. [Google Scholar] [CrossRef] [Green Version]
  27. Barentine, J.C.; Walker, C.E.; Kocifaj, M.; Kundracik, F.; Juan, A.; Kanemoto, J.; Monrad, C.K. Skyglow Changes over Tucson, Arizona, Resulting from a Municipal LED Street Lighting Conversion. J. Quant. Spectrosc. Radiat. Transf. 2018, 212, 10–23. [Google Scholar] [CrossRef] [Green Version]
  28. Das, N.; Pal, N.; Pradip, S.K. Economic Cost Analysis of LED over HPS Flood Lights for an Efficient Exterior Lighting Design Using Solar PV. Build Env. 2015, 89, 380–392. [Google Scholar] [CrossRef]
  29. Yoomak, S.; Jettanasen, C.; Ngaopitakkul, A.; Bunjongjit, S.; Leelajindakrairerk, M. Comparative Study of Lighting Quality and Power Quality for LED and HPS Luminaires in a Roadway Lighting System. Energy Build 2018, 159, 542–557. [Google Scholar] [CrossRef]
  30. Garstang, R.H. Night sky brightness at observatories and sites. Publ. Astron. Soc. Pac. 1989, 101, 306. [Google Scholar] [CrossRef]
  31. Riegel, K.W. Light Pollution. Science 1973, 179, 1285–1291. [Google Scholar] [CrossRef]
  32. Cayrel, R. 50. Identification and Protection of Existing and Potential Observatory Sites. Trans. Int. Astron. Union 1979, 17, 215–223. [Google Scholar] [CrossRef] [Green Version]
  33. Aubé, M.; Fortin, N.; Turcotte, S.; García, B.; Mancilla, A.; Maya, A.J. Evaluation of the Sky Brightness at Two Argentinian Astronomical Sites. Publ. Astron. Soc. Pac. 2014, 126, 1068–1077. [Google Scholar] [CrossRef] [Green Version]
  34. Sefako, R. Session 21.3-Radio and Optical Site Protection. In Proceedings of the International Astronomical Union; Cambridge University Press: Cambridge, UK, 2015; Volume 11, pp. 453–462. [Google Scholar]
  35. Green, R.F. Light Pollution and Protecting Astronomical Sites in China. In Proceedings of the International Astronomical Union; Cambridge University Press: Cambridge, MA, USA, 2012; Volume 10, p. 757. [Google Scholar]
  36. Karttunen, H.; Kröger, P.; Oja, H.; Poutanen, M.; Donner, K.J. Fundamental Astronomy, 5th ed.; Ursa: Helsinki, Finland, 2007; ISBN 978-3-540-34144-4. [Google Scholar]
  37. Interreg GLOBALTUR EUROACE. Available online: https://globaltur.eu/ (accessed on 16 December 2022).
  38. Diputación Provincial de Cáceres Astronomía En Tajo Internacional—Guía Práctica Para Ver Las Estrellas. Available online: https://turismotajointernacional.es/wp-content/uploads/2021/05/Astronomia-en-Tajo-Internacional-Guia-practica-para-ver-las-estrellas.pdf (accessed on 27 January 2023).
  39. Kobav, M.B.; Eržen, M.; Bizjak, G. Sustainable Exterior Lighting for Cultural Heritage Buildings and Monuments. Sustainability 2021, 13, 10159. [Google Scholar] [CrossRef]
  40. IBM SPSS. Available online: https://www.ibm.com/es-es/spss (accessed on 16 December 2022).
  41. Papalambrou, A.; Doulos, L.T. Identifying, Examining, and Planning Areas Protected from Light Pollution. The Case Study of Planning the First National Dark Sky Park in Greece. Sustainability 2019, 11, 5963. [Google Scholar] [CrossRef] [Green Version]
  42. Zielinska-Dabkowska, K.M.; Xavia, K. Looking up to the Stars. A Call for Action to Save New Zealand’s Dark Skies for Future Generations to Come. Sustainability 2021, 13, 13472. [Google Scholar] [CrossRef]
  43. Bista, D.; Bista, A.; Shrestha, A.; Doulos, L.T.; Bhusal, P.; Zissis, G.; Topalis, F.; Chhetri, B.B. Lighting for Cultural and Heritage Site: An Innovative Approach for Lighting in the Distinct Pagoda-Style Architecture of Nepal. Sustainability 2021, 13, 2720. [Google Scholar] [CrossRef]
  44. Fotios, S.; Gibbons, R. Road Lighting Research for Drivers and Pedestrians: The Basis of Luminance and Illuminance Recommendations. Light. Res. Technol. 2018, 50, 154–186. [Google Scholar] [CrossRef]
  45. Tabaka, P.; Rozga, P. Influence of a Light Source Installed in a Luminaire of Opal Sphere Type on the Effect of Light Pollution. Energies 2020, 13, 306. [Google Scholar] [CrossRef] [Green Version]
  46. Carli, R.; Dotoli, M.; Pellegrino, R. A Decision-Making Tool for Energy Efficiency Optimization of Street Lighting. Comput. Oper. Res. 2018, 96, 223–235. [Google Scholar] [CrossRef]
  47. Alarcon, M.R.; Puig-Subirà, M.; Serra-Ricart, M.; Lemes-Perera, S.; Mallorquín, M.; López, C. SG-WAS: A New Wireless Autonomous Night Sky Brightness Sensor. Sensors 2021, 21, 5590. [Google Scholar] [CrossRef]
  48. Solar Panel BlueSolar 175W—12V Poly. Available online: https://www.victronenergy.com.es/solar-pv-panels/bluesolar-panels (accessed on 26 January 2023).
  49. Charge Controller BlueSolar PWM Light 12/24V. Available online: https://www.victronenergy.com.es/solar-charge-controllers/bluesolar-pwm (accessed on 26 January 2023).
  50. Inversor Phoenix 12 I 375. Available online: https://www.victronenergy.com.es/upload/documents/Datasheet-Phoenix-Inverter-VE.Direct-250VA-1200VA-ES.pdf (accessed on 26 January 2023).
  51. Gel Battery 12V-90A BAT 412800104. Available online: https://www.victronenergy.com.es/batteries/gel-and-agm-batteries (accessed on 26 January 2023).
  52. Davis Vantage Vue + Weatherlink Live. Available online: https://www.estacionesdavis.es/es/davis-vantage-vue/84-pack-davis-vantage-vue-weatherlink-live.html (accessed on 26 January 2023).
  53. Sieltec Canarias SKYGLOW V3.1. Available online: https://www.sieltec.es/2022/07/20/proyecto-de-desarrollo-experimental-skyglow/ (accessed on 27 January 2023).
  54. Oculus All Sky Camera—Starlight Xpress. Available online: https://www.sxccd.com/product/oculus-all-sky-camera-180/ (accessed on 27 January 2023).
  55. LEDKIA LIGHTING LED IP65 HE Slim PRO 4800K—5200K. Available online: https://www.amazon.es/LEDKIA-LIGHTING-Proyector-Exterior-Regulable/dp/B09FZJJJ18/ (accessed on 27 January 2023).
  56. Panel reflector Walimex 50 × 200 cm. Available online: https://www.amazon.es/Walimex-rollbares-Reflektor-panel-150x200cm/dp/B0074ECRSS/ (accessed on 27 January 2023).
  57. NASA “Blue Marble” Navigator. Available online: https://blue-marble.de/nightlights/2022 (accessed on 16 December 2022).
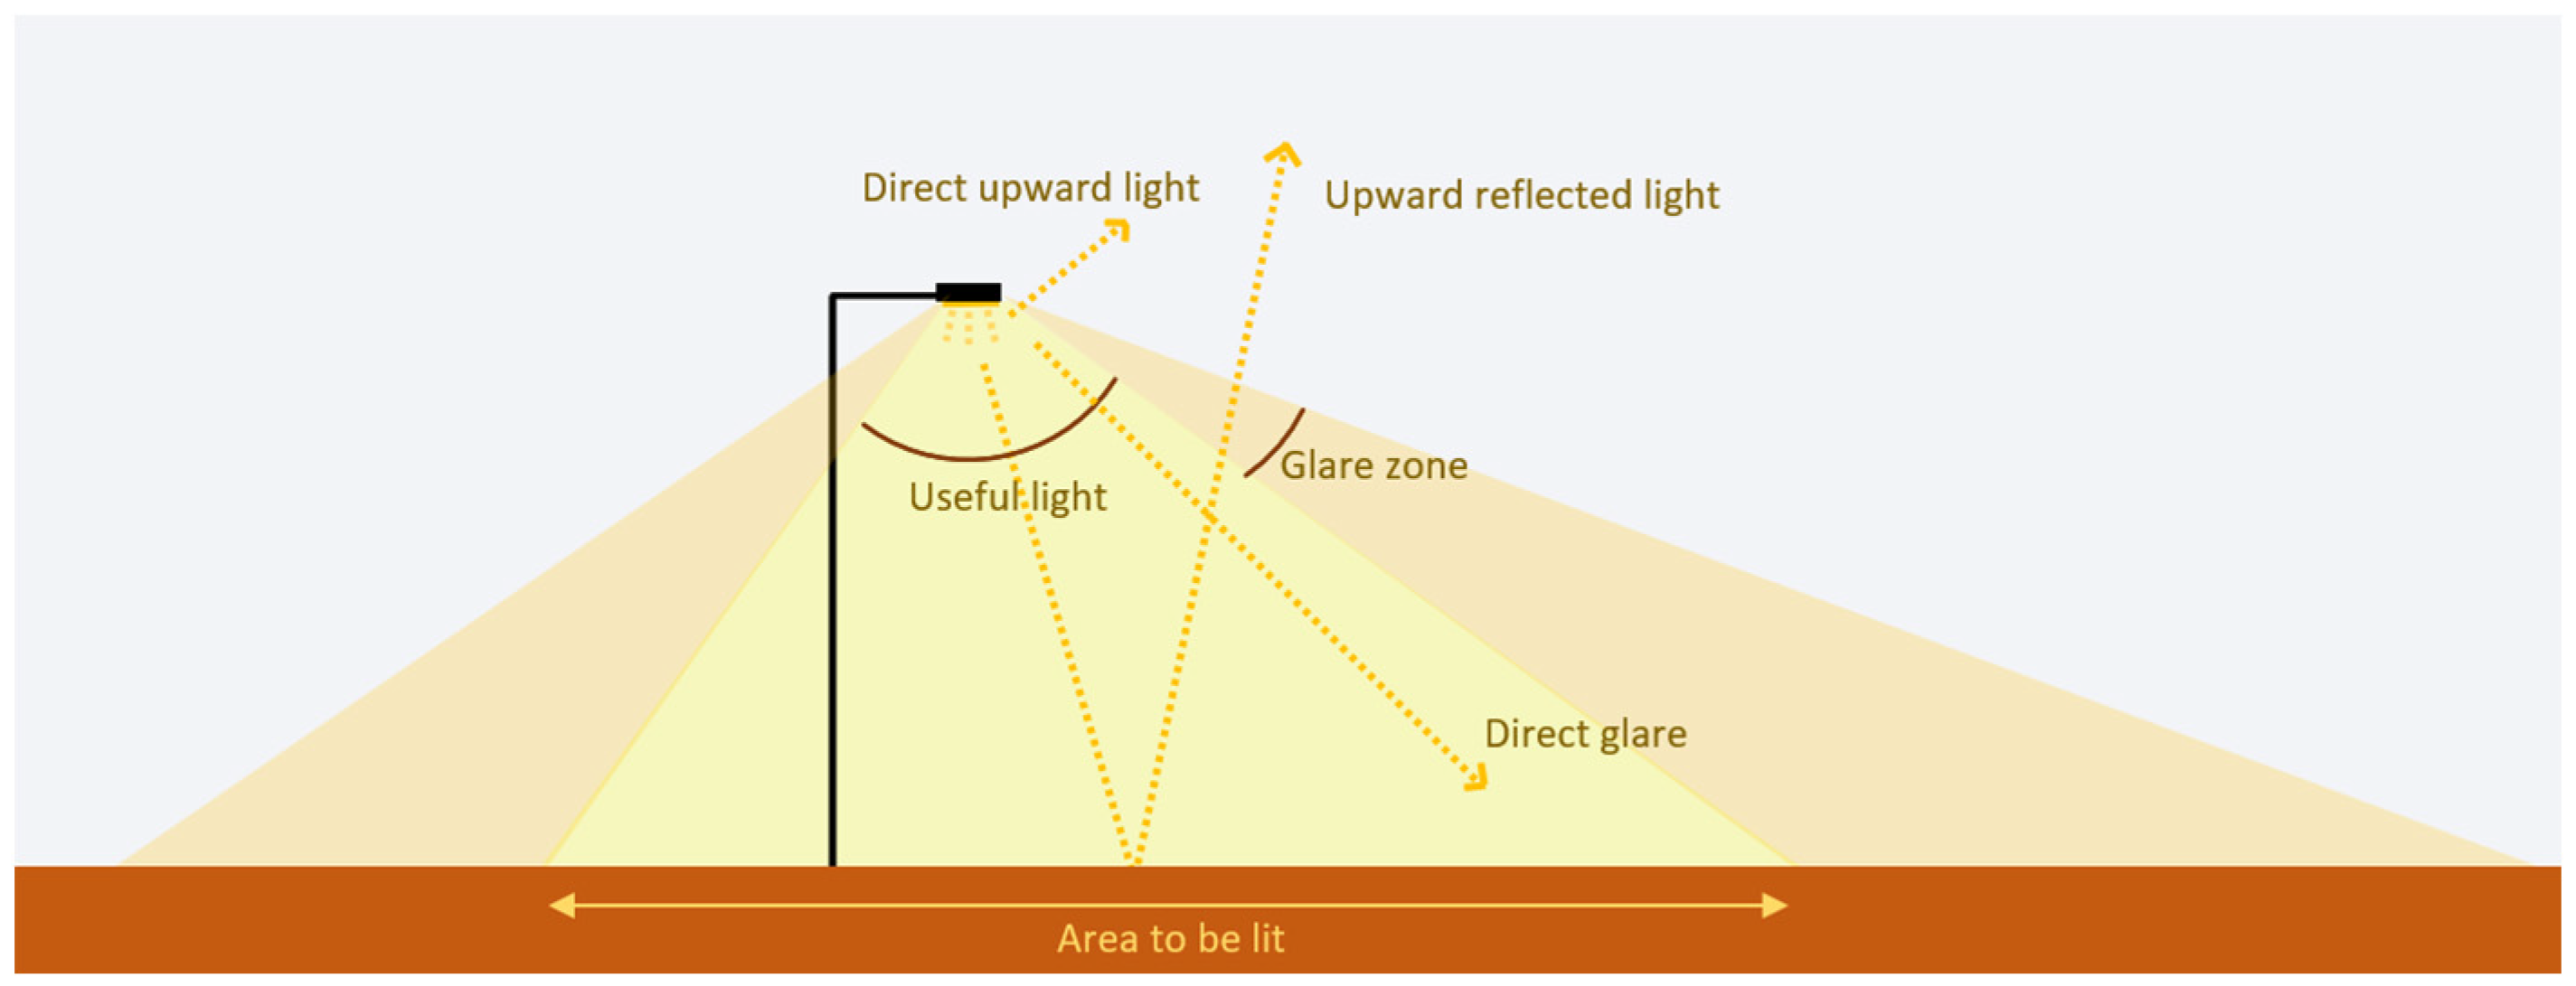
Figure 1. Components of night-time light pollution, based on [24].
Sustainability 15 09359 g001
Figure 2. Perceptibility of visible stars as night-time brightness increases, based on [4].
Sustainability 15 09359 g002
Figure 3. Geographical location of the Tagus International biosphere reserve [38].
Sustainability 15 09359 g003
Figure 4. Emission heights used in the study. The two heights of 0.7 m (a) and 1.6 m (b) are shown.
Sustainability 15 09359 g004
Figure 5. Emission inclinations used in the study. The two inclinations of 0° (a) and 10° (b) are shown.
Sustainability 15 09359 g005
Figure 6. Distances from the emission point to the observation site (0). The three distances of 3 m (a), 7 m (b) and 11 m (c) are shown.
Sustainability 15 09359 g006
Figure 7. Direct illumination of the observation site. The two distances of 20 m (a) and 50 m (b) are shown.
Sustainability 15 09359 g007
Figure 8. Placement of reflective screen next to the sensor. The two distances of 3 m (a) and 7 m (b) are shown.
Sustainability 15 09359 g008
Figure 9. Ambient illumination of the observation area. The two distances of 20 m (a) and 50 m (b) are shown.
Sustainability 15 09359 g009
Figure 10. Location of the emitting source below the observation site. The three distances of 3 m (a), 7 m (b) and 11 m (c) are shown.
Sustainability 15 09359 g010
Figure 11. MDL in the configurations horizontal up (a), horizontal down (b), tilted up (c), and tilted down (d) for a distance of 3 m from the emitting source.
Sustainability 15 09359 g011
Figure 12. MDL in the configurations horizontal up (a), horizontal down (b), tilted up (c), and tilted down (d) for a distance of 7 m from the emitting source.
Sustainability 15 09359 g012
Figure 13. MDL in the horizontal up (a) and inclined up (b) configurations for a distance of 11 m from the emitting source. The values corresponding to the down position were discarded as no influence on MDL was found.
Sustainability 15 09359 g013
Figure 14. MDL when using direct and ambient illumination of the observation site.
Sustainability 15 09359 g014
Figure 15. MDL in the presence of light shielding elements in the proximity of the sensor.
Sustainability 15 09359 g015
Figure 16. Marginal mean of MDL compared with the distance from the emitting source.
Sustainability 15 09359 g016
Figure 17. Marginal mean of MDL compared with the height of the emitting source.
Sustainability 15 09359 g017
Figure 18. Marginal mean of MDL compared with the inclination of the emitting light source.
Sustainability 15 09359 g018
Figure 19. Representation of the quadratic and linear models concerning the real MDL.
Sustainability 15 09359 g019
Table 1. MDL during direct illumination of the observation site.
DistanceExperimental Value
(mag/arcsec2)
Reference Value
(mag/arcsec2)
20 m18.6521.06
50 m20.4321.04
Table 2. MDL during ambient illumination of the observation site.
DistanceExperimental Value
(mag/arcsec2)
Reference Value
(mag/arcsec2)
20 m20.7821.00
50 m21.0521.07
Table 3. Analysis of variance (ANOVA) of the experimental results.
OriginType III of
Sum of Squares
Degrees of FreedomRoot Mean SquareFSig.
Corrected model121.047 a620.17516.9320.000
Interception27,925.917127,925.91723,438.1000.000
Power3.06921.5341.2880.281
Distance65.014232.50727.2830.000
Height50.110150.11042.0570.000
Inclination28.905128.90524.2600.000
Error106.041891.191
Total38,279.47996
Total corrected227.08895
a R-squared = 0.533 (Adjusted R-squared = 0.502).
Table 4. Pearson correlation matrix of the results obtained in the experiment. The variables marked with two asterisks “**” have a significance level of 1%.
MDLPowerDistanceHeightInclination
MDL1−0.1150.418 **−0.353 **0.329 **
Power−0.1151000
DistancE0.418 **010.236−0.044
Height−0.353 **00.23610
Inclination0.329 **0−0.04401
Table 5. Parameter estimates of the linear approximation.
ParameterEstimateStandard ErrorLower Bound aUpper Bound a
a023.8600.96021.95225.769
a1−5.257 × 10−50.0000.0000.000
a2−0.2840.134−0.551−0.017
a3−4.4930.662−5.810−3.176
a40.0130.064−0.1140.140
a51.506 × 10−50.000−2.635 × 10−63.275 × 10−5
a6−9.024 × 10−50.0000.0002.617 × 10−5
a74.281 × 10−60.000−5.586 × 10−61.415 × 10−5
a80.4460.0750.2970.595
a9−0.0380.005−0.049−0.027
a100.2270.0350.1570.297
a 95% confidence interval.
Table 6. Parameter estimates of the quadratic approximation.
ParameterEstimateStandard ErrorLower Bound aUpper Bound a
a019.3670.00019.36719.367
a15.286 × 10−50.035−0.0700.070
a20.1020.0060.0890.114
a31.0000.0150.9701.030
a41.0000.0001.0001.000
a52.606 × 10−50.203−0.4030.403
a60.0000.0000.0000.000
a78.777 × 10−61.369−2.7232.723
a80.1540.087−0.0190.326
a9−0.0340.000−0.034−0.034
a100.1860.0000.1860.186
a111.066 × 10−80.000−0.0010.001
a12−0.0070.000−0.007−0.007
a 95% confidence interval.
Disclaimer/Publisher’s Note: The statements, opinions and data contained in all publications are solely those of the individual author(s) and contributor(s) and not of MDPI and/or the editor(s). MDPI and/or the editor(s) disclaim responsibility for any injury to people or property resulting from any ideas, methods, instructions or products referred to in the content.