
Status and Perspectives of the Ichthyofauna of the Labudovo okno Ramsar Site: An Analysis of 14 Years of Data

 ,
, 
 , and
, and
Abstract
1. Introduction
2. Materials and Methods
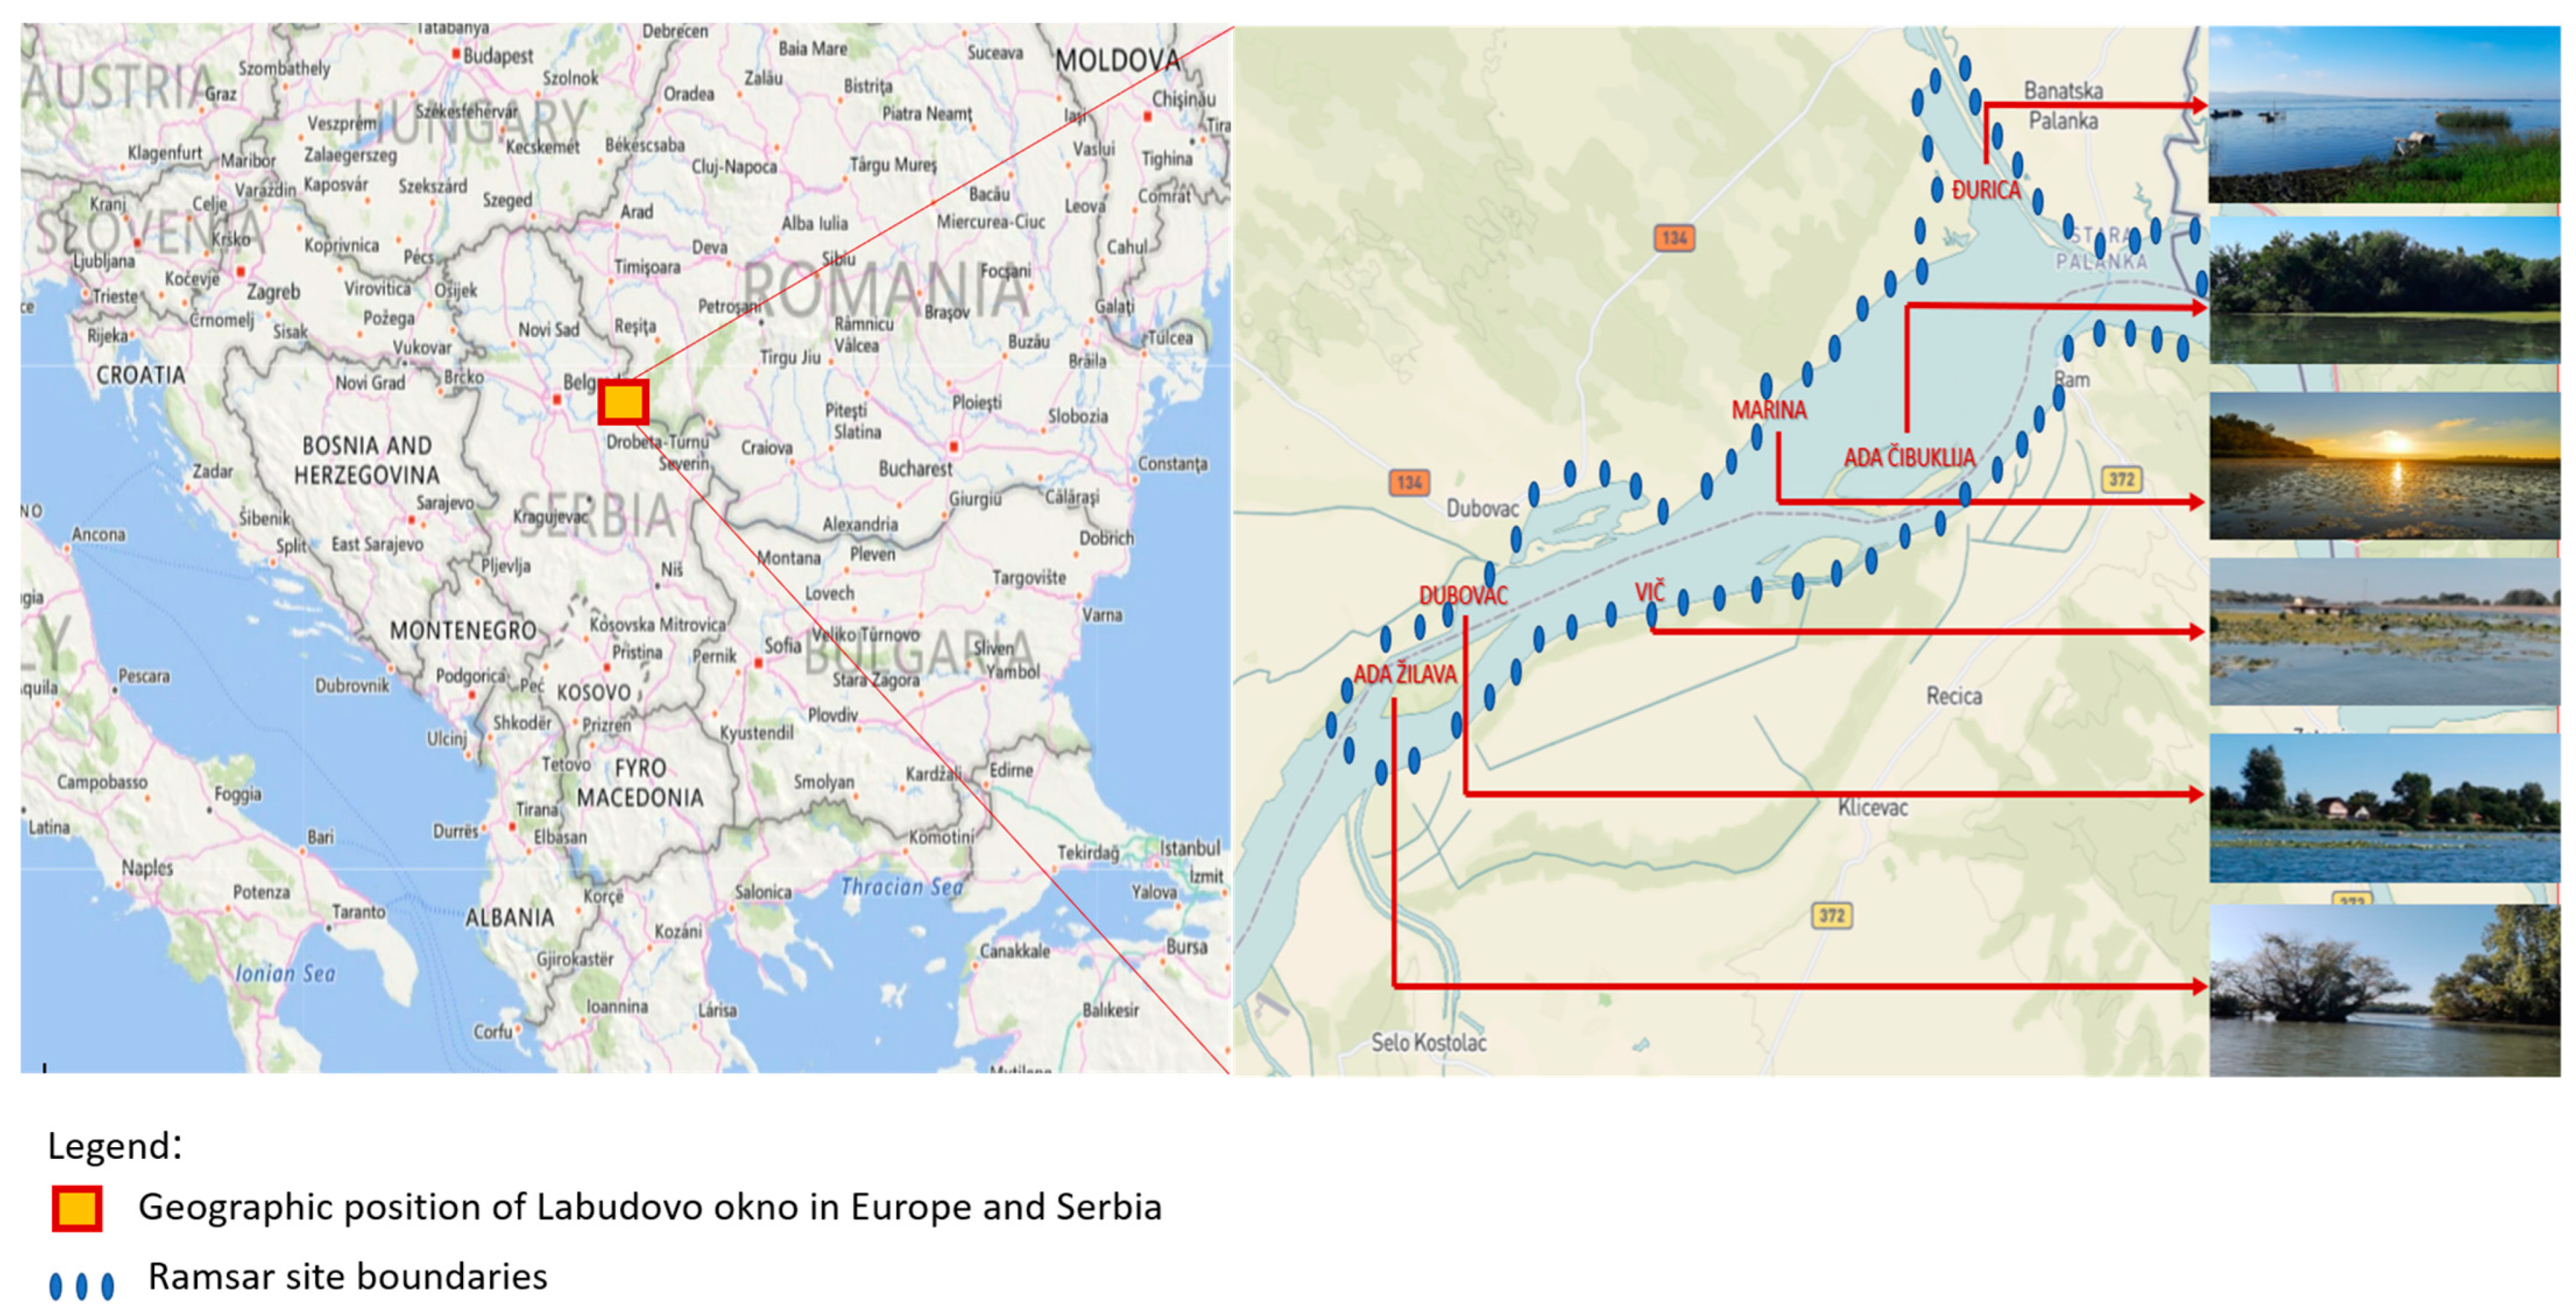
2.1. Sampling Area
- (a)
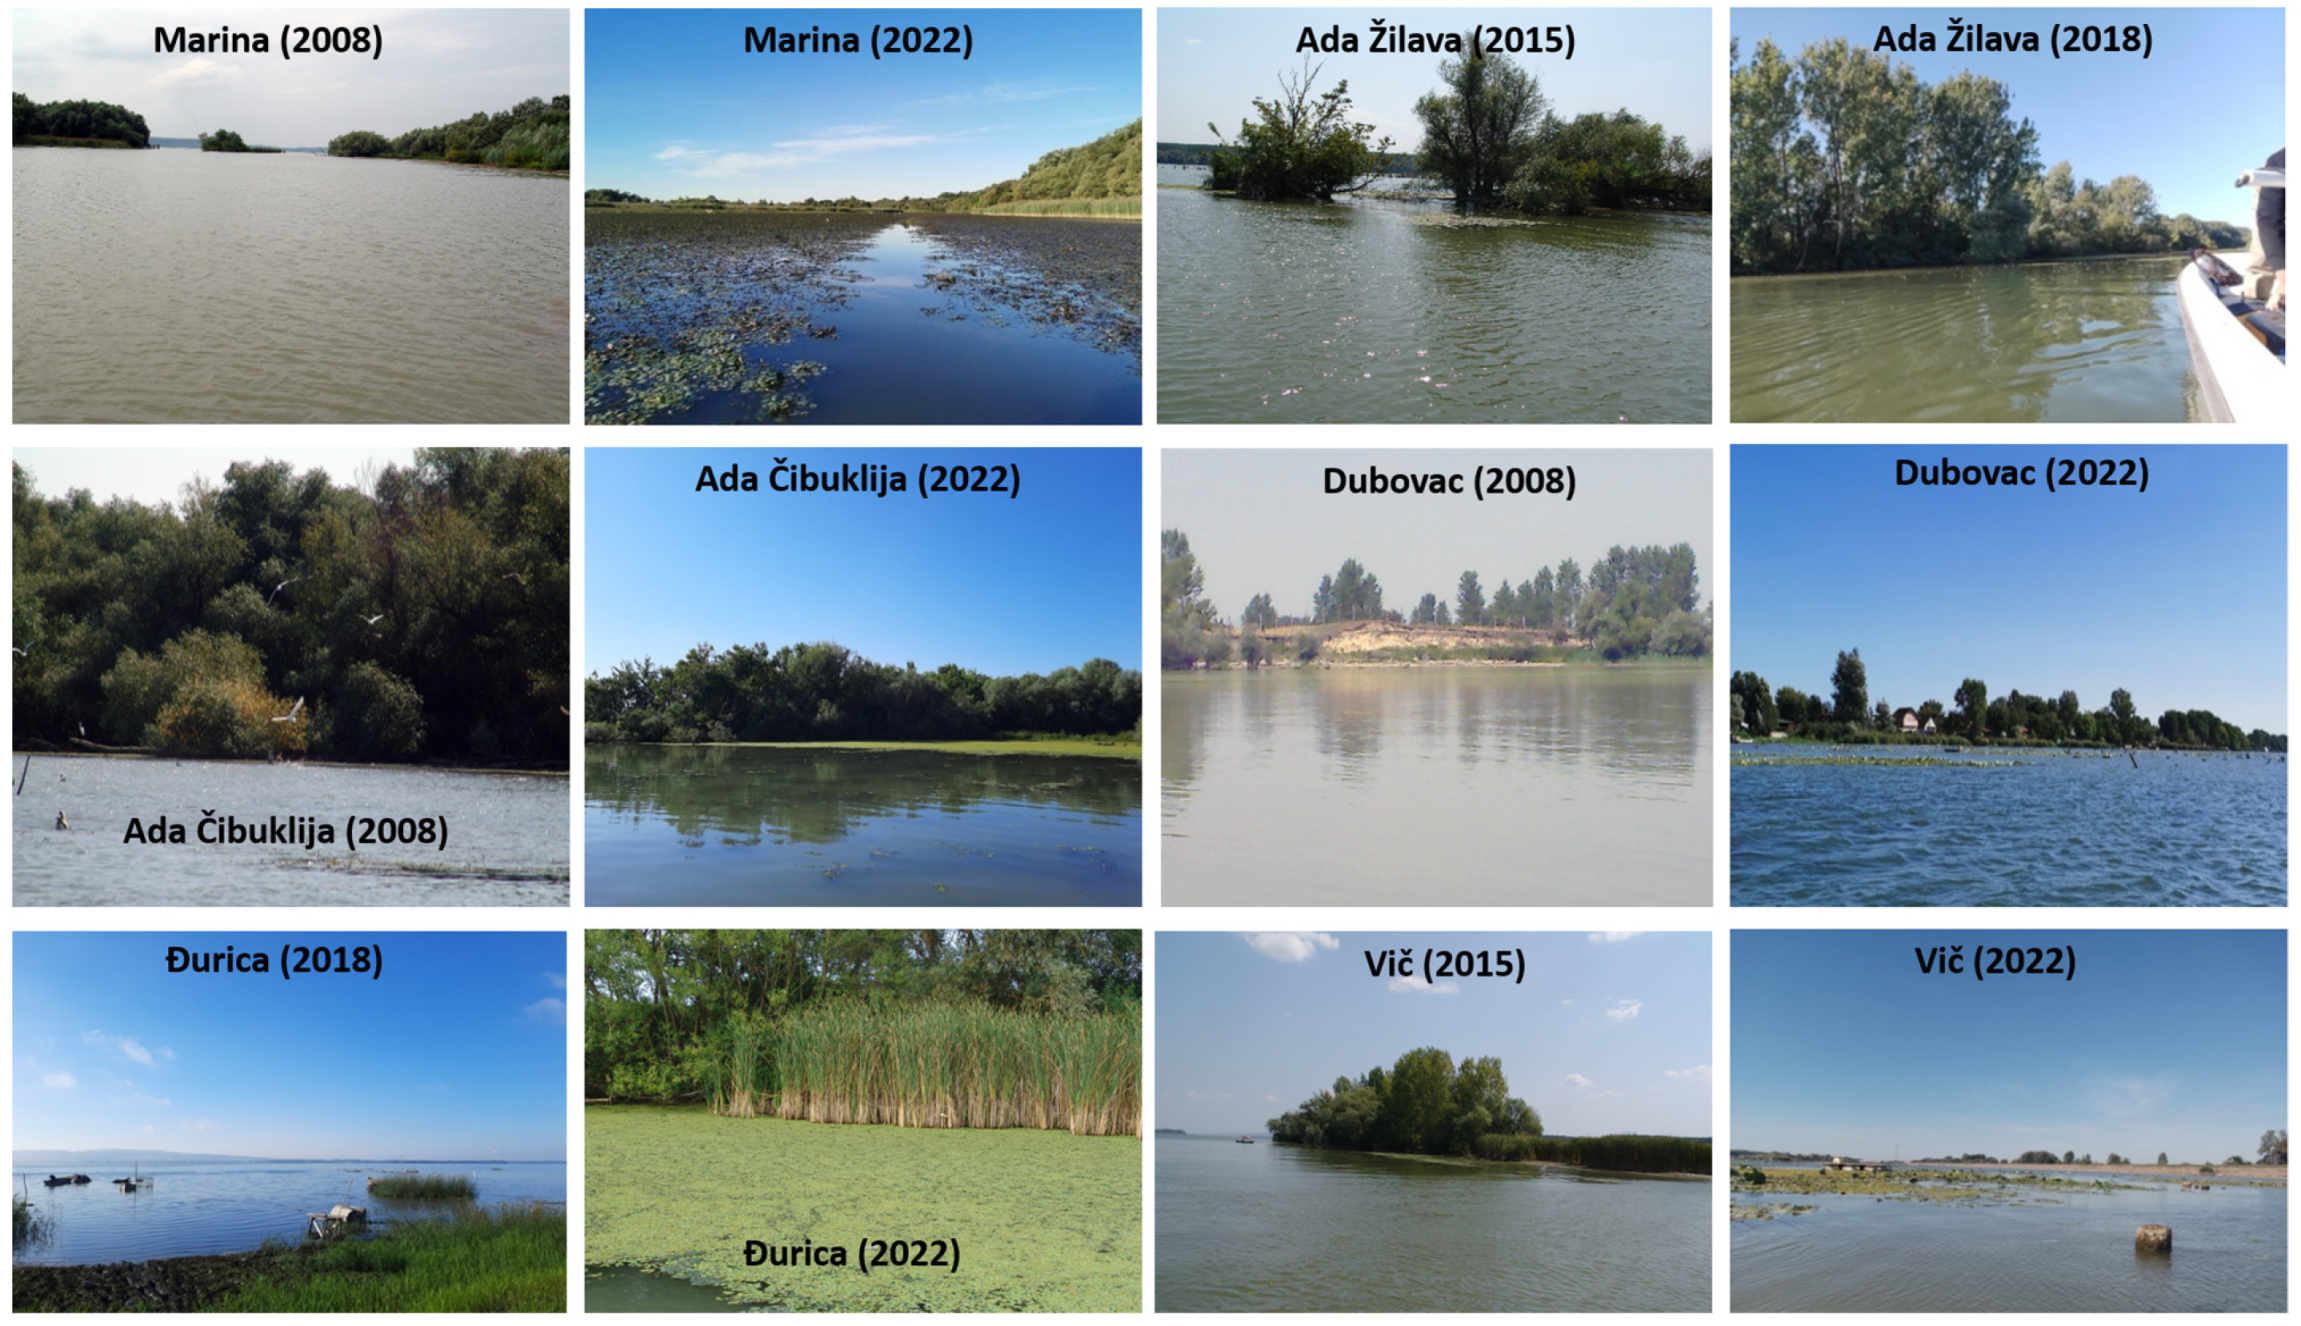
- Site Marina: elevation 60–70 m, GPS 44°48′49″ N 21°16′51″ E. The Marina Channel is in a permanently flooded area on its left bank (1082.5–1078 R-km). The channel is 4.5 km long and about 100 m wide, most of which is at about 65 m above sea level. It is almost completely covered with submerged and floating macrophytes such as Potamogeton perfoliatus, Ceratophylum demersum (the dominant species), Trapa natans, etc. The substrate is muddy and exhibits coarse sedimentation. The trophic composition based on macrophytic vegetation can be described as eutrophic [8,14].
- (b)
- Site Ada Žilava: elevation about 65 m, GPS 44°46′34″ N 21°12′04″ E. The length of the islet is about 2.5 km, and the width is about 1.3 km. The community is mesotrophic to eutrophic and dominated by macrophytes of the genera Potamogeton, Salvinia, and Naias. Cyperus glomeratus and Scirpus lacustris are abundant in the Ada Žilava itself [8,14].
- (c)
- Site Vič: elevation about 70 m, GPS 44°47′35″ N 21°14′55″ E. Geological basis is white, yellow, brown, grey, or black carbonate sand of eolian origin, slightly alkaline reaction. The course of the Danube in this area has the characteristics of a typical potamon. Biocoenosis is eutrophic and dominated by floating and submerged plants [8,14].
- (d)
- Site Đurica: elevation 65 m, GPS 44°50′42″ N 21°18′14″ E. It is characterized by a large area of emergent vegetation (23% of the heath), consisting of typical groups of marsh plants (helophytes). Among the macrophytes, broadleaf cattails (Typha latifolia), reeds (Phragmites australis), and sweet flags (Acorus calamus) dominate on the coast, and Ceratophylidae and Parvopotamidae in the water area. The trophic composition based on macrophytic vegetation can be described as eutrophic [8,14].
- (e)
- Site Ada Čibuklija: elevation ca. 65 m, GPS 44°48′29″ N 21°18′11″ E. It is a floodplain of the Danube near Banatska Palanka. This wetland is elongated, about 4 km long. It is a highly eutrophic community with a high proportion of emergent and submerged macrophytic vegetation consisting of Potamogeton spp., Ceratophylum demersum, C. submersum, and Trapa. natans, Azolla filicauloides, and Lemna sp. [8,14].
- (f)
- Site Dubovac: elevation about 70 m, GPS 44°47′23″ N 21°12′43″ E. The substrate is sandy, fine-grained, and silty, with humus and clay. The macrophyte community structure includes submerged species (Potamogeton crispus, Potamogeton perfoliatus) and floating plants dominated by Trapa natans, Nymphaea alba, and Nuphar luteum. The trophic composition based on macrophytic vegetation can be described as mesotrophic and eutrophic [8,14].
2.2. Sampling, Data Collection and Data Analysis
3. Results
4. Discussion
5. Conclusions
Author Contributions
Funding
Institutional Review Board Statement
Informed Consent Statement
Data Availability Statement
Acknowledgments
Conflicts of Interest
References
- UN Water. Coping with Water Scarcity—Challenge of the Twenty-First Century; FAO: Rome, Italy, 2007. [Google Scholar]
- Grizzetti, B.; Lanzanova, D.; Liquete, C.; Reynaud, A.; Cardoso, A.C. Assessing water ecosystem services for water resource management. Environ. Sci. Policy 2016, 61, 194–203. [Google Scholar] [CrossRef]
- Simonović, P.; Povž, M.; Piria, M.; Treer, T.; Adrović, A.; Škrijelj, R.; Nikolić, V.; Simić, V. Ichthyofauna of the River Sava System. In The Sava River; Milačić, R., Ščančar, J., Paunović, M., Eds.; The Handbook of Environmental Chemistry; Springer: Berlin/Heidelberg, Germany, 2015; Volume 31, pp. 361–400. [Google Scholar]
- Boretti, A.; Rosa, L. Reassessing the projections of the World Water Development Report. NPJ Clean Water 2019, 2, 15. [Google Scholar] [CrossRef]
- Cosgrove, W.J.; Rijsberman, F.R. World Water Vision: Making Water Everybody’s Business; Earthscan Publications Ltd.: London, UK, 2000. [Google Scholar]
- Gell, P.A.; Finlayson, C.M.; Davidson, N.C. Understanding change in the ecological character of Ramsar wetlands: Perspectives from a deeper time—Synthesis. Mar. Freshw. Res. 2016, 67, 869–879. [Google Scholar] [CrossRef]
- Brun, P.; Zimmermann, N.E.; Graham, C.H.; Lavergne, S.; Pellissier, L.; Münkemüller, T.; Thuiller, W. The productivity-biodiversity relationship varies across diversity dimensions. Nat. Commun. 2019, 10, 5691. [Google Scholar] [CrossRef] [PubMed]
- Puzović, S.; Đureković-Tešić, O.; Marić, B.; Stojanović, T.; Vig, L.; Stojnić, N.; Perić, R.; Ham, I.; Lazić, L.; Stojanović, V.; et al. Labudovo Okno Ramsar Site; Provincial Secretariat for Urban Planning and Environmental Protection, Autonomous Province of Vojvodina: Novi Sad, Serbia, 2014. (In Serbian)
- Puzović, S. Ramsar areas in Serbia [Yugoslavia] and their function in preservation of diversity of birds in watery habitats. Prot. Nat. 1998, 283–290. [Google Scholar]
- Stanković, V.; Kuzmanović, N.; Kabaš, E.; Vukojičić, S.; Lakušić, D.; Jovanović, S. Established stands of the highly invasive Echinocystis lobata on the Ramsar sites of the southern part of the Pannonian Plain. Bot. Serbica 2022, 46, 197–207. [Google Scholar] [CrossRef]
- Simonovic, P.; Nikolic, V. Freshwater fish of Serbia: Anannotated check list with some faunistic and zoogeo-graphic considerations. Bios Thessalon. 1997, 4, 137–156. [Google Scholar]
- Lenhardt, M.; Cakic, P.; Kolarevic, J. Influence of the HEPS Djerdap I and Djerdap II dam construction on catch of economically important fish species in the Danube River. Ecohydrol. Hydrobiol. 2004, 4, 499–502. [Google Scholar]
- Lenhardt, M.; Hegedis, A.; Cvijanovic, G.; Jaric, I.; Gacic, Z.; Mickovic, B. Non-native freshwater fishes in Serbia and their impacts to native fish species and ecosystems. Geophys. Res. Abstr. 2006, 8, 07727. [Google Scholar]
- Filipović, D.; Petrović, L. The Significance of the Danube Ecological Corridor in the Proceedings of Implementing Ecological Networks in Serbia Bulletin of the Serbian. Glas. Srp. Geogr. Društva 2015, 95, 109–124. [Google Scholar] [CrossRef]
- Fishbase. Available online: www.fishbase.se (accessed on 22 May 2023).
- Kottelat, M.; Freyhof, J. Handbook of European Freshwater Fishes; Publications Kottelat, Cornol and Freyhof: Berlin, Germany, 2007; 646p. [Google Scholar]
- Ricker, W.E. Production, reproduction and yield. Veroff. Limnol. 1958, 13, 84–100. [Google Scholar]
- Huet, M.; Timmermans, J.A. Textbook of Fish Culture: Breeding and Cultivation of Fish, 2nd ed.; Fishing News Books Ltd.: Surrey, UK, 1970. [Google Scholar]
- Magurran, A.E.; McGill, B.J. Biological Diversity: Frontiers in Measurement and Assessment; Oxford University Press: Oxford, UK, 2011. [Google Scholar]
- IUCN. The IUCN Red List of Threatened Species. Version 2022-2. 2022. Available online: https://www.iucnredlist.org (accessed on 12 April 2023).
- Convention on the Conservation of European Wildlife and Natural Habitats (Bern, Switzerland), September 19, 1979, E.T.S. 104 [Hereinafter Bern Convention]; Council of Europe: Strasbourg, France, 1979.
- Fleurke, F.; Trouwborst, A. European Regional Approaches to the Transboundary Conservation of Biodiversity: The Bern Convention and the EU Birds and Habitats Directives. In Transboundary Governance of Biodiversity; Kotzé, L., Marauhn, T., Eds.; Brill Nijhoff: Leiden, The Netherlands, 2014; pp. 128–162. [Google Scholar]
- Lazar, L.; Rodino, S.; Pop, R.; Tiller, R.; D’Haese, N.; Viaene, P.; De Kok, J.-L. Sustainable Development Scenarios in the Danube Delta—A Pilot Methodology for Decision Makers. Water 2022, 14, 3484. [Google Scholar] [CrossRef]
- Simić, V.; Bănăduc, D.; Curtean-Bănăduc, A.; Petrović, A.; Veličković, T.; Stojkov ić-Piperac, M.; Simić, S. Assessment of the ecological sustainability of river basins based on the modified the ESHIPPO fish model on the example of the Velika Morava basin (Serbia, Central Balkans). Front. Environ. Sci. 2022, 10, 952692. [Google Scholar] [CrossRef]
- Simic, V.; Lujic, J.; Kostic, D.; Cirkovic, M.; Bjelic-Cabrilo, O.; Simic, S.; Markovic, G. Diversity characteristics of the fish species important for fishery in the waters of Serbia. Bulg. J. Agric. Sci. 2013, 19, 77–87. [Google Scholar]
- Mieczan, T.; Płaska, W.; Adamczuk, M.; Toporowska, M.; Bartkowska, A. Effects of the Invasive Fish Species Ameiurus nebulosus on Microbial Communities in Peat Pools. Water 2022, 14, 815. [Google Scholar] [CrossRef]
- Docherty, C.; Ruppert, J.L.W.; Rudolfsen, T.; Hamann, A.; Poesch, M.S. Assessing the spread and potential impact of Prussian carp (Carassius gibelio Bloch, 1782) to freshwater fishes in western North America. BioInvasions. Rec. 2017, 6, 291–296. [Google Scholar] [CrossRef]
- Liasko, R.; Koulish, A.; Pogrebniak, A.; Papiggioti, O.; Taranenko, L.; Leonardos, I. Influence of environmental parameters on growth pattern and population structure of Carassius auratus gibelio in Eastern Ukraine. Hydrobiologia 2011, 658, 317–328. [Google Scholar] [CrossRef]
- Fuad, M.M.H.; Vetešník, L.; Šimková, A. Is gynogenetic reproduction in gibel carp (Carassius gibelio) a major trait responsible for invasiveness? J. Vertebr. Biol. 2021, 70, 21049.1–13. [Google Scholar] [CrossRef]
- Pehlivanov, L.; Uzunova, E.; Pavlova, M. Ichthyofauna of the Vit River (Danube Basin): Composition, Distribution and Conservation Significance. Biotechnol. Biotechnol. Equipment 2014, 23, 337–340. [Google Scholar] [CrossRef]
- Tapkir, S.; Boukal, D.; Kalous, L.; Bartoň, D.; Souza, A.T.; Kolar, V.; Soukalová, K.; Duchet, C.; Gottwald, M.; Šmejkal, M. Invasive gibel carp (Carassius gibelio) outperforms threatened native crucian carp (Carassius carassius) in growth rate and effectiveness of resource use: Field and experimental evidence. Aquat. Conserv. Mar. Freshw. Ecosyst. 2022, 32, 1901–1912. [Google Scholar] [CrossRef]
- Daskalov, G.M.; Grishin, A.N.; Rodionov, S.; Mihneva, V. Trophic cascades triggered by overfishing reveal possible mechanisms of ecosystem regime shifts. Proc. Natl. Acad. Sci. USA 2007, 104, 10518–10523. [Google Scholar] [CrossRef] [PubMed]
- Rashleigh, B.; Monroy, E. Freshwater Fish Communities. In Narragansett Bay Estuary Program: State of the Watershed; Narragansett Bay Estuary Program: Providence, RI, USA, 2017; Chapter 20; pp. 376–391. [Google Scholar]
- Myers, R.A.; Worm, B. Rapid worldwide depletion of predatory fish communities. Nature 2003, 423, 280–282. [Google Scholar] [CrossRef] [PubMed]
- Eriksson, B.K.; Ljunggren, L.; Sandström, A.; Johansson, G.; Mattila, J.; Rubach, A.; Råberg, S.; Snickars, M. Declines in Predatory Fish Promote Bloom-Forming Macroalgae. Ecol. Appl. 2009, 19, 1975–1988. [Google Scholar] [CrossRef] [PubMed]


| Taxa | Common Name | IUCN Red List Global | Appendix of the Convention on the Conservation of European Wildlife and Natural Habitats (CETS No.: 104) | Appendix of the Council Directive 92/43/EEC | Appendix of the National Rulebook on the Proclamation and Protection of Strictly Protected and Protected Wild Species |
|---|---|---|---|---|---|
| Fam. Anguillidae | |||||
| Anguilla anguilla | European eel | CR | I | ||
| Fam. Alosidae | |||||
| Alosa caspia | Caspian shad | LC | II, V | ||
| Alosa immaculata | Pontic shad | VU | II, V | I | |
| Fam. Acipenseridae | |||||
| Acipenser ruhtenus | Sterlet sturgeon | VU | III | II | II |
| Fam. Esocidae | |||||
| Esox lucius | Northern pike | LC | II | ||
| Fam. Umbridae | |||||
| Umbra krameri | Mudminnow | VU | II | I | |
| Fam. Cyprinidae | |||||
| Cyprinus carpio | Common carp | VU | II | ||
| Carassius gibelio + | Prussian carp | NE | |||
| Carassius carassius | Crucian carp | LC | I | ||
| Barbus barbus | Barbel | LC | V | II | |
| Fam. Leuciscidae | |||||
| Blicca bjoerkna | White bream | LC | |||
| Leuciscus aspius | Asp | LC | III | II, V | II |
| Rutilus rutilus | Roach | LC | |||
| Scardinius erythrophthalmus | Rudd | LC | |||
| Squalius cephalus | Chub | LC | II | ||
| Vimba vimba | Vimba bream | LC | III | II | |
| Chondrostoma nasus | Common nase | LC | III | II | |
| Alburnus chalcoides | Danube bleak | LC | III | II | |
| Alburnus alburnus | Bleak | LC | |||
| Abramis brama | Bream | LC | II | ||
| Ballerus sapa | White eye bream | LC | III | II | |
| Pelecus cultratus | Sichel | LC | III | ||
| Fam. Xenocyprinidae | |||||
| Ctenopharyngodon idella + | Grass carp | LC | |||
| Hypophthalmichthys nobilis + | Bighead carp | DD | |||
| Hypophthalmichthys molitrix + | Silver carp | NT | |||
| Fam. Tincidae | |||||
| Tinca tinca | Tench | LC | I | ||
| Fam. Gobionidae | |||||
| Romanogobio albipinnatus | White finned gudgeon | LC | III | II | II |
| Pseudorasbora parva + | Topmouth gudgeon | LC | |||
| Fam. Acheilognathidae | |||||
| Rhodeus sericeus | Bitterling | LC | III | ||
| Fam. Cobitidae | |||||
| Cobitis taenia | Spined loach | LC | III | II | II |
| Misgurnus fossilis | Weatherfish | LC | III | II | I |
| Fam. Gadidae | |||||
| Lota lota | Burbot | LC | II | ||
| Fam. Syngnathidae | |||||
| Syngnathus abaster | Black-striped pipedfish | LC | III | ||
| Fam. Gasterosteidae | |||||
| Gasterosteus aculeatus + | Three-spined stickleback | LC | |||
| Pungitius platygaster + | Southern ninespine stickleback | LC | |||
| Fam. Percidae | |||||
| Perca fluviatilis | European perch | LC | II | ||
| Gymnocephalus cernuus | Ruffe | LC | |||
| Gymnocephalus baloni | Danube ruffe | LC | III | I | |
| Gymnocephalus schratseri | Schratz | LC | |||
| Zingel zingel | Zingel | LC | III | I | |
| Sander lucioperca | Pike-perch | LC | III | II | |
| Sander volgensis | Volga pikeperch | LC | III | II | |
| Fam. Odontobutidae | |||||
| Perccottus glenii + | Chinese sleeper | LC | |||
| Fam. Centrarchidae | |||||
| Lepomis gibbosus + | Pumpkinseed | LC | |||
| Fam. Siluridae | |||||
| Silurus glanis | Wels catfish | LC | III | II | |
| Fam. Ictaluridae | |||||
| Ameiurus nebulosus + | Brown bullhead | LC | |||
| Ameiurus melas + | Black bullhead | LC | |||
| Fam. Gobiidae | |||||
| Proterorhinus marmoratus + | Tubenose goby | LC | |||
| Babka gymnotrachelus + | Racer goby | LC | |||
| Ponticola kessleri + | Bighead goby | LC | |||
| Neogobius fluviatilis + | Monkey goby | LC | |||
| Neogobius melanostomus + | Round goby | LC | |||
| Ponticola syrman | Syrman goby | LC | |||
| Proterorhinus semilunaris | Western tubenose goby | LC |
| Variables | Relative Biomass (kg/h) | Relative Annual Production (kg/h) | |||||||
|---|---|---|---|---|---|---|---|---|---|
| Family | Species/Year | 2008 | 2015 | 2018 | 2022 | 2008 | 2015 | 2018 | 2022 |
| Acipenseridae | Acipenser ruthenus | 51.21 | 1.187 | 14.268 | |||||
| Esocidae | Esox lucius ◊ | 46.35 | 71.524 | 15.119 | 1.667 | 23.600 | 49.488 | 31.725 | |
| Cyprinidae | Cyprinus carpio | 1.815 | 127.755 | 56.899 | 30.162 | 121.012 | 14.984 | 7.665 | 67.446 |
| Carassius gibelio | 299.326 | 163.755 | 49.897 | 44.604 | 21.548 | 76.032 | 17.701 | ||
| Carassius carassius | 2.669 | ||||||||
| Barbus barbus | 3.956 | 2.51 | 1.43 | 0.152 | 0.937 | ||||
| Leuciscidae | Leuciscus aspius ◊ | 172.66 | 22.111 | 6.613 | 77.605 | 55.35 | 6.749 | 133.183 | |
| Rutilus rutilus | 43.149 | 10.927 | 16.61 | 0.059 | 6.624 | 1.204 | 9.227 | ||
| Scardinius erythrophthalmus | 9.42 | 3.928 | 10.34 | 0.935 | 5.675 | ||||
| Squalius cephalus | 4.827 | 7.413 | |||||||
| Vimba vimba | 0.778 | 0.83 | 0.198 | ||||||
| Chondrostoma nasus | 16.815 | ||||||||
| Alburnus alburnus | 48.916 | 3.022 | 31.052 | 0.81 | 19.804 | 0.767 | 8.653 | 0.013 | |
| Ballerus ballerus | |||||||||
| Abramis brama | 3.085 | 166.57 | 1.646 | 1.325 | 2.995 | 62.179 | 0.304 | 0.167 | |
| Ballerus sapa | 2.44 | 1.884 | 0.406 | 0.298 | 0.394 | ||||
| Xenocyprinidae | Ctenopharyngodon idella | 78.5 | 316.8 | 5.96 | |||||
| Hypophthalmichthys molitrix | 690.8 | 164.85 | |||||||
| Tincidae | Tinca tinca | 5.495 | 3.267 | 2.773 | |||||
| Gobionidae | Pseudorasbora parva | 2.771 | 0.2 | 0.08 | 0.3 | 1.41 | 1.333 | ||
| Acheilognathidae | Rhodeus sericeus | 0.222 | 0.33 | ||||||
| Percidae | Gymnocephalus schraetser | 3.12 | 4.28 | ||||||
| Perca fluviatilis ◊ | 5.352 | 13.253 | 5.461 | 0.142 | 0.452 | 5.244 | 1.655 | ||
| Sander lucioperca ◊ | 90.398 | 128.156 | 11.886 | 5.175 | 23.436 | 33.485 | 12.854 | 0.975 | |
| Sander volgensis ◊ | 5.707 | 2.42 | 5.425 | 2.23 | 3.561 | 2.972 | 2.241 | 0.431 | |
| Centrarchidae | Lepomis gibbosus | 1.2 | 7.456 | 0.067 | 0.022 | 2.123 | |||
| Siluridae | Silurus glanis ◊ | 3.539 | 12.678 | 0.213 | 70.494 | ||||
| Ictaluridae | Ameiurus melas ◊ | 46.885 | 49.993 | 11.03 | 0.659 | 15.992 | 0.204 | 3.65 | |
| Gobiidae | Proterorhinus marmoratus | 0.008 | |||||||
| Proterorhinus semilunaris | 0.533 | ||||||||
| Babka gymnotrachelus | 3.848 | 6 | 4.079 | ||||||
| Ponticola kessleri | 1.002 | 3.998 | 5.07 | ||||||
| Neogobius fluviatilis | 7.192 | 2.23 | 4.407 | 1.281 | |||||
| Neogobius melanostomus | 0.875 | 9.068 | 0.022 | 4.509 | |||||
| Ponticola syrman | 3.1 | ||||||||
| Total | 799.025 | 1.704.13 | 271.968 | 496.847 | 282.789 | 451.246 | 186.602 | 233.336 | |
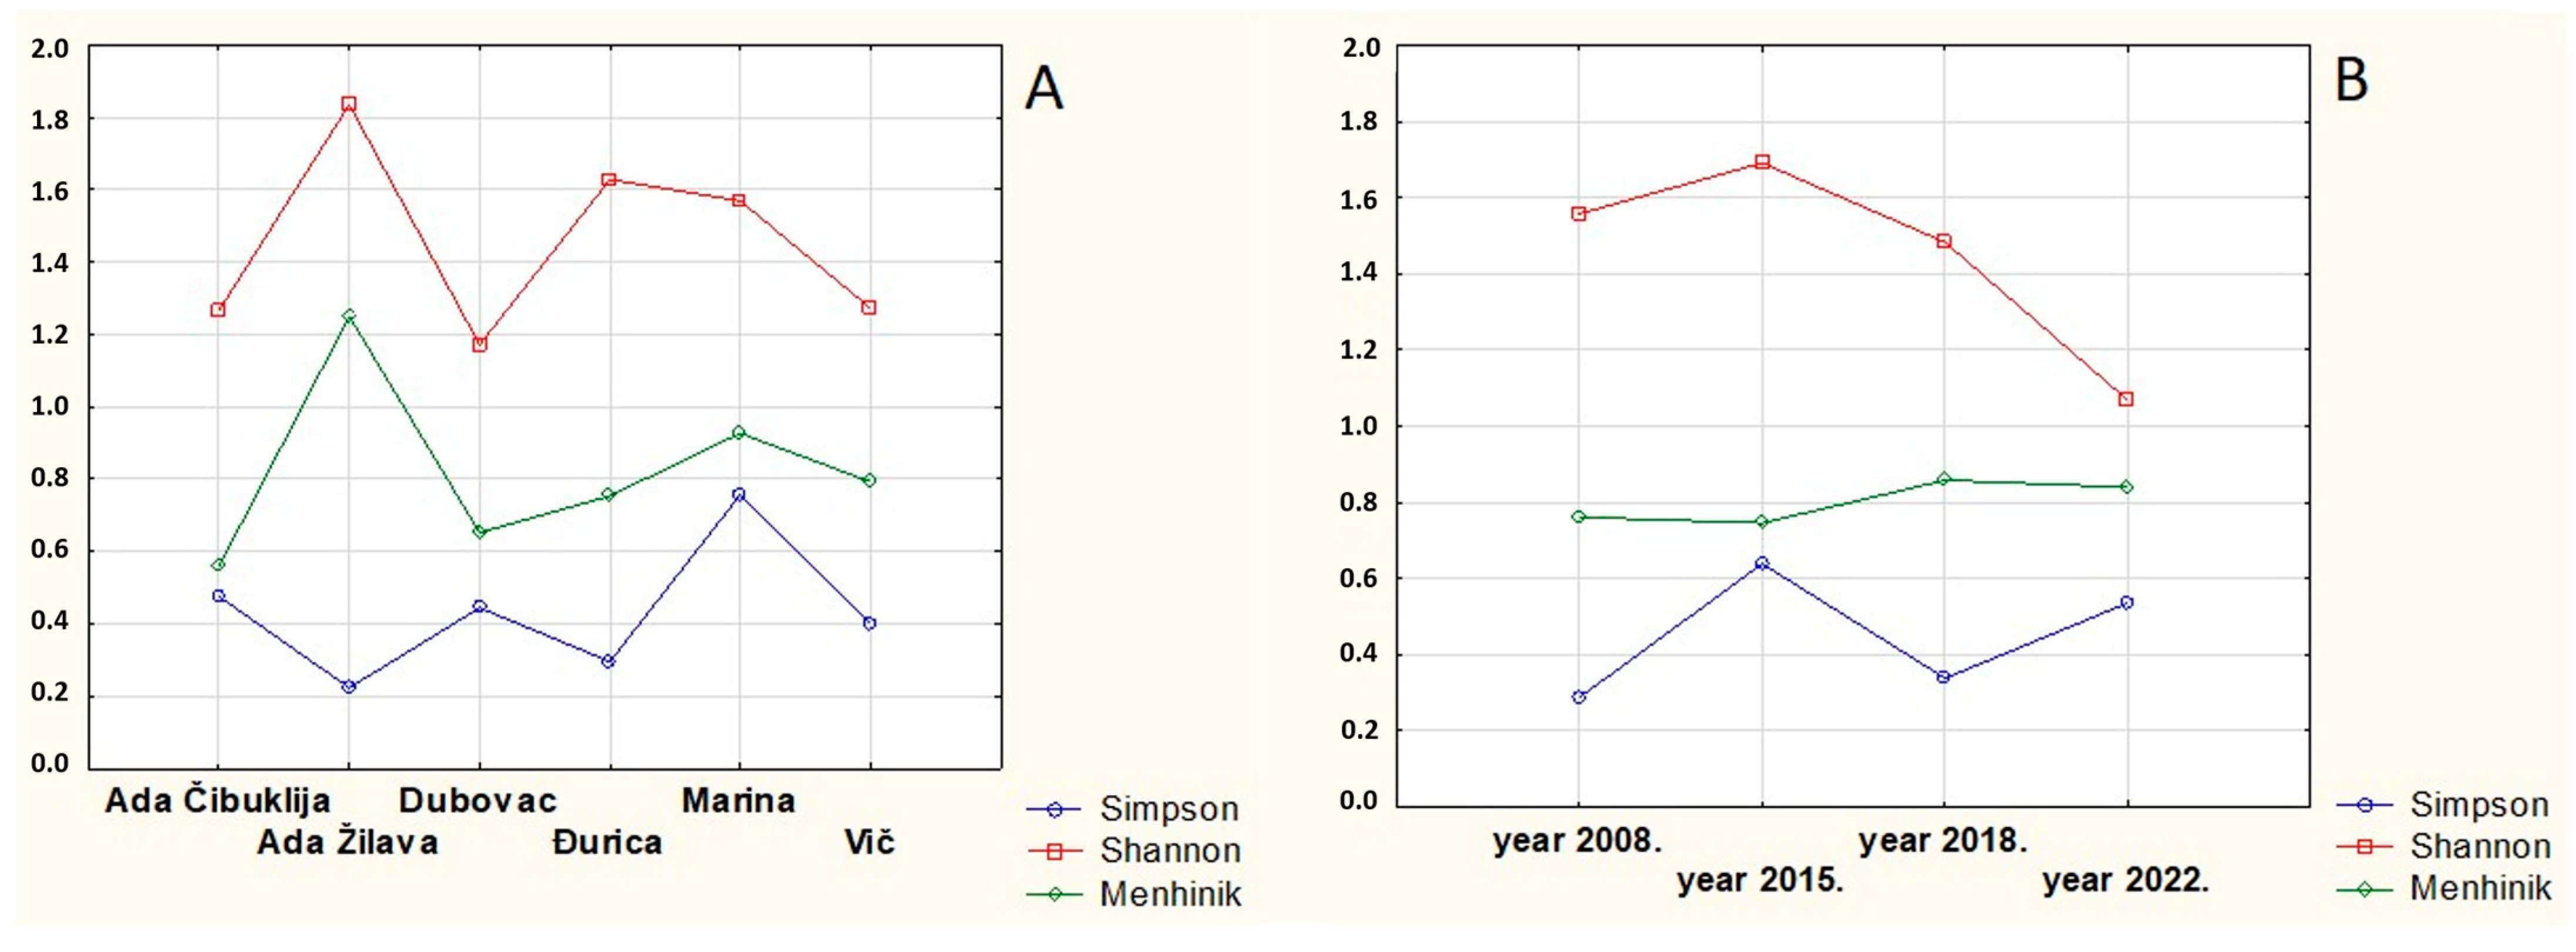
| Biodiversity Index | Maximum | Minimum | Locality (Year) | Average |
|---|---|---|---|---|
| Simpson | 0.7737 | 0.0905 | Dubovac (2022), Ada Žilava (2015) | 0.4420 |
| Shannon | 2.5770 | 0.5091 | Ada Čibuklija (2015), Vič (2022) | 1.4399 |
| Menhinik | 1.5950 | 0.4082 | Ada Žilava (2022), Ada Čibuklija (2018) | 0.8035 |
Disclaimer/Publisher’s Note: The statements, opinions and data contained in all publications are solely those of the individual author(s) and contributor(s) and not of MDPI and/or the editor(s). MDPI and/or the editor(s) disclaim responsibility for any injury to people or property resulting from any ideas, methods, instructions or products referred to in the content. |
© 2023 by the authors. Licensee MDPI, Basel, Switzerland. This article is an open access article distributed under the terms and conditions of the Creative Commons Attribution (CC BY) license (https://creativecommons.org/licenses/by/4.0/).
Share and Cite
Nikolić, V.; Nedić, Z.; Škraba Jurlina, D.; Djikanović, V.; Kanjuh, T.; Marić, A.; Simonović, P. Status and Perspectives of the Ichthyofauna of the Labudovo okno Ramsar Site: An Analysis of 14 Years of Data. Sustainability 2023, 15, 9303. https://doi.org/10.3390/su15129303
Nikolić V, Nedić Z, Škraba Jurlina D, Djikanović V, Kanjuh T, Marić A, Simonović P. Status and Perspectives of the Ichthyofauna of the Labudovo okno Ramsar Site: An Analysis of 14 Years of Data. Sustainability. 2023; 15(12):9303. https://doi.org/10.3390/su15129303
Chicago/Turabian StyleNikolić, Vera, Zlatko Nedić, Dubravka Škraba Jurlina, Vesna Djikanović, Tamara Kanjuh, Ana Marić, and Predrag Simonović. 2023. "Status and Perspectives of the Ichthyofauna of the Labudovo okno Ramsar Site: An Analysis of 14 Years of Data" Sustainability 15, no. 12: 9303. https://doi.org/10.3390/su15129303
APA StyleNikolić, V., Nedić, Z., Škraba Jurlina, D., Djikanović, V., Kanjuh, T., Marić, A., & Simonović, P. (2023). Status and Perspectives of the Ichthyofauna of the Labudovo okno Ramsar Site: An Analysis of 14 Years of Data. Sustainability, 15(12), 9303. https://doi.org/10.3390/su15129303