Article

Designing, Modeling, and Fabrication of a Novel Solar-Concentrating Spittoon against COVID-19 for Antibacterial Sustainable Atmosphere

1
Department of Mechanical Engineering, National Institute of Technology, Durgapur 713209, India
2
Department of Mechanical Engineering, Sri Eshwar College of Engineering, Coimbatore 641202, India
3
Department of Mechanical Engineering, National Institute of Technology, Patna 800005, India
4
Department of Production and Industrial Engineering, Birla Institute of Technology, Mesra, Ranchi 835215, India
5
Faculty of Engineering and Applied Science, Usha Martin University, Ranchi 835103, India
6
Department of Biology, College of Science and Humanities, Prince Sattam Bin Abdulaziz University, P.O. Box 83, Al-Kharj 11940, Saudi Arabia
7
Department of Zoology, College of Science, King Saud University, P.O. Box 2455, Riyadh 11451, Saudi Arabia
8
Department of Chemical Engineering, Birla Institute of Technology, Mesra, Ranchi 835215, India
*
Authors to whom correspondence should be addressed.
Sustainability 2023, 15(12), 9286; https://doi.org/10.3390/su15129286
Submission received: 27 April 2023 / Revised: 1 June 2023 / Accepted: 3 June 2023 / Published: 8 June 2023

Abstract

:
Spreading infectious illnesses such as viral meningitis, hepatitis, and cytomegalovirus among people is facilitated by spitting in public. India is more prone to transferring infectious illnesses. Recent research discovered that the new Coronavirus may also be transmitted via an infected person’s saliva. Self-collected saliva from 91.7% of patients contains COVID-19. Numerous nations have prioritized preventing individuals from spitting in open or public areas such as hospitals, parks, airports, train stations, etc. The UVC range has a greater damaging effect on microbial cells because microorganisms’ intracellular components, such as RNA, DNA, and proteins, are sensitive to UVC photon absorption. In this article, the design and construction of a solar-concentrating spittoon is attempted. At its receiver, it can create a temperature of 390 K and 176 W of heat. At this temperature, most viruses (including Coronavirus), bacteria, and pathogens are inactivated. Daily, from 8:00 a.m. until 5:00 p.m., the solar-concentrating spittoon is functional. The solar-concentrating spittoon performance was best for nine hours. The receiver thermal efficiency was 80% and 20% of heat was lost to the surroundings. The overall efficiency was found to be 70%. During this time, most people spend their time outside, where this solar-powered spittoon can incinerate human cough and spit within one minute. The installation of this solar-concentrated spittoon will aid in preventing the spread of fatal dangerous diseases and cleaning the city.

1. Introduction

In India, smokeless tobacco is popular, despite its relationship with deadly illnesses such as mouth cancer and infectious respiratory infections [1]. According to a health specialist, chewing tobacco products causes the mouth to produce more saliva and is accompanied by a strong need to spit. Thus, tobacco users get used to spitting often. Spittoons have been employed to avoid frequent spitting in public locations. Saliva contains many bacteria, viruses, fungus, and other diseases. There are several health concerns linked to an infected person’s saliva [2]. Spitting increases the fast spread of sputum germs, especially in crowded areas such as parks, railway stations, and stadiums. Since December 2019, the world has been fighting the worldwide epidemic of the Coronavirus. It is very infectious and fatal. It is an airborne virus that may stay active for more than 24 h in cold, dry conditions [3]. It may readily travel through the air and infect a healthy individual via an infected host. The spitting of sick people in public areas such as hospitals, train stations, airports, and bus stops is a significant source of Coronavirus transmission via the air [4]. The consumer’s spittle is one of the primary mechanisms of transmitting infectious diseases, viruses, and bacteria. India’s national and state governments have enacted stringent regulations against spitting in public spaces. These are one of the primary income sources for the Indian government [5]. Currently, the world is experiencing a different phase of the COVID-19 epidemic. Therefore, it is necessary to find a solution that hygienically decomposes and kills the viruses, bacteria, and pathogens transmitted by the user’s spitting [6].
In regions where sunlight cannot reach, the SARS-CoV-2 Coronavirus remains active on common materials such as metal, plastic, and cardboard for many days [7]. However, it would not live as long when exposed to sunlight. Researchers at the National Biodefense Analysis and Countermeasures Centre exposed SARS-CoV-2 in simulated saliva to artificial sunlight, which is equivalent to regular daytime sunlight [8]. This discovery suggests that the Coronavirus cannot survive exposure to natural sunshine, reducing the likelihood of infection in outdoor settings [9]. Coronaviruses when exposed to a temperature above 65 °C for more than 3 min are nearly inactivated [10]. Environment humidity has a crucial function in preventing the spread of active viruses and bacteria. Many airborne viruses are vulnerable to ambient air humidity [11]. The studies indicate that active viruses have a half-life of 18 h when the ambient relative humidity is 20%, and the temperature is between 21 and 24 °C. At the same ambient temperature, increasing relative humidity to 80% reduces the life active to six hours. When the effect of sunshine hours acts, the lifespan of active viruses is again decreased to barely two minutes [12].
There is an urgent need to design a device that would minimize the transmission of illnesses such as COVID-19 by spitting, while balancing the health risk of spitting and other individuals. Solar light has a potent impact on airborne and surface-dwelling pathogens. Increasing warmth and humidity are also very effective against infectious viruses such as corona, TB, hepatitis, etc. [13]. These viruses and bacteria cannot thrive at temperatures and humidity levels that are too high. Viral survival and transmission seem to be influenced by humidity, and a new study suggests that absolute humidity (AH) is significantly more essential than relative humidity (RH) in changing established patterns [14]. In normal cold settings, the dried virus on smooth surfaces remained alive for nearly five days at a temperature of 22–25 °C and relative humidity of 40–50% [15].
The global spread of the coronavirus disease caused by new SARS-CoV-2 variants resulting in the severe acute respiratory syndrome remains a major health concern, leading to increased patient mortality and its identification is required as soon as the samples are identified as “positive” [16,17]. The use of graphene oxide demonstrated efficient adsorption of 18F-FDG, providing a promising alternative method for decontamination of surfaces contaminated with radioactive material [18].
The low-cost portable air filter/sterilizer dehumidifier device using polyester filters effectively improved indoor environmental (IEQ) quality by reducing relative humidity and particulate matter, making it a potential alternative to conventional heat pumps for improving IEQ [19].
The study suggests that the antibacterial activity of Bi QDs can be significantly improved with the help of light illumination, even at low power density, because of the photothermal effect [20]. The photothermally-assisted superhydrophobic materials have emerged as promising candidates for a range of applications, including oil purification, waste oil collection, and solar desalination, thanks to their easy fabrication, low cost, flexibility, and ability to tune thermal conversion [21].
In the present study, the solar concentrating spittoon was fabricated and designed to limit the spread of illness by spitting and to eradicate viruses, germs, and pathogens present in spittle and phlegm. The modelling of the design was done with Catia V5. The simulation of the solar concentrator was performed in Ansys fluent 2021R1. The rate of thermal energy availability at the receiver and the time for burning spit saliva were also calculated. The present paper includes the following research objectives to be fulfilled. 1. To design and fabricate a solar-concentrating spittoon. 2. To perform simulation for temperature estimation. 3. Calculation of thermal, overall efficiency, and time estimation for burning of saliva.

2. Mathematical Modelling

The modelling has been done considering the following assumptions:
  • Properties of protein molecules are neglected.
  • Saliva is assumed to be water and of uniform composition.
  • Variation of specific heat at constant temperature is neglected.
  • Initial temperature of saliva is assumed to be the body temperature of a healthy person.
According to observations, the typical individual can spit 3 mL of saliva. Saliva comprises 99% water, 1% protein molecules, and phlegm-containing viruses and bacteria [22]. The saliva’s water content is more (99%) as compared to protein molecules (1%), thus assuming water and saliva composition are almost similar. Thus, in the computation, the thermal characteristics of 1% of saliva’s protein molecules was examined and the thermal properties of water at 37 °C were considered [13].

2.1. The Energy Requirement to Evaporate and Burn Saliva

Equation (1) represents the energy requirement for burning and evaporating saliva:
Q = m   C p w T e T b + m L t
where Q = energy required to evaporate saliva. m = 3 mL = 0.003 kg (average amount of saliva spit by a person). Cpw = 4.18 KJ/Kg K (specific heat of saliva). Τe = 373 K (evaporation temperature of saliva at atmospheric pressure). Τb = 310 K (body temperature of person). Lt = 2257 KJ/Kg (the latent heat of vaporization of water)

2.2. Power Required to Burn out Saliva in 1 min

For power required to burn out saliva within 1 min is represented in Equation (2):
P = Q / t
where P = Power in W; Q = Energy in J; Τ = Time in sec.
From the above calculation, the required value of solar radiation for the complete burning of human saliva in 1 min is approximately 126 W.

2.3. Aperture Area Required

Equation (3) is used to find the aperture area of the reflector for receiving 126 W of power:
P = A a I s q loss
Assuming that there is no heat loss from the receiver of the solar concentrator, this equation becomes (qloss = 0) (Equation (4)):
P = A a I s
where Aa = aperture area of solar concentrator reflector in m2; Is = radiant energy received by the earth surface from the sun in India (746 W/m2); qloss = heat loss by the receiver to surrounding by convection.
Therefore, the aperture area of solar-concentrating reflectors should be more than 0.16892 m2.

3. Materials and Methods

The prime objective is to construct a solar collector which concentrates all sunrays that fall onto it, so that users’ spit saliva should quickly burn. Materials which are used for fabrication of the solar-concentrating spittoon are depicted in Tables S1 and S2 (provided in the supplementary sheet). During the fabrication processes, the following important points were considered:
  • It should not lose heat to the surroundings.
  • Receiver temperature should be maintained at more than 373 K.
  • It should generate heat when the sun falls from a different angle.
  • It should be compact and lightweight.

4. Fabrication and Designing of Solar-Concentrating Spittoon

Designing of the spittoon is done step-by-step with the following governing parameters.

4.1. Design of Concentrator

The reflector consists of nine concentric rings whose surface profile is at an angle to the sun’s incident rays. Each ring surface is inclined at a distinct angle with respect to the incident beam. This inclination angle decreases from the outermost reflective ring to the innermost reflective ring. This configuration gives the whole reflector a parabolic reflector form. An actual photograph of the designed spittoon is shown in Figure S1 (supplementary sheet). Equation (5) determines the form of a parabola:
X 2 + Y 2 = 4 f
where X = Aperture plane coordinate in the x-axis. Y = Aperture plane coordinate in the y-axis. Z = Distance from the concentrator’s vertex parallel to the reflector’s symmetry axis. f = Focal length of the concentrator.

4.2. Focal Length

After reflection reflectors are off, all the sun’s incident rays are deflected and concentrated at a single spot. The concentration point is the concentrator’s focal point. The focal length is the distance travelled by the sun’s beam (normal to the reflector’s surface and without deflection) from the reflector’s surface to the focal point.

4.3. Focal Length to Diameter Ratio

The ratio of the focal length of the concentrator to the diameter of the concentrator. It is calculated by dividing the diameter of the concentrator to the focal length of the concentrator, denoted as f/d, where d = outer diameter of the concentrator; F = focal length of concentrator.

4.4. Rim Angle

The focal length of the concentrator is also determined by the rim angle. To find the value of the rim angle, the density of solar flux collection has to be optimized. It is the total angle covered by a concentrator reflector at the focal point. The rim angle can be calculated by Equation (6):
f d = 1 4 tan φ r m
where φ r m is the rim angle.

4.5. Aperture Area

This is the effective area of the reflector and receiver that is exposed to the sunlight and receives energy from solar radiation. The aperture area of this solar collector is determined by Equation (7) [23]:
A p = a r n a f
where ar = Normal area of reflector that is exposed to sun; N = Number of plyboard frames (n = 6); af = Area of frame that is exposed to sunlight; d0 = Diameter of outer ring of the reflector (d0 = 0.6 m); di = Diameter of inner most ring of reflectors (di = 0.13 m); T = Thickness of frame (t = 0.010 m).

4.6. Absorber Area or Concentrating Area

It is the effective area of the receiver where reflected light is concentrated:
A a b = π d r l r
where Aab = Absorber area; dr = Diameter of the receiver; lr = Effective length of receiver area where the flux of heat is collected.

4.7. Geometric Concentration Ratio

Based on the aperture area of the concentrator and the receiving area, it is possible to create a pattern known as the geometric concentration ratio (CRg). The ratio between the aperture area of the concentrator and the area of the receiver absorbs all the solar heat flux concentrated by the concentrating reflectors [24]. The geometric concentration ratio is computed by using Equation (9):
C R g = A p A a b

4.8. Design Calculation

The calculations are performed on solar concentrators for the combustion of spittle based on fundamental heat equations and equations for the design of the parabolic concentrator and receiver. The essential independent and dependent variables are selected to calculate the daily performance of a solar-concentrating spittoon, and the constants required for calculation are derived from standard references. Table S3 shows the design specification of the concentrated spittoon.

4.8.1. Rate of Thermal Energy Available at the Receiver

A standard solar-concentrating equation is taken to calculate the amount of heat available at the receiver. The amount of heat flux obtained at the receiver is upon the Direct Normal Irradiation (DNI) of that location, the concentrator’s area, and reflectors reflectivity [24]. The thermal efficiency of the receiver depends on the amount of heat obtained by the concentration of solar irradiation and the amount of heat loss to the surrounding by conduction, convection, and radiation. The fundamental equation for the rate of energy available at the receiver is as follows:
Q a v a i l = { I s n × ( A p + A r e c ) × e × cos ( θ i ) × ζ × α × τ × i } ( A r e c + A r e c n ) [ U × ( T r e c T a m b ) + σ × F × ( T r e c 4 T a m b 4 ) ]
Qavail = {746 W × 0.29684 m2 × 1 × cos (0) × 0.93 × 0.9 × 0.95 × 1} − 0.02458
× [10.45 × (383 K − 313 K) + 5.67 × 10−8 × 0.25 × (383 K4 − 313 K4)]
where Arecn = Area of the receiver normal to incident radiation.

4.8.2. Time Taken for Burning out Spitted Saliva

It is necessary to calculate the time taken for the burning spitted saliva because of the required design of the concentrator; then, collect the appropriate amount of heat that could burn out saliva at the shortest possible time and inactive the viruses and bacteria, so that it should not infect the next user of this spittoon. To calculate the time to burn out saliva, the fundamental Equation (11) is used:
t = Q Q a v a i l
From the above calculation, it is found that this concentrator can take approximately 50 s to burn out the saliva. So, after the spitting of the first user, the second user should spit on this spittoon after 50 s to avoid transmission of contagious diseases by spitting.

5. Results

5.1. Simulation Results

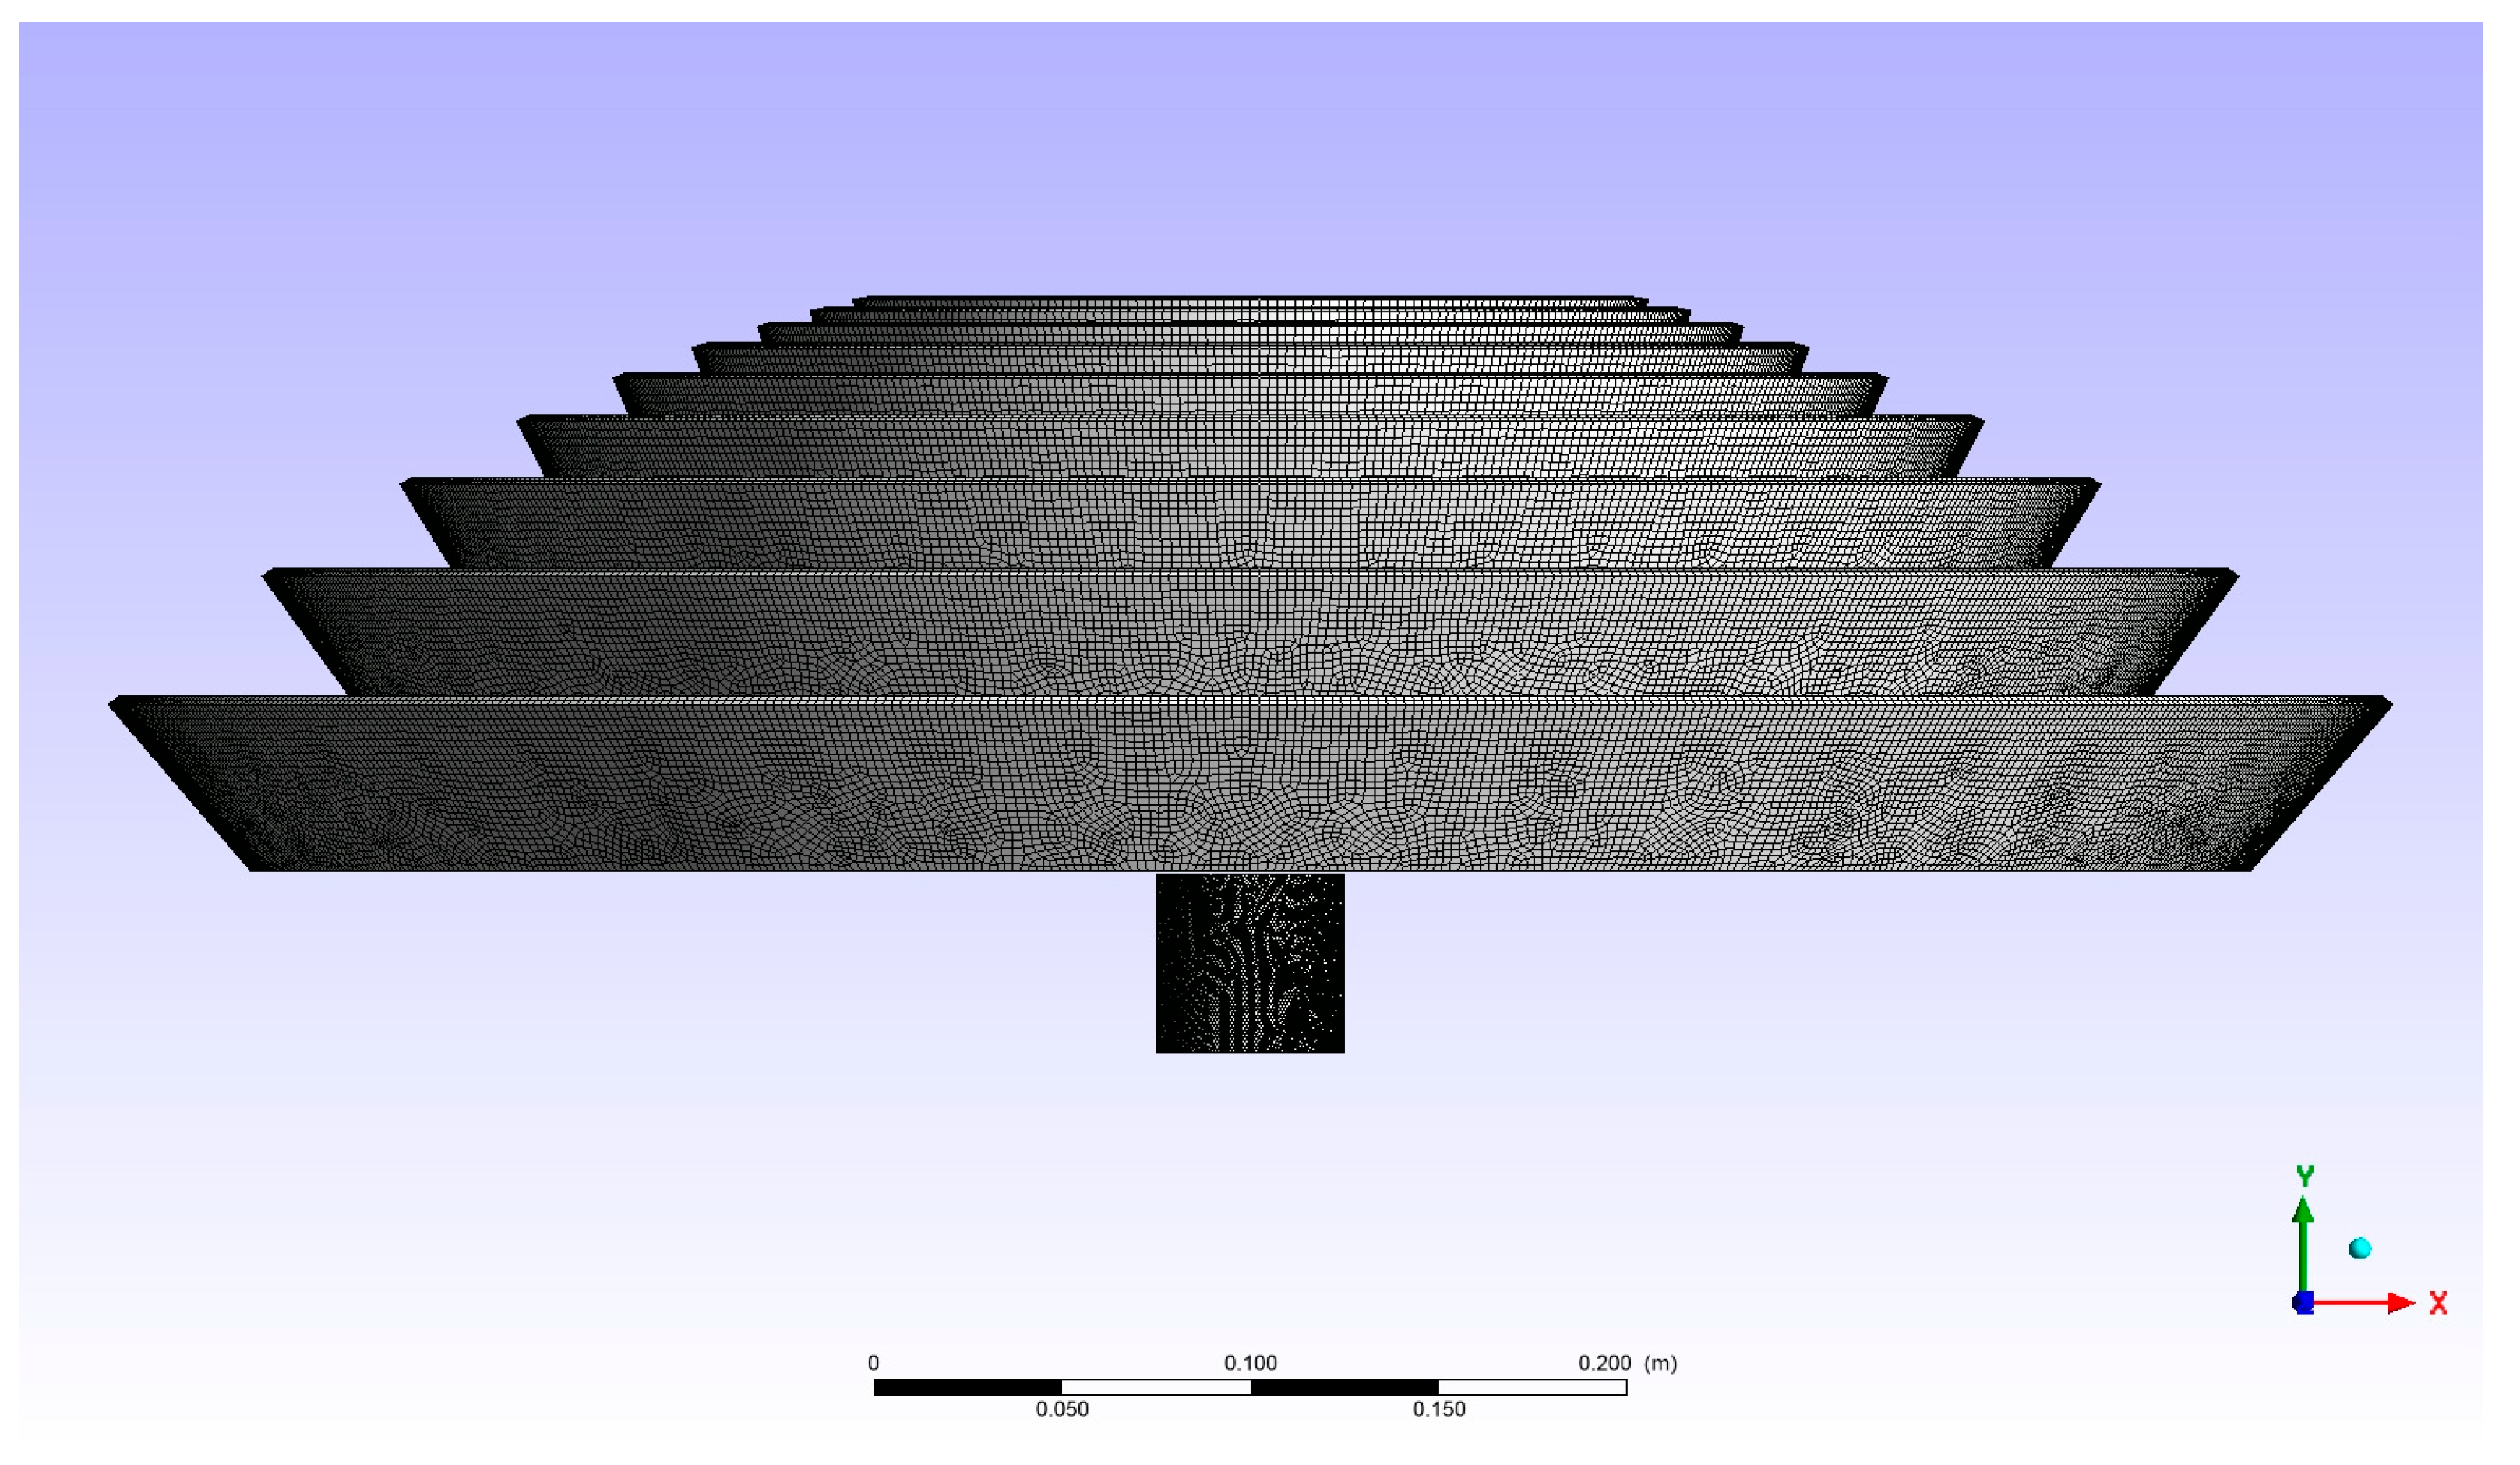
Modelling of the design was done with Catia V5. The Catia model is shown in Figure 1. Simulation of the solar concentrator is performed in Ansys fluent 2021 R1. In this simulation, simple boundary conditions were applied. Table S4 provided in the supplementary sheet shows the boundary condition. Figure S2 shows the computational domain for different parts of solar-concentrating spittoon. The generated structured mesh is shown in Figure 2. The coupled scheme was used for pressure and velocity coupling. The turbulent kinetic energy and turbulent dissipation rate were discretized with a first-order upwind scheme, whereas the second-order upwind scheme was used for the discretization of momentum and energy. The standard k-epsilon turbulence model has been considered as the viscous model and Standard Wall Functions have been considered for wall treatment in the present simulation settings. Redundant and unnecessary parts (such as screws, wooden frame, and other redundant parts) were suppressed from the model of the solar-concentrating spittoon. Only reflecting rings and absorbing elements are taken for simulation. In this simulation, 746 W/m2 of solar irradiation load is applied on the reflector rings. As absorbing elements, copper and paraffin wax are taken. After applying boundary conditions and parameters, calculations of simulation are done. After simulation, some important results are obtained in the form of contours, which are given below.
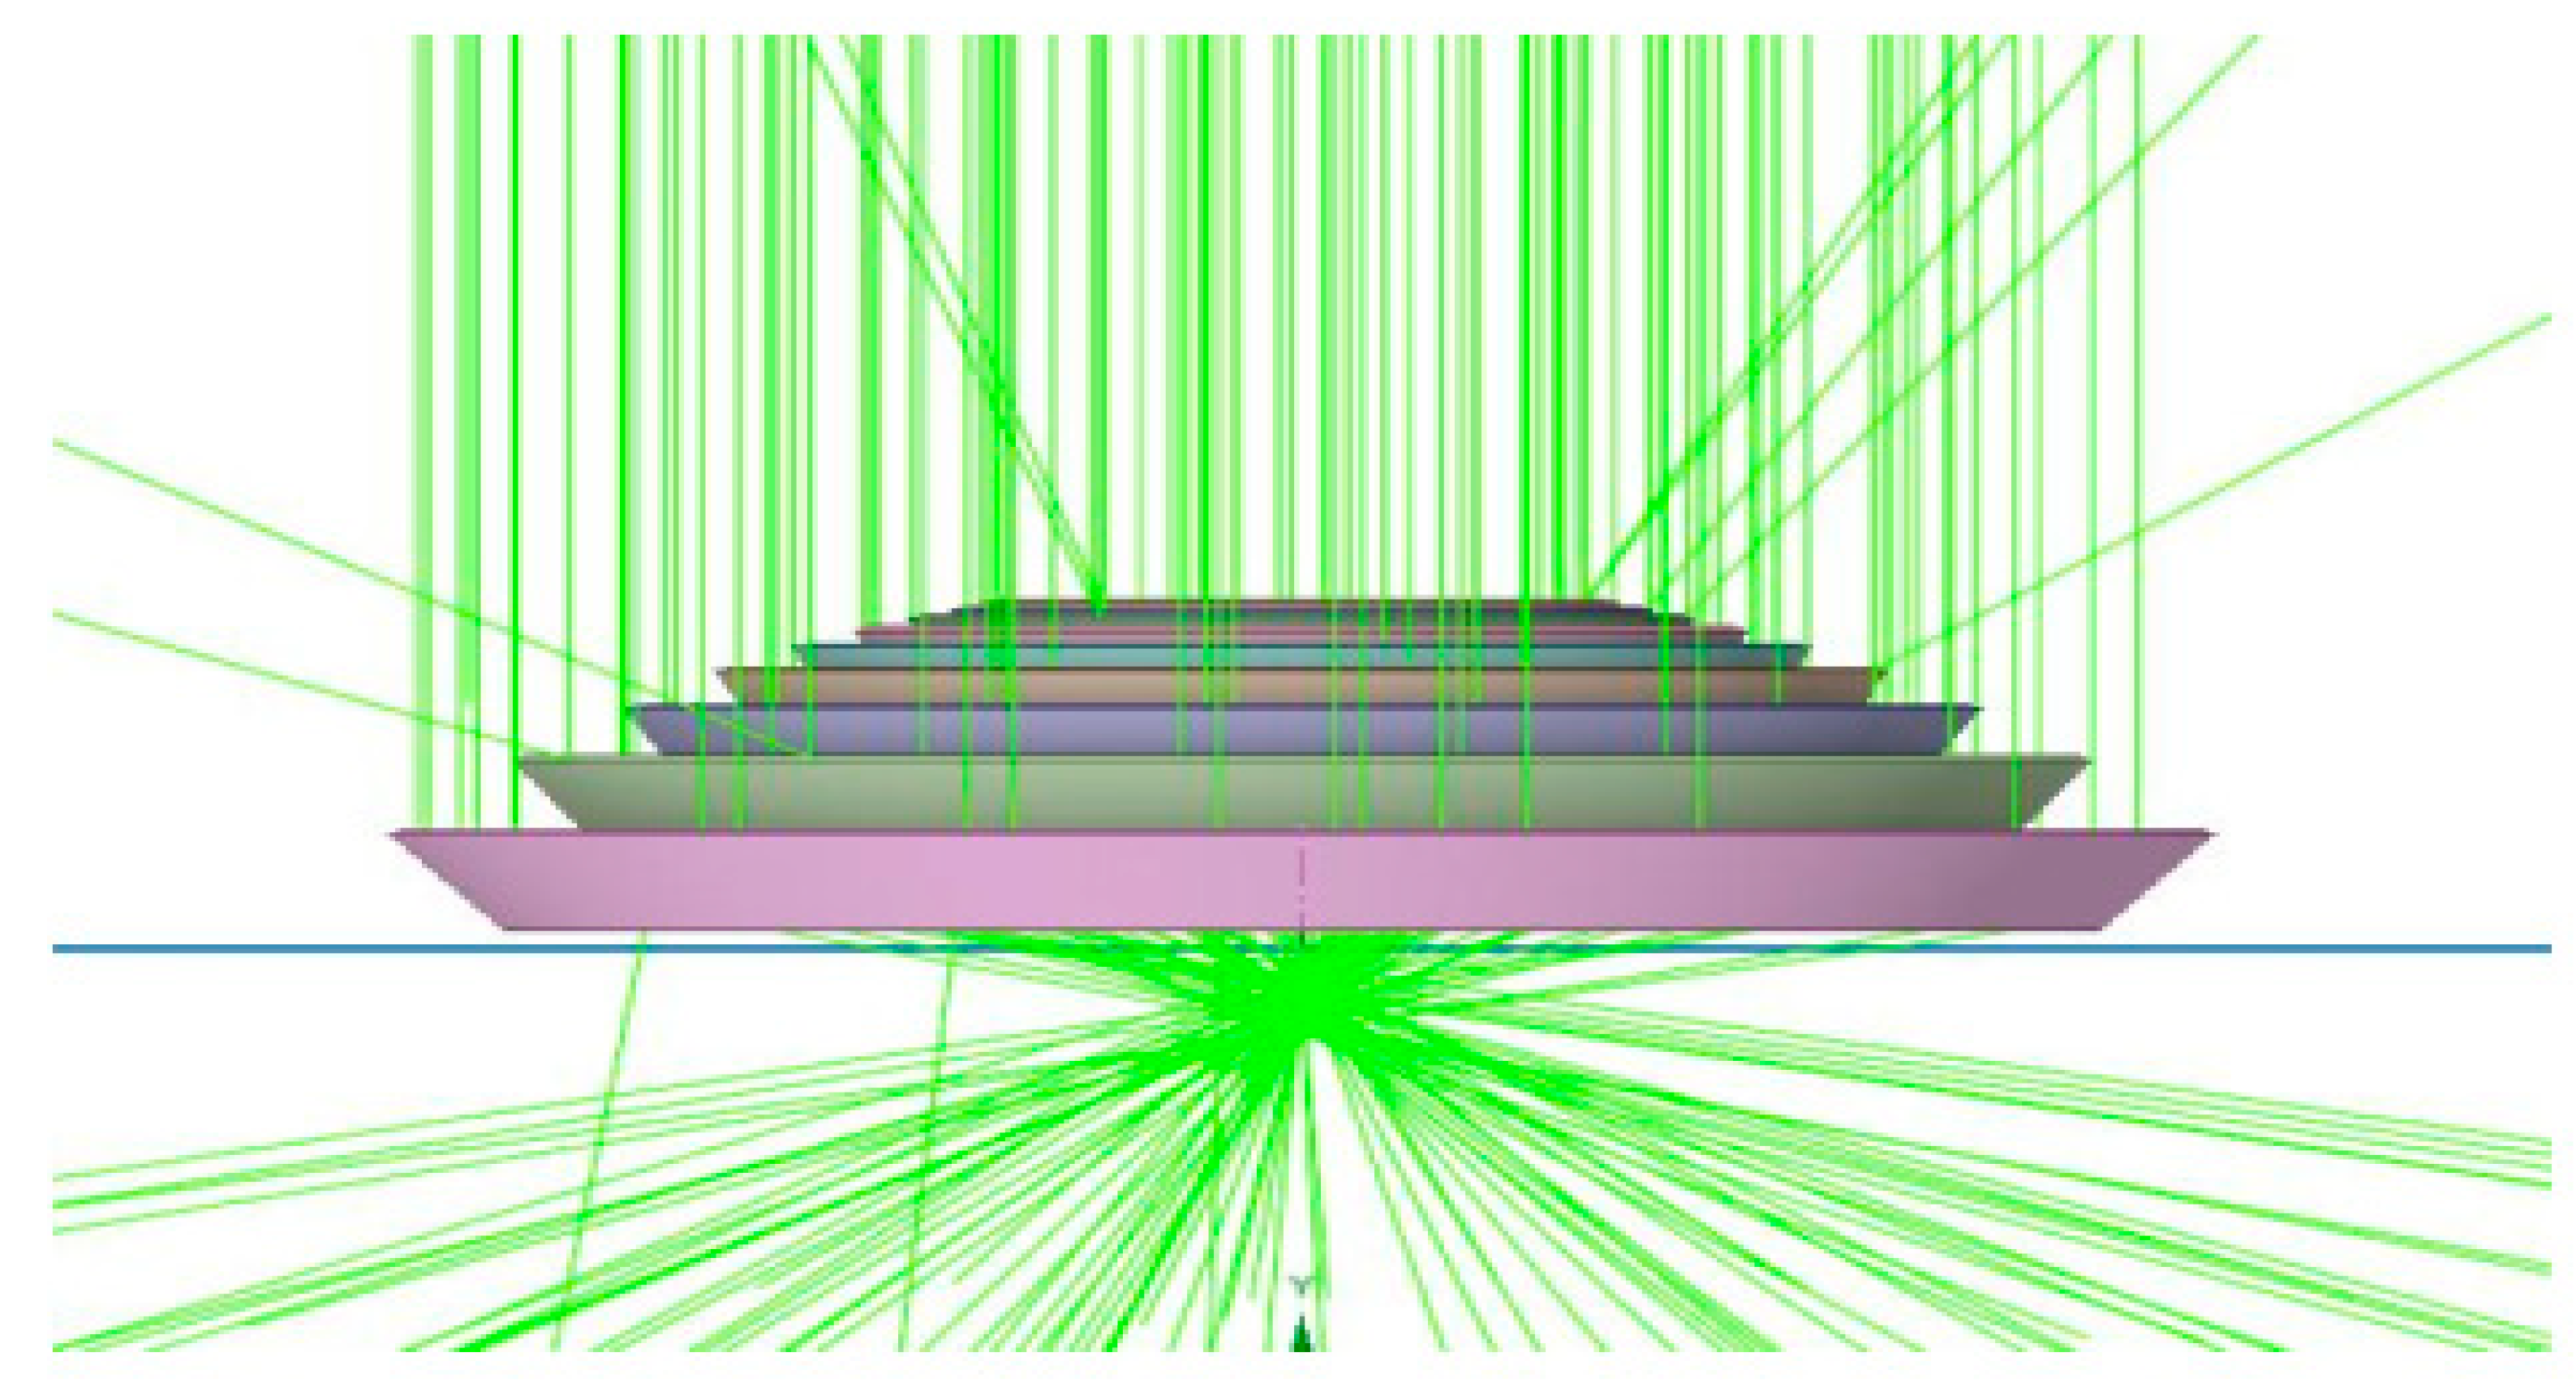
Paths of light beams on solar concentrators are shown in Figure 3, depicting that most of the light beams are concentrated below the concentrator after reflection from reflector rings, and some light beams become diffracted to other directions.
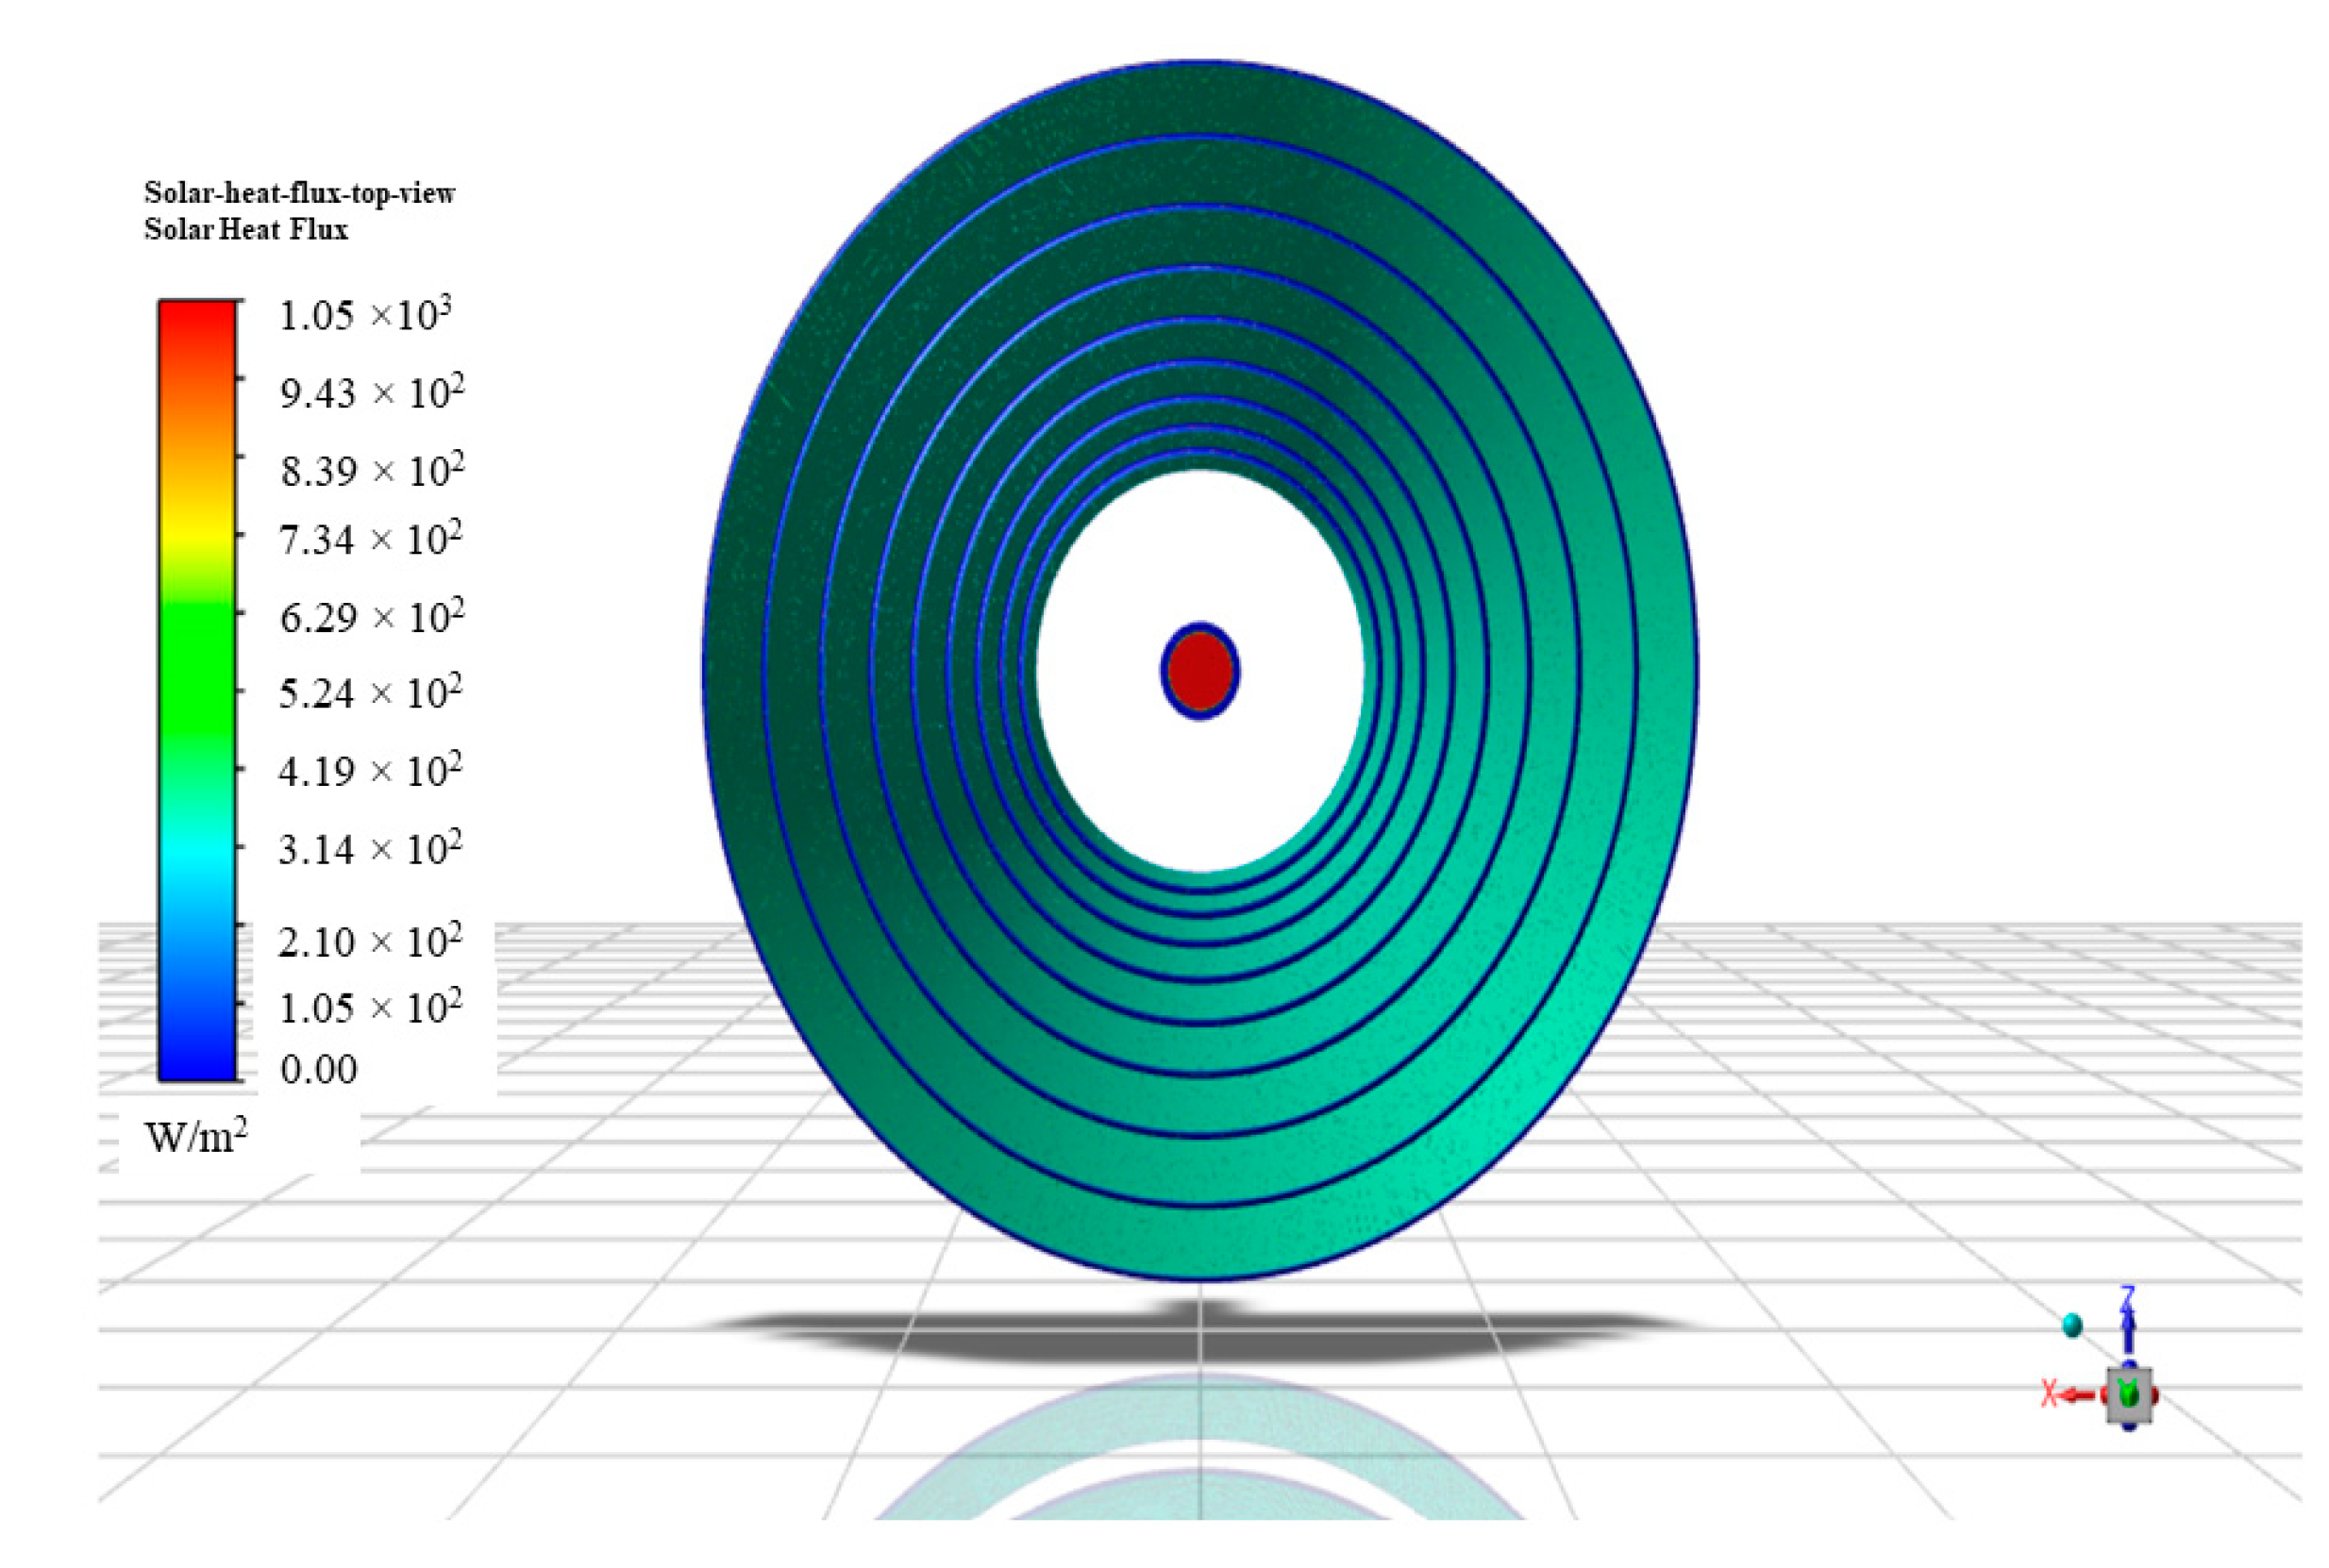
Figure 4 shows the contour of the solar irradiation load on the surfaces of reflectors and absorber. Reflectors’ surface is shown with light green color, which indicates 420 W/m2 of solar irradiation heat flux is falling onto the surface of the reflector. Due to the presence of air medium, some parts of the irradiation are lost. After reflection from the surface of the reflectors, heat flux is falling on the absorbing element, where most of the heat flux is absorbed, which is shown with red color, indicating 1000 W/m2 solar heat flux.
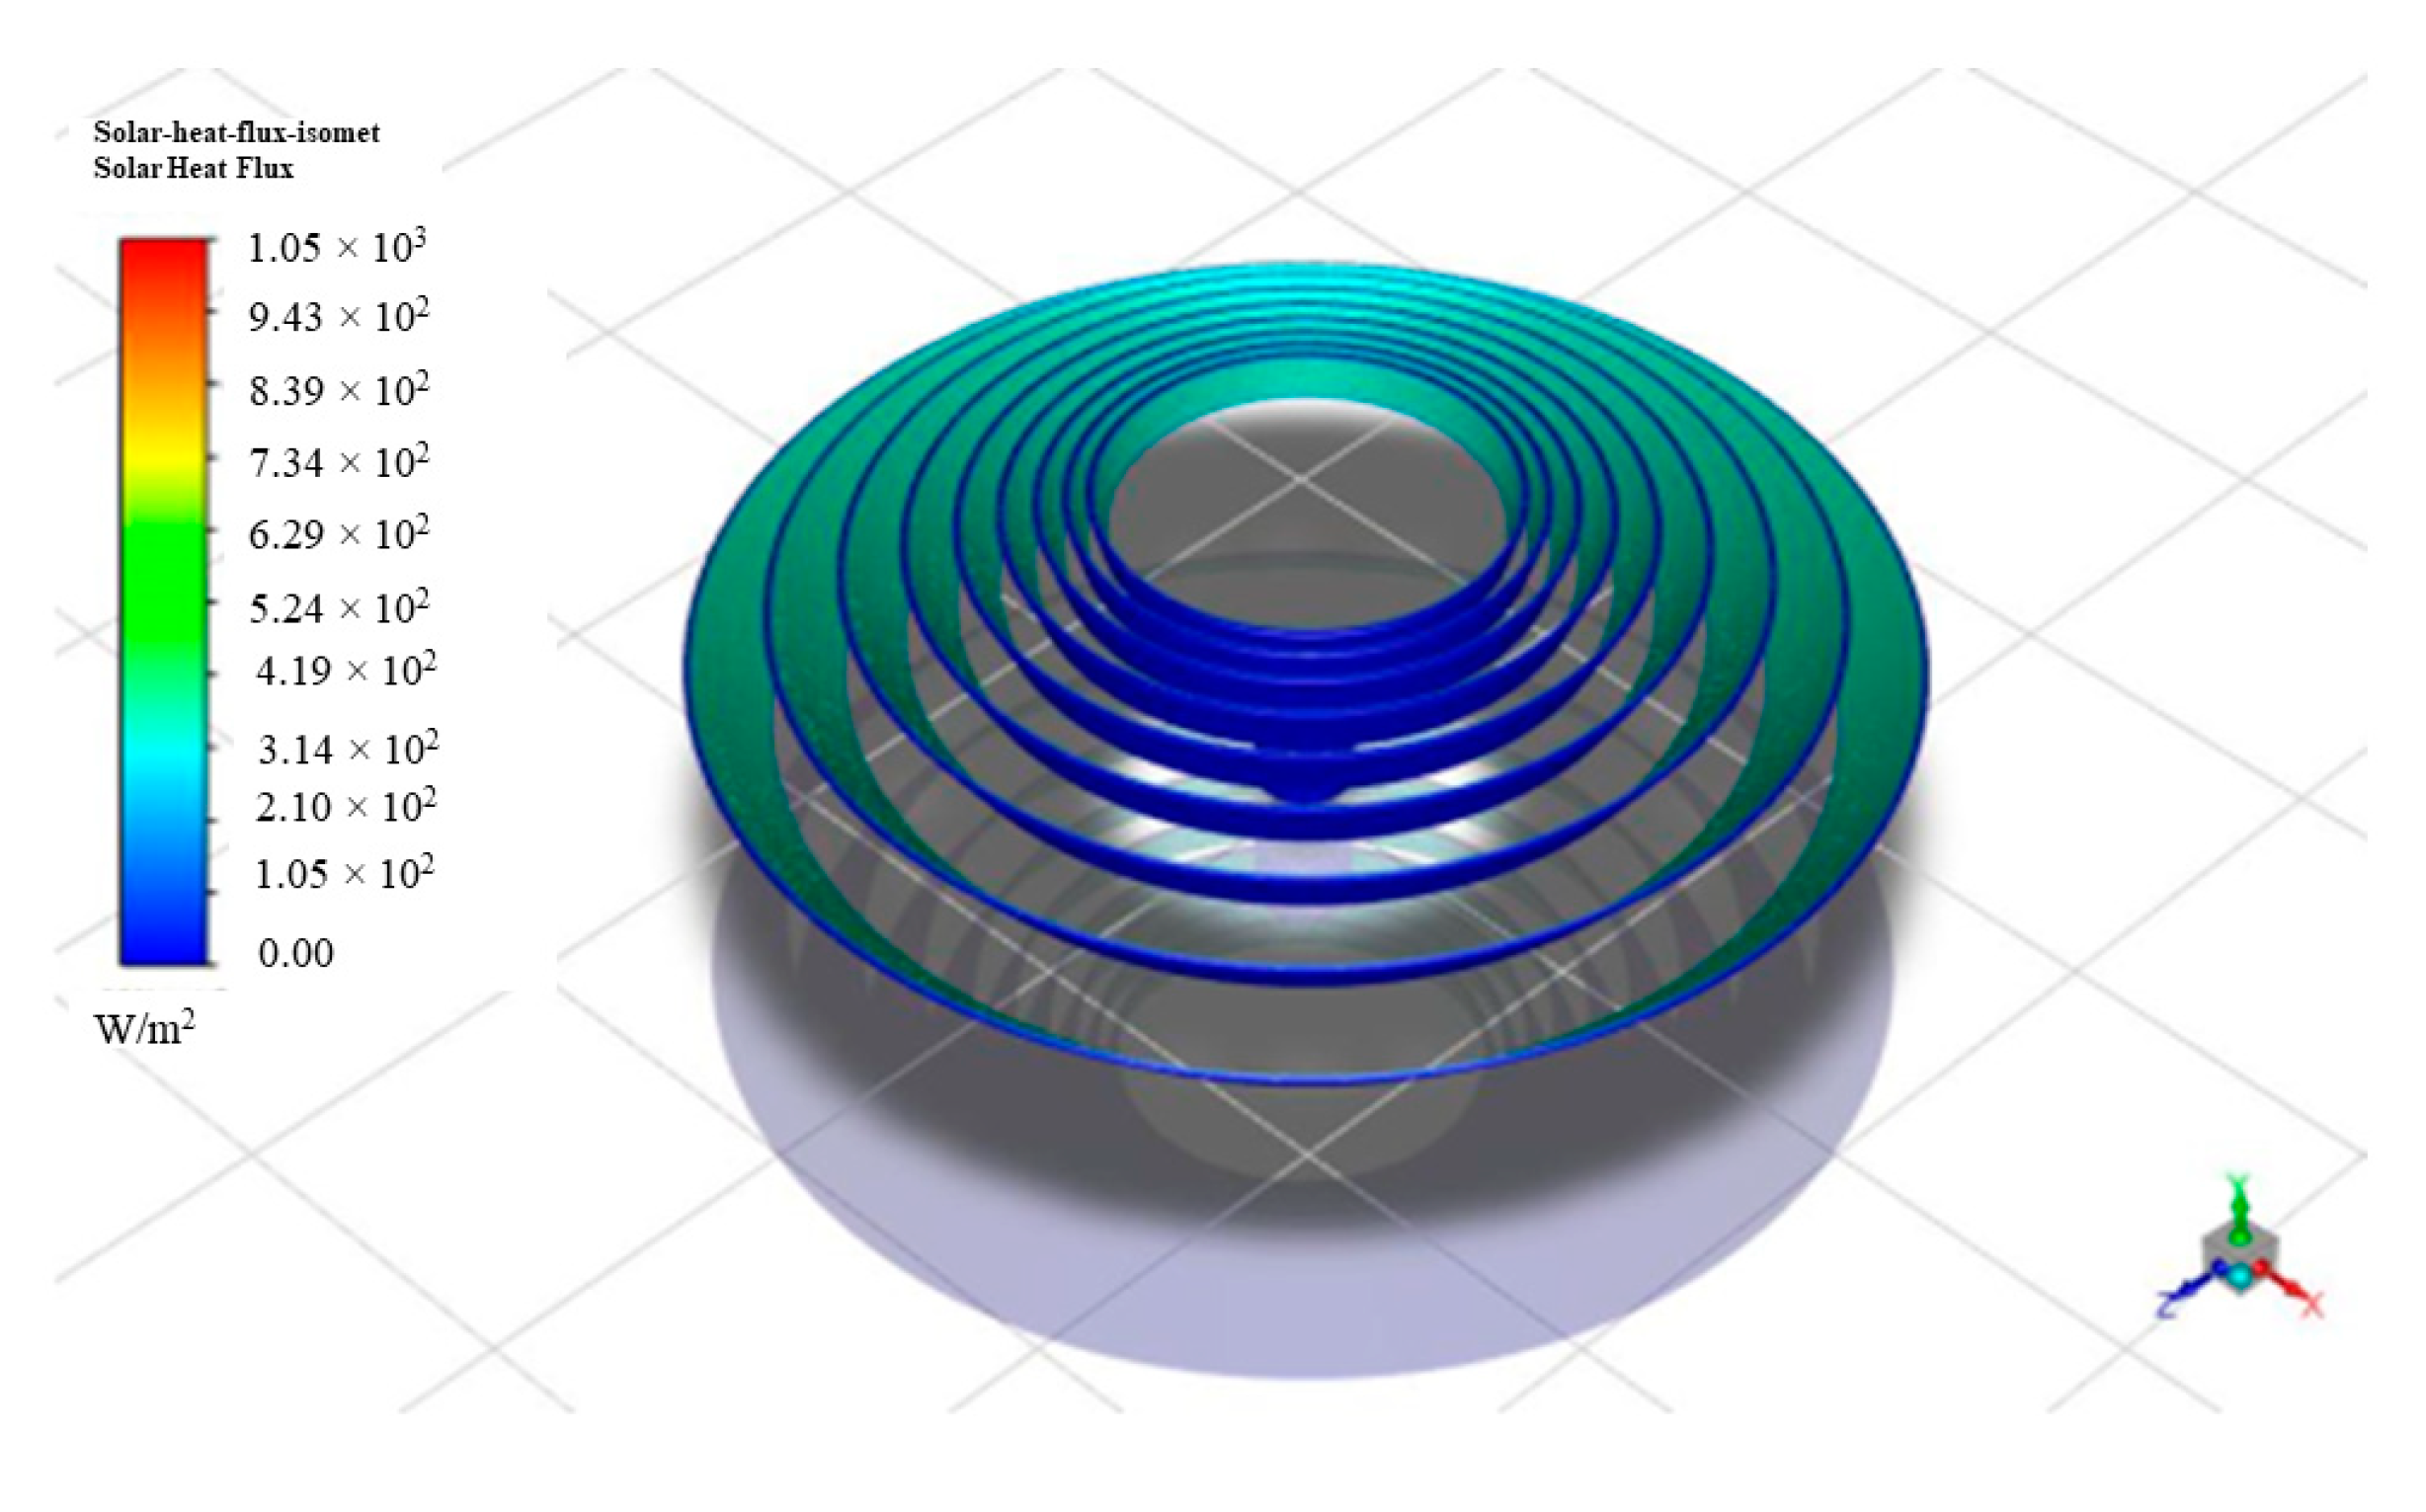
Figure 5 depicts the other part of the reflector rings, which do not participate in the solar load, in blue color. Blue color shows a zero solar irradiation load at this region, which is not reached by sunrays. The contour plot represents a solar reflector used in a solar-concentrating spittoon system, which typically consists of a parabolic mirror-like structure that focuses and concentrates solar radiation onto a smaller receiver or target. In such systems, it is important to carefully design and optimize the reflector geometry and configuration in order to maximize the amount of solar radiation that is captured and delivered to the receiver. In the specific diagram being discussed, it appears that only a portion of the reflector rings is actually involved in reflecting solar radiation onto the receiver or target. These rings are likely arranged in a specific pattern or configuration that has been optimized to achieve the desired concentration and focusing of the solar radiation onto the receiver. The other rings that are not involved in reflecting solar radiation are shown in blue color, indicating that there is no solar irradiation load in this region and that the sunrays do not reach this part of the reflector. The use of different colors in the diagram is a common way to visually represent the distribution and intensity of solar radiation across the reflector surface.
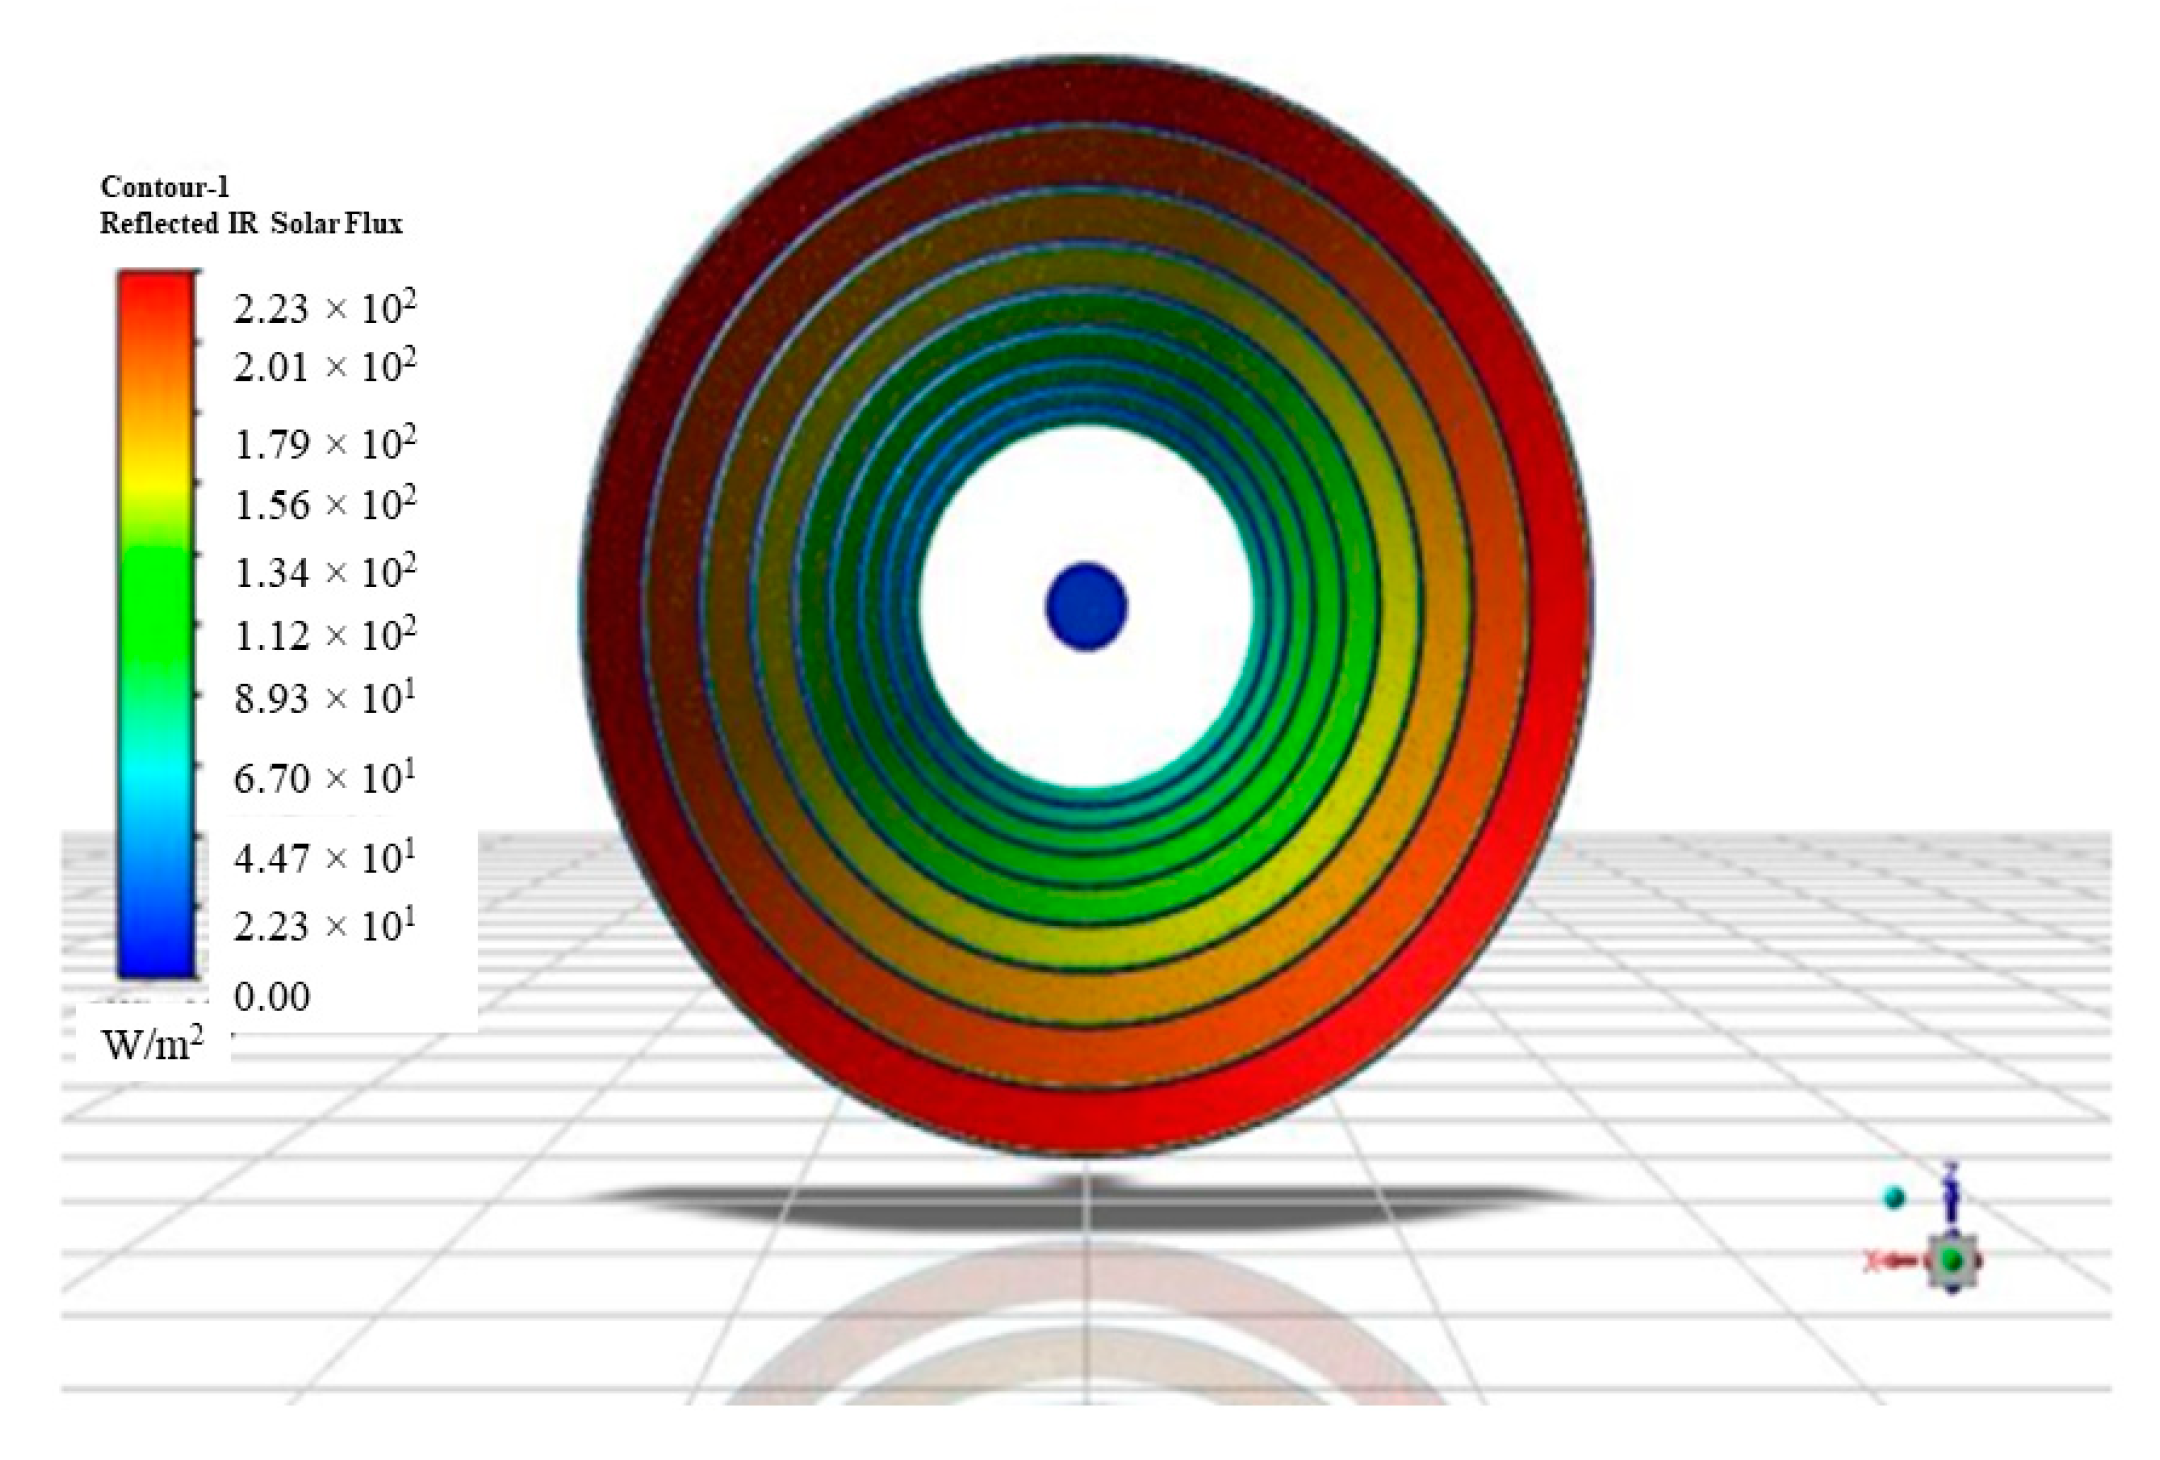
Figure 6 depicts reflected solar irradiation heat flux. The outermost reflecting ring is red color and the color of contours in the reflecting surfaces are gradually fading from red hot in the outermost reflecting ring to green in the innermost reflecting ring. Outer rings have a larger surface area for reflecting the solar irradiation from the sun as compared to inner reflector rings. Thus, outer reflecting rings are red in color, and they reflect 75% of solar irradiation to absorb. Figure S3 represents the isometric view of the reflected solar irradiation heat flux, where the rear part of reflectors is in blue color, which does not participate in radiation of solar heat flux.
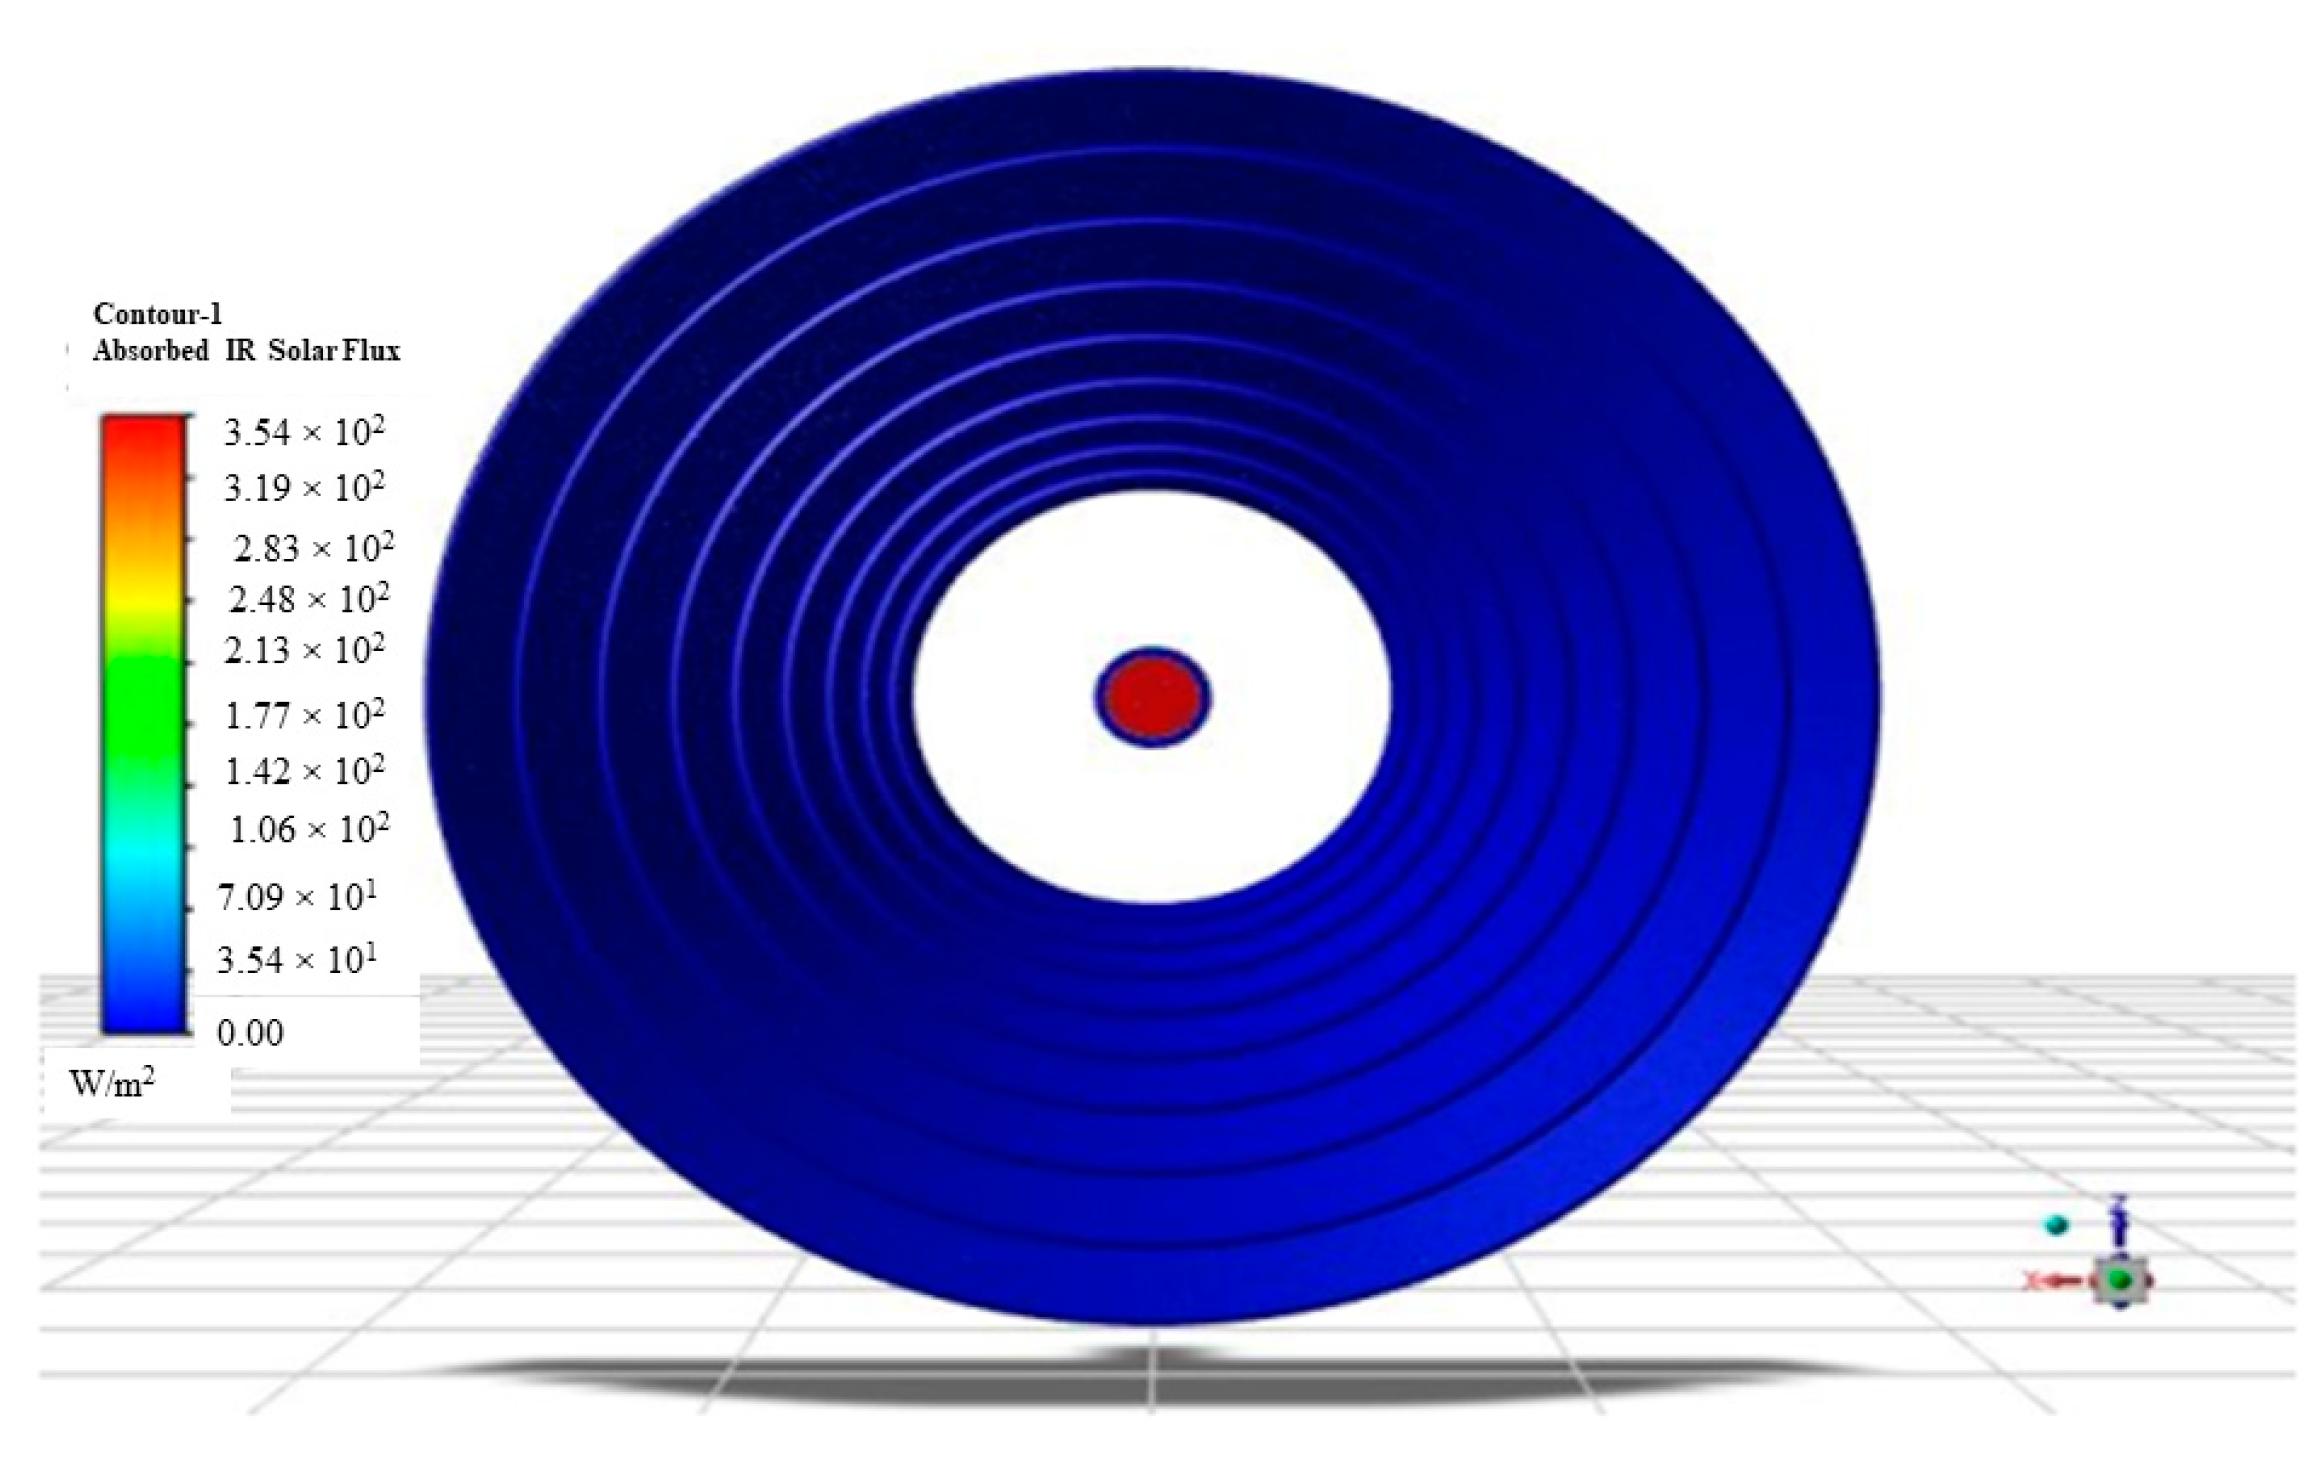
Figure 7 represents the distribution of heat absorbed by the surfaces. The red color region at the center, where all the fallen sun irradiations are concentrated, means that most of the radiant energy is absorbed by the energy storage element. The outer part of the receiver where rays are not concentrating are in blue color, indicating that these surfaces are not absorbing reflecting heat from the reflectors.
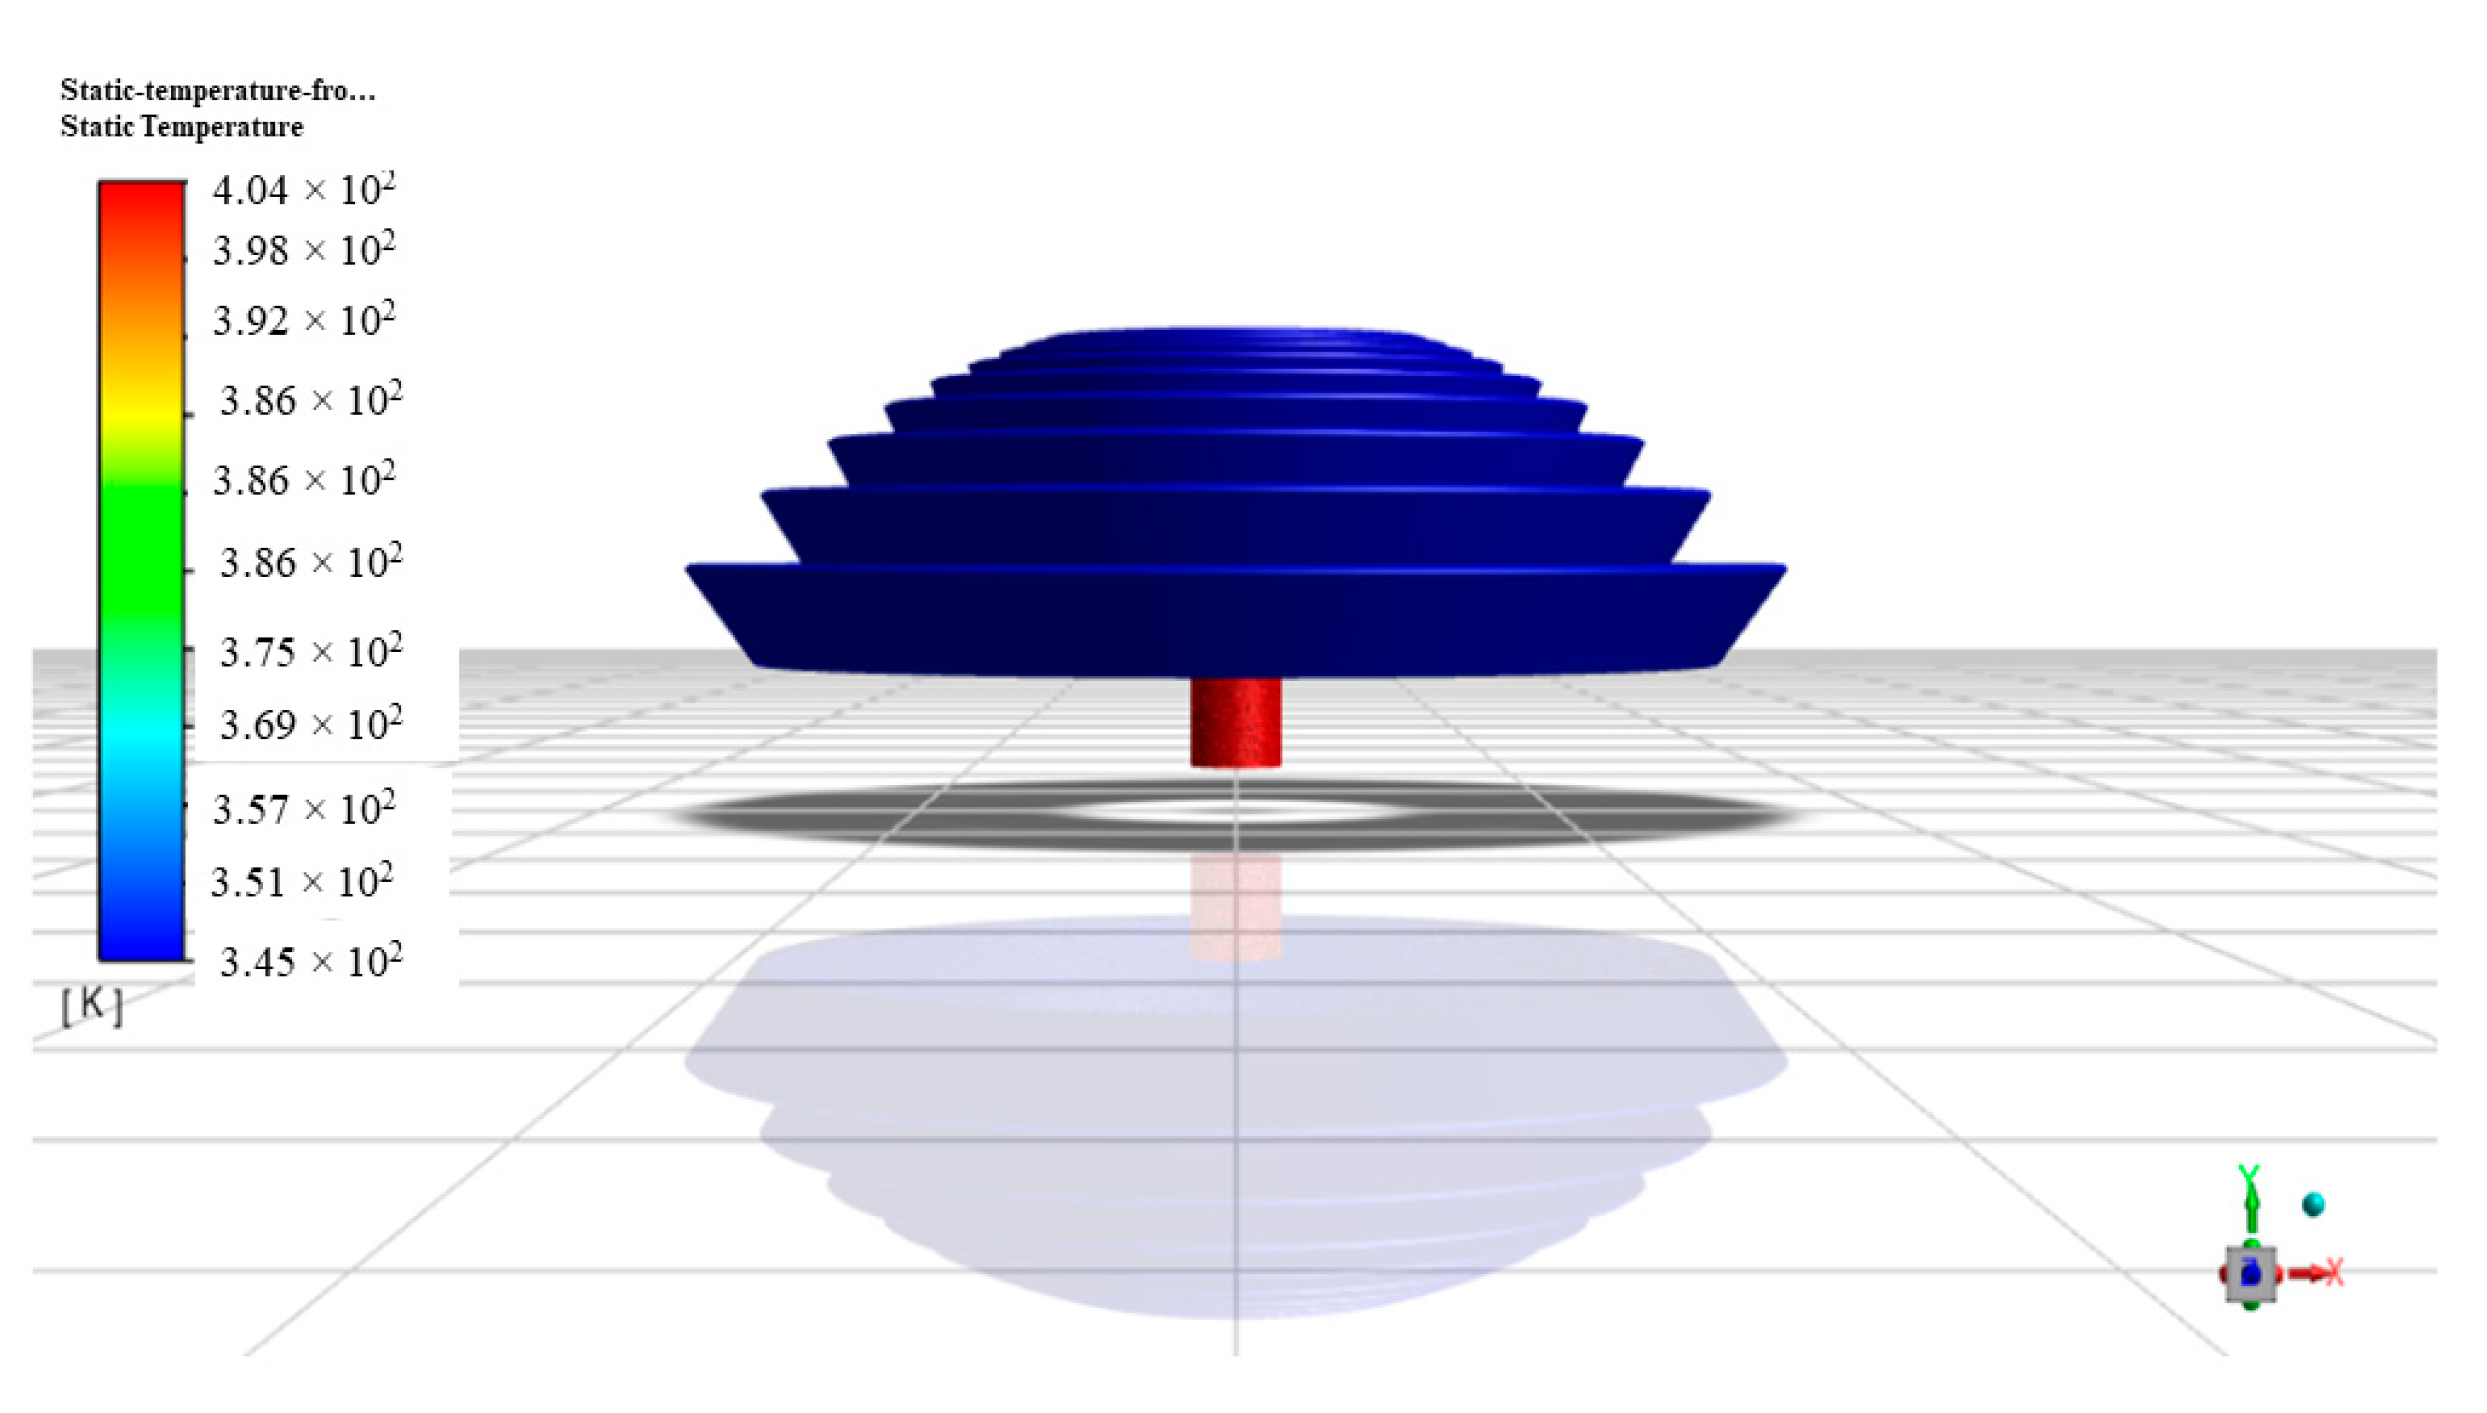
Figure 8 shows important information about the temperature distribution on the solar concentrator. It can be concluded from the color of the contour that the receiver of solar-concentrating spittoon has a maximum temperature of around 404 K. This temperature is sufficient to inactivate most viruses and bacteria and to stop the transmission of disease.
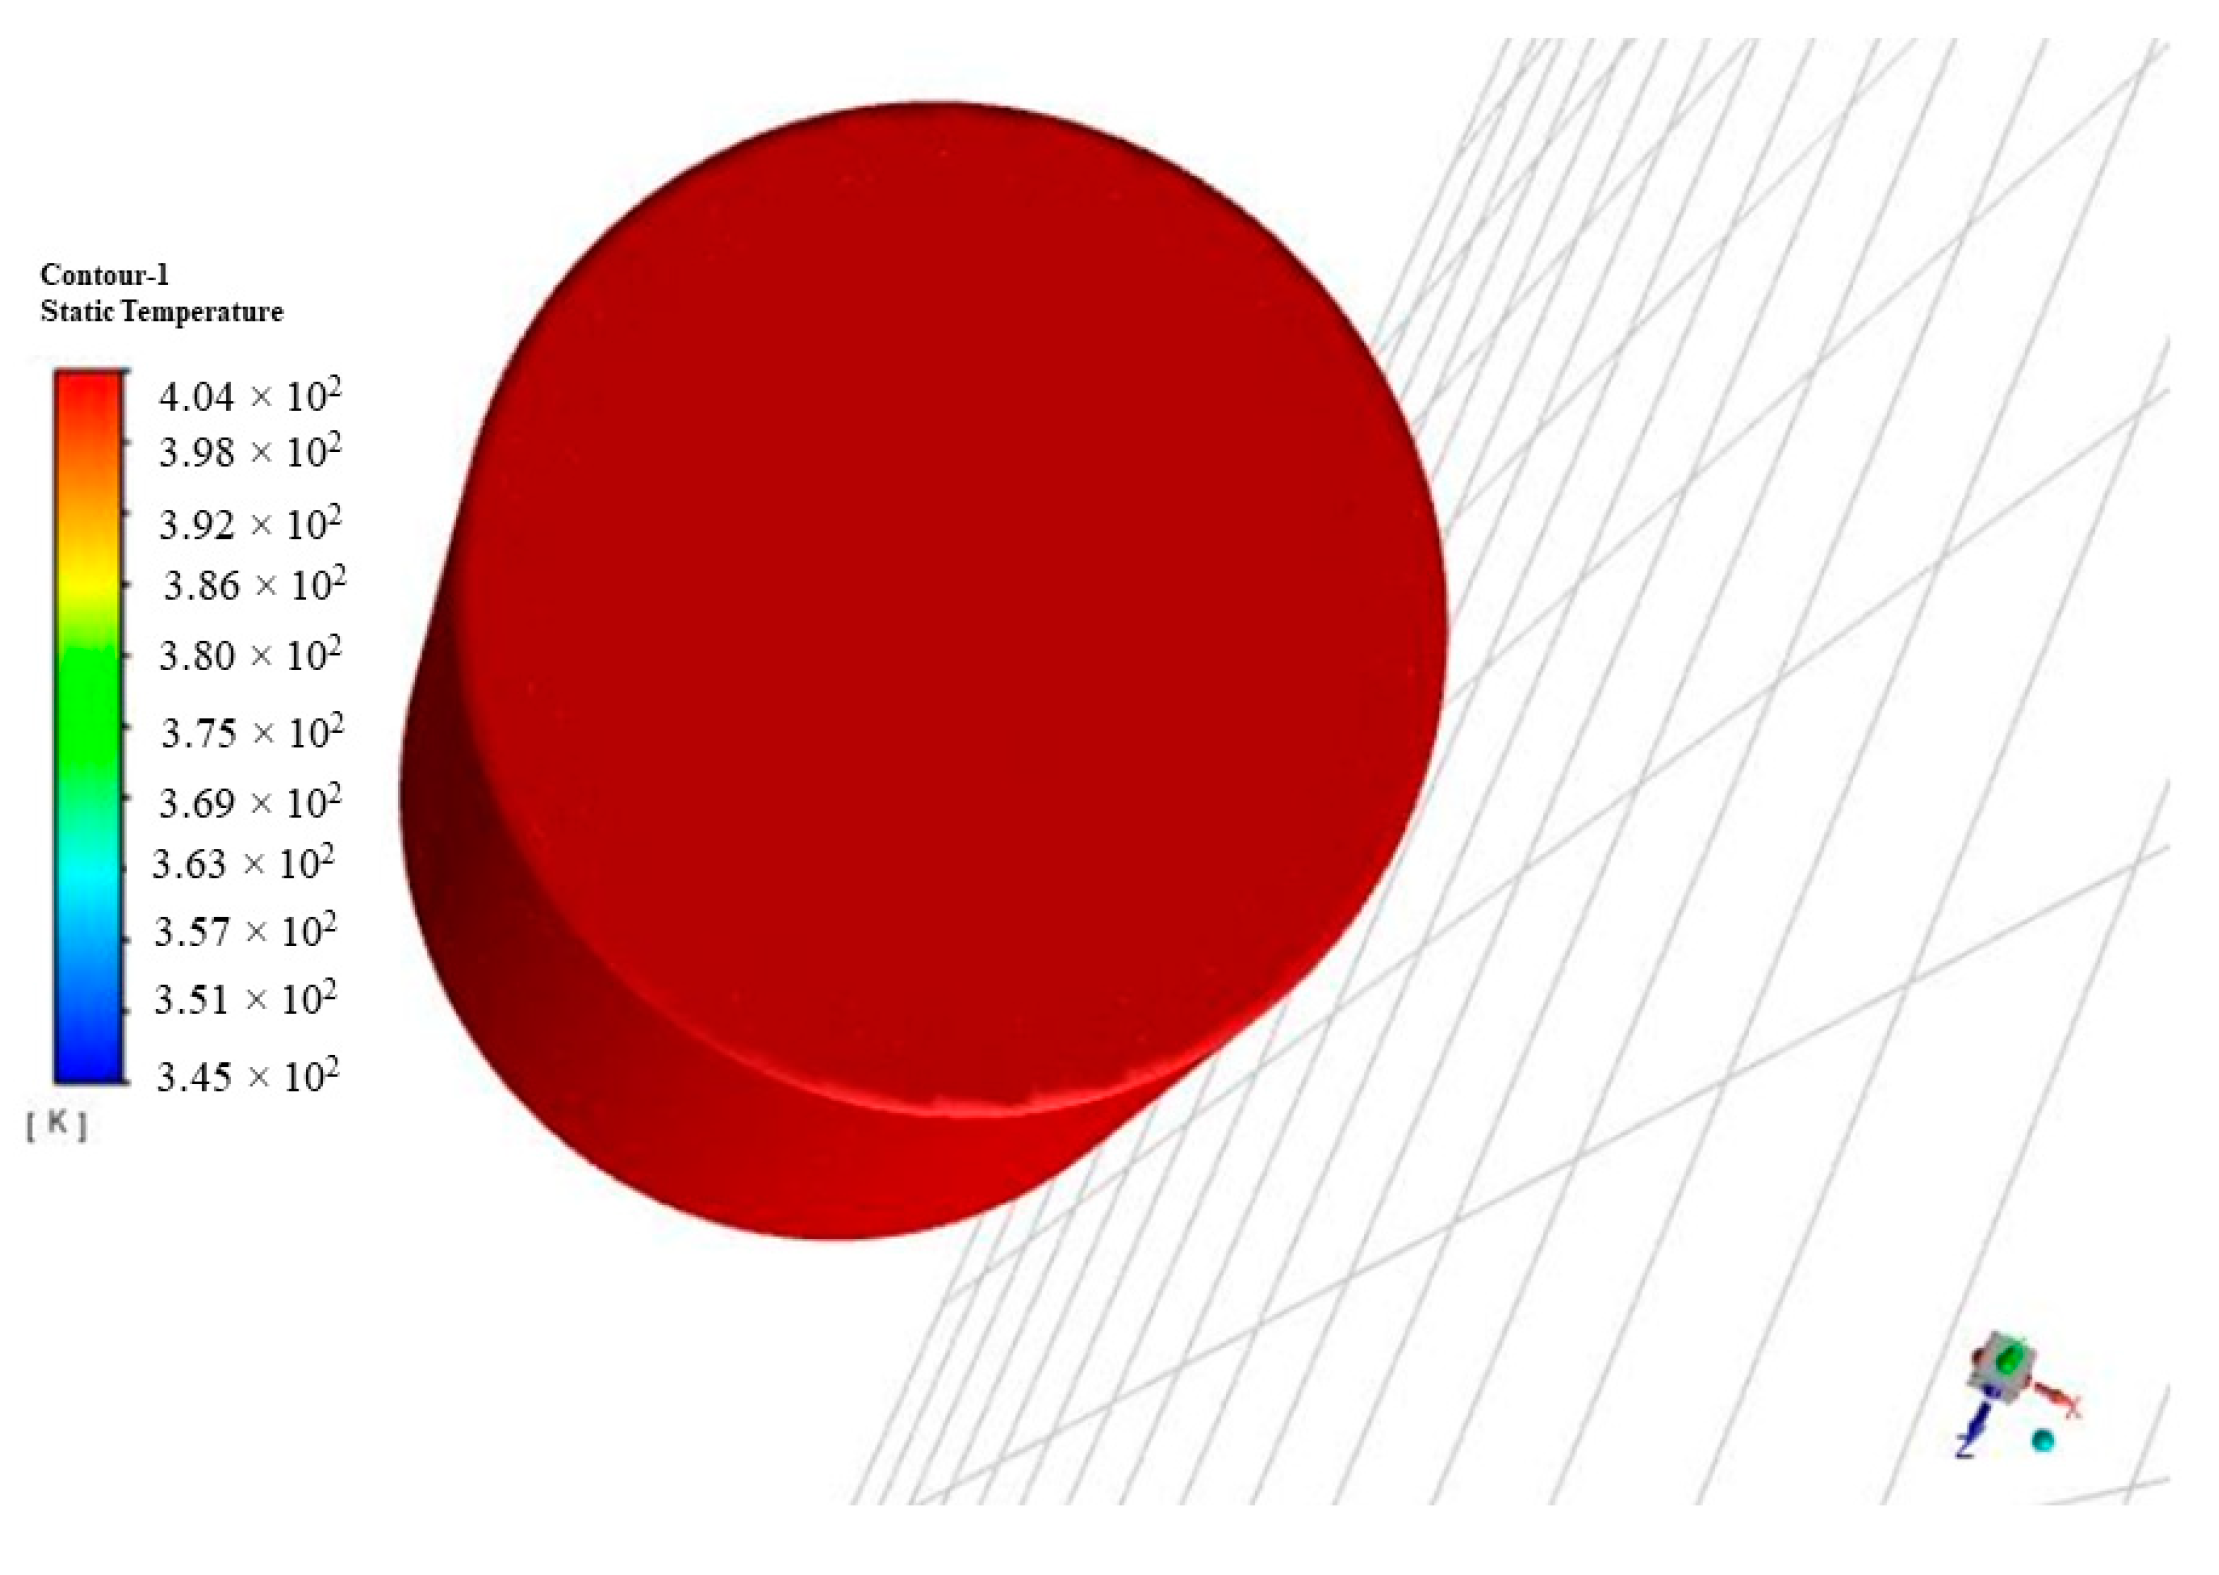
Front view of the static temperature contour is shown in Figure 9. This shows the lateral surface of the storage element where red color is uniformly distributed, which means that the energy storage element is in uniform temperature of 404 K.
The energy storage element for the solar-concentrating spittoon is made of a copper case which is filled with the paraffin wax [25,26]. Paraffin wax has good properties of storing heat energy in liquid form. Its melting temperature and vaporizing temperature is 333 K and 573 K, respectively. It can store large amounts of heat energy in liquid form and maintain the uniform temperature of the receiver which is shown in Figure 10.
After designing, modeling, and constructing a solar-concentrating spittoon, an infrared thermometer takes readings from the energy-storing element surface, a copper container filled with paraffin wax as shown in Figure S4. Phase change materials are used for maintaining uniform temperature and heat at the saliva-collecting region and readings are taken for several days. Readings are taken from 6 am to 6 pm at the interval of one hour. Average reading values are considered in calculations, which are given in Table S5. In this table, solar irradiation data are taken from https://www.nrel.gov.in, accessed on 2 June 2023.
The variation of receiver temperature of the concentrated spittoon is depicted in Figure 11. It was observed that during 6.00 a.m. to 7.00 p.m., the temperature at the receiver is almost equal to the ambient temperature. This is because the sun is not shining at the time of rising. So, the concentrator’s reflector collects less solar irradiation from the sun. From 7.00 a.m. to 9.00 a.m., the sun rises and it is on its way to shine at its higher intensity, so the slope of the receiver temperature graph increases. The solar intensity is high from 9.00 a.m. to 4.00 p.m., so the concentrator’s reflector collects a larger amount of solar irradiation. At this duration of time, the receiver attained its maximum temperature of that day. The observed reading from an infrared thermometer is approximately 386 K. After 4.00 p.m., the temperature of the receiver decreases. This is due to the decrease in irradiation from the sun.
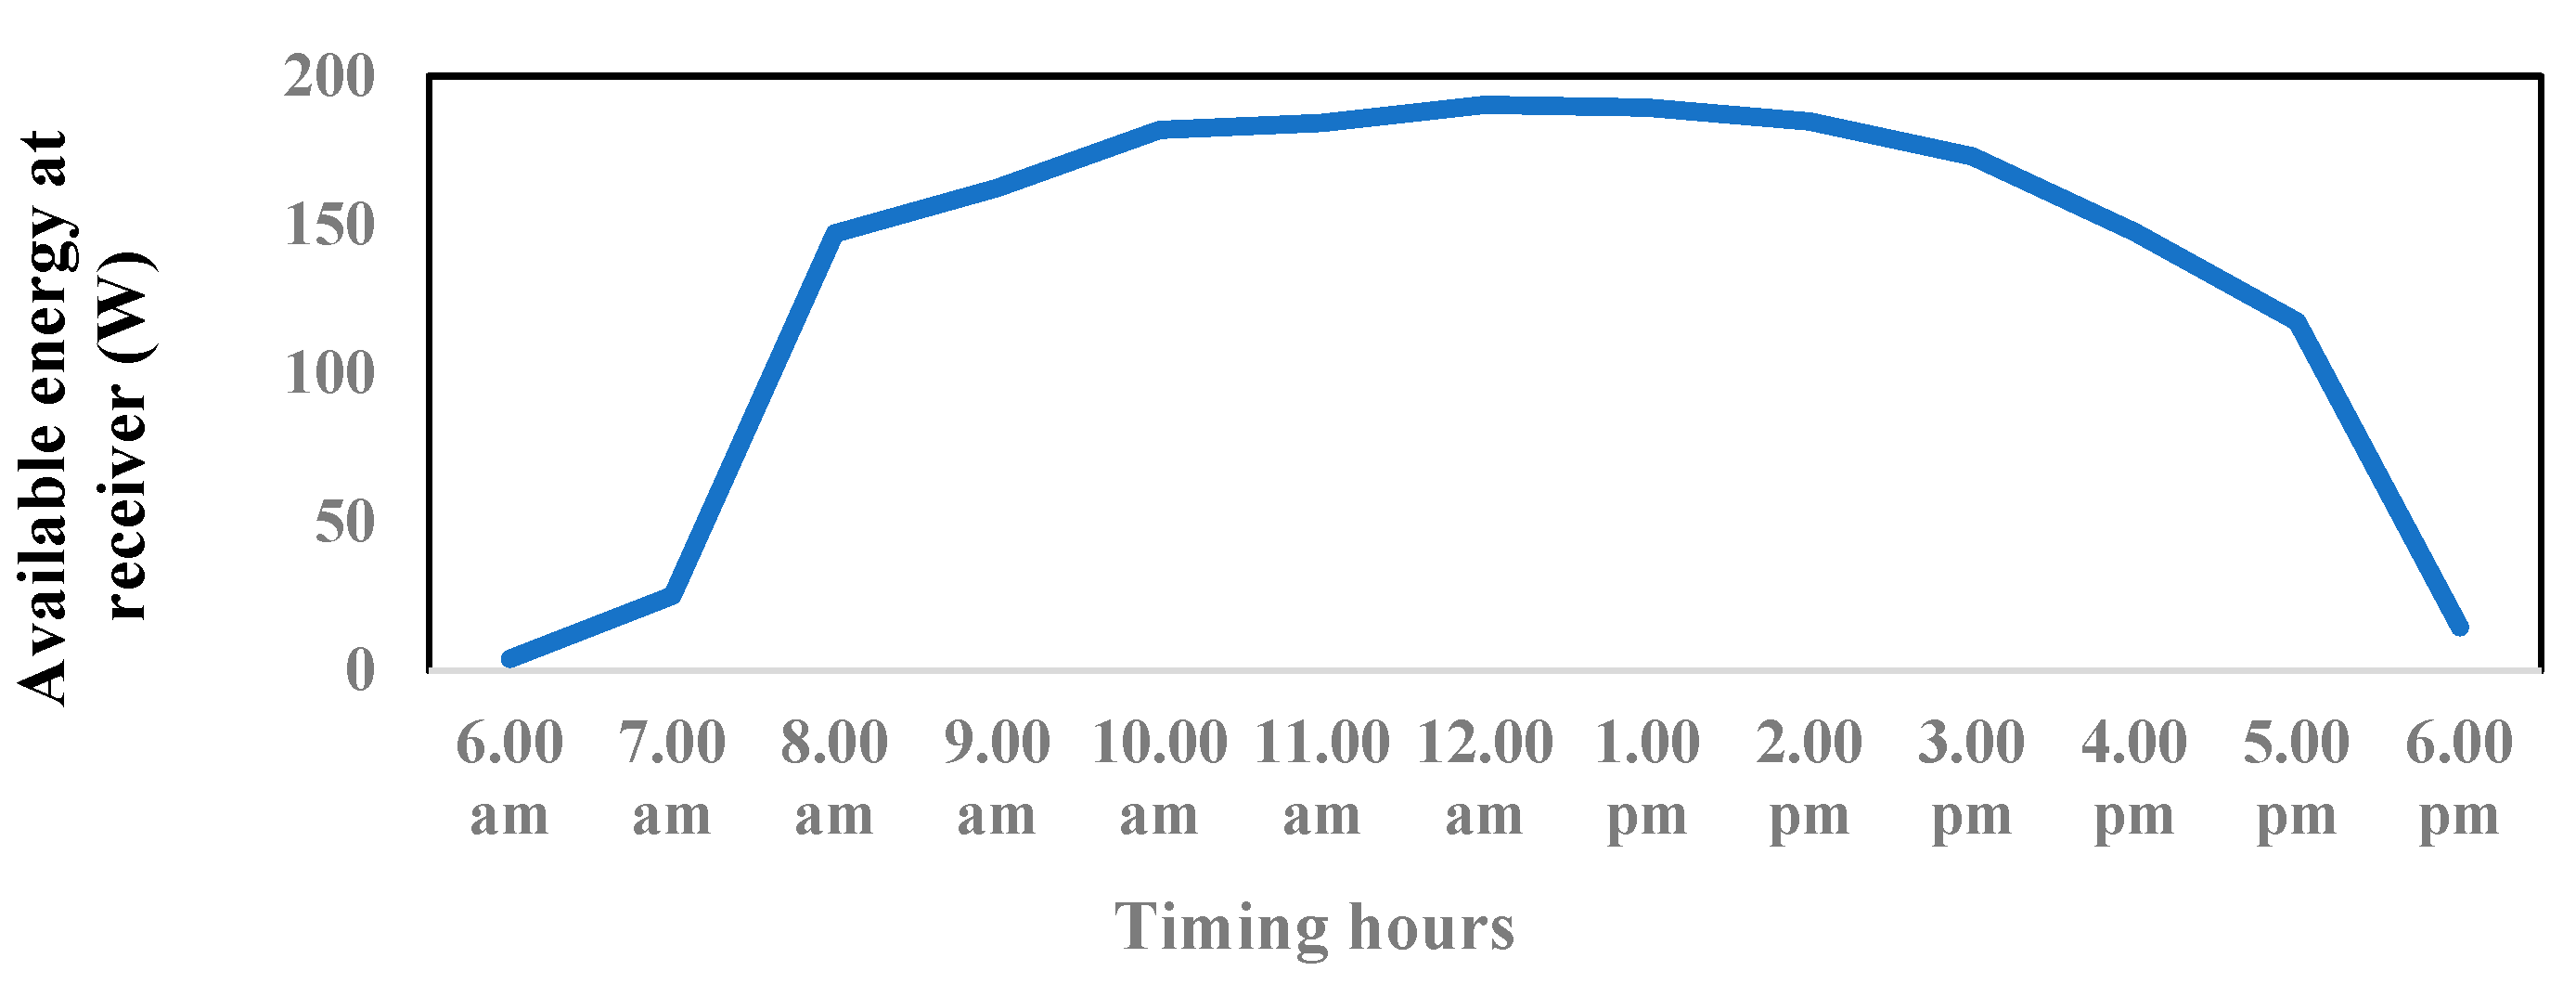
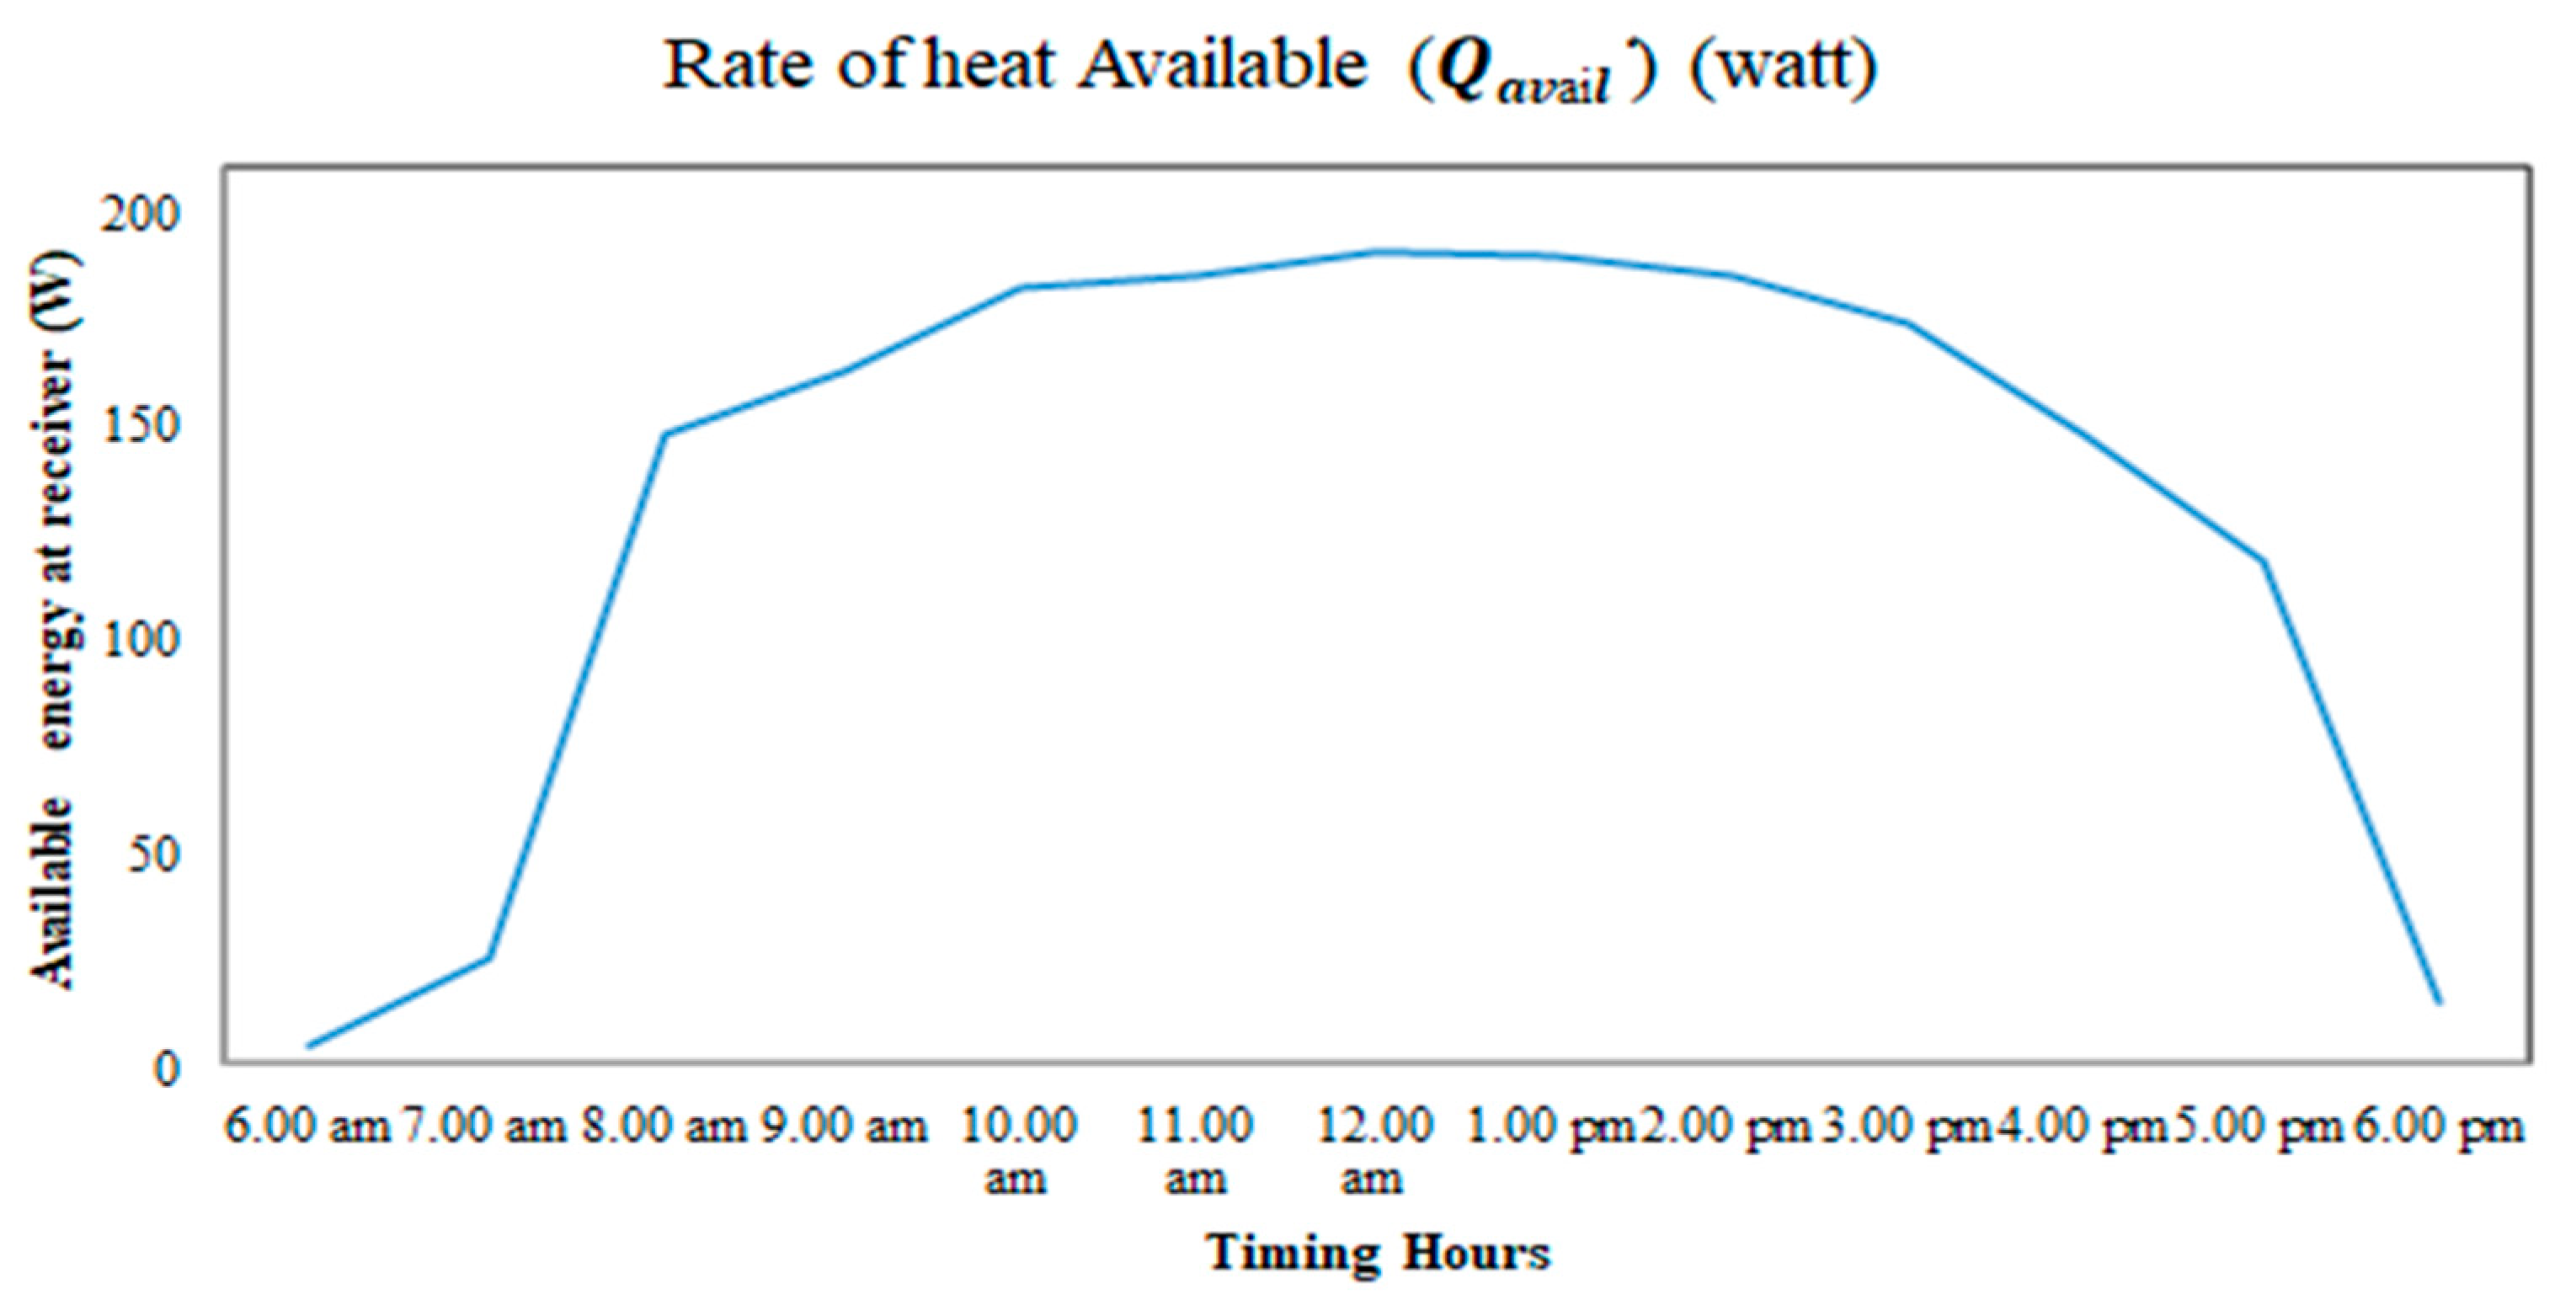
Variation of the available energy at the receiver point is plotted against timing hours in Figure 12. The available energy of the receiver was minimum from 6.00 a.m. to 7.00 a.m. The slope of available energy was positive from 7.00 a.m. to 9.00 a.m.. From 9.00 am to 4.00 p.m., the available energy for the burning of saliva is almost uniform. At 386 K, the calculated available energy at the receiver was 176 W. After 4.00 p.m., the available energy at the receiver becomes reduced.
The time duration for the burning of 3 mL of spit saliva is depicted in Figure 13. Average time duration for burning of saliva was 46 s, in the period from 8.00 a.m. to 5.00 p.m. So, this solar-concentrating spittoon gives the best performance for 9 h. So, it can be used at public places such as parks, railway stations, etc.

5.2. Performance Analysis

The parameters of performance analysis for solar concentrators considered are optical efficiency (ηop) of the solar concentrator, receiver efficiency (ηrec), and overall efficiency (ηo). Table S3 depicts the required dependent and independent input values and constants (Supplementary Sheet).

5.2.1. Optical or Concentrator Efficiency

The fraction of solar heat radiation that is incident onto a receiver glass tube after reflection through reflectors is known as optical or concentrator ratio. Equation (12) calculates optical efficiency:
η o p = e . ( cos θ i ) . p . ϕ
ηop = 1 × (cos 0) × 0.93 × 0.95; ηop = 0.8835.

5.2.2. Receiver Thermal Efficiency

It is the concentrated solar heat flow on the receiver after reflection by reflectors. The receiver does not entirely receive this solar heat flow, a portion is lost by convection and radiation to the surrounding air or atmosphere. The quantity of heat a receiver loses relies on many variables, including absorption, transmittance, aperture area heat transfer coefficient, radiation factor, and receiver-operating temperature. Equation (13) calculates the thermal efficiency of a receiver:
η r e c = τ × α { U × ( T r e c T a m b ) + σ × F × ( T 4 r e c T 4 a m b ) } η o p × C R g × I S n
ηrec = 0.8.
Through the receiver thermal efficiency, it was found that the receiver absorbed approximately 80% of the solar heat and 20% of the heat was lost to the surroundings by convection and radiation.

5.2.3. Overall Efficiency

The overall efficiency of a solar concentrator is the heat available for use of burning of saliva after heat is lost due to reflector inefficacy and receiver (through convection and radiation). The product of optical efficiency to receiver thermal efficiency calculates it (Equation (14)):
η o = η r e c × η o p
ηo = 0.8 × 0.88; ηo = 0.704.
The overall efficiency was found to be around 70% of the heat available at the receiver for burning spit saliva over solar radiation incident onto the aperture area of the solar concentrator.

6. Discussion

During experimentation, for the assessment of saliva fluids, properties of protein molecules are neglected because the collected saliva is assumed to be a uniform mixture of water. The variation of thermophysical properties such as specific heat at constant temperature is also not considered. It symbolizes that the specific heat is treated as constant with respect to the change in temperature. Very slight changes have been observed up to decimal points [27]. While collecting the volume specimen of spitted saliva, it is observed that the initial temperature of saliva is approximately equal to the body temperature of a healthy person [28]. This temperature similarity suggests that the saliva specimen is representative of the physiological conditions within the person’s oral cavity. It also implies that the collection process did not significantly alter the temperature of the saliva, allowing for accurate analysis and examination of its components and properties.
The observed variation in receiver temperature with sunshine duration, as described, indicates a specific trend in the behavior of the receiver surface temperature throughout the day. The findings suggest that the temperature of the receiver surface initially rises and reaches its highest point at 2:00 p.m. After reaching this peak, the temperature gradually declines until the evening hours, specifically around 6:00 p.m. This pattern can be explained by the interaction between solar radiation and the receiver surface [29,30].
As the sun rises and the intensity of solar radiation increases, the receiver surface absorbs more energy from the sun. This absorption leads to an increase in the temperature of the receiver surface. At 2:00 p.m, when the receiver surface temperature reaches its maximum, the solar radiation has been at its highest point for several hours, resulting in the highest amount of energy absorbed by the receiver. After this peak, the intensity of solar radiation decreases. Consequently, the receiver surface receives less energy, causing its temperature to gradually decline. By 6:00 p.m, the sun is approaching the horizon, and the solar radiation reaching the receiver surface is significantly reduced. As a result, the receiver surface continues to lose heat, causing a further decline in temperature. It is important to note that this observed variation in temperature with sunshine duration may also be influenced by other factors, such as ambient temperature, wind speed, and any shading or obstructing objects around the receiver [31,32]. Nevertheless, the general trend of increasing temperature until midday and subsequent decline towards the evening aligns with the expected behavior of a surface exposed to solar radiation throughout the day [31,32,33,34].
As the temperature increases, the available energy at receiver’s point increases which raises its working efficiency. The burning of saliva at the receiver’s point of a spittoon takes place. During the experimentation, it is recorded that the average duration for burning of saliva is 46 s. It is observed that the effective burning of saliva starts from the early morning, 8 a.m., to the evening, 5 p.m. As the solar intensity is high from 9.00 a.m. to 4.00 p.m., the concentrator’s reflector collects a larger amount of solar irradiation [35]. Within this time interval, the receiver attained its maximum temperature of that day. From the calculation, it is shown that the maximum thermal efficiency of the receiver surface is 80%. Experimental results show that the receiver’s temperature and available energy are 390 K and 176 W, respectively. The governing parameters of thermal efficiency are temperature difference of receiver surface and ambient environment. A small fraction of the heat loss occurs due to convection and radiation heat transfer to the surrounding environment [36,37]. Ideally, to maximize the thermal efficiency of the receiver, it is desirable to minimize the temperature difference between the receiver surface and the ambient environment. By reducing this temperature difference, the heat loss from the receiver was decreased, thus improving its overall efficiency. This can be achieved through various means such as effective insulation, optimized design, and efficient heat transfer mechanisms.

Limitations of Solar-Concentrating Spittoon

The solar-concentrating spittoon system includes few limitations. This system does not have concern over the airborne spread of viruses, which is the major transmission route. One of the major concerns with this system is that at off sunshine hours, the performance of the spittoon falls. For better results in terms of thermal performance, it needs a solar tracking system so that it can trace itself in the normal direction of solar incident radiations to work effectively.

7. Conclusions

This article discusses the design, modelling, and development of a solar-concentrating spittoon. It is found that the average temperature measured by an infrared thermometer during the experimental method is 390 K from 6 a.m. to 7 a.m. Based on experimental data, the temperature and accessible heat of energy storage components are almost similar to the surrounding temperature. Its temperature and available energy are 390 K and 176 W, respectively, from 9 a.m. to 4 p.m., and it maintains a consistent temperature and energy level at the receiver for seven hours. After 5 p.m., the temperature and heat at the receiver return to ambient values. Average time duration for burning of saliva was 46 s between the period of 8.00 a.m. to 5.00 p.m. The overall efficiency was found to be around 70% of the heat available at the receiver for burning spit saliva over solar radiation incident onto the aperture area of the solar concentrator. Therefore, it may be used in public areas such as parks, zoos, buses, etc., to prevent the spread of the COVID-19 virus.

8. Future Scope

Although the solar-concentrating spittoon is efficient and fulfils our need for burning spit using solar energy, it is not ideal. Additional research can be conducted to enhance its performance and efficacy. Better results require a solar tracking arrangement to generate more heat and temperature from solar energy. Some energy storage elements and design refinement are required to reduce heat losses from the receiver and improve its performance and efficiency.

Supplementary Materials

The following supporting information can be downloaded at: https://www.mdpi.com/article/10.3390/su15129286/s1, Figure S1: Fabricated solar concentration spittoon; Figure S2: Computational domain for different parts of solar concentrating spittoon; Figure S3: Reflected solar irradiation heat flux (isometric view); Figure S4: Temperature at the concentrating point of the spittoon; Table S1: Material used for solar concentrator; Table S2: Materials used for the fabrication of receiver; Table S3: Design specification of solar concentrator spittoon; Table S4: Boundary condition; Table S5: Recorded experimental data of temperature, irradiation, heat availability, and time to burn saliva.

Author Contributions

Conceptualization, A.S., T.M.A.-H. and S.A.; methodology, D.K. and T.M.A.-H.; software, A.K. and N.F.; validation, N.K. and S.P.; formal analysis, A.K. and A.S.; investigation, A.S. and R.C.; resources, N.F. and A.A.A.; data curation, D.K.; writing—original draft preparation, N.F., A.K., S.P., S.M.M.H. and A.S.; writing—review and editing, D.K., S.P., S.A.,T.M.A.-H., A.A.A., R.C. and S.M.M.H.; visualization, A.K. and R.C.; supervision, S.M.M.H., S.P. and N.K.; project administration, S.M.M.H., N.K. and D.K.; funding acquisition, S.A., T.M.A.-H. and A.A.A. All authors have read and agreed to the published version of the manuscript.

Funding

This work was funded by Researchers Supporting Project number (RSP2023R26), King Saud University, Riyadh, Saudi Arabia.

Institutional Review Board Statement

Not applicable.

Informed Consent Statement

Not applicable.

Data Availability Statement

All the data used to support the findings of this study are included within the article.

Conflicts of Interest

The authors declare no conflict of interest.

Nomenclature

QEnergy required to evaporate saliva (J).
mAverage amount of saliva spit by a person (kg).
CpwSpecific heat of saliva (kJ/kg K).
TbEvaporation temperature of saliva at atmospheric pressure (k).
TeBody temperature of a person (K).
LtLatent heat of vaporization of water (KJ/Kg).
PPower (W).
ΤTime (sec).
AAperture area of solar concentrator reflector in (m2).
ISRadiant energy received by earth surface from the sun in India (W/m2).
qlossHeat loss by receiver to surrounding by convection (W).
XAperture plane coordinate in x-axis.
YAperture plane coordinate in y-axis.
ZDistance from the vertex of concentrator parallel to the symmetry axis of the reflector (m).
fFocal length of concentrator (m).
dDiameter of concentrator (m).
φrmRim angle.
rNormal area of reflector that is exposed to sun (m2).
nNumber of wooden frames.
afArea of frame that is exposed to sunlight (m2).
d0Diameter of outer ring of reflector (m).
diDiameter of inner most ring of reflectors (m).
tThickness of frame (m).
lLength of frame (m).
AabAbsorber area (m2).
drDiameter of receiver (m).
lrEffective length of receiver area where flux of heat collected (m).
CRgGeometric concentration ratio.
ArecnArea of receiver normal to incident radiation (m2).
ηrecReceiver efficiency.
ηopOptical efficiency.
ηoOverall efficiency.
IsnNormal Solar irradiation (W/m2).
UOverall heat transfer coefficient (W/m2K).
σStefan Boltzmann constant.
FRadiative conductance.
eFraction of area exposer to sun.
αAbsorptance.
τTransmittance.
iFraction of intercept.
rReflectivity of reflectors.

References

  1. Kamyab, H.; Naderipour, A.; Jahannoush, M.; Abdullah, A.; Marzbali, M.H. Potential effect of SARS-CoV-2 on solar energy generation: Environmental dynamics and implications. Sustain. Energy Technol. Assess. 2022, 52, 102027. [Google Scholar] [CrossRef]
  2. Van Doremalen, N.; Bushmaker, T.; Morris, D.H.; Holbrook, M.G.; Gamble, A.; Williamson, B.N.; Tamin, A.; Harcourt, J.L.; Thornburg, N.J.; Gerber, S.I.; et al. Aerosol and surface stability of SARS-CoV-2 as compared with SARS-CoV-1. New Engl. J. Med. 2020, 382, 1564–1567. [Google Scholar] [CrossRef] [PubMed]
  3. Raeiszadeh, M.; Adeli, B. A critical review on ultraviolet disinfection systems against COVID-19 outbreak: Applicability, validation, and safety considerations. Acs Photonics 2020, 7, 2941–2951. [Google Scholar] [CrossRef]
  4. Chin, A.W.; Poon, L.L. Stability of SARS-CoV-2 in different environmental conditions–Authors’ reply. Lancet Microbe 2020, 1, e10. [Google Scholar] [CrossRef]
  5. John, R.M.; Sinha, P.; Munish, V.G.; Tullu, F.T. Economic costs of diseases and deaths attributable to tobacco use in India, 2017–2018. Nicotine Tob. Res. 2021, 23, 294–301. [Google Scholar] [CrossRef]
  6. Kumar, D.; Mitra, R.K.; Chouhan, T.; Farrukh, M.; Faisal, N. Effect of Moisture Absorption on Interfacial Shear Properties of the Bio-Composites. In Aging Effects on Natural Fiber-Reinforced Polymer Composites: Durability and Life Prediction; Springer Nature Singapore: Singapore, 2022; pp. 237–256. [Google Scholar]
  7. Coomber, R.; Moyle, L.; Pavlidis, A. Public spitting in “developing” nations of the global south: Harmless embedded practice or disgusting. Harmful and deviant? In The Palgrave Handbook of Criminology and the Global South; Springer International Publishing AG: Singapore, 2018; pp. 493–520. [Google Scholar]
  8. Pal, S.; Verma, A.; Raikwar, S.; Prajapati, Y.K.; Saini, J.P. Detection of DNA hybridization using graphene-coated black phosphorus surface plasmon resonance sensor. Appl. Phys. A 2018, 124, 1. [Google Scholar] [CrossRef]
  9. Huang, W.; Zhu, J.; Wang, M.; Hu, L.; Tang, Y.; Shu, Y.; Xie, Z.; Zhang, H. Emerging mono-elemental bismuth nanostructures: Controlled synthesis and their versatile applications. Adv. Funct. Mater. 2021, 31, 2007584. [Google Scholar] [CrossRef]
  10. Abraham, J.P.; Plourde, B.D.; Cheng, L. Using heat to kill SARS-CoV-2. Rev. Med. Virol. 2020, 30, e2115. [Google Scholar] [CrossRef]
  11. Gautret, P.; Colson, P.; Lagier, J.C.; Parola, P.; Raoult, D. Does spitting in public play a role in transmitting SARS-CoV-2? Travel Med. Infect. Dis. 2020, 36, 101759. [Google Scholar] [CrossRef]
  12. Kholaif, M.M.N.H.K.; Xiao, M.; Tang, X. COVID-19’s fear-uncertainty effect on renewable energy supply chain management and ecological sustainability performance; the moderate effect of big-data analytics. Sustain. Energy Technol. Assess. 2022, 53, 102622. [Google Scholar]
  13. Marr, L.C.; Tang, J.W.; Van Mullekom, J.; Lakdawala, S.S. Mechanistic insights into the effect of humidity on airborne influenza virus survival, transmission and incidence. J. R. Soc. Interface 2019, 16, 20180298. [Google Scholar] [CrossRef]
  14. Chan, K.H.; Peiris, J.M.; Lam, S.Y.; Poon, L.L.M.; Yuen, K.Y.; Seto, W.H. The Effects of Temperature and Relative Humidity on the Viability of the SARS Coronavirus. Adv. Virol. 2011, 2011, 734690. [Google Scholar] [CrossRef]
  15. Kumara, D.; Faisalb, N.; Layekc, A.; Kumard, N.; Kumare, R. Performance Improvement of a Solar Desalination System Assisted with Solar Air Heater: An Experimental Approach. J. Indian Chem. Soc. 2020, 97, 1967–1972. [Google Scholar]
  16. Chen, Z.; Li, J.; Li, T.; Fan, T.; Meng, C.; Li, C.; Huang, Y.; Wang, Y.; Zhang, H. A CRISPR/Cas12a-Empowered Surface Plasmon Resonance Platform for Rapid and Specific Diagnosis of the Omicron Variant of SARS-CoV-2. Nat. Sci. Rev. 2022, 9, nwac104. [Google Scholar] [CrossRef] [PubMed]
  17. Ou, G.; Tang, Y.; Niu, S.; Wu, L.; Li, S.; Yang, Y.; Ma, X.; Peng, L.; Liu, Y. Wastewater Surveillance and an Automated Robot: Effectively Tracking SARS-CoV-2 Transmission in the Post-Epidemic Era. Nat. Sci. Rev. 2023, 10, nwad089. [Google Scholar] [CrossRef]
  18. Razab, M.K.A.A.; Nawi, N.M.; Hadzuan, F.H.M.; Abdullah, N.H.; Muhamad, M.; Sunaiwi, R.; Ibrahim, F.; Zin, F.A.M.; Noor, A.M. Fluorine-18 Fluorodeoxyglucose Isolation Using Graphene Oxide for Alternative Radiopharmaceutical Spillage Decontamination in PET Scan. Sustainability 2022, 14, 4492. [Google Scholar] [CrossRef]
  19. Al-Rawi, M.; Farid, M.M.; Jones, R.J.; Louie, K. Evaluation of a Polyester Filter and UV Light (PFUV) Dehumidifier to Improve Indoor Environmental Quality: Preliminary Results. Sustainability 2022, 14, 4504. [Google Scholar] [CrossRef]
  20. Hu, Y.; Xu, Z.; Hu, Y.; Hu, L.; Zi, Y.; Wang, M.; Feng, X.; Huang, W. Bismuth Quantum Dot (Bi QD)/Polydimethylsiloxane (PDMS) Nanocomposites with Self-Cleaning and Antibacterial Activity for Dental Applications. Nanomaterials 2022, 12, 3911. [Google Scholar] [CrossRef]
  21. Chen, H.; Wang, M.; Huang, W. Two-Dimensional Selenium Nanosheet-Based Sponges with Superior Hydrophobicity and Excellent Photothermal Performance. Nanomaterials 2022, 12, 3756. [Google Scholar] [CrossRef]
  22. Yan, J.; Grantham, M.; Pantelic, J.; De Mesquita, P.J.B.; Albert, B.; Liu, F.; Ehrman, S.; Milton, D.K.; Consortium, E. Infectious virus in exhaled breath of symptomatic seasonal influenza cases from a college community. Proc. Natl. Acad. Sci. USA 2018, 115, 1081–1086. [Google Scholar] [CrossRef] [PubMed] [Green Version]
  23. Ma, Y.; Zhao, Y.; Liu, J.; He, X.; Wang, B.; Fu, S.; Yan, J.; Niu, J.; Zhou, J.; Luo, B. Effects of temperature variation and humidity on the death of COVID-19 in Wuhan, China. Sci. Total Environ. 2020, 724, 138226. [Google Scholar] [CrossRef]
  24. Morris, D.H.; Yinda, K.C.H.; Gamble, A.; Rossine, F.W.; Huang, Q.; Bushmaker, T.; Fischer, R.J.; Matson, M.J.; Van Doremalen, N.; Vikesland, P.J.; et al. The effect of temperature and humidity on the stability of SARS-CoV-2 and other enveloped viruses. BioRxiv 2020. [Google Scholar] [CrossRef]
  25. Vellingiri, B.; Jayaramayya, K.; Iyer, M.; Narayanasamy, A.; Govindasamy, V.; Giridharan, B.; Ganesan, S.; Venugopal, A.; Venkatesan, D.; Ganesan, H.; et al. COVID-19: A promising cure for the global panic. Sci. Total Environ. 2020, 725, 138277. [Google Scholar] [CrossRef] [PubMed]
  26. Duttaluru, G.; Singh, P.; Ansu, A.K.; Sharma, R.K.; Mishra, S. Methods to enhance the thermal properties of organic phase change materials: A review. Mater. Today Proc. 2022, 63, 685–691. [Google Scholar] [CrossRef]
  27. Zhao, H.J.; Liu, X.Y.; Liu, Z.H.; Zhang, H.T.; Yan, J.H. Experimental Investigation of the Specific Heat Capacity of Nanofluids. Appl. Therm. Eng. 2016, 99, 393–398. [Google Scholar]
  28. Scannapieco, A.; Genco, R. Impact of Oral Health on Systemic Health in Older Adults. Oral Dis. 2019, 25, 14–19. [Google Scholar]
  29. Kalogirou, S.A. A review on the performance of solar collectors. Renew. Sustain. Energy Rev. 2004, 11, 403–427. [Google Scholar]
  30. Li, Y.; Li, J.; Li, H.; Li, Y.; Wang, J.; Wu, H.; Li, J. Numerical investigation of a high-temperature solar receiver for a solar tower power plant. Energy Convers. Manag. 2020, 213, 112813. [Google Scholar]
  31. Jones, P.D.; Hulme, M. Calculating Regional Climatic Time Series for Temperature and Precipitation: Methods and Illustrations. Int. J. Climatol. 1997, 17, 141–157. [Google Scholar] [CrossRef]
  32. Huang, J.; You, Q.; Yang, K.; Ren, G. Estimation of Air Temperature Lapse Rates in the Tibetan Plateau: A Case Study over the Tuotuohe Basin. J. Geophys. Res. Atmos. 2011, 116, D04102. [Google Scholar]
  33. Santamouris, M.; Papanikolaou, N.; Livada, I.; Koronakis, I.; Georgakis, C.; Argiriou, A.; Assimakopoulos, D.N. On the impact of urban climate on the energy consumption of buildings. Sol. Energy 2001, 70, 201–216. [Google Scholar] [CrossRef]
  34. Kasten, F.; Czeplak, G. Solar and terrestrial radiation dependent on the amount and type of cloud. Sol. Energy 1980, 24, 177–189. [Google Scholar] [CrossRef]
  35. Loferski, J.J. Theoretical Limits to the Conversion of Solar Radiation into Electricity. J. Appl. Phys. 1956, 27, 777–788. [Google Scholar] [CrossRef]
  36. Rezaei, M.; Farzaneh-Gord, M. Experimental Investigation of Convective Heat Transfer and Thermal Radiation Heat Transfer from a Heated Horizontal Cylinder. Int. J. Heat Mass Transf. 2019, 135, 928–940. [Google Scholar]
  37. Kumar, A.; Kumar, R. Solar Collector Efficiency Enhancement: A Comprehensive Review. Renew. Sustain. Energy Rev. 2017, 73, 149–168. [Google Scholar]
Figure 1. Catia V5 model of the solar-concentrating spittoon.
Sustainability 15 09286 g001
Figure 2. Mesh view of the solar spittoon.
Sustainability 15 09286 g002
Figure 3. Paths of light beams on the solar concentrator.
Sustainability 15 09286 g003
Figure 4. Contour of solar heat flux (top view).
Sustainability 15 09286 g004
Figure 5. Contour of solar heat flux (isometric view).
Sustainability 15 09286 g005
Figure 6. Reflected solar irradiation heat flux (top view).
Sustainability 15 09286 g006
Figure 7. Contour of absorbed IR solar flux.
Sustainability 15 09286 g007
Figure 8. Contour of static temperature (top view).
Sustainability 15 09286 g008
Figure 9. Contour of static temperature (front view).
Sustainability 15 09286 g009
Figure 10. Contour of the energy storage element.
Sustainability 15 09286 g010
Figure 11. Receiver temperature at the concentrating point of the spittoon.
Sustainability 15 09286 g011
Figure 12. Variation of the available energy at the receiver point.
Sustainability 15 09286 g012
Figure 13. Variation of time duration for the burning of 3 mL of spitted saliva.
Sustainability 15 09286 g013
Disclaimer/Publisher’s Note: The statements, opinions and data contained in all publications are solely those of the individual author(s) and contributor(s) and not of MDPI and/or the editor(s). MDPI and/or the editor(s) disclaim responsibility for any injury to people or property resulting from any ideas, methods, instructions or products referred to in the content.