2.1. Concept of Energy Efficiency Function for Carbon Neutrality Design of Whole Life Cycle Buildings
The phrase “full life cycle of a building” refers to the entire procedure of producing materials and components, planning and designing, building and moving them, operating and maintaining them, and removing and treating them (waste, recovery, reuse, etc.). Significant technology content, a protracted construction period, high risk, and the involvement of numerous units are hallmarks of construction projects [
12]. As a result, this study utilizes the whole life cycle hypothesis to determine the carbon emissions of buildings throughout the course of their whole life cycle. The period from the structure’s acceptance at completion to the end of its intended service life is referred to as the “whole life cycle of a building”. The entire service life of typical constructions is longer than the anticipated service conditions. Additionally, the methods of architectural design and the key influencing factors at different stages of its entire lifecycle affect the maintainability of building structures, resulting in some structures having lower actual service lives than expected [
13]. A specific definition and a general notion are both used to describe the concept of building energy use. The energy used by all materials and equipment in the building during manufacture and processing, as well as the operating energy used by the building while it is being used, are all included in the generalized building energy consumption. Building energy consumption, when interpreted strictly, only refers to the amount of energy used by a building while it is occupied, ignoring production energy consumption. Therefore, the term “full life cycle building energy consumption” refers to the whole operating amount of energy consumption from completion acceptance to design service life [
14].
Building material preparation, construction, building use and maintenance, and building demolition were the four stages that Wolf et al. (2021) identified in the building life cycle [
15]. Building energy consumption is broken down into three categories by Pauliuk et al. (2021): physical energy, chemical energy, and operational energy, or the three stages of materialization, usage, and demolition [
16]. Construction projects, operations, maintenance, building deconstruction, and solid sewage disposal were the five stages that Ferreira et al. (2020) divided the building life cycle into [
17]. By accounting for the manufacture, transportation, construction, operation, maintenance, and demolition of building materials, Hossain et al. (2022) divided the carbon emission during the full life cycle into six stages [
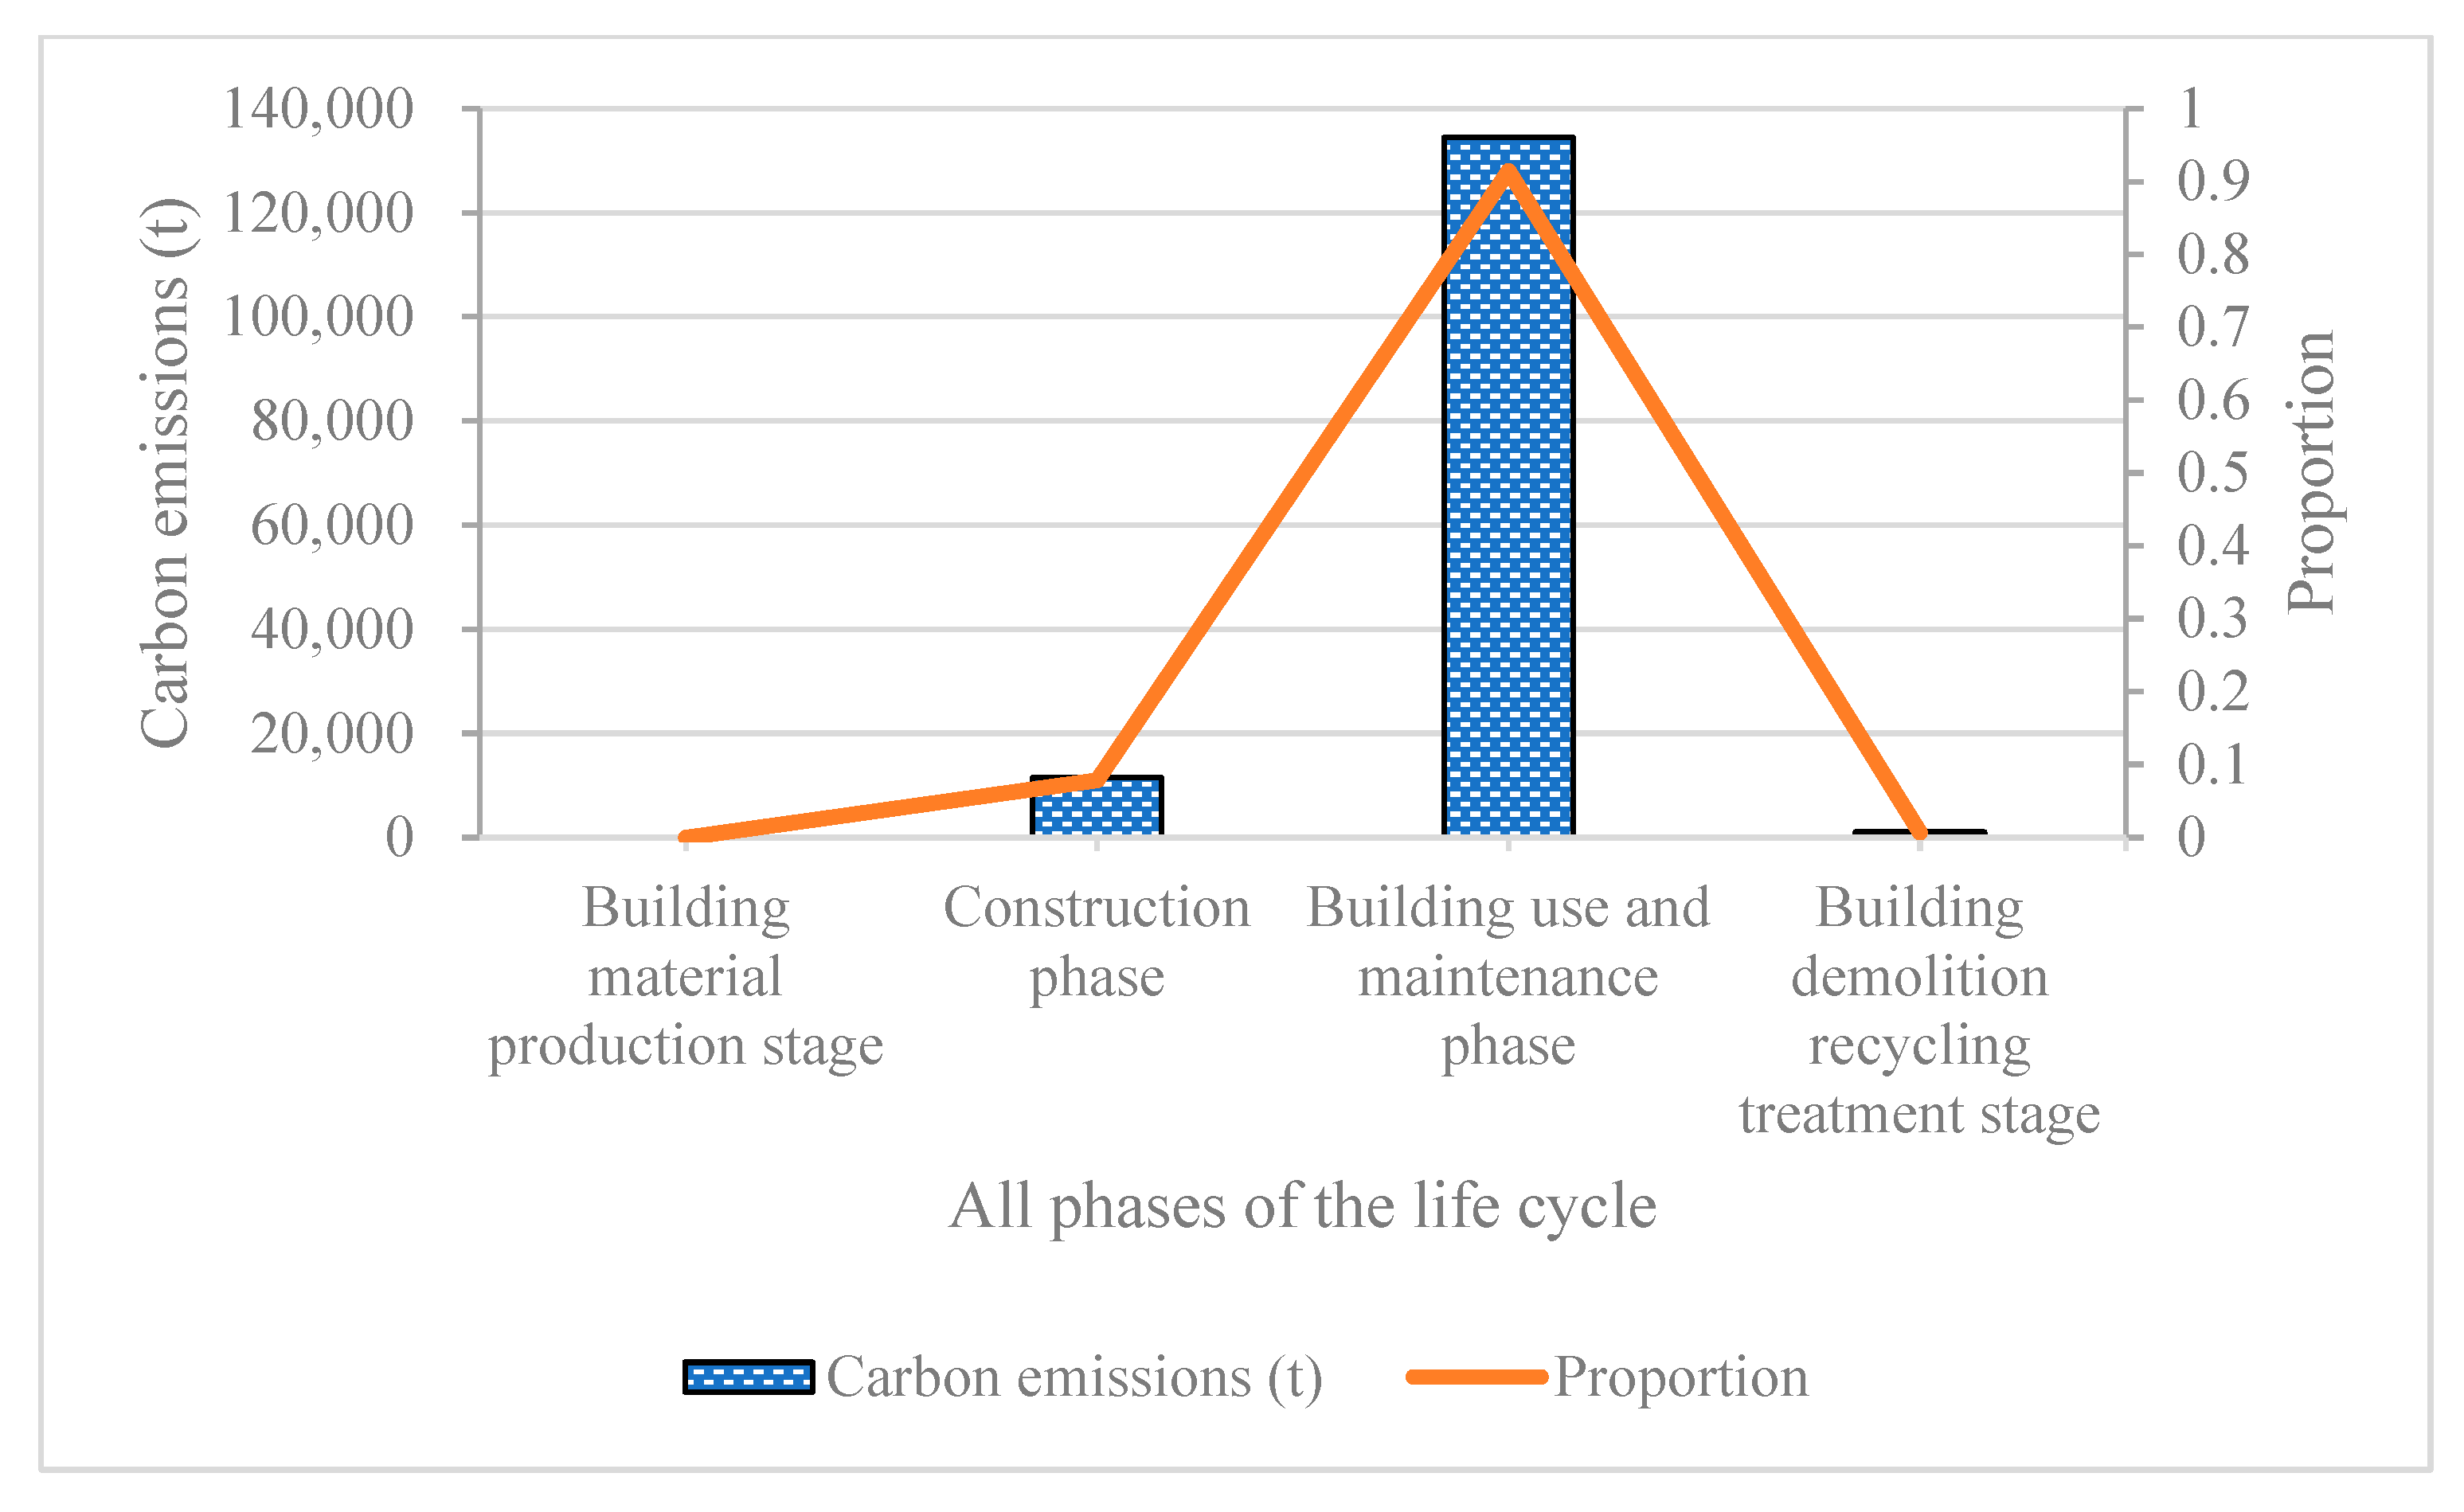
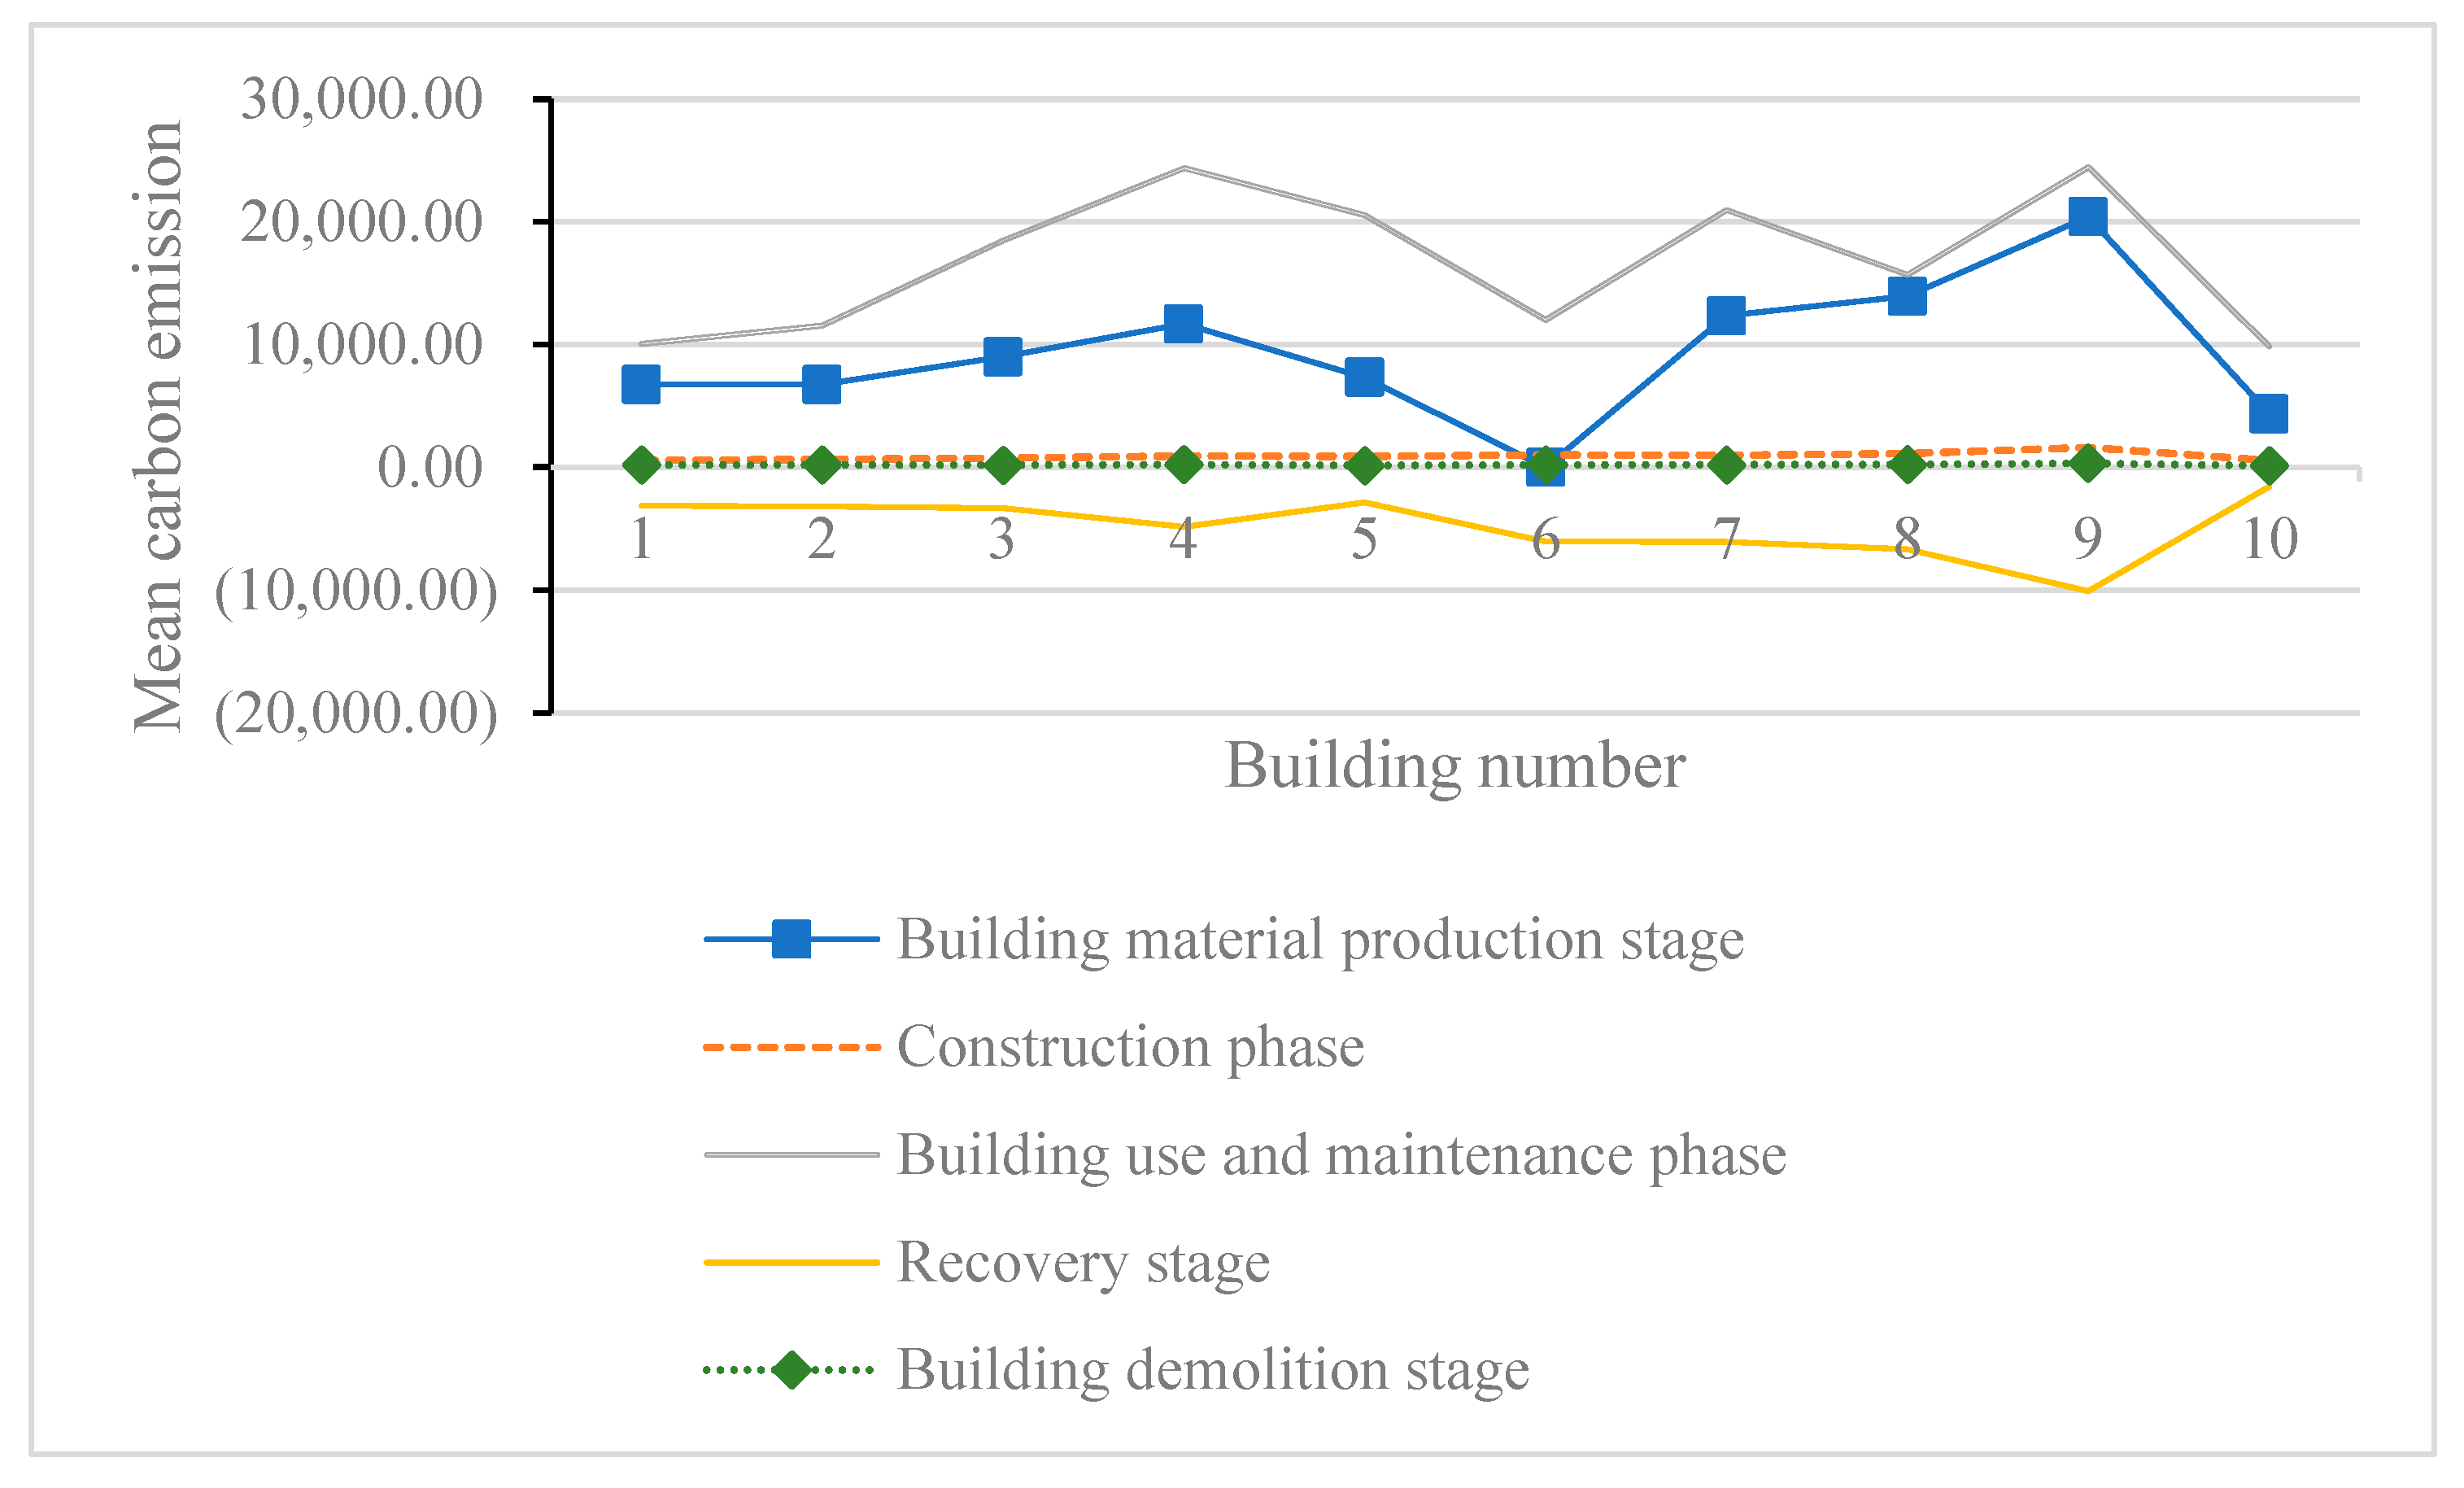
18]. The four stages of a building’s life cycle, which are manufacturing of building materials, construction, usage and maintenance of the building, and demolition, are used in this study’s calculations. The energy consumption of buildings during use accounts for 50% to 70% of the total energy consumption. The calculation boundary for each stage is precisely established, and as a result, the carbon footprint of the building’s life cycle is assessed. The design energy efficiency index of carbon neutrality for the entire life cycle of a building is shown in
Figure 1.
Figure 1 illustrates the carbon dioxide produced during the production of building components as a result of the use or decomposition of raw materials and energy consumption. This evaluation of the energy efficiency of carbon-neutral design across the entire life cycle of structures is done to determine how efficient the design is. Carbon dioxide is released during building construction as a result of mechanical operation and energy consumption from various construction tasks; Carbon dioxide is released as a result of energy consumption during building operation and maintenance; The energy used for building demolition, filling compaction, and garbage recycling results in the emission of carbon dioxide.
The main method of achieving carbon neutrality in buildings is to offset operating carbon emissions through energy efficiency, emission reduction, and negative carbon technology [
19]. In order to achieve zero carbon emission across the whole life cycle of a structure, the second technique involves analyzing the carbon footprint and offsetting ways from the construction, installation, and operation of building supplies through the final demolition and recycling. The key to achieving these three levels is the digital quantification of building carbon emissions in order to achieve targeted emission reductions.
Table 1 illustrates the design procedure for a structure that is carbon-neutral.
To promote the carbon neutrality of buildings, the actions that must be taken in all areas of the construction industry are listed in
Table 1. For instance, low-carbon building materials are used in the production stage after traditional building materials have been decarbonized. Encourage the usage of assembled construction and digital technology during the construction phase. Energy substitution, electrification, and energy efficiency improvements should be implemented as much as possible during operation; during demolition, work should be done to optimize the demolition plan and recycle as many building components as possible. On the other hand, the foundation of achieving building carbon neutrality is to finish carbon quantification with reasonable accuracy, choose the best course of action, and guarantee the fairness and traceability of emission reduction data [
20].
2.2. Function System of Energy Efficiency for Carbon Neutrality Design of Whole Life Cycle Buildings
Carbon-neutral design refers to a systematic method that makes the level of carbon-neutral design of buildings technologically advanced, environmentally friendly, and economically reasonable with the help of all kinds of big data related to it in the life cycle of buildings and various innovative design theories such as concurrent design. In order to quantitatively express the basic level, development potential, and comprehensive effectiveness of the carbon-neutral design and comprehensively reflect and evaluate the true level of carbon-neutral energy efficiency in building a full-cycle carbon-neutral design, an “energy efficiency function” is proposed and constructed. The purpose is to characterize the carbon-neutral energy efficiency level, carbon-neutral potential, and operating mechanism of carbon-neutral strategy in building full-cycle design from a macro perspective.
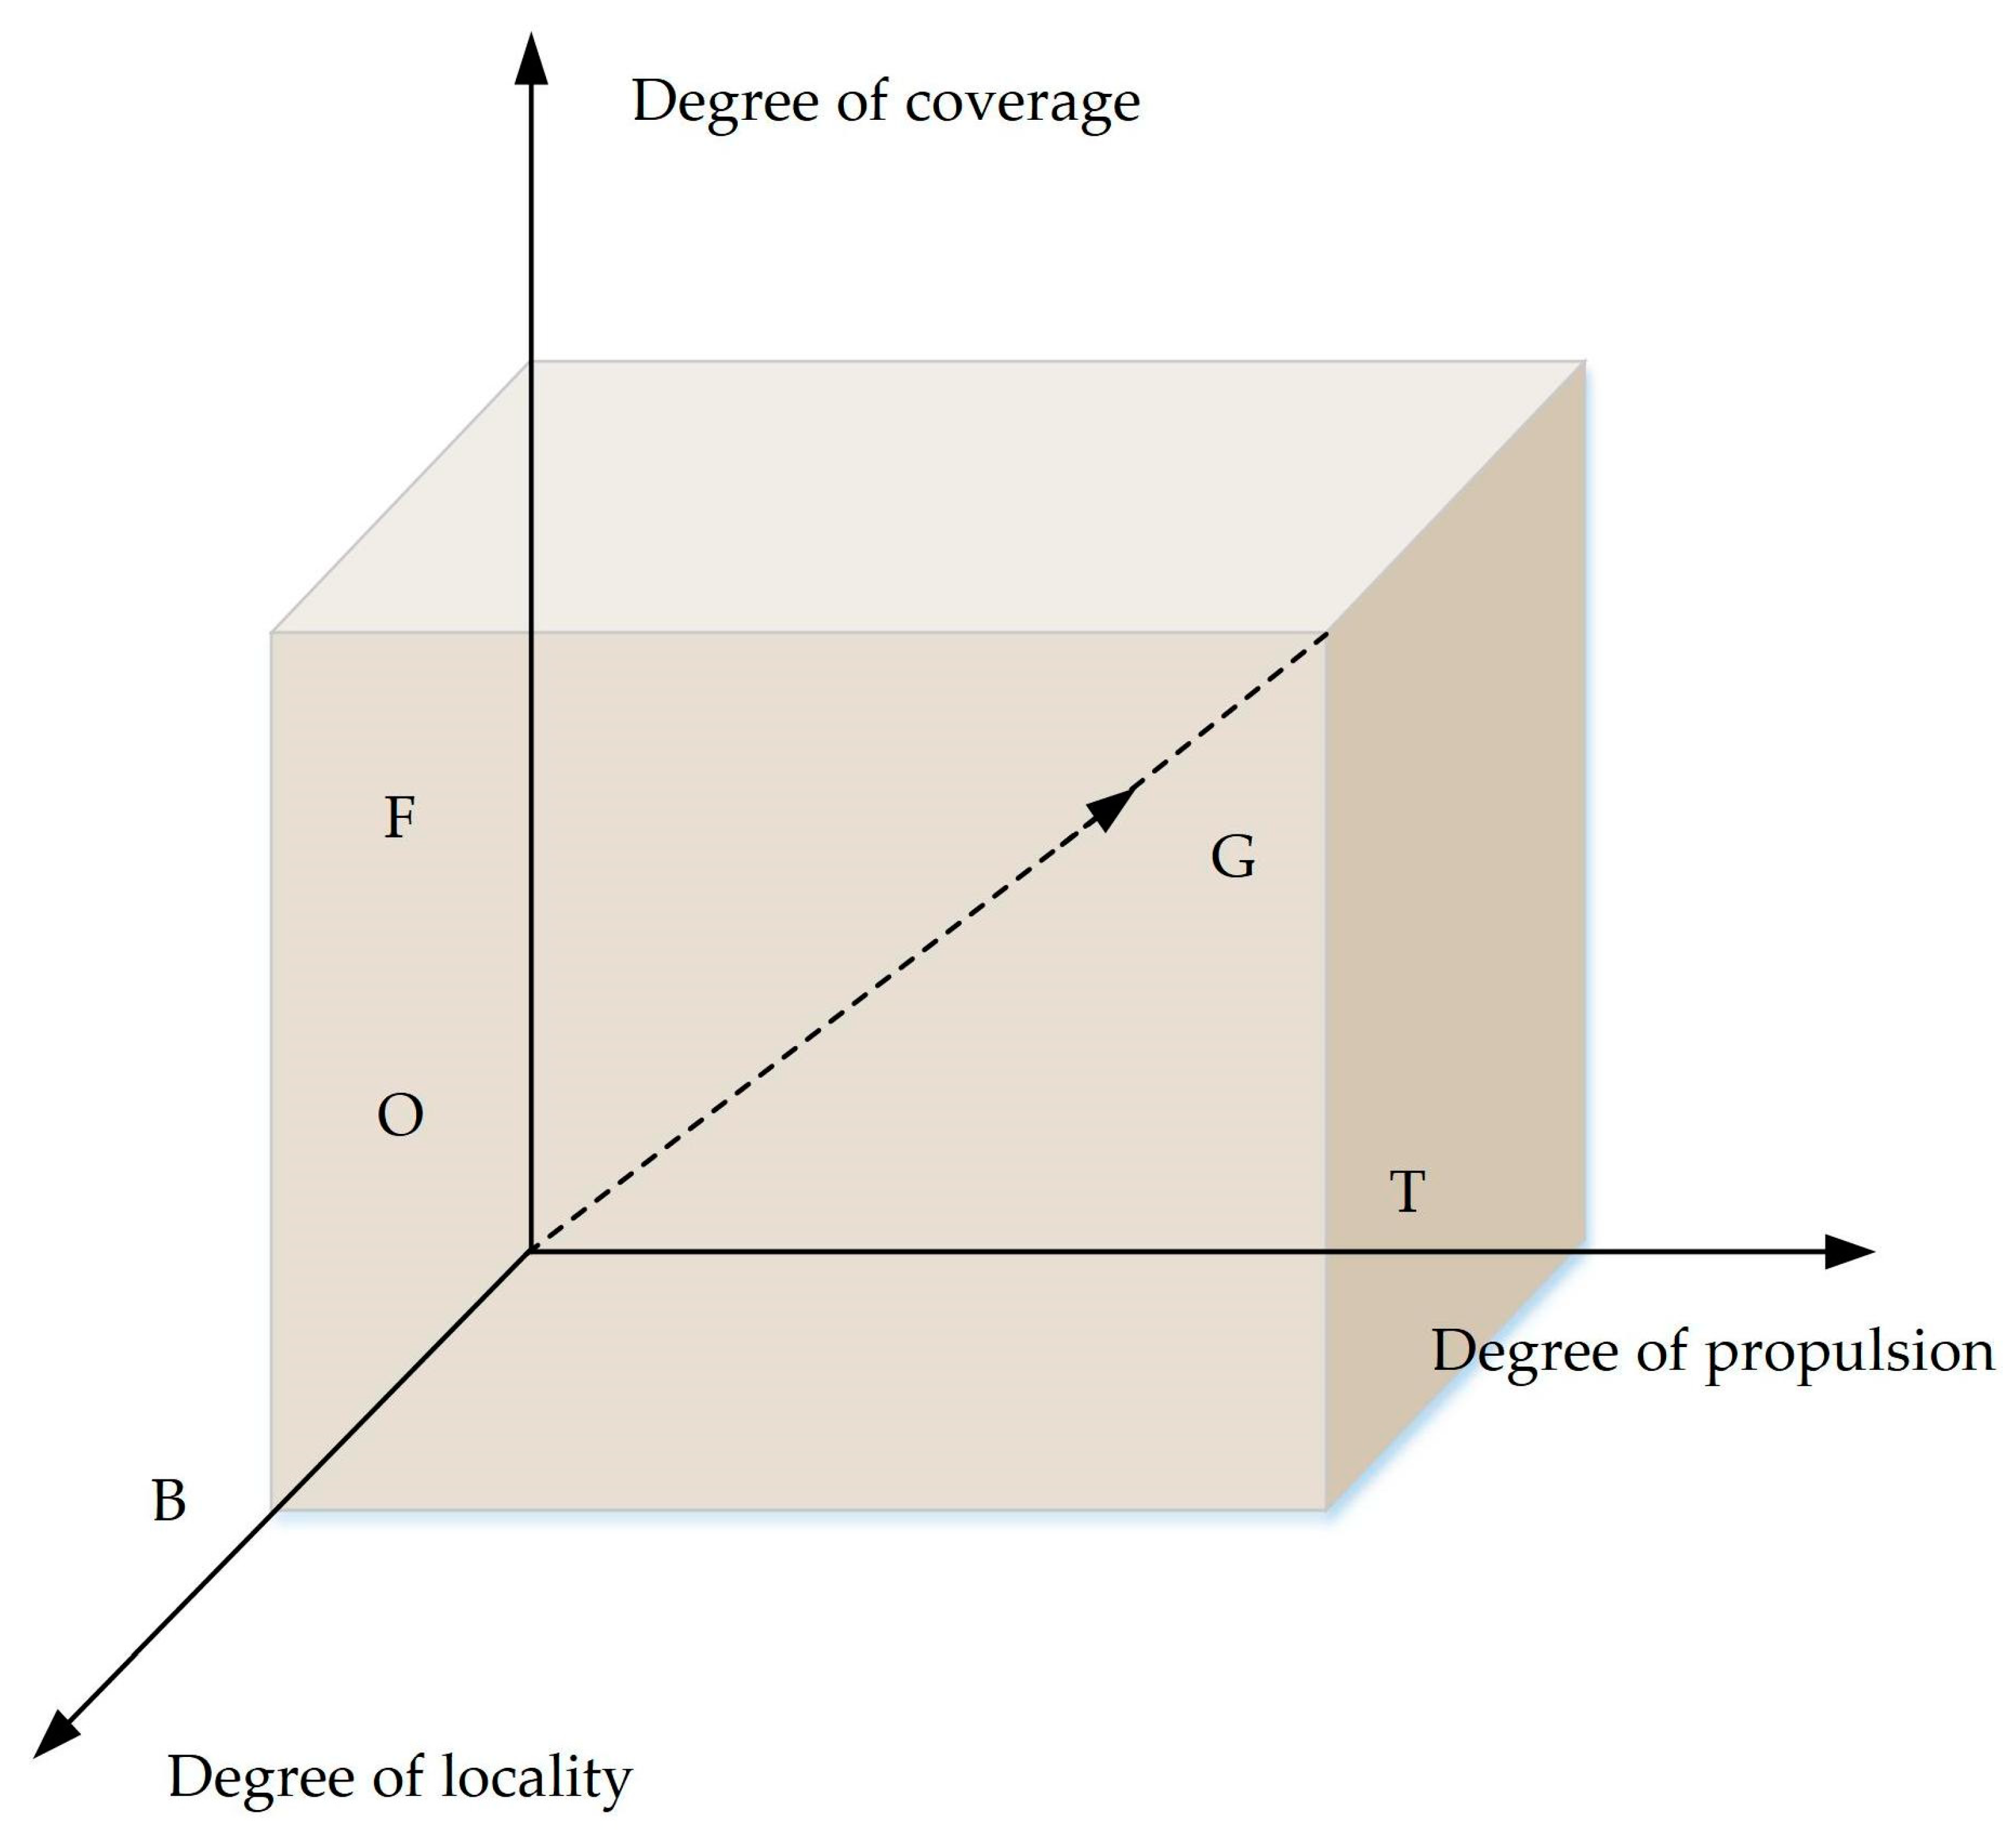
Figure 2 shows the three-dimensional model of the energy efficiency function of the carbon-neutral design.
Figure 2 establishes a three-dimensional model of the energy efficiency function of the carbon-neutral design in a three-dimensional Cartesian coordinate system. The vector from
O to
G represents the best strategy of carbon-neutral design for buildings in the sense of specification, that is, the energy efficiency of carbon-neutral design. Any deviation or deviation from this vector is considered to be a mistake in carbon-neutral design strategy to varying degrees. In this paper, the design dimensions of carbon neutrality are divided into background, propulsion, and coverage. The background of the carbon-neutral design indicates that the building has the basic ability of carbon-neutral in the whole cycle, which mainly depends on two aspects: the quantity and quality of carbon-neutral design technical elements and carbon-neutral policy and capital investment. Based on the concept of “production function” in economics, this paper constructs and puts forward the background function of carbon-neutral design and makes an integrated analysis of the technical elements, policies, and capital investment of carbon-neutral design. In the Cobb–Douglas production function in the field of economics, the main factors that determine the development level of the industrial system are labor input, fixed assets, and comprehensive technical level. Cobb–Douglas production function will produce different types of production functions according to the sum of the elastic coefficients of labor output and capital-output, but it is required that they are nonlinear. Similar to the calculation of production function in economics, this paper introduces the concept of input-output in carbon neutrality; that is, the background output is calculated through the input of carbon neutrality design technology and policy and capital. The mathematical expression of the proposed background function is shown in Equation (1):
In Equation (1), represents the carbon-neutral design background. is carbon-neutral quality index. is the proportion of engineering and technology. is the proportion of investment in research and development (R&D) of policies and funds. is the input-output elastic coefficient of engineering standard. is the elastic coefficient of R&D capital input and output. is a random factor.
The promotion degree of the carbon-neutral design reflects the promotion degree of the overall design to enhance the carbon-neutral design of buildings in the whole cycle. This paper uses the concept of “elastic coefficient” for reference to construct and design the promotion degree function of carbon-neutral design. The elastic coefficient represents the ratio of the growth rates of two interrelated economic indicators in a certain period, and it is a measure of the dependence of the growth rate of one variable on the growth rate of another variable. The dependence between the two variables reflected by the elastic coefficient is reflected in the relationship between energy consumption and carbon emissions. According to the above conceptual method, it is extended to the design of the expression of carbon neutrality propulsion function, and the dependence between carbon emissions and energy consumption is calculated from the spatial dimension and the time dimension, respectively. According to this, the design propulsion function of carbon neutrality in the spatial dimension is shown in Equation (2):
In Equation (2),
reflects the matching relationship between the proportion of carbon emissions and the proportion of energy consumption in a building area.
and
represent the carbon emissions of region
and the total carbon emissions of all regions, respectively, and
and
represent the energy consumption of region
and the total energy consumption of all regions.
is the correction coefficient, indicating the proportion of the total GDP of region
and the total GDP of all regions. In the time dimension, the expression of carbon-neutral propulsion degree is shown in Equation (3):
In Equation (3), reflects the dependence between the change rate of pollutant discharge and the change rate of energy consumption in a country or region. and represent the annual change rate of pollutant discharge and energy consumption in region , respectively.
Carbon-neutral design coverage indicates the distribution breadth and depth of design intervention of carbon emissions at various stages of the building. The distribution depth emphasizes the completeness of carbon-neutral emissions in all stages of the building to meet the design standards of carbon neutrality. The distribution breadth not only pays attention to the distribution of carbon neutrality in all stages of the building but also emphasizes the energy efficiency of regional carbon neutrality design. Based on the concept of “niche width” in ecology, this paper puts forward and constructs the coverage function of carbon-neutral design. In the field of biology, “niche breadth” refers to the sum of various resources used by organisms, and it can usually be accurately described by multi-dimensional space. However, the application field of this theory has already gone beyond the ecological category and penetrated into the related fields of economy and design. In this paper, this field is applied to the field of carbon-neutral design, and the calculation formula of niche width is improved in combination with the requirements of the coverage of carbon-neutral design on the distribution breadth and width of buildings at various stages and the coverage function of carbon-neutral design is shown in Equations (4)–(6):
In the above equation, represents carbon-neutral design coverage. is the proportion of carbon neutralization design in the whole life cycle of the first cycle of the building. is the ratio parameter of the number of carbon-neutral design buildings, that is, the ratio of the number of regional carbon-neutral design buildings to the total number of carbon-neutral design buildings. is the design integrity of carbon neutrality in the first cycle of the building. is the total life cycle of the building. is carbon-neutral design standard quantity. is the implementation amount of carbon-neutral design.
According to the three-dimensional theory of the carbon-neutral design energy efficiency function, the carbon-neutral design energy efficiency function is affected by the background, propulsion, and coverage functions of the carbon-neutral design at the same time, and the specific theoretical analysis is shown in Equation (7):
In Equation (7), OB represents the “background” of carbon-neutral design in the whole cycle of buildings, which mainly applies the Cobb–Douglas variant function in the field of carbon-neutral design to integrate the whole cycle cost index of buildings, engineering standards, and R&D investment ratio, with a view to representing the background of carbon-neutral design in the whole cycle of buildings. OT represents the “propulsion degree” of carbon-neutral design in the whole cycle of buildings, which mainly uses the calculation method of “elasticity coefficient” in economics to calculate the elastic relationship between carbon emissions and energy consumption in the whole cycle of buildings from two dimensions of space and time, so as to realize the representation of the propulsion of carbon-neutral design in the whole cycle of buildings. OF represents the “coverage” of carbon-neutral design in the whole cycle of buildings, mainly using the idea of “niche” in ecology to describe the advanced nature and quantity of carbon-neutral technology adopted in the whole cycle of buildings, hoping to realize the representation of the distribution breadth and width of carbon-neutral design in the whole cycle of buildings. OG represents the comprehensive energy efficiency of building full-cycle carbon-neutral design, which not only considers the development basis of building full-cycle carbon-neutral design but also pays attention to the promotion level and coordination of building full-cycle carbon-neutral design in parallel, that is, “energy efficiency of carbon-neutral design” is the path optimization representation of the background, promotion, and coverage functions of carbon-neutral design in a balanced state.
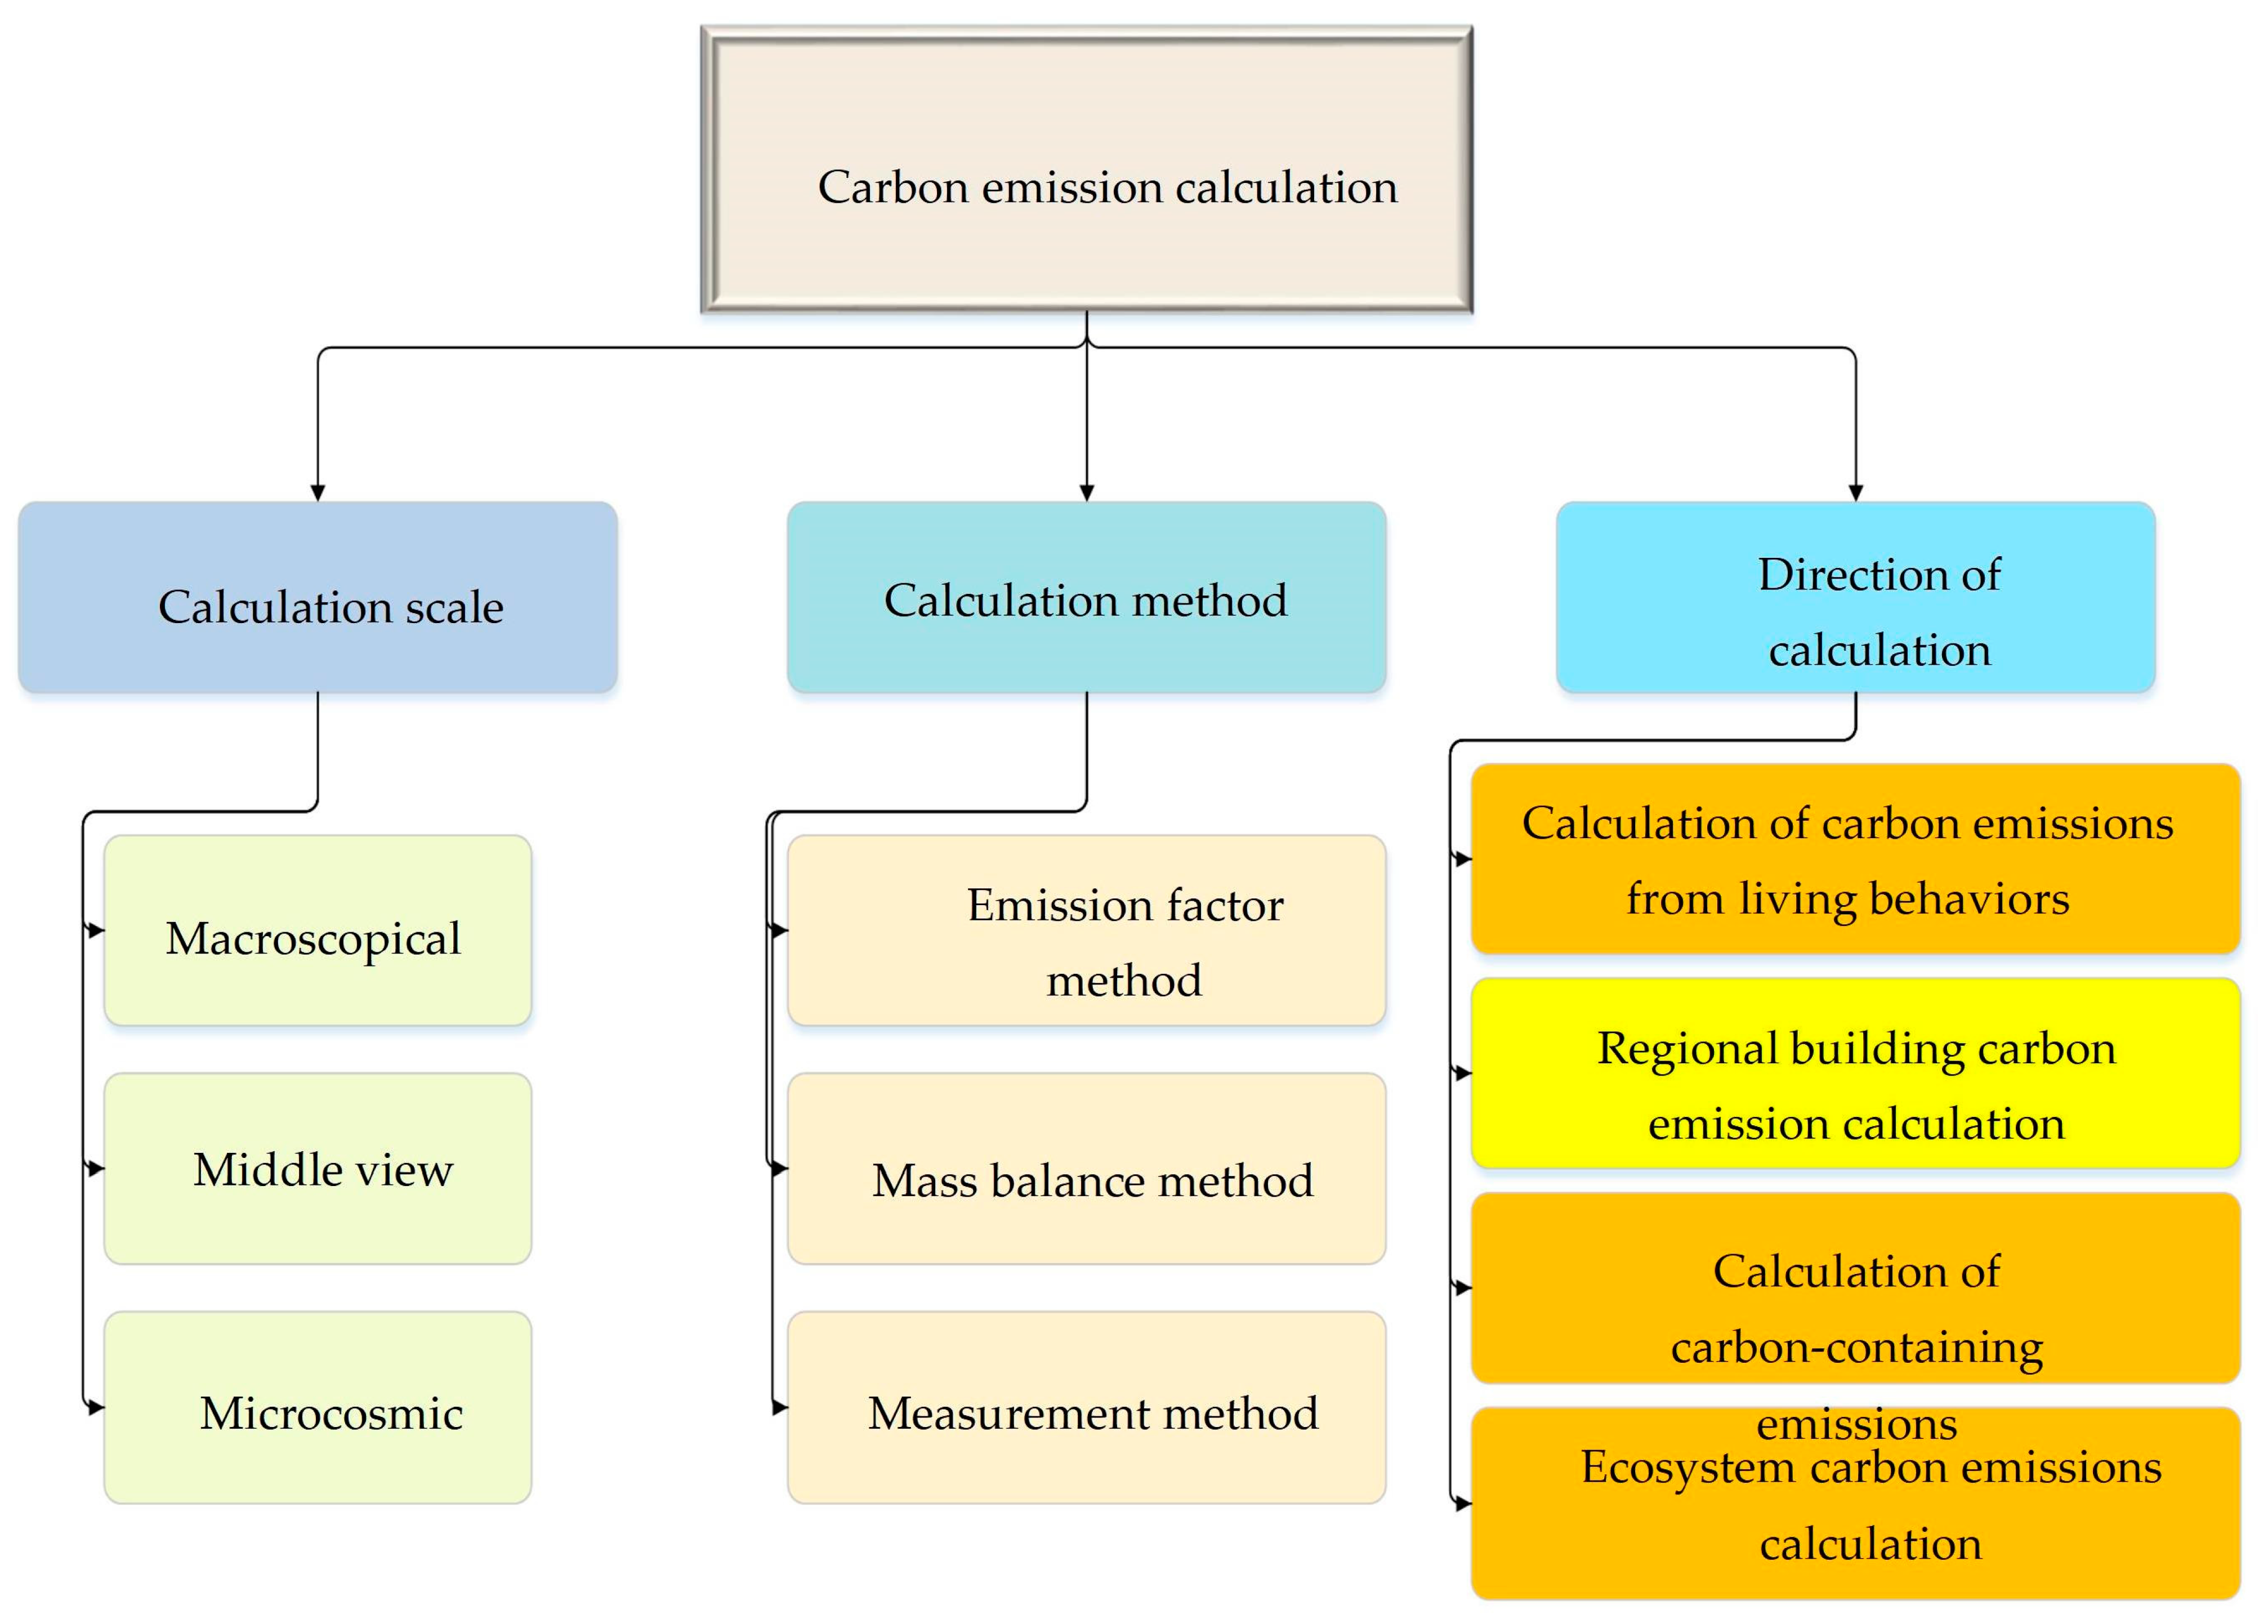
Figure 3 illustrates the process for calculating building energy efficiency and carbon emissions.
Top-down statistical methods analyze the macroeconomic relationship between energy and the economy from the inside out, as shown in
Figure 3, and are frequently based on historical time series data on national energy use and carbon emissions. Only after evaluating the building’s overall energy consumption and carbon emissions is the time and space downscale study carried out. The bottom-up statistical method is used to first calculate the hourly energy consumption and carbon emissions of a single building, and then the data is aggregated at the regional level. Forecasts and simulations of the building energy demand at regional, regional, and even national scales are made based on the typical building energy consumption as well as details like temperature and humidity, building performance, terminal equipment and operation characteristics, and building performance. The advantages and disadvantages of several methods for calculating the energy efficiency and carbon emissions of buildings are shown in
Table 2.
In
Table 2, the top-down method can focus on the overall scale of energy consumption, but it cannot reflect the technical details. The statistical analysis method is fast and simple, but it cannot reflect the characteristics of the building system and lacks explanatory power. Typical building methods can accurately describe the building system, but the modeling is complex and time-consuming.
2.3. Carbon-Neutral Energy Efficiency Model of Whole Life Cycle Building
The Intergovernmental Panel on Climate Change (IPCC) provided carbon accounting factors in 2006, and this paper selects appropriate carbon emission variables to develop a carbon balance accounting list based on those factors [
24]. A value of 2.660 (
/set) is the coal emission factor for construction traffic resources. The carbon emission factor from petroleum is 2.136 (
/unit). Natural gas has a carbon emission factor of 1.657 (
/unit). The carbon emission factor for power plants is 0.884 (
/set). Gasoline has a carbon emission factor of 2.031 (
/set). Kerosene has a carbon emission factor of 2.095 (
/unit). Diesel oil has a carbon emission factor of 2.171 (
/set). The carbon dioxide emission factor for gas is 1.301 (
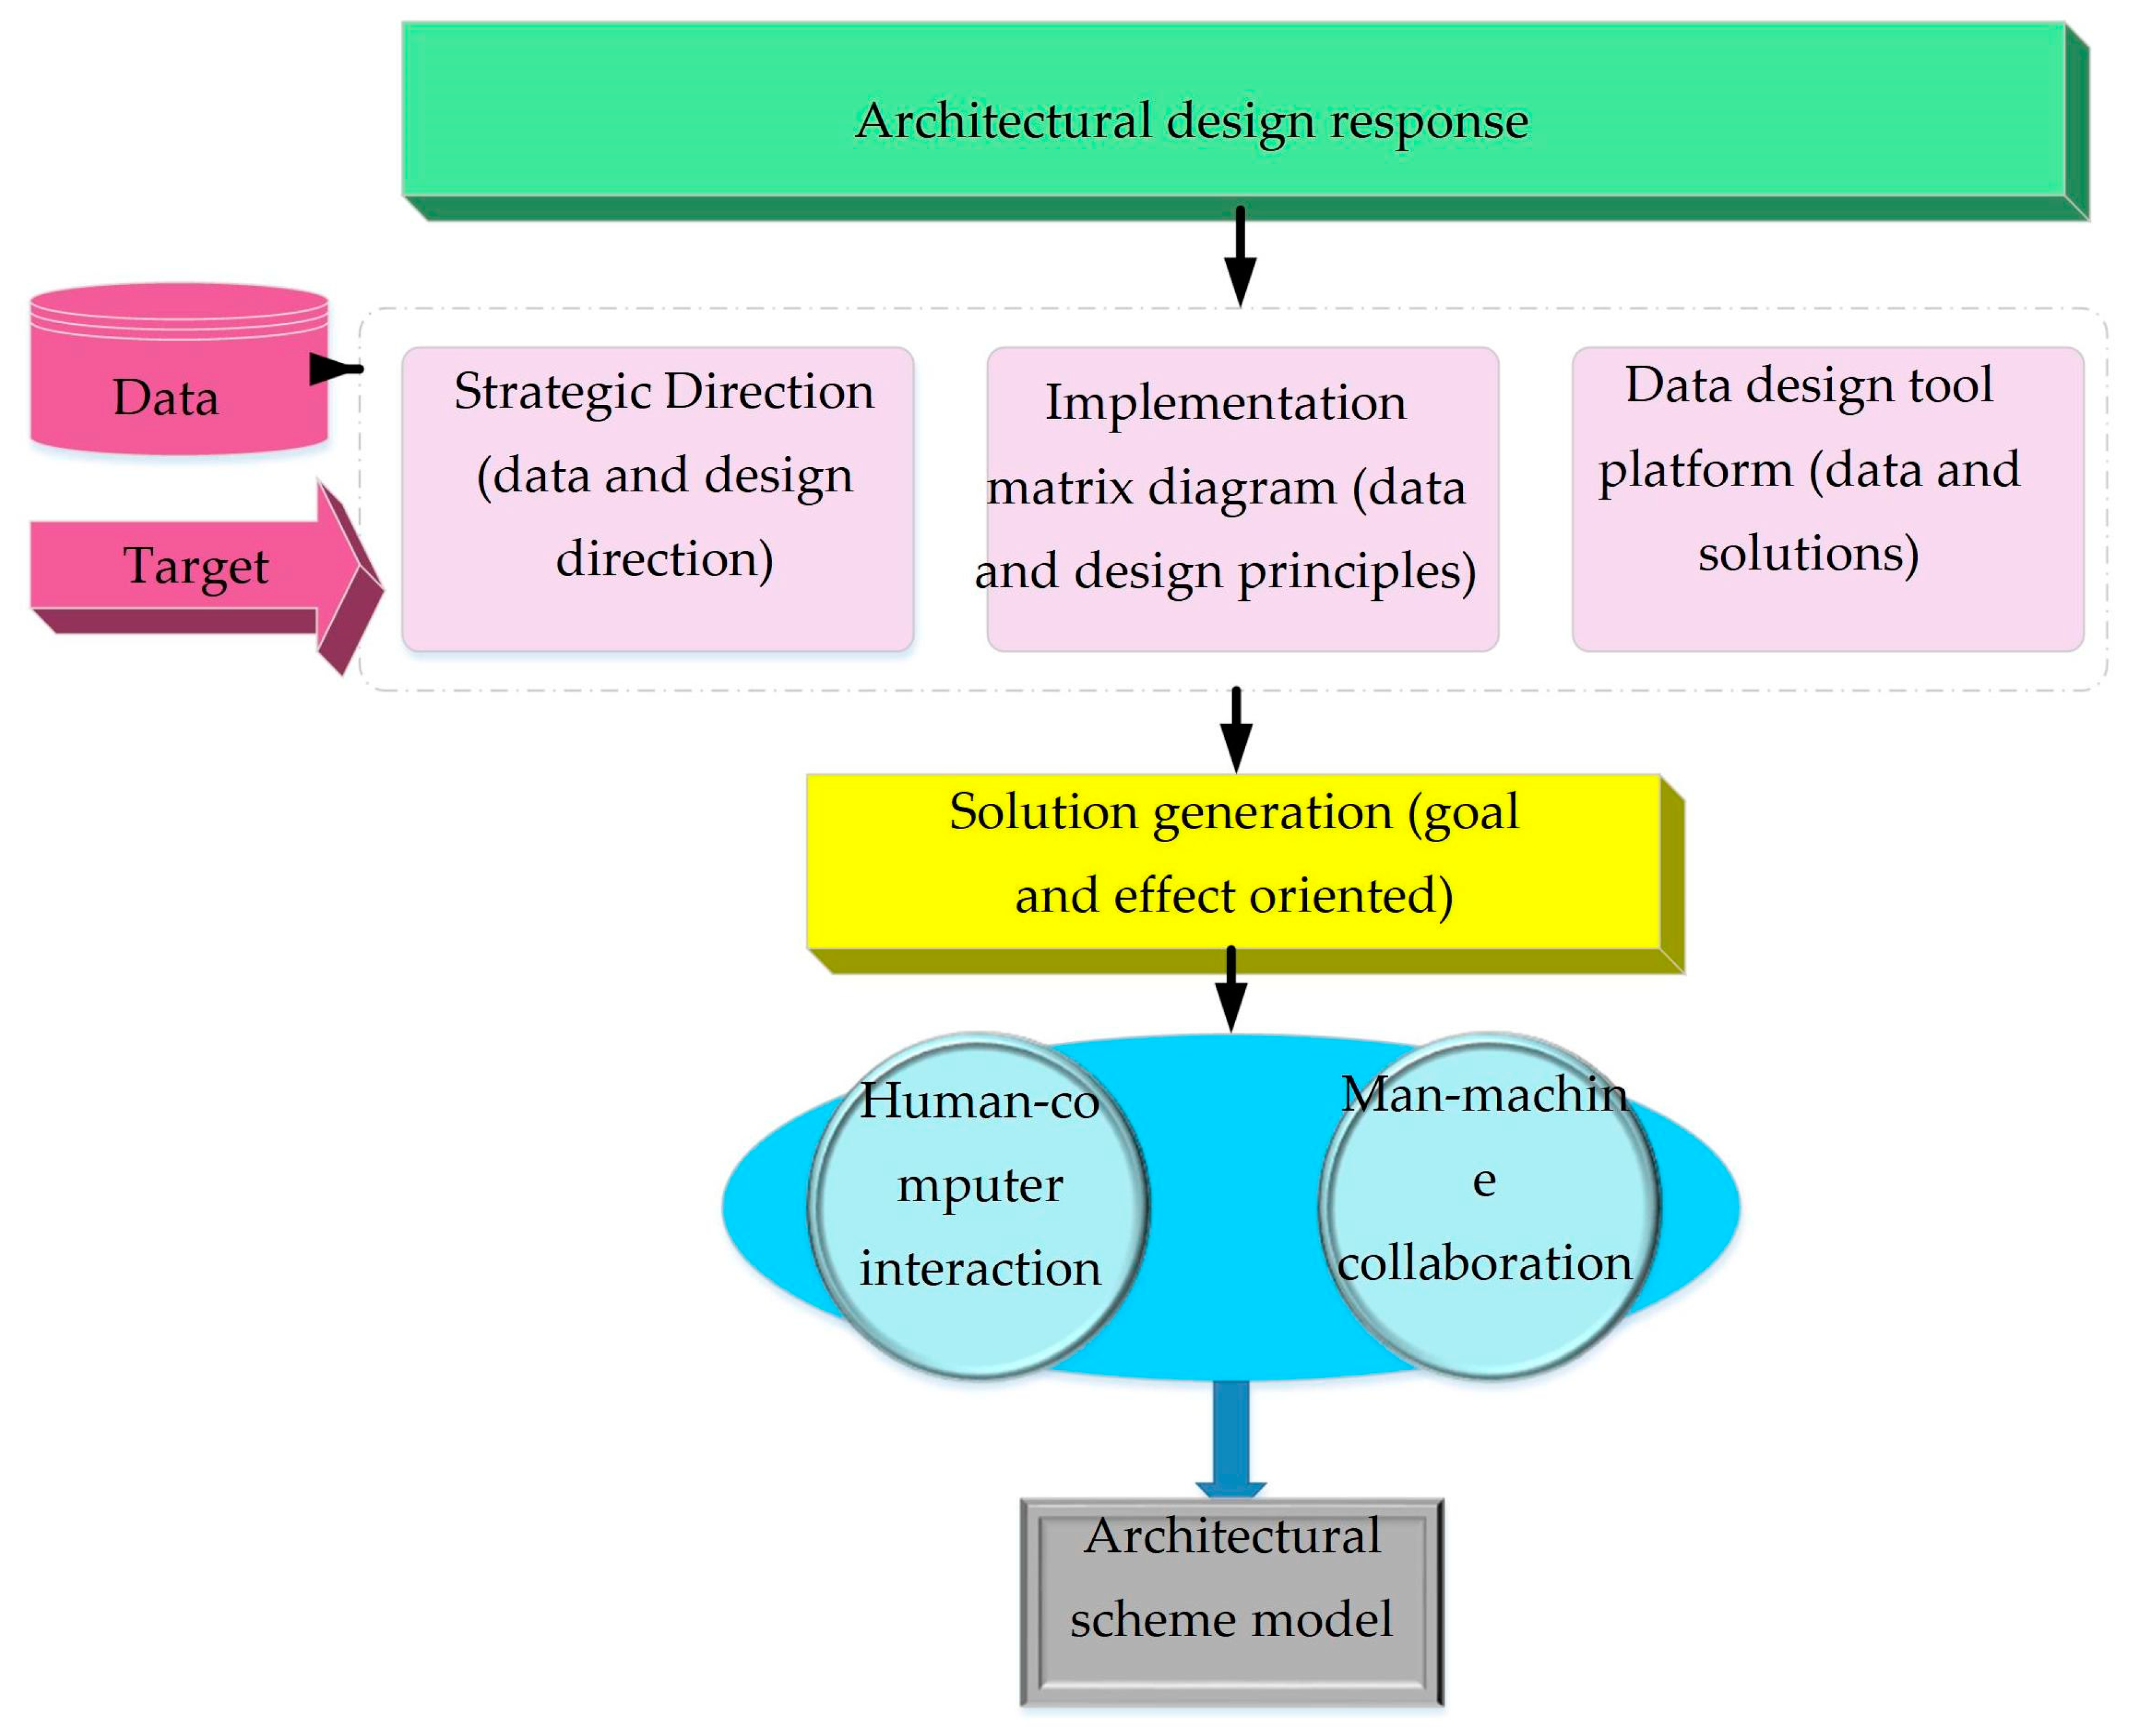
/unit). The building’s entire life-cycle carbon neutrality and energy efficiency model is depicted in
Figure 4.
The life cycle building carbon neutrality energy efficiency model shown in
Figure 4 attempts to reduce energy use and carbon emissions. From a carbon neutrality standpoint, parameterized life cycles and carbon-integrated buildings are used to drive the best building design by integrating the carbon neutrality target into the carbon neutrality performance of buildings. The information correlation between architectural design parameters and carbon neutrality goals is investigated on the basis of identifying the numerical limits of architectural design parameters. Using hidden factors (K value, air tightness), target control indicators (figure coefficient, carbon fixation ratio, and Ouyang coefficient), and man–machine interaction technology, the man–machine cooperation between the computer and the architect in the construction process is realized, leading to the generation of a carbon neutrality energy-saving scheme.
It is possible to calculate the greenhouse gas emissions from a building’s entire production process using the carbon output of a single structure. This paper breaks down the building life cycle into four stages: manufacturing of building materials, building construction, building usage and maintenance, and building demolition, and then calculates the carbon emissions associated with each stage [
25,
26]. The calculation equation for carbon accounting across a building’s whole life cycle is shown in Equation (8):
In Equation (8),
represents the total carbon emission accounting amount (kg) of the building’s carbon neutrality over the course of its whole life cycle. The amount of carbon emissions that are accounted for as being produced during the production of construction materials is
(kg).
represents the quantity of carbon emissions that were accounted for during the construction phase (kg). The amount of carbon emissions that are accounted for as being produced by buildings during use and maintenance is
(kg). The accounting amount of carbon emissions (kg) from building demolition’s waste treatment phase is
. Carbon emission index parameter setting in building materials production process, steel carbon emission: 1.7 kg; Carbon emission of steel bar: 2.0 kg; Carbon emission from cement: 0.9 kg; Carbon emission from glass: 23.45
; Carbon emission of concrete: 400.67
; Carbon emission of plastering mortar: 378.42
; Carbon emission of aerated concrete block: 250.0
; Thermal insulation carbon emission of polystyrene particles: 17.29 kg; Carbon emission of bamboo plywood: 33.10
; Carbon emission of building tiles: 16.90
; Aluminum and carbon emissions: 9.5 kg; Lime carbon emission: 1.2 kg; Standard brick carbon emissions of 504.0 thousand; Carbon emission of external wall elastic coating: 2.6 kg; Asphalt treated using styrene-butadiene-styrene (SBS) emits 12.95
carbon dioxide. Equation (9) illustrates the simple equation for carbon emissions during the construction materials production process.
In Equation (9),
stands for building energy,
stands for the carbon emission of the
-type energy in the production stage of building materials, and
stands for the
-type energy consumption in the production stage of building materials. Equation (10) shows the calculation expression of carbon emissions generated in the construction stage:
The carbon emission produced during the manufacture of construction materials is represented by the symbol
in Equation (10). The carbon emissions generated during the transportation of building resources are represented by
while the emissions produced during the construction phase are represented by
. The calculation expression for carbon emissions produced during the manufacture of construction materials is shown in Equation (11):
In Equation (11), the terms
and “
” stand for the kind of building material and the emission index of Class I building material, respectively. The consumption of class
building materials is represented by
. The recovery rate of class
building materials is represented by the number
. Steel has a recycling coefficient of 0.8, aluminum has a recovery coefficient of 0.85, copper has a recovery coefficient of 0.90, and rebar has a recovery coefficient of 0.40. The estimate of carbon emissions produced during the transportation of building materials is shown in Equation (12):
The fuel consumption of Class
vehicles used for moving building resources is represented by
in Equation (12). The kilometers traveled by Class
vehicles when transporting building materials are represented by the symbol
. In the transportation of building materials, the carbon emission and energy consumption of Class I modes of transportation are represented by the integer
. The kilogram to thyme conversion factor is represented by
. The computation of carbon emissions produced during the manufacturing stage of building materials is shown in Equation (13):
in Equation (13) represents the energy consumption of Class
construction machinery in the construction stage.
represents the number of Class
construction machinery in the construction stage.
represents the carbon emission of Class
construction machinery in the construction stage. Set the diesel carbon emission index: 104.078 (
/set); Carbon emission index of crane: 70.015 (
/set). Equation (14) shows the calculation of carbon emissions generated during the use and maintenance of buildings:
in Equation (14) stands for the amount of energy used to operate and maintain the structure. The carbon output from renovations during the building’s usage and maintenance phase is represented by the number
. The computation of energy consumption during building use and maintenance is shown in Equation (15):
In Equation (15), variable
stands for the annual average Class
energy use during building use and maintenance. The building and maintenance equipment’s service life is indicated by
. The carbon emission index of class
energy utilized in the building usage and maintenance stage is represented by the integer
. The greenhouse gas emissions created by numerous maintenance and transformations during the usage period are referred to as the “carbon emission of renovation in the use and maintenance stage of buildings”. The types and quantities of building materials consumed by the maintenance and renovation project during the use period and during the use of mechanical shifts based on existing building maintenance and renovation records are calculated. The following equation calculates the carbon emissions generated during the waste treatment stage of building demolition:
The energy use and carbon emissions produced by machines during the building demolition stage are represented by the variables in Equation (16). is a representation of the energy use and carbon emissions produced during the transportation of waste at the stage of building destruction. The carbon emissions caused by recyclable materials during the building demolition process are represented by the number .

