Article

Analysis of the Potential of Meeting the EU’s Sustainable Aviation Fuel Targets in 2030 and 2050

1
Physikalisch Technische Bundesanstalt (PTB), Bundesallee 100, 38116 Braunschweig, Germany
2
Sustainable Process Technology, Twente University, Drienerlolaan 5, 7522 NB Enschede, The Netherlands
3
Center for Environmental Policy, Imperial College London, Exhibition Rd, South Kensington, London SW7 2BX, UK
*
Author to whom correspondence should be addressed.
Sustainability 2023, 15(12), 9266; https://doi.org/10.3390/su15129266
Submission received: 11 May 2023 / Revised: 31 May 2023 / Accepted: 6 June 2023 / Published: 8 June 2023

Abstract

:
Sustainable aviation fuel (SAF) is anticipated to have a significant impact on decarbonizing the aviation industry owing to its ability to be seamlessly incorporated into the current aviation infrastructure. This paper analyzes the potential of meeting the proposed SAF targets set by the ReFuelEU initiative. The approved SAF production pathways according to ASTM D7566 using renewable bio-based feedstocks were defined and analyzed. Moreover, a detailed matrix for comparison was used to provide an overview of the current state of those pathways. The analysis has shown that hydroprocessed esters of fatty acids (HEFA), alcohol to jet (ATJ), and Fischer–Tropsch (FT-SPK) are the most promising pathways in the foreseeable future due to their high technology readiness and fuel levels. HEFA is the most mature and affordable pathway; therefore, it is expected to form the backbone of the industry and stimulate the market in the short term despite its low sustainability credentials, limited feedstock, and geopolitical implications. On the other hand, FT-SPK can utilize various feedstocks and has the lowest greenhouse gas emissions with around 7.7 to 12.2 gCO2e/MJ compared to the conventional jet fuel baseline of 89 gCO2e/MJ. Overall, the EU has enough sustainable feedstocks to meet the short-term SAF targets using the current technologies. In the long term, the reliability and availability of biomass feedstocks are expected to diminish, leading to a projected deficit of 1.35 Mt in SAF production from bio-based feedstocks. Consequently, a further policy framework is needed to divert more biomass from other sectors toward SAF production. Moreover, a significant investment in R&D is necessary to improve process efficiencies and push new technologies such as power-to-liquid toward commercial operation.

1. Introduction

1.1. Sustainable Aviation Fuel

The 1.5 °C limit is a critical threshold for global climate change, as exceeding it would have severe and potentially irreversible consequences for the planet. The aviation industry is considered one of the main contributors to global greenhouse gas emissions (GHG) [1]. According to the Intergovernmental Panel on Climate Change (IPCC), aviation accounts for around 2–3% of the total CO2 emissions [2]. While this value may seem to be a relatively small percentage, aviation emissions are expected to continue growing as air travel becomes more accessible to a lot of people around the world. Therefore, achieving the 1.5 °C limit will require significant reductions in emissions across all sectors, including aviation [3]. In 2009, air transport committed to reducing its net carbon emissions to half of 2005 levels by 2050 [4,5]. This target requires the industry to implement measures such as using more fuel-efficient planes, utilizing hydrogen and electrical planes, and developing sustainable aviation fuels.
Sustainable aviation fuel is an alternative liquid hydrocarbon with similar characteristics to conventional jet fuel (kerosene) specifically designed for use in existing aircraft. The key characteristic of SAF is that it has a significantly lower carbon footprint compared to conventional jet fuel. Typically, SAF offers substantial reductions in greenhouse gas emissions ranging from 50% to 80% compared to fossil fuel-based jet fuel, depending on the feedstock and production process [6]. SAF can be produced from renewable or waste feedstocks, such as vegetable oils, animal fats, agricultural residues, algae, or waste gases. These feedstocks are processed through various conversion pathways, depending on the feedstock, to create a fuel that can be used as a substitute for conventional jet fuel or blended with it [7].
The International Civil Aviation Organization has introduced the carbon offsetting and reduction scheme for international aviation (CORSIA), which aims to offset any emissions growth above 2020 baseline levels through the purchase of carbon credits from other sectors and specifies the sustainability criteria of the utilized feedstocks [8]. For a fuel to be called sustainable, it has to fulfill CORSIA’s sustainability criteria. Such criteria include a reduction of the carbon footprint, enhancing water quality, considering soil and air health, and observing human and land rights. The scheme is intended to be a temporary measure until the aviation industry can develop and implement more sustainable technologies to reduce its carbon footprint.
The European Union (EU) has been taking steps to lower aviation emissions by promoting the use of sustainable aviation fuel as a solution to decarbonize the sector [8,9,10]. In 2021, the EU Commission proposed to gradually increase the share of SAF at EU airports. Therefore, the ReFuelEU aviation initiative is meant to introduce a SAF mandate. On the 26th of April 2023, the EU parliament and the EU council reached a new agreement to increase the SAF uptake compared to what was originally proposed by the European Commission [11]. The agreed SAF uplift at EU airports will be as follows: 2% by 2025, 6% by 2030, and 20% by 2035, up to a maximum of 70% by 2050. Out of these amounts, 1.2% in 2030 and 5% in 2035, increasing to 35% by 2050, will be produced through power to liquid (PTL). The PTL process involves converting renewable electricity generated from solar or wind power to produce liquid fuels that can be used as alternatives to conventional jet fuel. The SAF uptake in the EU is projected to increase steadily from 2025 to 2035 as more SAF plants are commissioned and moved towards their full capcity after a few years of operation. As the SAF market matures, it is anticipated that more plants will be able to reach their full capacity more rapidly, and the costs of producing SAF will also decrease, resulting in an exponential uptake trajectory from 2035 to 2050. Having such a mandate has a lot of advantages, starting with boosting the demand for SAF, which stimulates the domestic economy, creates more opportunities, and expands the infrastructure required to meet the targets. Moreover, such a mandate gives confidence to investors and stakeholders to support the research and development (R&D) and commercialization of new SAF technologies. The new mandate will be based on a volumetric scheme. Therefore, the airlines will be required to use a specific amount of SAF based on the volume of fuel they consume. This differs from the GHG scheme, which sets a limit on the amount of carbon emissions that airlines are allowed to produce and requires them to offset any emissions above this limit. However, the EU has set guidelines to assure that the SAF is sustainably produced and does not possess a negative social or environmental impact. Therefore, after the new modifications that were introduced to the European SAF mandate, a need emerged for a detailed study to address the potential of meeting the new SAF targets and assess the feasibility of achieving such projections. Therefore, this paper aims to address this issue based on the currently available technologies and bio-based feedstocks.

1.2. Policy Barriers in the Proposed Mandates

Most current SAF proposals are not fully mature, and therefore, they still do not address all the potential challenges associated with the policy of SAF production, supply, and utilization. Highlighting such challenges is crucial to pave the way for a more effective policy framework. Such challenges could be summarized as follows:
  • Currently, there are no agreements on how to deal with international flights coming with or without SAF certification from another country. The same applies to flights between the UK and the EU. The mandates regulate only domestic flights or flights that start or end in the country or region where the mandate is in place. Therefore, a comprehensive framework with full cooperation on a global level is needed to maximize policy alignment and avoid the risk of carbon leakage in the case of supplying or producing SAF in different countries.
  • How to deal with tankering is not yet clear. Tankering refers to flights that might be overfilled with normal jet fuel to avoid refilling the tank in the EU region. This practice is performed to avoid the additional cost of SAF in the EU, where the fuel might be more expensive compared to the conventional one or SAF in non-EU states. This will require clear procedures to avoid such practices; otherwise, this will compromise the aviation industry in the whole EU and make it less competitive compared to international flights that are fed with cheaper jet fuel.
  • The mandates do not clearly state how to deal with the potential overlapping between the production of SAF and other green synthetic fuels, especially when similar feedstocks are required for both fuels.
  • Policy framework for importing feedstocks from non-EU countries. Some of those feedstocks utilized in SAF production typically grow in East and South Asia. The unregulated and unsupervised cultivation and harvesting of such feedstocks could lead to deforestation, competition with food production, and other environmental problems, if not produced sustainably. Such practices will abuse the land and affect the local communities in such countries. Moreover, it will represent a source of carbon leakage.

1.3. Technical Barriers for Sustainable Aviation Fuel Deployment

Sustainable aviation fuel will play a major role in the short/medium term and will continue to be the main contributor on long international flights. While hydrogen and electrical airplanes will most likely be used for smaller jets and shorter distances. However, to widely expand the production of SAF, several technical challenges have to be addressed as a reference for potential improvements. Some of these challenges include [12,13,14]:
Feedstock availability: SAF is typically produced from renewable and waste resources, such as waste oils, plant oils, and lignocellulosic biomass. However, the availability of these feedstocks is limited, and scaling up production could lead to competition with food crops or environmental impacts. It is important to specify the most promising and sustainable feedstocks based on their life cycle assessment to increase their utilization and accelerate the widespread production of SAF.
Feedstock competition: The same feedstocks that could be used for SAF production have the capacity to be used in other means of transport, including maritime ships and railways.
Economic viability: SAF production is currently more expensive than conventional aviation fuel, which can make it difficult for airlines to justify the additional cost, especially when profit margins are tight.
Commissioning time: The current production capacity of SAF is not sufficient to meet the demand for it. This means that more factories need to be designed and commissioned to boost the production of SAF. This problem could lead to increased costs and supply chain disruptions.
Infrastructure: The production, transportation, and storage infrastructure for SAF at airports is not yet well developed. This means that new infrastructure will need to be built to accommodate the increased use of SAF.
Energy intensity and process yield: SAF production requires a significant amount of energy, which can lead to an increase in greenhouse gas emissions if the energy is generated from non-renewable sources. Therefore, utilizing renewable electricity and improving the process yield of SAF production processes will be crucial to emissions reduction and boosting production capacity.
SAF compatibility: The term SAF may lead to the misconception that all SAFs are identical, but in reality, different technologies result in compositional variations among SAF blending components. Even when the same technology is employed, different producers will yield distinct products. The problem of SAF compatibility arises from the fact that different airports may store and distribute different types of SAF. Therefore, ensuring a compatible mix is crucial for safety purposes. Moreover, the ability to mix different types of SAFs is not yet fully clear. According to the ASTM standard, it is not permissible to blend two or more approved types of SAF blending components for commercial flights. However, it is worth noting that distinct SAF blends can be blended together if they are reidentified as Jet A/A-1 fuel [15]. In other words, this means that if different SAF blends have been approved individually, they can be combined to create a new blend.

1.4. Methodology

To validate the potential of meeting the EU’s SAF targets through bio-based feedstocks, four steps were required as follows:
  • One of the main challenges that limits the expansion of SAF production is feedstock availability. Therefore, the different types of bio-based feedstocks that could be used for SAF were quantified to determine their potential and supply limitations. This information will help determine if the EU has enough sustainable feedstocks that could be used for SAF production to meet the demands.
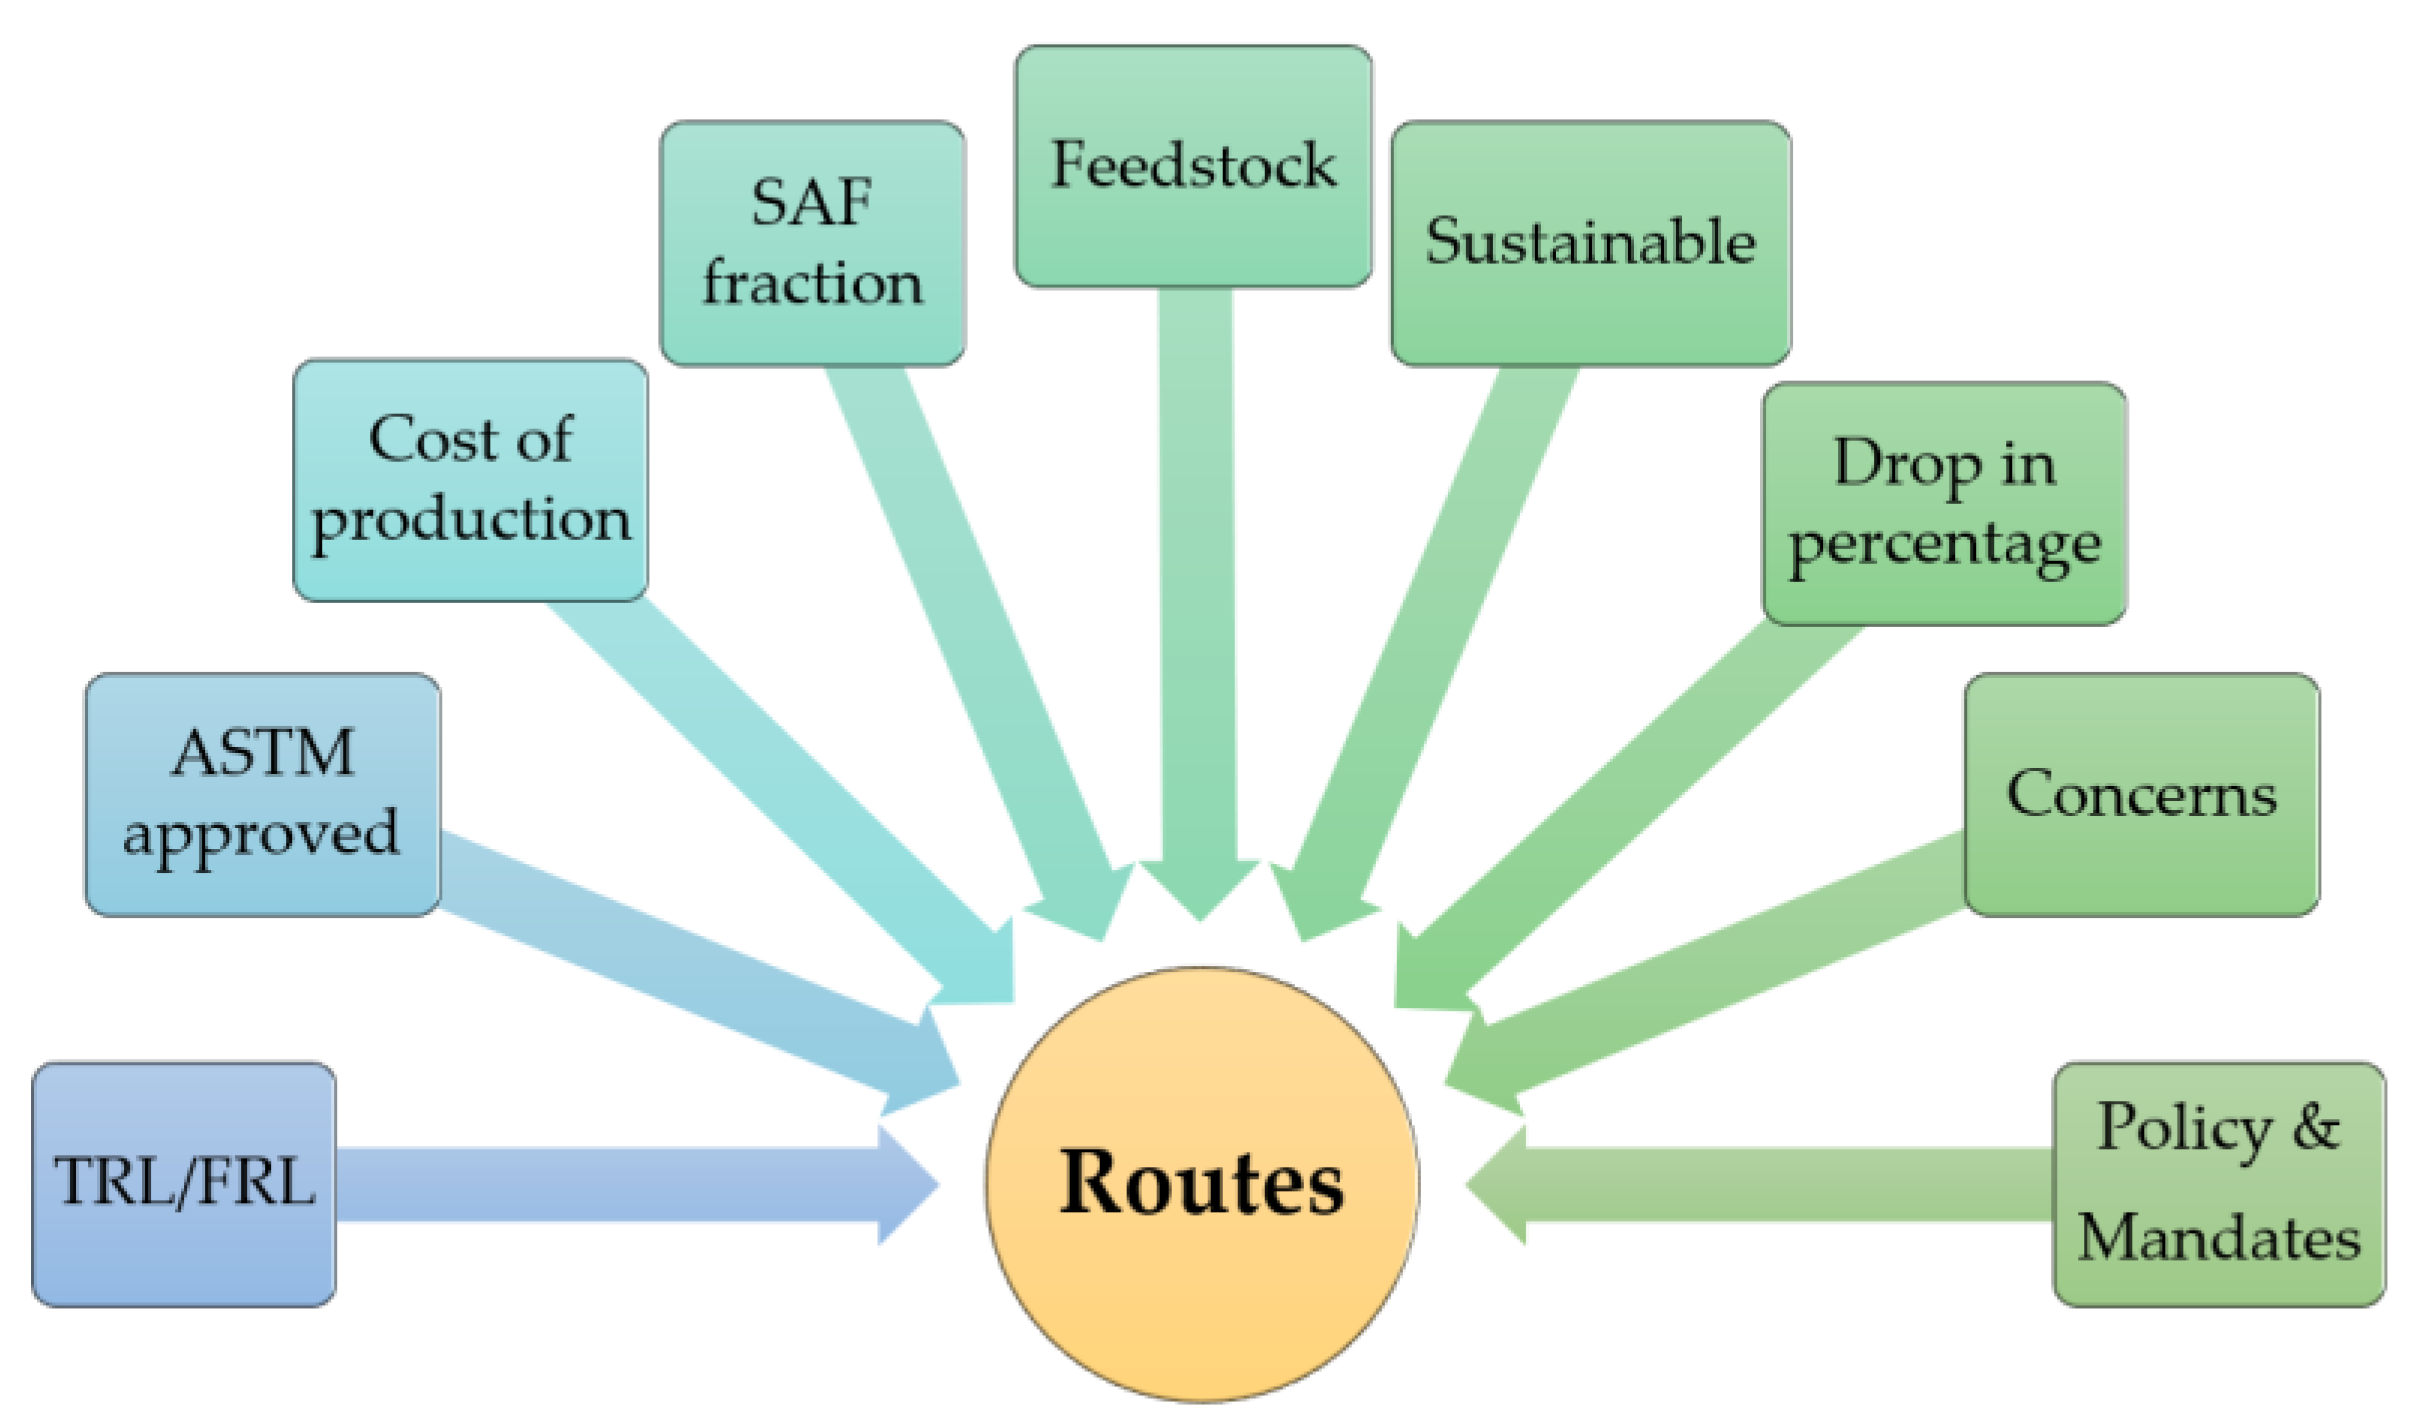
  • Several pathways can be used to convert bio-feedstocks into SAF. These pathways have significant differences that arise from the utilization of diverse feedstocks and processes with varying levels of technological readiness. Therefore, the defined pathways by ASTM D7566 were comprehensively analyzed to determine the most promising and economically viable pathways that could be implemented in the short and medium term from the moment of issuing the mandate.
  • By utilizing the optimal pathways and available feedstock quantities identified in the earlier steps, the capacity of SAF production in the EU was collected. The capacity in million tonnes (Mt) of SAF was calculated according to the following formula: SAF Capacity (Mt) = Feedstock quantity (Mt) × The yield percentage of liquid hydrocarbon × SAF fraction in the liquid hydrocarbon. The yield values can change depending on the pathway and the feedstock. Therefore, estimating the capacity of SAF production from each pathway shows which combination of feedstocks and pathways is capable of supplying enough SAF to meet the mandate targets.
  • The accuracy of the yield values is crucial for this study as it represents the main source of uncertainty since the literature data was inconsistent. Therefore, a pathway was selected as a case study to validate the above-mentioned approach by performing a process simulation that corresponds to a large commercial production facility. The results of the simulation help to verify the literature data by providing reliable values for the process yield under different scenarios and configurations. Such information is essential to confirm the maximum possible capacity of SAF production from a particular pathway. The analysis helps to make informed decisions and prioritize the pathways that have the potential to meet the SAF targets using the current technologies and feedstocks.

2. SAF Feedstocks Availability and Quantification

2.1. Bio-Based Feedstocks

Different types of feedstocks could be utilized to produce SAF, depending on the pathway. The analysis covers mainly the recommended bio-based feedstocks according to the European Renewable Energy Directive, which also meet the CORSIA sustainability criteria for SAF production [16,17].

2.1.1. Waste Oil, Fats, and Grease

Waste oils, fats, and greases (FOGs) include different types of waste, such as used cooking oil (UCO), greases, fatty acids, and animal fats. These wastes represent the leftovers generated during the cooking or food preparation process. It can be collected from commercial facilities or households. These oils are typically used in the biodiesel sector.

2.1.2. Vegetable Oils

Vegetable crops such as palm oil, soybeans, rapeseed, and sunflower are primarily cultivated for their oil-rich seeds. These four crops collectively represent over 87.3% of the total vegetable oil production in 2022/2023 [18]. Moreover, they are widely utilized for various purposes, including food, industrial applications, and biofuel production.

2.1.3. Agricultural Residues

Agricultural residues refer to the parts of plants that remain after the main part has been harvested, processed, or consumed. This can include stems, leaves, husks, and shells. Agricultural residues can be a valuable source of organic matter and can be used for various purposes, including energy production or upgrading into synthetic fuels.

2.1.4. Lignocellulosic Cover Crops

Lignocellulosic cover crops are plants that are grown specifically to cover the soil and provide benefits such as erosion control and improved soil health. These crops are usually selected for their fast growth and ability to produce a large amount of biomass, which can then be used as feedstock for the production of SAF.

2.1.5. Municipal Solid Waste

The organic fraction of municipal solid waste (MSW) refers to the portion of household and municipal waste that is biodegradable and derived from plant or animal sources. This can include food waste, yard waste, paper products, and other organic materials. The organic fraction of MSW can be diverted from landfills and processed as fuel feedstock.

2.1.6. Primary and Secondary Forest Residual

Primary and secondary forest residuals are both forms of organic material remained from the harvest of forests, but there are some key differences between those two [19,20]. Origin: Primary forest residual comes from the harvest of primary forests, which are forests that have never been disturbed or impacted by human activity. Secondary forest residual comes from the harvest of secondary forests, which are forests that have regrown after a previous disturbance, such as logging or clearing for agriculture. Structure and Diversity: Primary forests are typically more complex in structure and species diversity compared to secondary forests. This means that primary forest residuals are often of higher quality with a higher energy content and can be more valuable as a source of bioenergy. When it comes to availability, secondary forest residuals are more readily available as they are widely used for commercial purposes, whereas primary forests are often protected and access to them may be limited.

2.2. Feedstock Quantification

Two different approaches were considered to quantify those feedstocks, either based on their theoretical or actual availability. Theoretical availability refers to the feedstock available for the whole bioenergy sector, regardless of its current use. The theoretical quantification assumes that all the available mass of the feedstock is directed toward producing sustainable aviation fuel. On the other hand, actual feedstock availability refers to the quantity of feedstock that fulfills the following criteria:
  • Sustainable.
  • Easily available for collections.
  • Considers the competing demand from other sectors.
  • Affordable and logistically viable.
Different studies are available in the literature for the quantification of those feedstocks in the EU, as presented in Table 1 [21,22]. The theoretical projections do exist for 2030 and 2050. In the case of actual availability, only data predictions for 2030 are available.
According to Table 1, the availability of waste FOGs, agricultural residues, cover crops, and forestry residuals that are used in the bio-sector is expected to increase in 2050 compared to 2030. However, it is anticipated that the organic fraction of municipal solid waste will decrease by 2050 due to the EU’s regulations aimed at reducing its production by following the waste hierarchy scheme [25]. The main focus is on the actual feedstocks, as those are the ones that are available and could be easily utilized to produce SAF. It can be seen that agriculture residuals, cover crops, and MSW would be largely available compared to forestry residuals.

3. Analysis of SAF Pathways

3.1. Approved ASTM D7566 SAF Pathways

Different types of sustainable aviation fuel pathways conform to the ASTM D7566 standard [13]. These pathways are categorized based on the technology and feedstock used to produce the fuel. Each pathway has its own unique characteristics and environmental impacts. Understanding the different pathways is crucial for the aviation industry to effectively reduce its carbon footprint and support the transition to a more sustainable future. The common approved pathways for SAF production are compared and analyzed to determine their maturity level to meet the SAF mandates.

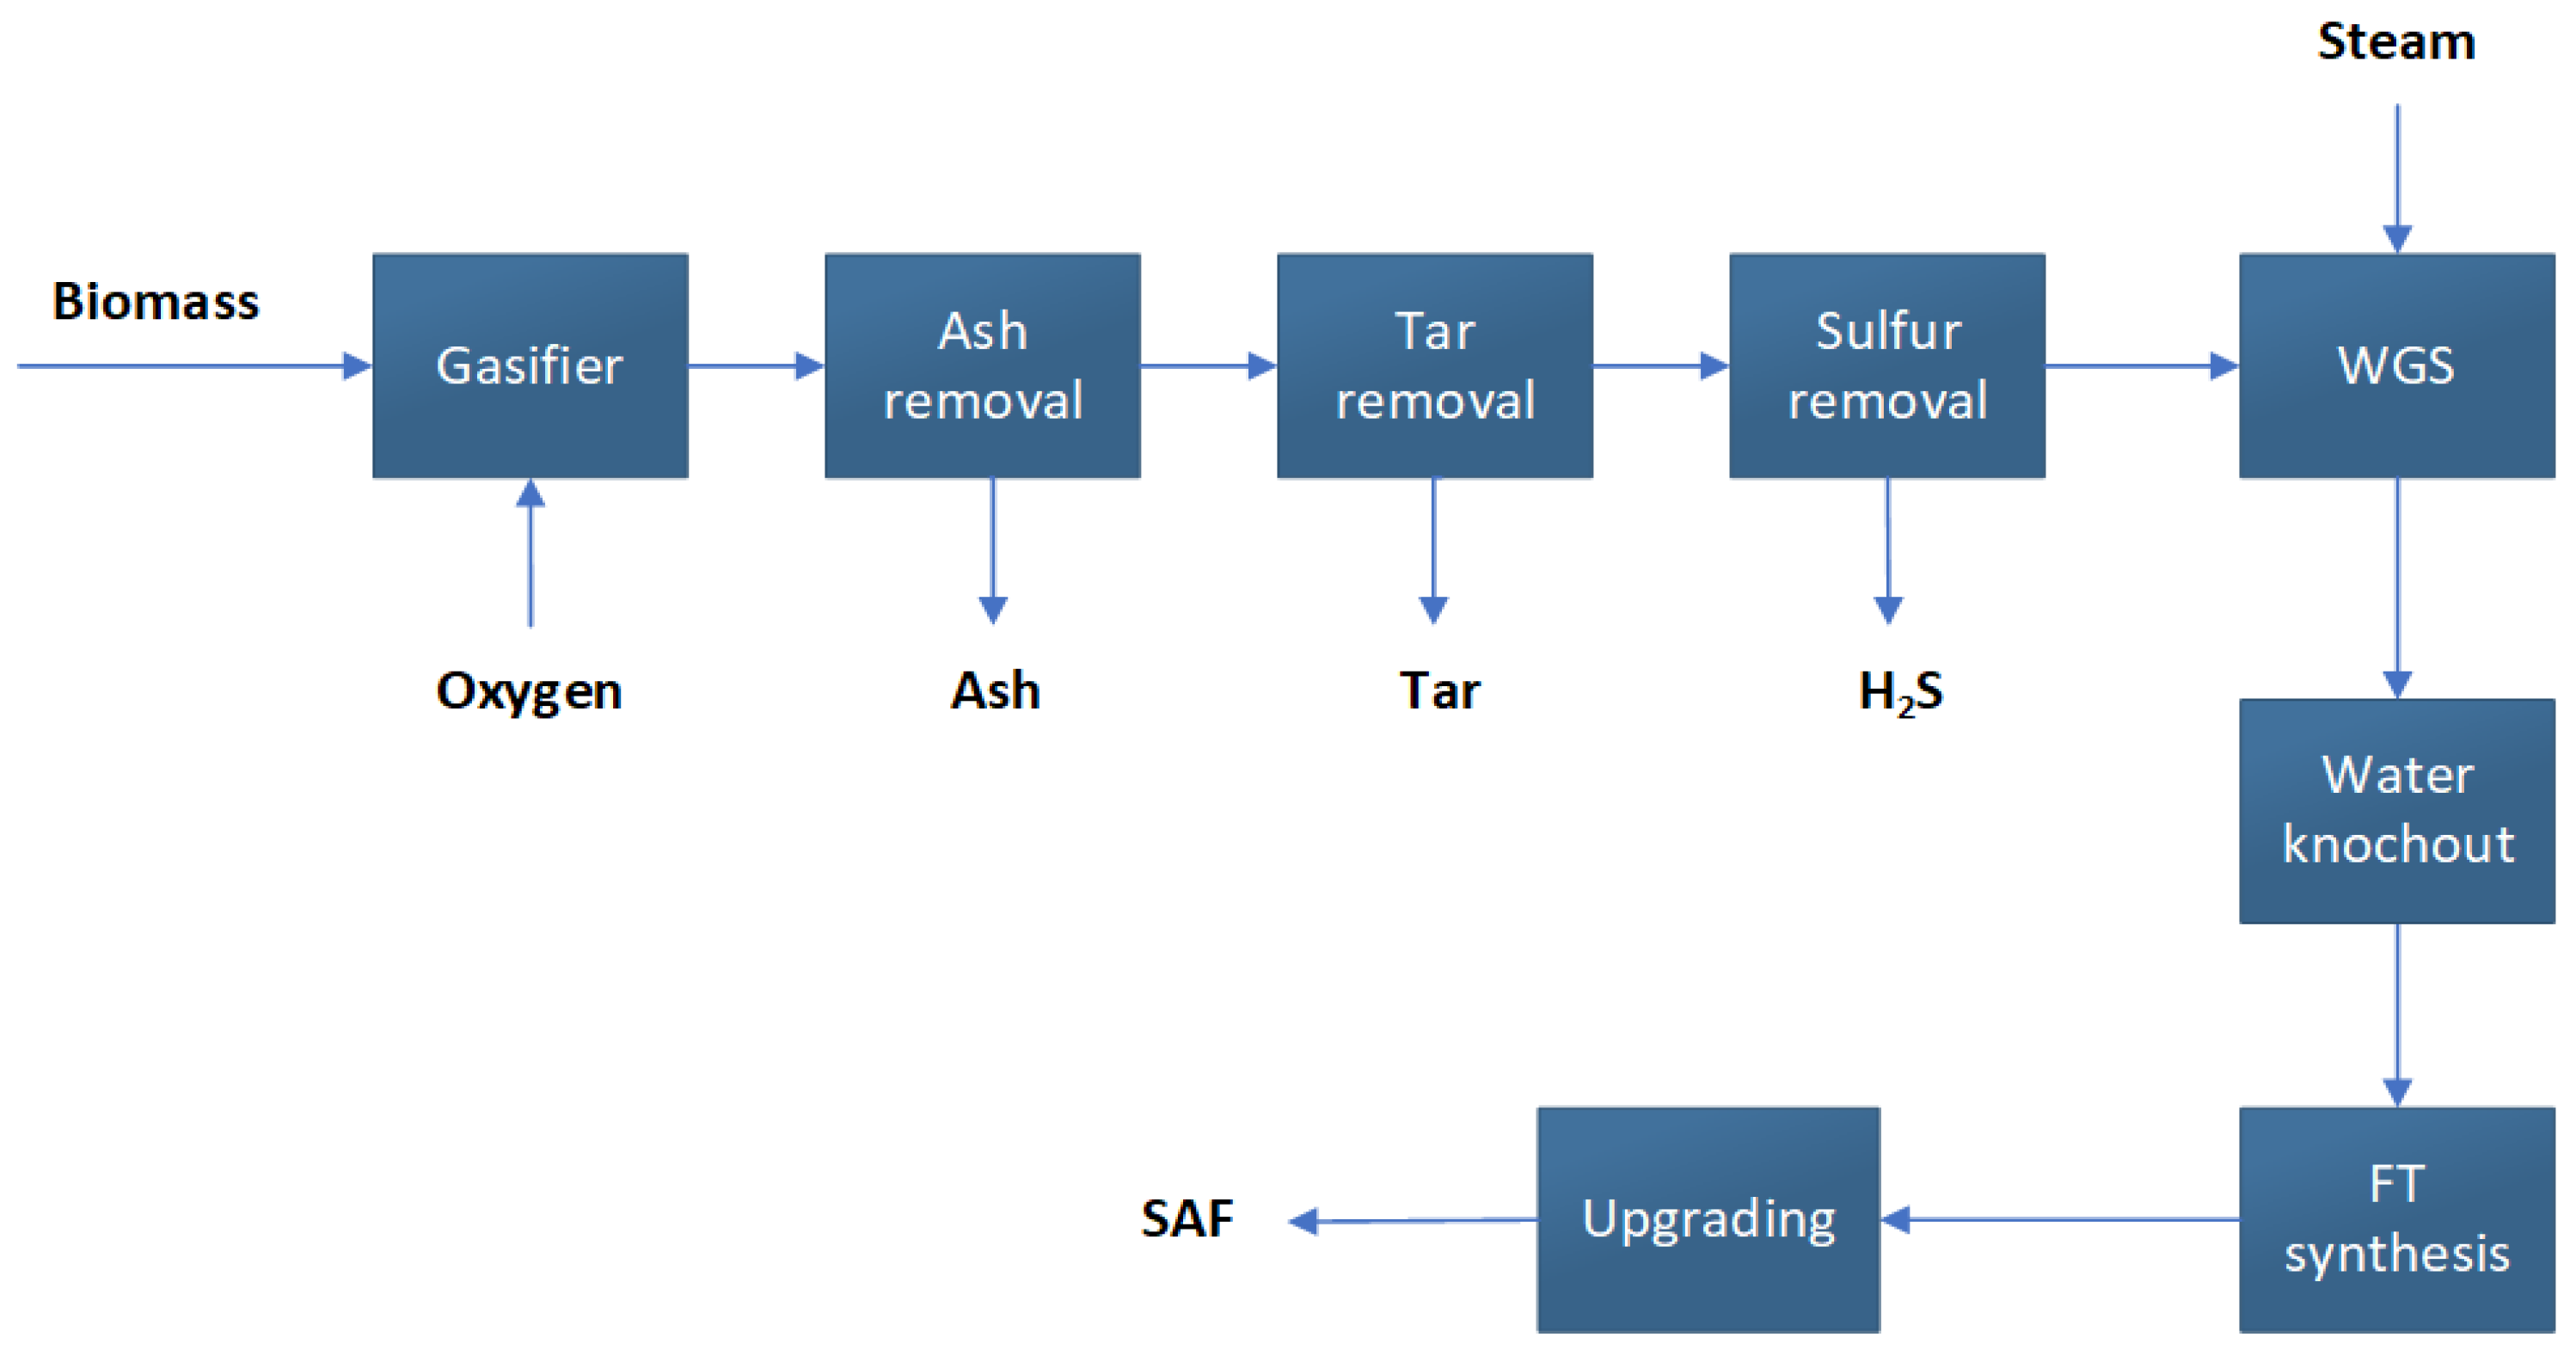
3.1.1. Fischer–Tropsch—Synthetic Paraffinic Kerosene

FT-SPK is a sustainable aviation fuel produced from non-petroleum-based feedstocks using the Fischer–Tropsch process. FT-SPK is a drop-in fuel, meaning it can be used in existing aircraft engines without requiring any modifications or additional infrastructure. The Fischer–Tropsch process utilizes syngas, which is typically produced through gasification when using biomass as a feedstock. In an FT reactor, the syngas is converted into hydrocarbons, which are processed further to produce a range of fuel products, including FT-SPK. FT-SPK has similar chemical properties to conventional fossil-based jet fuel, making it a viable alternative to conventional jet fuel.

3.1.2. Fischer–Tropsch—Synthetic Paraffinic Kerosene with Added Aromatics

(FT-SPK/A) is blended FT-SPK with a small quantity of aromatic hydrocarbons (around 20%), which matches the characteristics of conventional jet fuel [26]. The blending of FT-SPK with aromatic hydrocarbons is done to improve the fuel’s cold-weather performance. At cold temperatures, the wax content in FT-SPK can cause it to solidify and become too viscous, which can affect the fuel’s flow properties and potentially damage aircraft engines. FT-SPK/A is also a drop-in fuel. Theoretically, it can be used as a 100% drop-in fuel without the need to be blended with conventional jet fuel [27].

3.1.3. Hydroprocessed Esters Fatty Acids—Synthetic Paraffinic Kerosene

(HEFA-SPK) is typically produced by the hydroprocessing of different renewable feedstocks, such as vegetable oils and animal fats. The hydroprocessing technique involves breaking down the fatty acids in the feedstock into smaller hydrocarbon molecules. These smaller molecules are then combined with hydrogen to produce a range of hydrocarbons, which are further processed to create HEFA-SPK.

3.1.4. Hydroprocessing of Fermented Sugars—Synthetic Iso-Paraffinic Fuels

HFS-SIP fuel is produced by fermenting sugars derived from renewable feedstocks such as corn and sugarcane to make bio-alcohols such as ethanol or butanol. During hydroprocessing, a variety of hydrocarbons are created from bio-alcohols. HFS-SIP is a multi-step, multi-technology process that includes the preparation of the feedstock, fermentation, hydroprocessing, refining, and blending.

3.1.5. Alcohol-to-Jet Synthetic Paraffinic Kerosene

ATJ-SPK is produced by converting bio-based alcohols, such as ethanol, into hydrocarbons that can be used as a drop-in replacement for conventional jet fuel. The process for producing ATJ-SPK is similar to the process for producing other types of synthetic paraffinic kerosene fuels, but with the added step of dehydrating the bio-based alcohol feedstock. ATJ-SPK has the advantage of being produced from a wide range of bio-based feedstocks, including waste materials such as agricultural and forestry residues.

3.1.6. Co-Processing of Bio-Oils with Petroleum

Co-processing of bio-oils with petroleum is a process in which bio-oils are blended and co-processed with petroleum in traditional oil refineries. The goal of co-processing is to increase the proportion of renewable fuels in the final product, reduce the carbon footprint of the refinery, and produce more sustainable aviation fuel.

3.1.7. Catalytic Hydrothermolysis Synthetic Kerosene

CHJ-SK is typically produced by a process known as catalytic hydrothermolysis. The process involves the heating of a mixture of water and biomass to high temperatures and pressures in the presence of a catalyst. The catalyst breaks down the complex organic molecules in the biomass into simpler hydrocarbons. The resulting liquid is then refined and blended to create a fuel that can be used as a drop-in fuel.

3.1.8. High Hydrogen Content Synthetic Paraffinic Kerosene

(HC-HEFA-SPK or HHC-SPK) is produced from waste oils, fats, and algae, where the feed is converted to hydrocarbons by treating the feedstock with hydrogen to remove oxygen and other less desirable molecules. The hydrocarbons are cracked and isomerized, creating a synthetic jet fuel suitable for blending.

3.2. Comprehensive Analysis for SAF Pathways

In order to evaluate the SAF pathways, a set of criteria was chosen to compare and analyze their potential and their readiness level to meet future demand, as shown in Figure 1.
Policy and mandate, refer to the level of support given to a specific pathway by the European mandate. TRL/FRL, are the technology and fuel readiness levels, respectively. They scaled in the range of 1–9, where 9 is the highest value, which means that the technology is fully commercialized. While 1 refers to the fundamental research principle. ASTM approval is the year when the pathway was accepted to be utilized for SAF production. The cost of production includes the total capital expenditure (CAPEX), the operational cost (OPEX), and the SAF cost per tonne of fuel. The SAF fraction is the percentage of SAF that exists in the liquid hydrocarbon mix after processing the feedstock. The feedstock is an evaluation of the types of materials that could be used for SAF production, their availability, and the cost per tonne of supplying a particular feedstock. Sustainability evaluates the different pathways based on their range of GHG emissions compared to the conventional jet fuel baseline. These values are typically obtained through a comprehensive life cycle assessment (LCA), which covers the production cycle, including planting and cultivating the feedstock and the processing stage until the final fuel is produced. The value is measured in gCO2e/MJ, which is the amount of greenhouse gas emissions (expressed in CO2e, or carbon dioxide equivalent) produced per unit of energy (megajoule) of the fuel. The values change depending on which feedstock or process is used for SAF production. It is important to highlight that there are different approaches to evaluating the sustainability of bioprocesses, including LCA and exergoenvironmental analysis [28]. Each approach has a distinguished use; for example, LCA is internationally standardized and the most widely used to evaluate the environmental impacts of a broader scope covering the entire product life cycle. On the other hand, exergoenviornmental analysis can help identify areas of inefficiency and potential improvement in bioenergy-intensive systems [29]. The drop in percentage represents the maximum blending ratio that can be supplied to the current aviation engines without compromising safety protocols. Concerns refer to non-technical aspects that could influence the decision-making process, such as geopolitical implications or geographical limitations. Geopolitical implications indicate the potential disruption of the supply chain for a particular raw material/feedstock used in the production of sustainable aviation fuel. Geographical limitation refers to the difficulty of growing a feedstock in a particular area or region due to environmental reasons or a lack of resources. Table 2 summarizes the results of the different criteria.
Based on the maximum drop in percentage, it can be clearly seen that FT-SPK/A and CHJ-SKA could provide a fuel that is 100% suitable to be used in the current aviation fleet without the need for blending. This is because these pathways produce SAF that is relatively identical in properties to conventional jet fuel, with around 20% aromatics [26]. This aromatic percentage fulfills the safety regulations needed for engine sealing. In contrast, the current co-processing capacity is low at around 5%; this is due to a combination of technical and economic factors. One of the main technical challenges of co-processing is that bio-oils have different physical and chemical properties compared to petroleum [34]. This can affect the stability of the refining process and the quality of the final product. Furthermore, the use of bio-oils can also lead to issues such as fouling and corrosion of refinery equipment. Despite the fact that co-processing bio-oils with petroleum has great potential to reduce the carbon footprint of the refining industry, it requires further research and development to address the technical challenges and improve its economic viability.
Based on TRL/FRL, CAPEX, OPEX, and SAF cost per tonne, the conclusion starts to look completely different because HEFA becomes the most promising option. This is due to several reasons:
  • The feedstocks used in HEFA, such as vegetable oils and animal fats, do not require extensive processing, which reduces the capital investment required for the production facility. Therefore, only around 7–10% of the jet fuel’s cost comes from the capital cost. Different from HEFA, the capital cost represents the bulk of the jet fuel’s cost in other pathways, such as FT and ATJ.
  • The HEFA process is a proven technology that has been used in the production of biodiesel for many years. The technology is well understood and can be easily adapted for the production of renewable aviation fuel.
  • HEFA has a relatively high yield conversion compared to other pathways, which means that a relatively small amount of feedstock, when processed, will turn out to be around 90% liquid hydrocarbon. Therefore, this will reduce both the capital and operating costs.
  • Side streams produce valuable co-products such as glycerol, which can be sold to offset the operating costs of the plant.
Based on feedstock availability and cost, a different story emerges since waste and biomass residuals are the most abundant and could be supplied in large quantities and at a reasonably low cost. MSW is the cheapest feedstock due to the availability of existing policies for collection and sorting. Therefore, the pathways that could utilize such feedstocks would have the highest potential to be widely implemented. Therefore, Fischer–Tropsch leads in this category, followed by ATJ and HFS-SIP, thanks to the mid-range availability and cost of their feedstocks. HEFA comes at the end of the ranking as it utilizes feedstocks that are not widely available and include relatively more expensive feedstocks. In the case of using waste oil such as UCO, the feedstock costs drop depending on the location and the existing infrastructure to collect the oil. It is worth noting that the cost per tonne for those feedstocks could vary considerably depending on market conditions. On the other hand, algae could theoretically be considered more abundant than the previous feedstocks, but they cannot be quantified, so there is no range provided. This is because algae can be grown in a wide range of environments, including freshwater, seawater, and wastewater, and can be harvested year-round. In addition, algae have a higher growth rate than many other crops, which means that they can produce more biomass per unit of land and time. Yet, the process itself is not mature, and the feedstock is expensive; therefore, in its current state, it can be excluded.
Sustainability is measured based on the emissions caused by each pathway when utilizing different types of feedstocks. Therefore, a range is given for each pathway. The Fischer–Tropsch process, regardless of which feedstock is used, remains the most sustainable among all other processes. FT produces 7.7–12.2 GHG gCO2e/MJ compared to the conventional jet fuel baseline of 89 GHG gCO2e/MJ [32]. Therefore, it has very high emissions savings. The other processes also fulfill the sustainability criteria and reduce the overall emissions depending on the feedstock, with HEFA coming in second, followed by ATJ and HFS-SIP.
Based on the SAF fraction, the biomass is converted into liquid hydrocarbon, which contains a mix of light gases, naphtha, biodiesel, and aviation fuel. The percentage refers to the SAF fraction in the liquid, which changes depending on the feedstock, process parameters, and catalysts. HFS-SIP gives the highest yield of SAF, up to 100%. Then followed by ATJ, FT-SKA, and HEFA. The yield fraction of SAF is a very important consideration for the economic viability and sustainability of the production processes.
Geopolitics and geographical limitations are other aspects to consider while comparing and analyzing the suitability of adapting a specific SAF pathway on a large scale. This parameter has been added as a reflection of the recent energy crises caused by the Russian war in Ukraine. Considering the feedstocks utilized in each pathway, it can be seen that HEFA, CO processing of oils, and CHJ-SKA have serious geopolitical concerns. This comes from the fact that the feedstocks used on those pathways are not widely available in the EU and depend on imports. The EU imports around 50% of its used cooking oil (UCO) from China, which is expected to play a major role in SAF production. Therefore, with the rising tension and trade war between China and the US, and according to the latest NATO 2022 strategic concept document that addresses China [36], it is fair to assume that such feedstock could be easily compromised in the case of sanctions. Therefore, adapting those processes on a wide scale could compromise the aviation sector, as any disruption in the feedstock supply chain in the Indo-Pacific region will paralyze the industry. However, such geopolitical concerns could have a positive effect, as this boosts the demand for utilizing locally produced and sustainable feedstocks for SAF production, which brings the EU a step closer to being energy-independent. A feedstock such as UCO could be collected and sorted from the domestic market for SAF production. However, this will require a significant investment in developing the necessary infrastructure.
On the other hand, most of the raw oil feedstocks grow in East Asia, South America, parts of Europe, and the United States [37]. Palm oil is the most consumed vegetable oil in the world and could present a major source of carbon leakage for the EU despite the complete ban on using it as a feedstock for biofuel production [37,38]. This is because the cooking oil used is mostly imported, as previously mentioned. Therefore, the imported UCO in the EU could contain significant quantities of palm oil, which indirectly defies the EU’s ban on palm oil for biofuel production. The reason behind the ban is that palm oil production is associated with major environmental concerns, including deforestation, reducing biodiversity, threatening wildlife, and several human rights violations.
The geographical limitations of where such oil crops can grow make the EU incapable of planting and supplying palm, soybean, or sunflower oil on a large scale for SAF production. East Asian and South American nations are prominently capable of growing palm and soybean oils, where these feedstocks typically require humid conditions, high rainfall, and adequate sunlight [39]. While Russia and Ukraine are the biggest producers of sunflower oil due to the large availability of fertile lands and suitable weather [40]. Therefore, it can be concluded that most vegetable oils not only have potential geopolitical concerns but also geographical limitations due to unsuitable climate conditions in the EU. In the case of sugar cane and beet, they grow in the EU and are mostly used for sugar production, but they are not highly sustainable feedstocks. Furthermore, sugarcane/beet require a significant amount of water, which opens the debate of food versus energy. Therefore, planting a dedicated sugar crop to produce sustainable aviation fuel would not be a reasonable, sustainable, or economical solution. It is worth noting that this section is meant to give an overview of the possible geopolitical and geographical implications for SAF production; however, a more detailed analysis is recommended using a systematic thinking approach. Zahra et al. have studied the imbalance of food and biofuel markets amid the Ukraine–Russia crisis; a study with such a methodology is needed for bio-based SAF to elaborate on the potential challenges and possible solutions [41].

3.3. Most Promising and Economically Viable Pathways

The accumulative conclusion from Table 3 is that the three most viable options to be widely implemented within the scope of the mandates are HEFA, gasification Fischer–Tropsch, and alcohol-to-jet. This conclusion is driven by the fact that those pathways currently have the highest TRL and FRL with reasonable CAPEX and OPEX compared to the other pathways. Therefore, they have the potential to be implemented within a short timeframe after issuing the mandate, which helps to meet the short-term SAF targets. Beyond 2030, it is expected that the other processes will start to operate commercially. On the other hand, HEFA is already commercial, yet it cannot be considered in the long run as the backbone of the SAF industry due to its major drawbacks, as previously explained. FT-SPK enjoys similar advantages as HEFA with high TRL and FRL, yet it is a very flexible process as it utilizes multiple waste feedstocks, which are easy to provide at a low cost. Moreover, it has low emission production, with around 7.7 to 12.2 gCO2e/MJ compared to the jet fuel baseline of 89 gCO2e/MJ [32]. Furthermore, the FT-SPK process does not face any potential concerns that could disrupt SAF production, as there are no geopolitical implications or feedstock limitations in the case of adapting this pathway on a wide scale within the EU. FT-SPK also has the potential to produce SAF when blended with aromatic content, which could be utilized in the near future as a 100% drop in fuel, which is a unique feature over most of the other pathways. All those previous factors combined give the FT-SPK the edge. It is important to highlight that this analysis mainly considers the pathways approved by ASTM D7655. Other pathways are currently in the research phase and could be a game changer in the long term. Such processes are methanol to jet and waste pyrolysis. Since there is no clear scope yet for their potential, they have not been considered in this analysis.

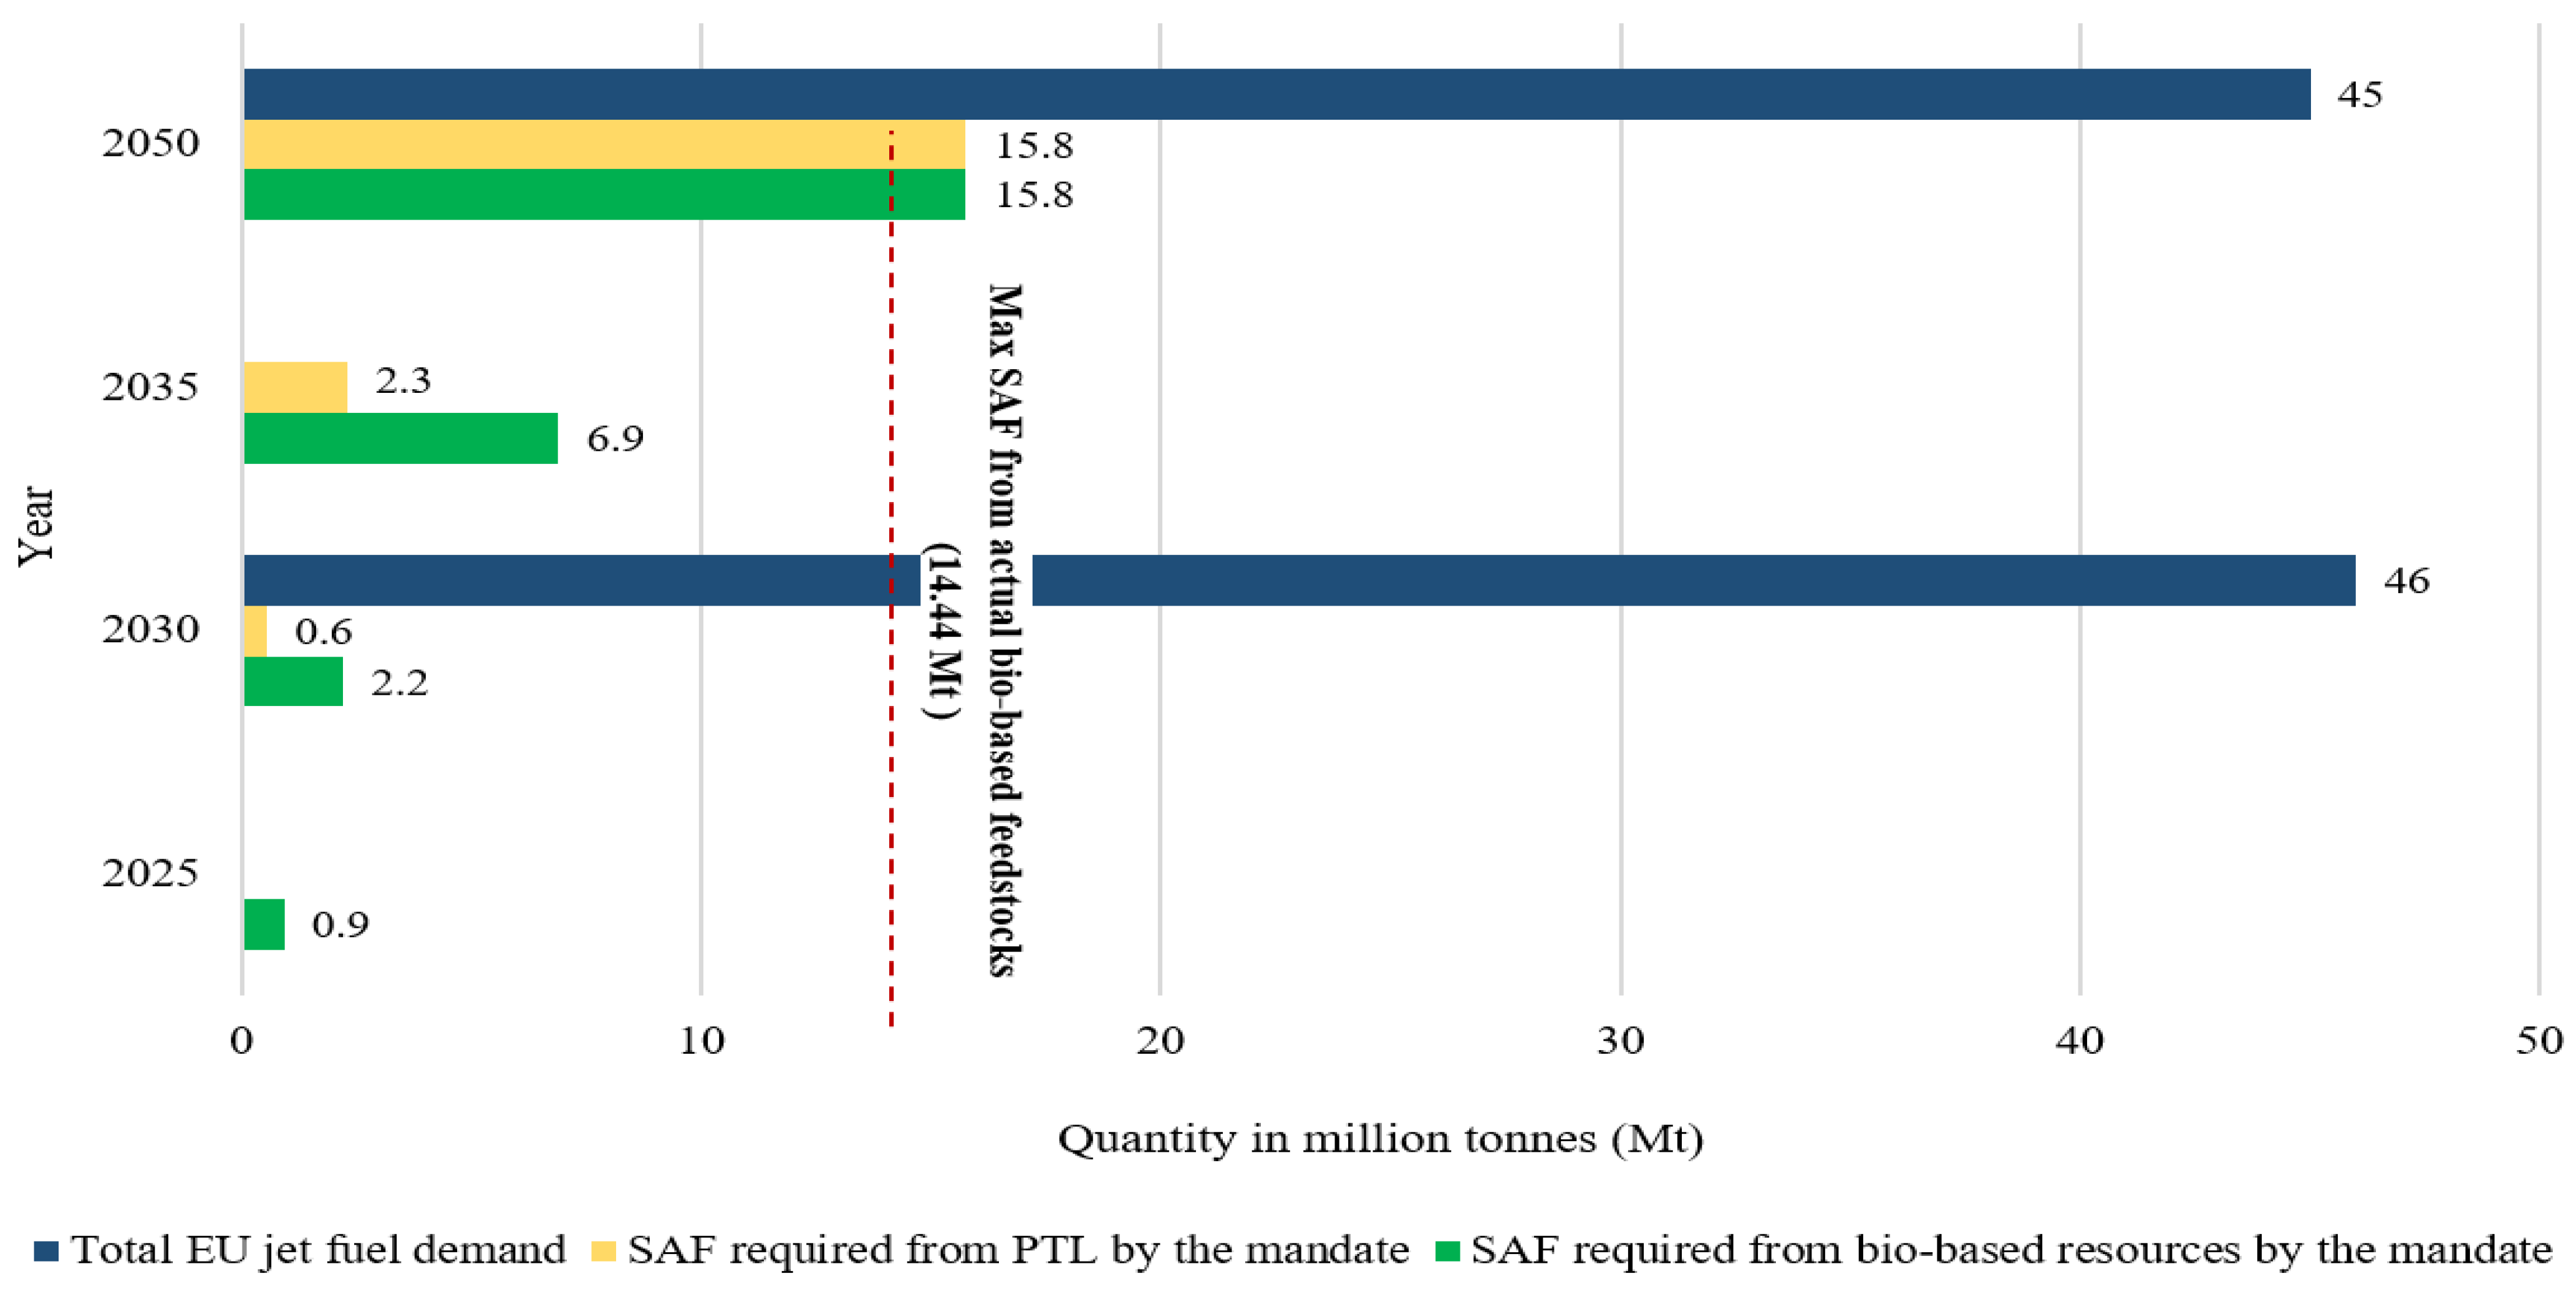
3.4. Jet Fuel Demand

The global passenger and freight traffic is expected to grow an average of 4.1% yearly [42]. This increase would theoretically correspond to utilizing more aviation fuel. By examining the historical data for jet fuel demand, it can be concluded that the demand increases in a linear pattern. However, the EU projections for future jet fuel demand are inconsistent in the literature. O’Malley et al. show that the demand will continue to grow linearly, similar to the historical data, with an expected demand of 62.8 and 71.1 million tonnes (Mt) in 2030 and 2035, respectively [23]. On the other hand, a new report published by the European Union Aviation Safety Agency shows that jet fuel demand in 2030 and beyond will be relatively stable without a significant change. The results show that the estimated demand for jet fuel in 2030, 2040, and 2050 is 46 Mt, 46 Mt, and 45 Mt, respectively [27]. These results in the report were obtained through modeling work that was performed under the framework of the ReFuelEU aviation initiative. In reality, it is difficult to precisely predict the actual demand for jet fuel in the future due to the lack of public announcements from fuel producers and airports [27]. In addition to the emergence of more fuel-efficient engines, which travel the same distances using less fuel. Moreover, the commercialization of new types of airplanes that rely on hydrogen, ammonia, or batteries to operate. All these factors will lead to a stable demand for conventional jet fuel.

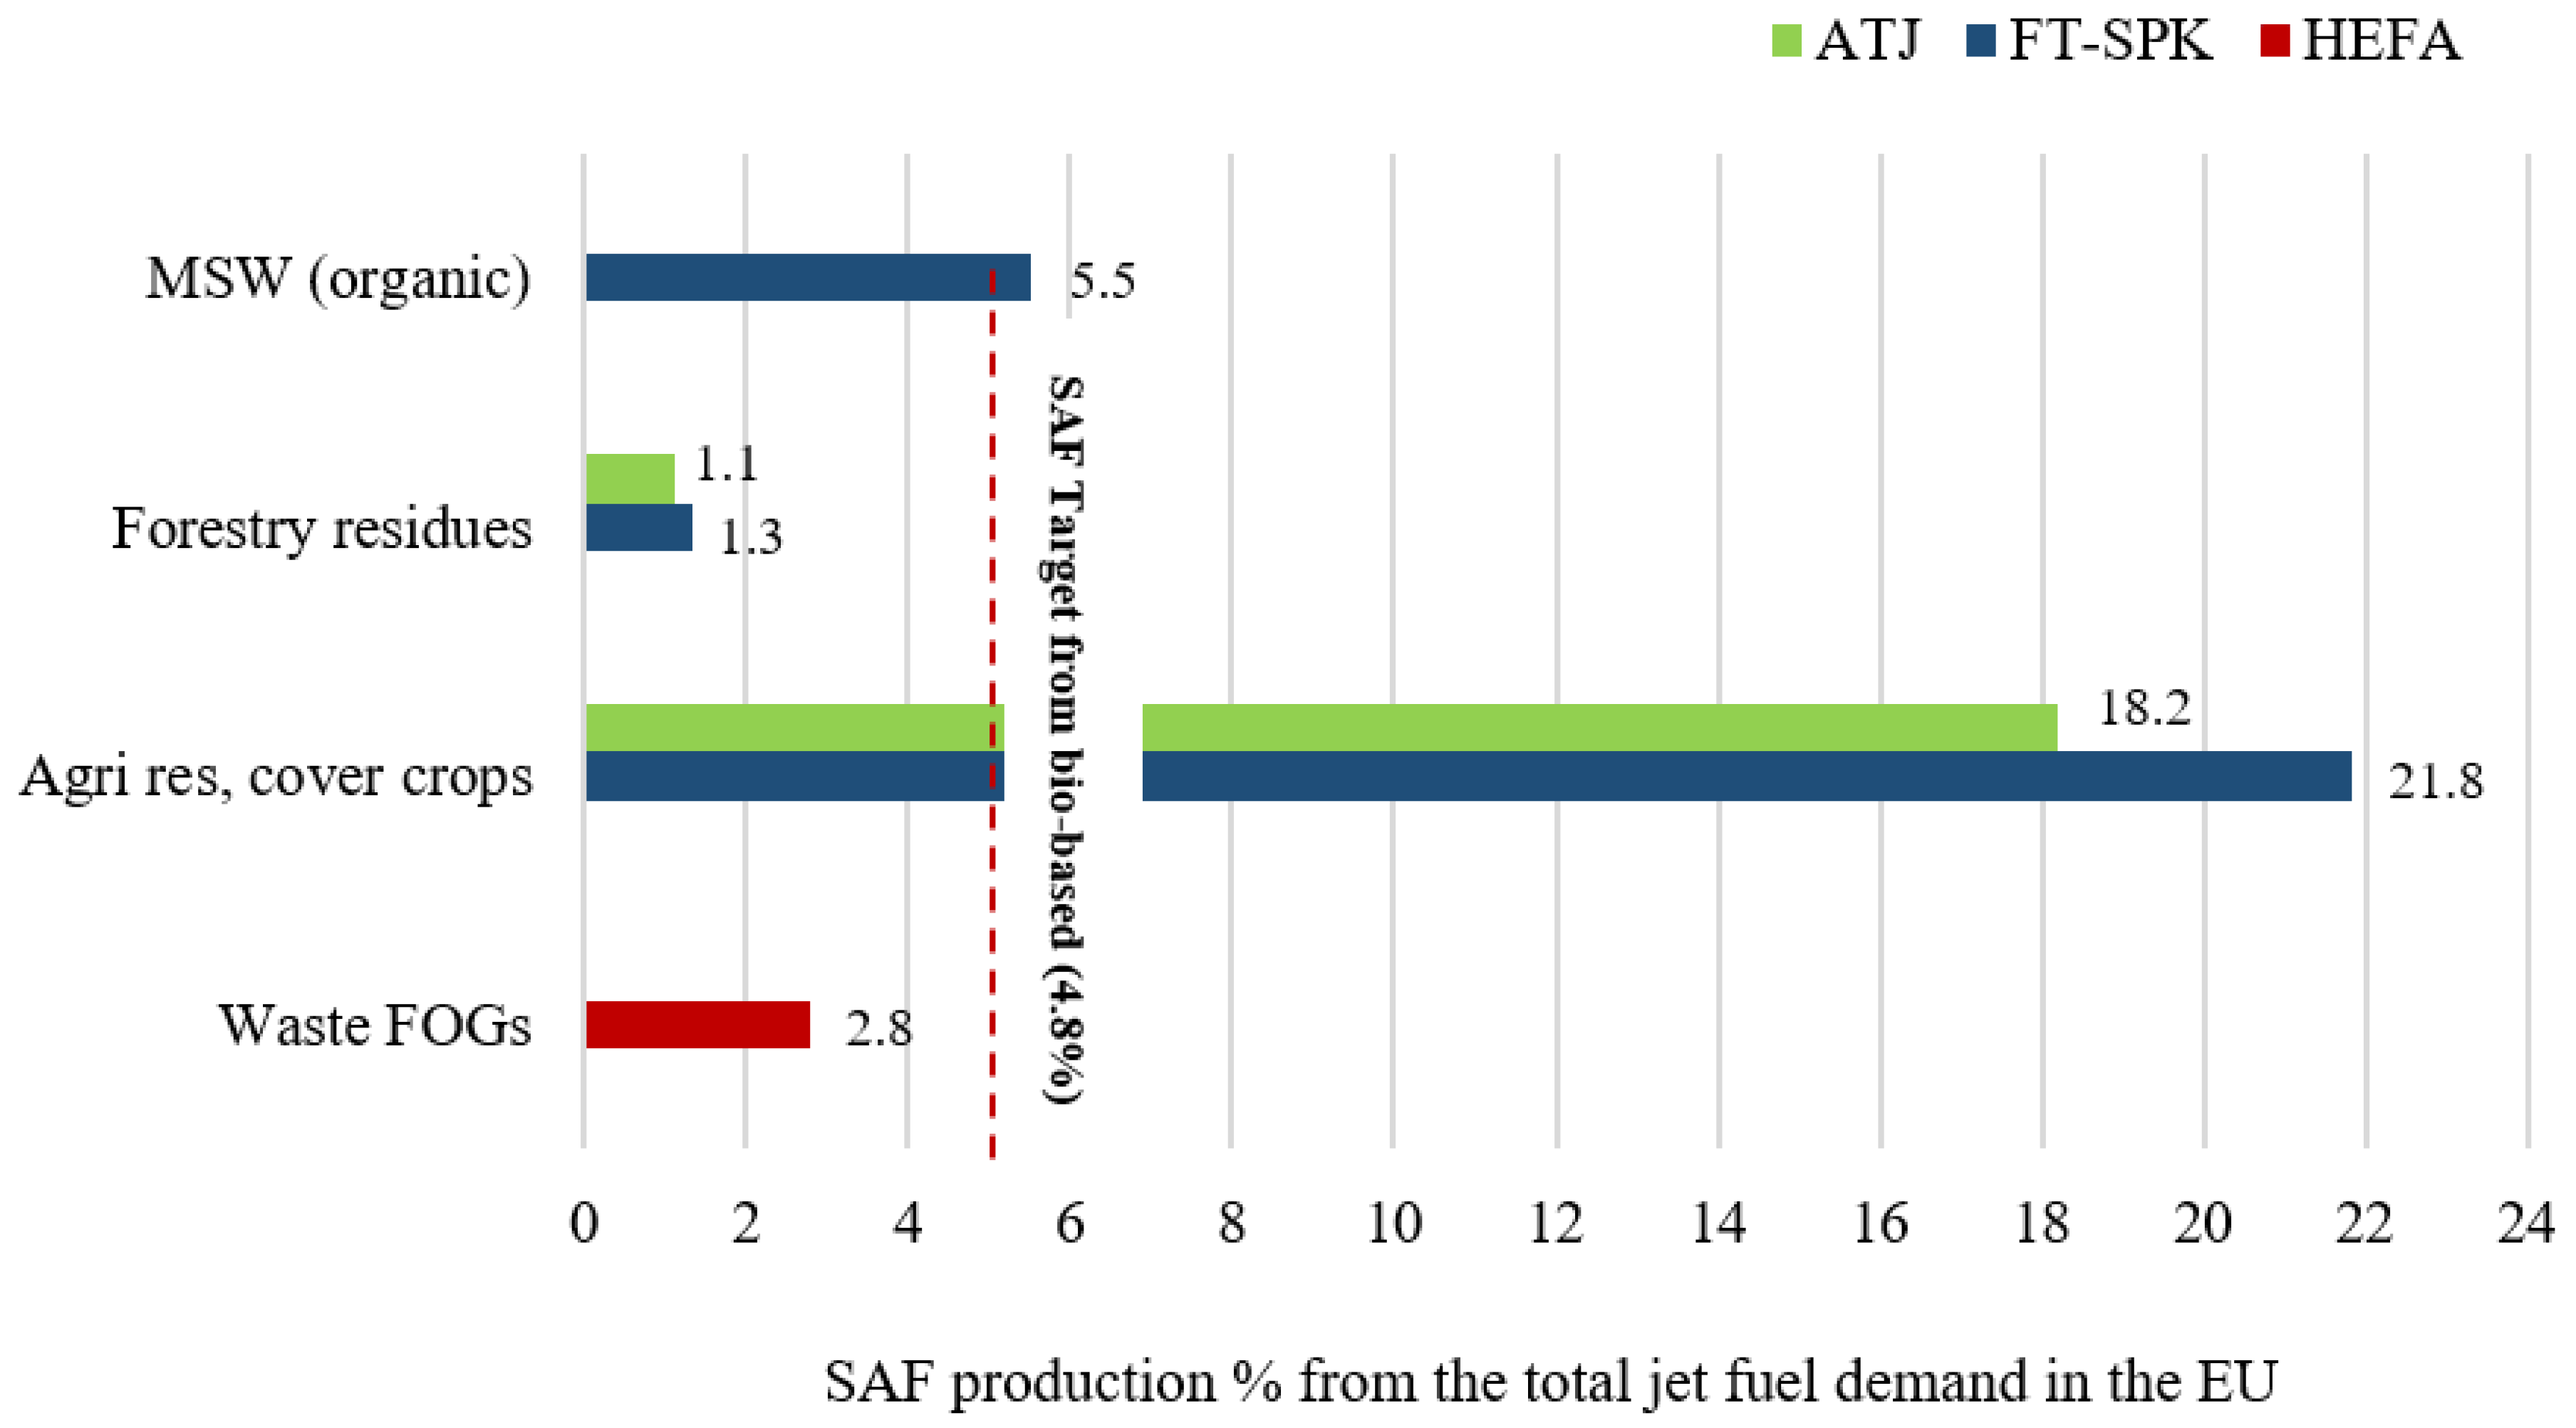
3.5. Capacity of SAF Production in the EU by 2030

HEFA, FT-SPK, and ATJ are the most promising processes to stimulate the SAF market. Based on the actual available feedstocks in 2030, the maximum SAF production was estimated with relevance to the SAF targets proposed in the ReFuelEU initiative. The target for bio-based feedstocks in 2030 is 4.8% of the total EU jet fuel demand [11]. The quantity of SAF production varies depending on the feedstock type and the conversion pathway. The feedstocks are converted into a mix of liquid hydrocarbons, including SAF. The yield factors were utilized to convert the feedstock quantities into SAF. The yield values were based on the literature data, as shown in Table 3. Estimating the capacity of SAF production using such processes provides a better understanding of the possibilities of achieving the SAF targets using the existing technologies.
The average values were considered for the calculations, while it is important to highlight that in practice, the yield values would change depending on the feedstock and the process configuration. The SAF production using the different feedstocks and pathways was estimated for the EU as shown in Figure 2.
It can be seen that waste FOGs and forestry residues would not be enough to supply the EU with its SAF uptake in 2030. On the other hand, agriculture residuals, cover crops, and MSW are capable of fulfilling all the EU targets for bio-based feedstocks. The most likely scenario is to use a portfolio of pathways and feedstocks, as this will potentially depend on the economic viability of each feedstock in the different regions. In most cases, ATJ and FT-SPK can use the same feedstock to produce SAF while excluding MSW, which is exclusive to the FT-SPK. Overall, FT-SPK overtakes ATJ thanks to the flexibility of using a wide range of feedstocks and higher yield values, which result in higher SAF production capacity. Therefore, FT-SPK has the potential to meet the SAF targets in 2030 and beyond. While it is important to highlight that by only looking at the yield values in Table 3, HEFA has the highest potential to produce more SAF. However, due to the feedstock limitations of waste FOGs, HEFA would only be able to deliver approximately 58% of the SAF target. The maximum overall SAF production from the combined bio-based feedstocks corresponds to 31.4% of the total EU jet fuel demand, which is around 14.44 Mt. This value was derived by summing the SAF production from the different feedstocks. For SAF production from the same feedstock, the value of FT-SPK was considered over the ATJ since it has higher production capacity.

3.6. Capacity of SAF Production in the EU in 2050

The previous analysis shows that utilizing the actual available biomass with the current commercial technologies would be capable of meeting the SAF targets in the EU in 2030. Beyond 2030, biomass production would be relatively stable without a significant increase. Therefore, it is fair to say that the actual available feedstocks for SAF production will not be significantly higher in 2050 compared to 2030. This is supported by the fact that any increase in biomass feedstocks would still face competition from other bio-sectors. Therefore, the extra available feedstocks would not necessarily be directed toward SAF production. Several reasons could lead to the stability of biomass production, including the impact of climate change, water scarcity, and a stricter land usage policy to protect biodiversity. To study the potential of using biomass in the long term, a hypothetical scenario was established. In this scenario, we assume that the actual available feedstocks for SAF production in the EU in 2030, which were provided in Table 1, will be exactly the same in 2050, as shown in Figure 3.
The maximum possible production of SAF from actual bio-based feedstocks is 14.44 Mt, while in 2050, at least 15.8 Mt of SAF needs to be produced from bio-based feedstocks according to the European SAF mandate [11]. Therefore, there will be a shortage of 1.35 Mt of SAF, which should be produced to meet the target. Utilizing the average yield conversion values given in Table 3, we can find that this corresponds to the need for an extra 2.4 Mt of waste FOGs or around 10.8 Mt of agricultural residual and cover crops. Those quantities would need to be available in 2050 to meet the targets. On the other hand, if we hypothetically assume that all the biomass used in the EU bio-energy sector will be utilized to produce SAF, it will be capable of delivering over 230% of the total EU jet fuel demand. In reality, this will not occur, yet it clearly shows that theoretically, biomass is capable of fulfilling the EU’s demands. Therefore, with the right policy framework in place, more biomass could be diverted from other sectors to produce SAF and meet the demand in 2050. Nevertheless, the implementation of this policy would necessitate substantial discussions and a significant amount of time for thorough deliberation. An alternative solution would be to explore the option of importing these feedstocks from the Balkan region, considering its proximity to EU states and the advantage of avoiding overseas imports. Different from the EU, most of the waste materials in the Balkans are not recycled and end up in landfills [43]. However, the future ability to provide such large quantities and verify their technical and economic viability needs to be established beforehand. It can be seen clearly that the lack of actual biomass availability in the EU derives the need for newer technologies such as PTL, which will be crucial for the future of the SAF industry. Especially considering the fact that the PTL process can use different sources of carbon dioxide, such as CO2-rich streams from cement, steal industry, or direct carbon capture from the air. This conclusion aligns with the EU’s vision of introducing a dedicated sub-mandate for power-to-liquid.

4. Validation by Process Simulation

The previous analysis relied on literature data for the average process yields. Such data were collected from different reports that provide different values and have a low confidence level, especially since these values are not clear whether they were obtained through simulation or commercial data. Moreover, those pathways are not fully commercialized yet, so it is hard to validate their values. Therefore, a hypothetical approach was established to test the reliability of using such yield values from the literature. As shown in Section 3.3 and Section 3.5, FT-SPK has several advantages over the other pathways, especially as it provides the highest production capacity of SAF and could utilize different low-cost waste feedstocks. Therefore, this process opted for analysis as a case study since it is feasible to test different configurations and use different lignocellulosic feedstocks to study the influence of those parameters on the process yield and SAF production.
A process model was developed to simulate the process on a large scale, as shown in Figure 4. This model relied on experimental data for the gasification and the Fischer–Tropsch section while scaling up the model using commercial operating conditions [44,45,46]. The input values utilized in this model were obtained from the BIOFMET project, which provided comprehensive data regarding the moisture content of the biomass, the calorific value, and the CHNS composition [47]. ASPEN Plus V10 was used to simulate the process and calculate the material and energy balances of the process streams. The Peng–Robinson equation of state in combination with the Boston–Mathias was used as a property method. Oxygen gasification was selected as the air separation unit produces nitrogen-free syngas, which is better suited for the Fischer–Tropsch process. Fischer–Tropsch can be performed at low or high temperatures. For the synthesis of long-chain hydrocarbons, low-temperature FT is recommended. The basic case of the model uses a closed-loop design for the FT reactor to maximize the CO conversion, which leads to a higher SAF yield. The scale of the model was set at around 1 GW, which is equivalent to a feed rate of around 300 tonnes/h of biomass.
The figure shows the different processing steps needed to produce sustainable aviation fuel from biomass. The process typically starts by milling and chipping the feedstock to a suitable size to be fed to the gasifier. In the gasifier, the biomass along with O2 is converted to syngas, including mainly the following gases: CO, CO2, CH4, H2O, and H2. The produced syngas contains several impurities such as ash, tar, and H2S that need to be removed before the next steps as they could deactivate the catalyst in both the water gas shift (WGS) and FT reactors. Cyclones are typically used for ash removal, while several gas cleaning technologies, including adsorbers and scrubbers, were used to remove Sulphur compounds and tar, respectively. It is worth mentioning that selecting a particular unit operation for syngas cleaning depends on the concentration and composition of the impurity. The clean gas is directed to a WGS to react with super-heated steam to reach the required ratio of H2-CO to 2:1 for the FT reactor according to Equation (1):
WGS reaction: CO + H2O → CO2 + H2
The steam will react with the carbon monoxide to produce more hydrogen and carbon dioxide. The syngas will be directed to the FT to produce long-chain hydrocarbons according to Equation (2).
Alkane production: (2n + 1) H2 + nCO → CnH2n+2 + nH2O
The Fischer–Tropsch reactor operates at 2.5 MPa and 225 °C [48]. A cobalt catalyst with a 40% CO conversion ratio is used to upgrade the syngas into a higher hydrocarbon. In the upgrading section, the liquid fuel passes through a series of flash drums where the temperature and pressure are adjusted accordingly to separate the FT gases until distilling the SAF fraction. The heavy long-chain hydrocarbons (FT waxes) are directed to a hydrocracker to increase the fuel yield. For the validation of the literature data, different scenarios were analyzed to project the minimum and maximum SAF production that could be obtained through this process. These scenarios are as follows:
  • Changing the type of biomass to study the influence of the different compositions on the SAF yield. These dried biomasses were wood chips of high quality, wood chips of industrial quality, and wood pellets, with a moisture content of 11.24%, 10.76%, and 5.93%, respectively. This scenario helped to determine the most influential parameters in the biomass that impact SAF production.
  • Two different types of gas loop designs were compared. An open loop where there is no recycle stream to the FT reactor vs. a closed loop FT.
  • Changing the catalyst utilized in the FT reactor and its CO conversion rate by using catalysts from the literature.
Other parameters were kept fixed, such as the temperature, pressure of the gasifier, and the FT reactor. Moreover, once utilizing the closed loop FT, the recycle ratios were maintained fixed to guarantee consistent comparison across the different scenarios. The simulation results have shown that the SAF yield was in the range of 15–21%, which can be considered the efficiency of the FT process. This means the range of SAF production was around 45 to 63 tonnes/h out of a feedstock input of 300 tonnes/h. This fairly corresponds to the data available in the literature. This shows that despite utilizing various feedstocks and configurations, significant improvement is still needed to maximize SAF production and enhance the economic viability of such a process.

5. Conclusions and Prospects

This study provides an overview of the SAF pathways and the potential to meet the SAF targets set by the European mandate. The analysis has shown that there are enough sustainable feedstocks available in the EU that fulfill the sustainability criteria and could be utilized to meet the short- and medium-term SAF targets. On the other hand, there will be a lack of actual available biomass in the EU in 2050, which corresponds to a shortfall of 1.35 Mt of SAF. Therefore, a further policy framework is needed to divert more biomass to meet the long-term SAF demand. There is no silver bullet in terms of which pathway to implement; a portfolio of pathways is required to maximize SAF production. HEFA, ATJ, and FT-SPK are the most promising and economically viable pathways in the short and medium term. HEFA will stimulate the SAF market despite its low sustainability credentials and feedstock availability. However, it is important to highlight the geopolitical implications when deciding to adopt a pathway, where HEFA has shown serious concerns that could compromise the aviation sector. Therefore, a comprehensive study is needed to analyze the potential impact of the current geopolitical situation on the economic viability of sustainable aviation fuel production. On the other hand, FT-SPK is the most flexible pathway and has the highest sustainability credentials, with a substantial decrease in emissions of around 7.7 to 12.2 gCO2e/MJ compared to the conventional jet fuel baseline of 89 gCO2e/MJ. The FT-SPK simulation has shown that whatever feedstock or process configuration is used, the current technologies are still not efficient enough to meet commercial demand. Therefore, these results reveal that the utilization of biomass as a prominent feedstock for sustainable aviation fuel production still faces several limitations and practical challenges.
Addressing the issues associated with biomass availability, the low process yield, and the high energy demand required for SAF production is crucial to improving the economic viability of biomass-based SAF. Moreover, the scale-up required to meet production targets presents a significant technical challenge, necessitating the construction of additional infrastructure. Furthermore, SAF compatibility is a challenging factor in reaching a 100% drop in fuel since the ability to mix different types of SAFs is not yet fully clear. Overcoming these challenges will require a significant investment in R&D to enhance the existing technologies. Moreover, paving the way for new emerging technologies to be commercially available as power to liquid would be crucial for the successful expansion of the SAF industry to reach net zero aviation. It is worth noting that this study focused exclusively on the approved ASTM pathways, while further research should explore non-approved pathways, such as methanol to jet and waste pyrolysis, to expand the understanding of alternative SAF production pathways.

Author Contributions

M.S. conceived the study; M.S. carried out the calculations, designed the figures, and led the writing, with help from K.M., M.F. and E.Z. contributing to the text and reviewing it. All authors have read and agreed to the published version of the manuscript.

Funding

This research was partially supported by the BIOFMET project (19ENG09), which was funded by the EMPIR program (European Metrology Program for Innovation and Research), co-financed by the participating states, and from the European Union’s Horizon 2020 research and innovation program.

Acknowledgments

The authors would like to thank Niall MacDowell and Mai Bui for hosting Moaaz at Imperial College London and for giving valuable insights to this study.

Conflicts of Interest

The authors declare no conflict of interest.

Abbreviations

SAFSustainable aviation fuel
HEFAHydroprocessed Esters Fatty Acids
Alcohol to JetATJ
FT-SPKFischer-Tropsch Synthetic Paraffinic Kerosene
TRLTechnology readiness level
FRLFuel readiness level
GHGGreenhouse gas emissions
IPCCIntergovernmental Panel on Climate Change
CORSIACarbon Offsetting and Reduction Scheme for International Aviation
PTLPower to liquid
MtMillion tonnes
UCOused cooking oil
MSWMunicipal Solid Waste
FOGsFats, oils, and greases
ASTMAmerican Society for Testing and Materials
FT-SPK/AFischer-Tropsch—Synthetic Paraffinic Kerosene with added aromatics
HFS-SIPHydroprocessing of Fermented Sugars—Synthetic Iso-Paraffinic fuels
CHJ-SKCatalytic Hydrothermolysis Synthetic Kerosene
(HC-HEFA-SPK or HHC-SPK)High Hydrogen Content Synthetic Paraffinic Kerosene
CAPEXTotal capital expenditure
OPEXOperational expenditure
LCALife cycle assessment
WGSWater gas shift reactor

References

  1. Hasan, M.A.; Mamun, A.A.; Rahman, S.M.; Malik, K.; Al Amran, M.I.U.; Khondaker, A.N.; Reshi, O.; Tiwari, S.P.; Alismail, F.S. Climate Change Mitigation Pathways for the Aviation Sector. Sustainability 2021, 13, 3656. [Google Scholar] [CrossRef]
  2. Bergero, C.; Gosnell, G.; Gielen, D.; Kang, S.; Bazilian, M.; Davis, S.J. Pathways to net-zero emissions from aviation. Nat. Sustain. 2023, 6, 404–414. [Google Scholar] [CrossRef]
  3. Climate math: What a 1.5-Degree Pathway Would Take: Decarbonizing Global Business at Scale is Achievable, but the Math Is Daunting. McKinsey Quarterly, 15 March 2022. Available online: https://www.mckinsey.com/~/media/mckinsey/business%20functions/sustainability/our%20insights/climate%20math%20what%20a%201%20point%205%20degree%20pathway%20would%20take/climate-math-what-a-1-point-5-degree-pathway-would-take-final.pdf (accessed on 5 June 2023).
  4. International Civil Aviation Organization. Agenda Item 16: Environmental Protection—International Aviation and Climate Change—Policy and Standardization. 2019. Available online: https://www.icao.int/Meetings/a39/Documents/WP/wp_461_en.pdf (accessed on 18 November 2022).
  5. Air Transport Action Group. Balancing Growth in Connectivity with a Comprehensive Global Air Transport Response to the Climate Emergency. 2020. Available online: https://aviationbenefits.org/media/167187/w2050_full.pdf (accessed on 8 March 2023).
  6. Undavalli, V.; Gbadamosi Olatunde, O.B.; Boylu, R.; Wei, C.; Haeker, J.; Hamilton, J.; Khandelwal, B. Recent advancements in sustainable aviation fuels. Prog. Aerosp. Sci. 2023, 136, 100876. [Google Scholar] [CrossRef]
  7. Kurzawska, P. Overview of Sustainable Aviation Fuels including emission of particulate matter and harmful gaseous exhaust gas compounds. Transp. Res. Procedia 2021, 59, 38–45. [Google Scholar] [CrossRef]
  8. Larsson, J.; Elofsson, A.; Sterner, T.; Åkerman, J. International and national climate policies for aviation: A review. Clim. Policy 2019, 19, 787–799. [Google Scholar] [CrossRef] [Green Version]
  9. Fageda, X.; Teixidó, J.J. Pricing carbon in the aviation sector: Evidence from the European emissions trading system. J. Environ. Econ. Manag. 2022, 111, 102591. [Google Scholar] [CrossRef]
  10. Department for Transport. Sustainable Aviation Fuels Mandate: Summary of Consultation Responses and Government Response. 2022. Available online: https://assets.publishing.service.gov.uk/government/uploads/system/uploads/attachment_data/file/1060601/sustainable-aviation-fuels-mandate-consultation-summary-of-responses.pdf (accessed on 2 December 2022).
  11. European Commission. ReFuelEU Aviation initiative: Sustainable Aviation Fuels and the ‘fit for 55′ Package. 2022. Available online: https://www.europarl.europa.eu/RegData/etudes/BRIE/2022/698900/EPRS_BRI(2022)698900_EN.pdf (accessed on 7 March 2023).
  12. Chiaramonti, D. Sustainable Aviation Fuels: The challenge of decarbonization. Energy Procedia 2019, 158, 1202–1207. [Google Scholar] [CrossRef]
  13. U.S. Department of Energy. Sustainable Aviation Fuel: Review of Technical Pathways. 2020. Available online: https://www.energy.gov/sites/prod/files/2020/09/f78/beto-sust-aviation-fuel-sep-2020.pdf (accessed on 5 February 2023).
  14. Cabrera, E.; de Sousa, J.M.M. Use of Sustainable Fuels in Aviation—A Review. Energies 2022, 15, 2440. [Google Scholar] [CrossRef]
  15. Steve Csonka. Sustainable Aviation Fuels Are not all the Same and Regular Commercial Use of 100% SAF is More Complex. Online. 2022. Available online: https://www.greenairnews.com/?p=2460 (accessed on 13 March 2023).
  16. European Union. DIRECTIVE (EU) 2018/2001 of the European Parliament and of the Council: On the Promotion of the Use of Energy from Renewable Sources. 2018. Available online: https://eur-lex.europa.eu/legal-content/EN/TXT/PDF/?uri=CELEX:32018L2001 (accessed on 5 October 2022).
  17. International Civil Aviation Organization. CORSIA Sustainability Criteria for Corsia Eligible Fuels. 2022. Available online: https://www.icao.int/environmental-protection/CORSIA/Documents/CORSIA_Eligible_Fuels/ICAO%20document%2005%20-%20Sustainability%20Criteria%20-%20November%202022.pdf (accessed on 20 January 2023).
  18. US Department of Agriculture, und USDA Foreign Agricultural Service. Consumption of Vegetable Oils Worldwide from 2013/14 to 2022/2023, by Oil Type (in Million Metric Tons). Available online: https://www.statista.com/statistics/263937/vegetable-oils-global-consumption/ (accessed on 21 May 2023).
  19. Karan, S.K.; Hamelin, L. Towards local bioeconomy: A stepwise framework for high-resolution spatial quantification of forestry residues. Renew. Sustain. Energy Rev. 2020, 134, 110350. [Google Scholar] [CrossRef]
  20. Titus, B.D.; Brown, K.; Helmisaari, H.-S.; Vanguelova, E.; Stupak, I.; Evans, A.; Clarke, N.; Guidi, C.; Bruckman, V.J.; Varnagiryte-Kabasinskiene, I.; et al. Sustainable forest biomass: A review of current residue harvesting guidelines. Energ Sustain. Soc. 2021, 11, 10. [Google Scholar] [CrossRef]
  21. Panoutsou, K.C. Maniatis. Sustainable Biomass Availability in the EU, to 2050. 2021. Available online: https://www.concawe.eu/wp-content/uploads/Sustainable-Biomass-Availability-in-the-EU-Part-I-and-II-final-version.pdf (accessed on 22 November 2022).
  22. Prussi, M.; Panoutsou, C.; Chiaramonti, D. Assessment of the Feedstock Availability for Covering EU Alternative Fuels Demand. Appl. Sci. 2022, 12, 740. [Google Scholar] [CrossRef]
  23. O’Malley, J.; Pavlenko, N.; Searle, S. Estimating Sustainable Aviation Fuel Feedstock Availability to Meet Growing European Union Demand; Working Paper 2021-13; ICCT: Washington, DC, USA, 2021. [Google Scholar]
  24. Carraro, C.; Searle, S.; Baldino, C. Waste and Residue Availability for Advanced Biofuel Production in the European Union and the United Kingdom 2021-39, 202100. Available online: https://trid.trb.org/view/1894362 (accessed on 26 January 2023).
  25. EU. Directive (EU) 2018/851 of the European Parliament and of the Council of 30 May 2018 Amending Directive 2008/98/EC on waste. 2018. Available online: https://www.eea.europa.eu/publications/reaching-2030s-residual-municipal-waste (accessed on 2 December 2022).
  26. IEA Bioenergy. Progress in Commercialization of Biojet/Sustainable Aviation Fuels (SAF): Technologies, Potential and Challenges; IEA Bioenergy: 2021. Available online: https://www.ieabioenergy.com/wp-content/uploads/2021/06/IEA-Bioenergy-Task-39-Progress-in-the-commercialisation-of-biojet-fuels-May-2021-1.pdf (accessed on 2 August 2022).
  27. European Union Aviation Safety Agency. European Aviation Environmental Report. 2022. Available online: https://www.easa.europa.eu/eco/sites/default/files/2023-02/230217_EASA%20EAER%202022.pdf (accessed on 24 March 2023).
  28. Aghbashlo, M.; Hosseinzadeh-Bandbafha, H.; Shahbeik, H.; Tabatabaei, M. The role of sustainability assessment tools in realizing bioenergy and bioproduct systems. Biofuel Res. J. 2022, 9, 1697–1706. [Google Scholar] [CrossRef]
  29. Aghbashlo, M.; Khounani, Z.; Hosseinzadeh-Bandbafha, H.; Gupta, V.K.; Amiri, H.; Lam, S.S.; Morosuk, T.; Tabatabaei, M. Exergoenvironmental analysis of bioenergy systems: A comprehensive review. Renew. Sustain. Energy Rev. 2021, 149, 111399. [Google Scholar] [CrossRef]
  30. Prussi, M.; Lee, U.; Wang, M.; Malina, R.; Valin, H.; Taheripour, F.; Velarde, C.; Staples, M.D.; Lonza, L.; Hileman, J.I. CORSIA: The first internationally adopted approach to calculate life-cycle GHG emissions for aviation fuels. Renew. Sustain. Energy Rev. 2021, 150, 111398. [Google Scholar] [CrossRef]
  31. World Economic Forum—McKinsey & Company. Clean Skies for Tomorrow Sustainable Aviation Fuels as a Pathway to Net-Zero Aviation. 2020. Available online: https://www.mckinsey.com/~/media/mckinsey/industries/travel%20transport%20and%20logistics/our%20insights/scaling%20sustainable%20aviation%20fuel%20today%20for%20clean%20skies%20tomorrow/clean-skies-for-tomorrow.pdf (accessed on 26 August 2022).
  32. Pavlenko, N.; Searle, S. Fueling flight: Assessing the Sustainability Implications of Alternative Aviation Fuels; International Council on Clean Transportation (ICCT): Washington, DC, USA, 2021. [Google Scholar]
  33. Pavlenko, N. An Assessment of the Policy Options for Driving Sustainable Aviation Fuels in the European Union; International Council on Clean Transportation (ICCT): Washington, DC, USA, 2021. [Google Scholar]
  34. Yáñez, É.; Meerman, H.; Ramírez, A.; Castillo, É.; Faaij, A. Assessing bio-oil co-processing routes as CO2 mitigation strategies in oil refineries. Biofuels Bioprod. Bioref. 2021, 15, 305–333. [Google Scholar] [CrossRef]
  35. Breuer, J.; Scholten, J.; Koj, J.; Schorn, F.; Fiebrandt, M.; Samsun, R.; Albus, R.; Görner, K.; Stolten, D.; Peters, R. An Overview of Promising Alternative Fuels for Road, Rail, Air, and Inland Waterway Transport in Germany. Energies 2022, 15, 1443. [Google Scholar] [CrossRef]
  36. ktalley. Implementing NATO’s Strategic Concept on China. Atlantic Council, 2 March 2023. Available online: https://www.atlanticcouncil.org/in-depth-research-reports/report/implementing-natos-strategic-concept-on-china/ (accessed on 22 April 2023).
  37. Transport & Environment. Briefing—Food not Fuel: Part Two: Vegetable Oils Are Being Burned in Cars Despite Empty Supermarket Shelves And Skyrocketing Prices. 2022. Available online: https://www.transportenvironment.org/wp-content/uploads/2022/06/Food-vs-Fuel_-Part-2_Vegetable-oils-in-biofuels.pdf (accessed on 1 April 2023).
  38. Transport & Environment. Briefing—10 Years of EU Fuels Policy Increased EU’s Reliance on Unsustainable Biofuel. 2021. Available online: https://www.transportenvironment.org/wp-content/uploads/2021/08/Biofuels-briefing-072021.pdf (accessed on 19 April 2023).
  39. Gupta, S.K. (Ed.) Breeding Oilseed Crops for Sustainable Production: Opportunities and Constraints; Academic Press: Amsterdam, The Netherlands, 2015; ISBN 978-0-12-801309-0. [Google Scholar]
  40. Havrysh, V.; Kalinichenko, A.; Pysarenko, P.; Samojlik, M. Sunflower Residues-Based Biorefinery: Circular Economy Indicators. Processes 2023, 11, 630. [Google Scholar] [CrossRef]
  41. Shams Esfandabadi, Z.; Ranjbari, M.; Scagnelli, S.D. The imbalance of food and biofuel markets amid Ukraine-Russia crisis: A systems thinking perspective. Biofuel Res. J. 2022, 9, 1640–1647. [Google Scholar] [CrossRef]
  42. International Civil Aviation Organization. Report on the Updated Long Term Traffic Forecasts. A40-WP/20. 2019. Available online: www.icao.int/Meetings/a40/Documents/WP/wp_020_en.pdf (accessed on 15 March 2023).
  43. European Enviornmental Agency. Municipal Waste Management in the Western Balkan countries. 2022. Available online: https://www.eea.europa.eu/publications/municipal-waste-management-in-western (accessed on 21 May 2023).
  44. König, D.H.; Baucks, N.; Dietrich, R.-U.; Wörner, A. Simulation and evaluation of a process concept for the generation of synthetic fuel from CO2 and H2. Energy 2015, 91, 833–841. [Google Scholar] [CrossRef] [Green Version]
  45. Almena, A.; Thornley, P.; Chong, K.; Röder, M. Carbon dioxide removal potential from decentralised bioenergy with carbon capture and storage (BECCS) and the relevance of operational choices. Biomass Bioenergy 2022, 159, 106406. [Google Scholar] [CrossRef]
  46. Larson, E.D.; Kreutz, T.G.; Greig, C.; Williams, R.H.; Rooney, T.; Gray, E.; Elsido, C.; Martelli, E.; Meerman, J.C. Design and analysis of a low-carbon lignite/biomass-to-jet fuel demonstration project. Appl. Energy 2020, 260, 114209. [Google Scholar] [CrossRef]
  47. Shehab, M.; Stratulat, C.; Ozcan, K.; Boztepe, A.; Isleyen, A.; Zondervan, E.; Moshammer, K. A Comprehensive Analysis of the Risks Associated with the Determination of Biofuels’ Calorific Value by Bomb Calorimetry. Energies 2022, 15, 2771. [Google Scholar] [CrossRef]
  48. Freire Ordóñez, D.; Halfdanarson, T.; Ganzer, C.; Shah, N.; Dowell, N.M.; Guillén-Gosálbez, G. Evaluation of the potential use of e-fuels in the European aviation sector: A comprehensive economic and environmental assessment including externalities. Sustain. Energy Fuels 2022, 6, 4749–4764. [Google Scholar] [CrossRef] [PubMed]
Figure 1. Criteria for SAF comparison.
Sustainability 15 09266 g001
Figure 2. Estimated SAF production based on the available feedstocks in the EU by 2030.
Sustainability 15 09266 g002
Figure 3. The potential of Biobased SAF to meet the EU targets in 2050.
Sustainability 15 09266 g003
Figure 4. A block diagram for the FT-SPK process.
Sustainability 15 09266 g004
Table 1. Shows the theoretical and actual available feedstocks in the EU in 2030 and 2050 [21,22,23,24].
Feedstock TypeTheoretical Available 2030 (Mt)Theoretical Available 2050 (Mt)Actual Available 2030 (Mt)
Waste oil and fats5.39.92.4
Organic fraction in MSW44–8033–6121.2
Agriculture residual45–6565–7187.7
Cover crops36–10842–127
Primary forest residual
Secondary forest residual
41–6845–755.1
89–12693–139
Table 2. A matrix for comparison for the different SAF pathways.
RoutesASTM ApprovedSupported by Mandates Max Drop In %TRL FRLCost of Production (§)Sustainability
gCO2e/MJ
FeedstockSAF Fraction %Geopolitical/Geographical ConcernsReferences
SAF Cost
Dollar/Tonne
CAPEX %OPEX %TypeAvailability (§§)Cost Range (§§§)
FT-SPK2009Yes50%6–87–81866–225068–8314–17%7.7–12.2Waste and biomass residues HighLow40–70%NO[26,30,31,32,33]
FT-SPK/A201550–100%
HEFA-SPK2011Only until 203050%7–991100–15507–1010–14%13.9–60Bio-oils, animal fat, Vegetable oils, UCO LowMed-High20–55%YES[26,30,31,32,33]
HFS-SIP2014Yes10%5–75–72100–2900N/AN/A32.4–32.8Sugarcane,
sugar beet
MedMed-High90–100%Yes[26,30,31,32,33]
ATJ- SPK2016Yes50%4–772100–290041–5631–45%23.8–65.7Sugarcane sugar beet sawdust
lignocellulosic residues (straw)
MedLow60–77%Yes[26,30,31,32,33]
Co-Processing Bio-Oils in Petroleum2018Yes5% N/AN/AN/AN/AN/AN/AFats, oils, and greases (FOG)LowMed-HighN/AYES[26,34]
CHJ-SKA2020Yes50–100%6–76 N/AN/AN/AN/ATriglycerides
such oils as soybean, jatropha and camelina Oil
LowMed-High33%YES[35]
HC- HEFA-SPK2020Yes10%46N/AN/AN/AN/AAlgaeN/AMed-HighN/ANO[35]
N/A refers to the lack of reliable data. § The CAPEX and OPEX are represented as a percentage of the total SAF cost per tonne. §§ The availability is described in three categories. High refers to enough available feedstocks; medium indicates average availability; and low refers to a limited feedstock. The data is based on Table 1 and Table 2. §§§ The feedstock cost is described in three categories. High refers to an expensive feedstock that lies in the range of USD 300–2000; medium indicates an average cost in the range of USD 200–1500; and low refers to a cheap feedstock in the range of USD 50–300. The range of costs provided is a rough value and not reliable data, as the prices change significantly depending on market stability and demand.
Table 3. The yield conversions for HEFA, FT-SPK, and ATJ [26,31].
ProcessFeedstock TypeLiquid Hydrocarbon Yield %SAF Fraction %
HEFAWaste FOGs9059
FT-SPKBio-based feedstocks2060
ATJBio-based feedstocks 1377
Disclaimer/Publisher’s Note: The statements, opinions and data contained in all publications are solely those of the individual author(s) and contributor(s) and not of MDPI and/or the editor(s). MDPI and/or the editor(s) disclaim responsibility for any injury to people or property resulting from any ideas, methods, instructions or products referred to in the content.

