Article

Does the Development of Digital Economy Affect Environmental Pollution?

1
School of Economics, Shenzhen University, Shenzhen 518055, China
2
China Center for Special Economic Zone Research, Shenzhen University, Shenzhen 518060, China
3
School of Business, Hunan University of Technology, Zhuzhou 412007, China
*
Author to whom correspondence should be addressed.
Sustainability 2023, 15(12), 9162; https://doi.org/10.3390/su15129162
Submission received: 10 May 2023 / Revised: 29 May 2023 / Accepted: 30 May 2023 / Published: 6 June 2023
(This article belongs to the Special Issue Digital Innovation for Sustainable Development)

Abstract

:
The development of digital economy (Dig) promotes the development of green economy and the progress of ecological civilization. Based on the panel data of China from 2010 to 2020, this paper constructs the relevant index system and analyzes the impact of the Dig on environmental pollution (EP) by using a variety of econometric models. Subsequently, combined with the transmission effect to discuss its influence mechanism, the spatial quantile regression was used to explore spatial effects. The Dig is conducive to reducing EP, and there is an inverted U-shaped relationship between the two. Meanwhile, its influence has obvious regional heterogeneity, and the inhibition effect of Dig on EP is better in technology-intensive areas. Dig can alleviate EP by promoting technological innovation and optimizing industrial structure, but resource allocation has not played a role. In addition, the Dig has a significant impact on the distribution of EP in the middle quantile, and there is a negative spatial spillover effect on EP. Consequently, the study puts forward some suggestions to alleviate pollution from the aspects of promoting technological innovation and improving resource allocation efficiency.

1. Introduction

China’s environmental situation is gloomy as the world’s greatest energy consumer and carbon emitter. As a consequence, we must apply new development ideas, prioritize the construction of an ecological civilization system, and stick to the green, circular, and low-carbon economic development road. Dig is a driving force for high-quality economic development. Meanwhile, it is conducive to the green transformation of economic development, strengthening the prevention and control of EP, and improving the system of ecological civilization [1,2]. New models and business models are emerging, bringing disruptive changes to the development of modern services, advanced manufacturing, new industries, and other industries. The development of Dig mainly affects pollution through enterprise production modes, government management systems, and environmental protection supervision mechanisms [3,4,5]. However, new models and business models are emerging, bringing disruptive changes to the development of modern services, advanced manufacturing, new industries, and other industries. The development of Dig mainly affects pollution through enterprise production modes, government management systems, and environmental protection supervision mechanisms [5,6,7,8]. However, the development of new generation information technology, artificial intelligence, supercomputers, and other digital technologies can improve innovation efficiency, reduce production and management costs, and promote the optimal allocation of production factors [9,10]. Therefore, exploring the impact of Dig development on EP and its mechanisms is of great research significance for improving the ecological environment and promoting green transformation and development of the economy.
Dig refers to a variety of economic activities that utilize digital technologies such as advanced knowledge, technology, and information to continuously optimize resource allocation and regeneration [11]. The relevant research on Dig mainly includes Dig and total factor productivity [12,13], green development [14,15], technological innovation, and industrial integration [9,10,16]. Advanced digital technology has gradually penetrated people’s daily lives, bringing great changes to production management and creating a broad space for digital transformation and industrial economic development [3,17]. There are many studies on the factors affecting environmental protection. The early research mainly focused on the level of economic development and EP. Grossman and Krueger [18] found an inverted U-shaped relationship between per capita income and pollution, and proposed the environmental Kuznets curve theory (EKC). Some scholars have researched the influences and paths of EP, energy conservation, and emission reduction from different perspectives, such as developing a green economy, environmental regulation, direct financing, population agglomeration, and technological innovation [19,20,21,22,23,24,25,26]. Some of the scholars have also discussed the relationship between EP and green total factor productivity (GTFP). On the one hand, the study found that environmental policy cannot promote the long-term sustainable increase of GTFP in industrial industries, but can increase the economic output of polluting industries by covering the cost of reducing emissions [27]. On the contrary, some studies have suggested that technological progress promoted the chemical industry to significantly increase GTFP after the implementation of the air pollution control plan [13,28]. However, research on the impact and mechanism analysis of the digital economy and environmental pollution in the existing literature is relatively rare. Consequently, there is currently little research concerning the way the digital economy affects environmental damage as a result. Analysis of its influence mechanism and particular effects is particularly unusual. However, the research literature on the effects of Dig on EP is relatively limited. Some scholars pay attention to the relationship between digital finance and the green economy, total factor productivity, and technological innovation. Most of the existing literature takes the Internet, big data, intelligent development, or digital finance as the entry point to analyze its impact on resource utilization and carbon emissions, but the Dig and further study of the influence of EP are relatively few.
In view of the gap in the existing literature, this paper aims to use a variety of econometric models to analyze the nonlinear effects of the digital economy on environmental pollution, and explore its impact mechanism and heterogeneity. Specifically, the main contributions of this study are as follows: First, on the basis of reasonable measurement of Dig, this article discusses the impact of Dig on EP and analyzes its impact mechanism. Second, this article verifies the nonlinear relationship between Dig and EP, and analyzes the heterogeneity from regional and industrial perspectives. Third, the spatial effects of Dig on EP are analyzed by using spatial quantile regression; furthermore, the nonlinear influence of digital economy on the discharge of sulfur dioxide, soot, and industrial wastewater is analyzed. It provides some new ideas and methods for promoting green economy development and environmental protection. Meanwhile, it provides reference for other countries to promote green, circular, and low-carbon development.
The structure of this article is as follows: Section 1 is the introduction. Section 2 is the literature review and presents the relevant theoretical analysis. Section 3 deals with the research design, including variable selection, data sources, and model construction. Then, Section 4 is the analysis of the empirical results, including the test of nonlinear relationship, robustness test, heterogeneity analysis, influence mechanism, spatial effect, and further discussion. Finally, Section 5 provides the conclusions and some policy recommendations.

2. Literature Review and Research Hypothesis

2.1. Digital Economy and Environmental Pollution

There is little literature on the relationship between the Dig and EP. Some scholars analyze the impact of digital finance, Dig and environmental regulation, and other factors on energy conservation and emissions reduction. Meanwhile, they find that intelligent transformation and digital inclusive finance can enhance the level of innovative undertakings and promote energy conservation and emission reduction [29,30,31,32]. Especially, scholars have combined digital technology content, such as the Internet of Things, cloud data, and artificial intelligence, to study the impact of EP. The information technology can improve the production efficiency of enterprises, reduce the waste of resources, and thus mitigate carbon emissions [16]. The improvement of internet technology changes people’s production and lifestyle, which is conducive to the coordinated development of carbon reduction, pollution reduction, green expansion, and the improvement of the ecological environment [33,34,35]. Apparently, digital technology, 5G, BDS, and artificial intelligence can help efficiently match demand information, optimize production scale and resource allocation, and improve resource integration, scientific decision-making, and environmental regulation capabilities [36,37,38,39], which provides a guarantee for enterprises to develop a green economy, residents to live healthy lives, and building a better ecological environment.
Dig alleviates EP mainly through developing new green production modes, improving production efficiency, optimizing industrial structure, ensuring rational allocation of resources, and optimizing governments’ environmental supervision systems. First of all, enterprises, as the main body of pollution control, rely on the advanced technology of Dig to effectively integrate various information resources in the production process and establish information sharing platforms. In this process, the efficient matching and optimal allocation of product, process, and resource information can improve production efficiency and reduce resource waste [40,41]. Secondly, with the continuous development of China’s economy, ecological environmental problems become more and more complex, and environmental regulation becomes more and more difficult. Dig provides strong development opportunities and technical support for the optimization of the government and public environmental regulation mode [42], which is conducive to improving the early warning and judgment ability of environmental pollution, strengthening the accuracy and effectiveness of government regulation, and improving the level of ecological environmental governance [43,44]. In addition, the Dig can strengthen the big data monitoring and resource sharing between the government and the social environment, provide more ways for the public to obtain environmental pollution-related information, and help citizens to enhance environmental awareness and practice the concept of green development [45], which helps to realize the dynamic assessment and supervision of EP, and provides support for the formulation of relevant policies to improve environmental quality. Finally, the collaborative governance among enterprises, the public, and government departments in the field of environmental supervision and management can be promoted by improving the digital communication and supervision mechanism and innovating government office channels [46,47,48]. Therefore, our first hypothesis is formulated.
Hypothesis 1.
Developing the Dig is beneficial for alleviating China’s EP situation.

2.2. Technological Innovation, Industrial Structure, Resource Allocation Efficiency and Environmental Pollution

This research analyzes the specific influence mechanism of Dig development on EP from three aspects: technological innovation, industrial structure, and resource allocation efficiency.
With the advent of the Dig era, data have become a key factor of production for economic growth and momentum transformation in the new era. Technological innovation is the driving force of economic development, and the information technology progress is the basis of promoting economic development and industrial integration [49,50,51]. Dig can make full use of advanced technologies to open up more development space, carry out digitalization and information transformation of all links of production, manufacturing, operation and services, and comprehensively improve the level of technological innovation [40,52,53], thus promoting the development of industrial networking, intelligence, and digitalization. The construction of digital technology platforms broadens the channels for technology spillovers, enables producers and consumers, as well as the upstream and downstream of the industrial chain, to share information resources, and improves the efficiency and quality of innovation [10]. The continuous development and application of advanced technologies can standardize production processes and develop new models of cleaner production, thus reducing the emission of pollutants in the production process and improving environmental quality [29,54]. Based on this, the paper proposes hypothesis 2.
Hypothesis 2.
The development of Dig reduces EP by promoting technological innovation.
The Dig is a new engine to upgrade the industrial structure, which is driven by digital industrialization, industrial digitization, and industrial integration. On the one hand, Dig can leverage the high permeability and strong diffusion of advanced technologies to guide the free flow of production factors in the production process and value chain and promote efficient cooperation between different regions and industries in the production process [55,56]. The Dig can decrease the cost of production management, improve production efficiency, change the consumption and demand structure of product markets, reduce resource waste, and improve EP [57,58,59]. On the other hand, the Dig means that the industrial structure is inclined from labor-intensive and capital-intensive industries to technology-intensive industries. In the process of industrial integration, new industries and new forms of business will emerge in the Dig, which will further promote the optimization and upgrading of industrial structure, and facilitate the development of green economy and high efficiency and low energy consumption industries [60,61,62]. Hence, the article proposes hypothesis 3.
Hypothesis 3.
Dig can improve EP by driving the optimization and upgrading of industrial structure.
Improving resource allocation efficiency is beneficial for reducing resource waste and alleviating EP. In today’s digital era, data resource has become the most important factor of production, due to its characteristics of replicability, mass access, and low cost. Advanced digital technology can realize data resource sharing and intelligent allocation to break the trap of diminishing marginal returns [63]. Integrating data factors into traditional factors of production brings the multiplier effect of production, promoting the rational allocation of resources, thereby reducing resource waste and promoting circular development [64]. In addition, the main source of various pollutants is the low efficiency of extensive production and resource utilization. However, digital resources can create more material wealth and corresponding high-quality services with fewer material resources. As a new model of green and sustainable economic development, Dig effectively promotes the spillover of knowledge and technology, improves the efficiency of resource allocation, and reduces undesirable output and environmental pollutants [52,65]. Therefore, the thesis proposes hypothesis 4.
Hypothesis 4.
The development of Dig helps to reduce EP by improving the efficiency of resource allocation.

2.3. Spatial Impact of Digital Economy on Environmental Pollution

The Dig can generate knowledge spillover and technology spillover beyond the limitations of geography, time, and space. More advanced technologies and innovative achievements realize data sharing and spillover, diffusing effects through virtual agglomeration of the information technology network space, and enhance the correlation of economic activities between regions, thereby reducing production costs and improving productivity [66,67]. Furthermore, geographical proximity is conducive to the circulation and dissemination of factor resources, such as digital technology, innovative resources, advanced knowledge, and human capital among different regions, and promotes the integration and coordination of Dig and its related industries. The rapid application of Dig and the formation of industrial agglomeration and cluster development are conducive to Dig industries in this region. Meanwhile, the Dig will also radiate and affect the development of digital industry and EP in surrounding regions [68]. Furthermore, some scholars have demonstrated the spatial spillover effect of Dig, such as informatization, Internet development, and big data [69]. Moreover, the mutual sharing of environmental monitoring data resources can achieve collaborative governance across regions, which is beneficial for resource conservation and alleviating environmental pressure [37,70]. Consequently, the thesis proposes hypothesis 5.
Hypothesis 5.
Dig can affect EP in surrounding areas through spatial spillover effects.

3. Research Design

3.1. Variable Selection

3.1.1. Explained Variable

Environmental pollution (EP). Some studies show that sulfur dioxide, industrial soot, and wastewater discharge will directly affect people’s health and EP [44,71]. In this paper, the above three indexes and entropy weight method are selected to measure the EP status. 
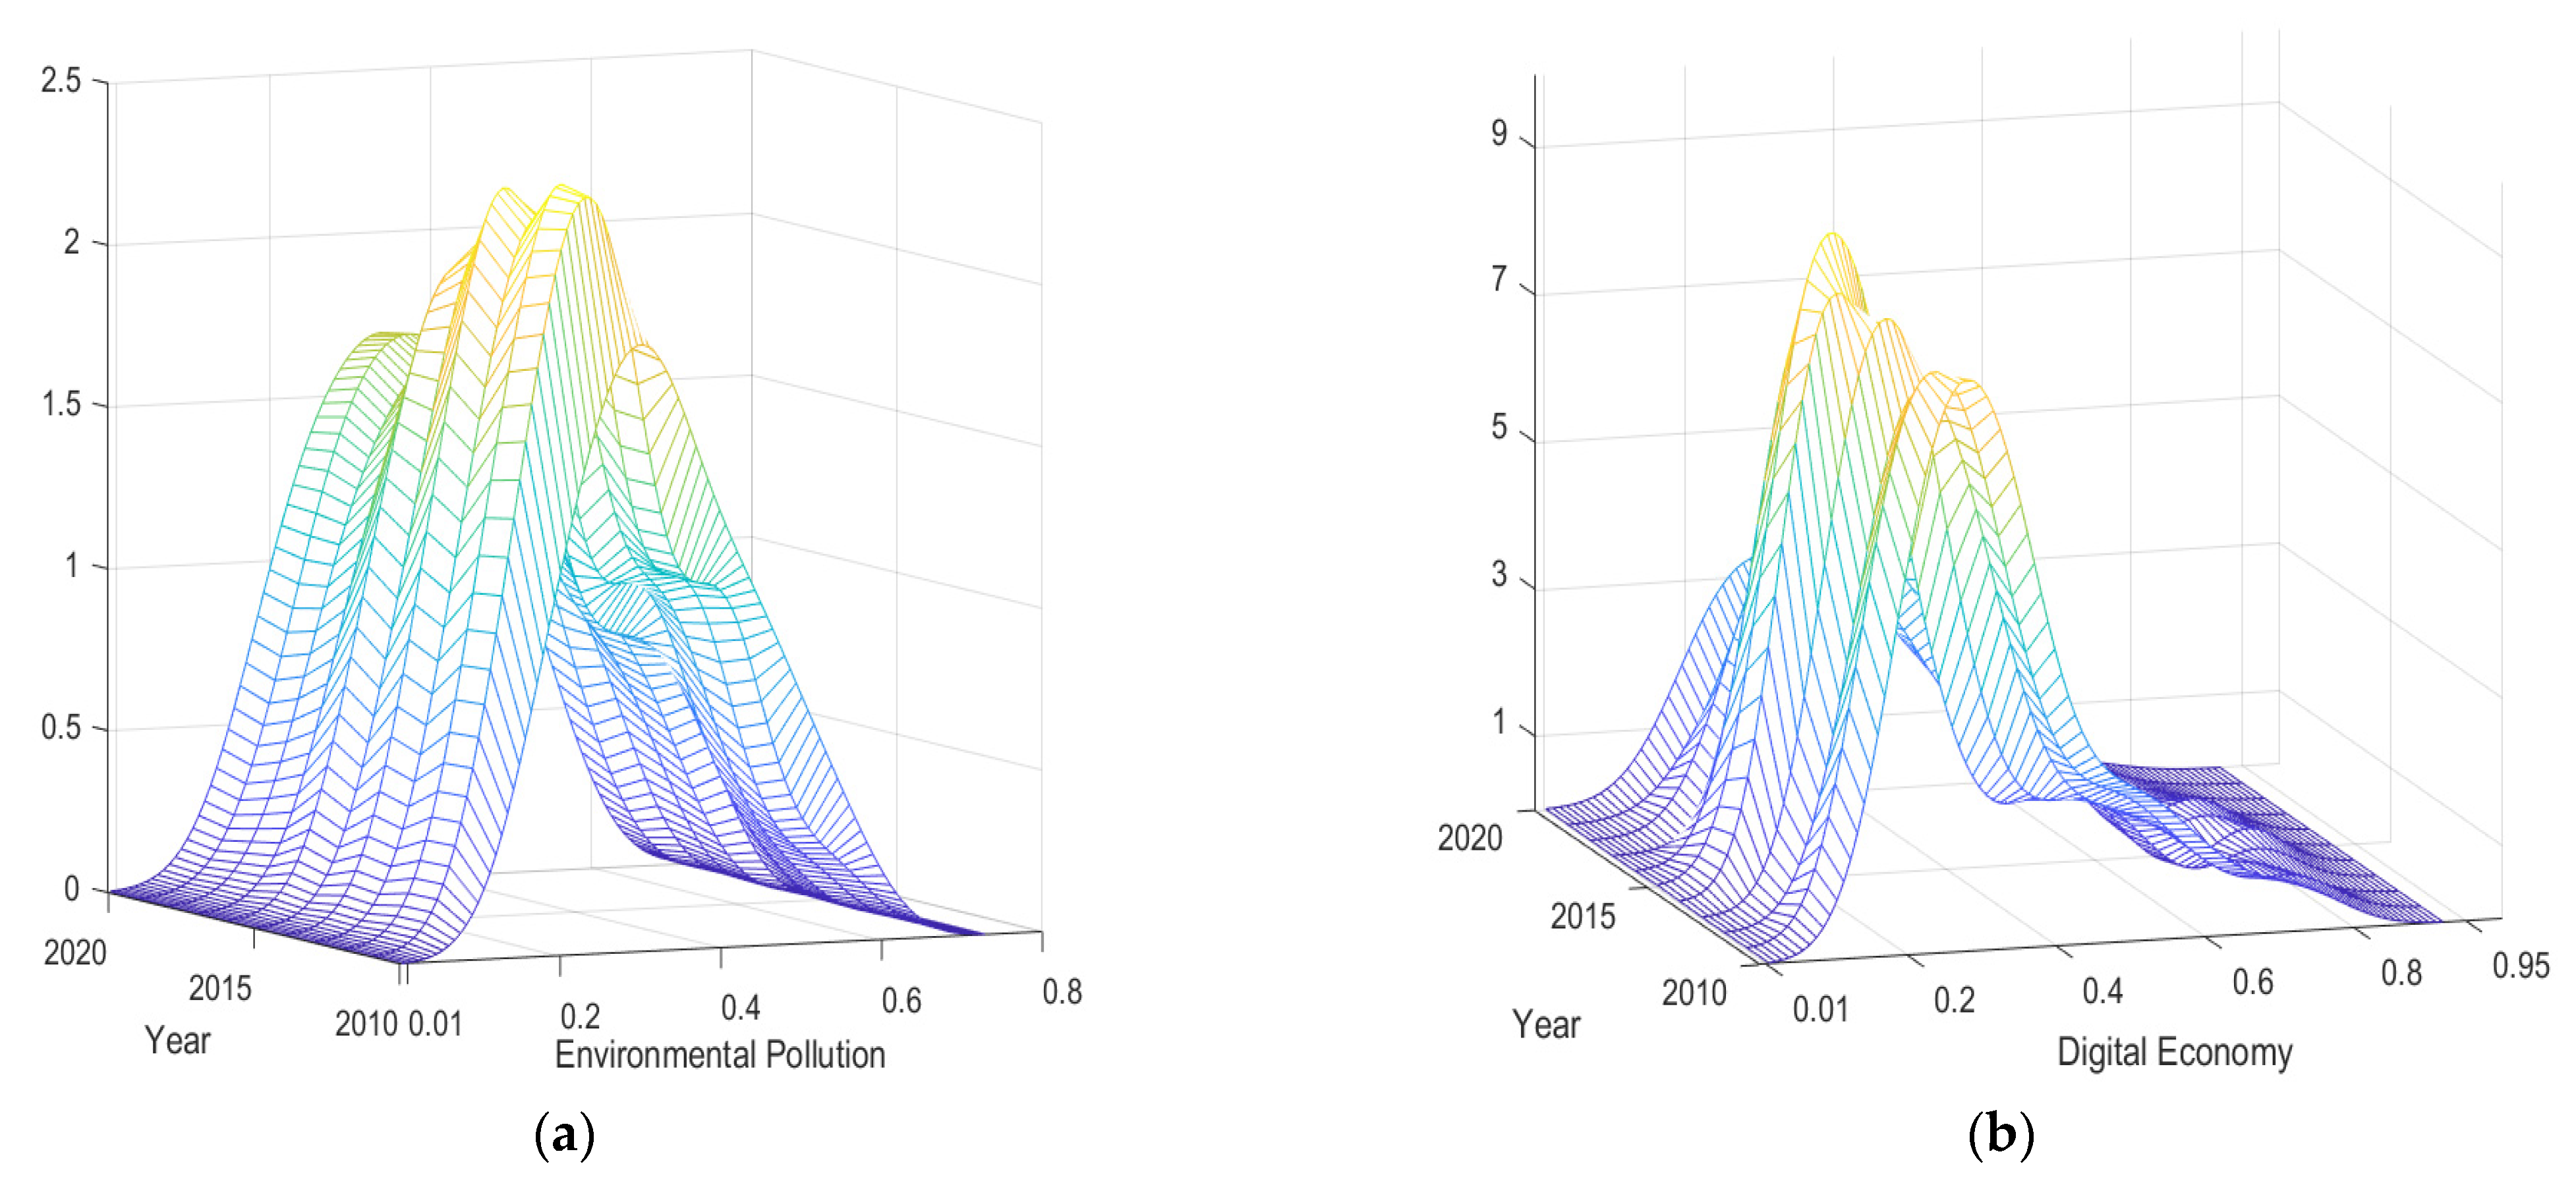
Figure 1 shows the dynamic evolution trend of EP from 2010 to 2020. The central position of the nuclear density distribution curve gradually moves to the right, which means that the overall situation of EP in China has become serious. The distribution pattern of EP in China showed a trend of multi-peak development from 2011 to 2018, with the main peak becoming larger and the slope becoming steeper, indicating that the absolute difference of EP in different regions was expanding. However, from 2018 to 2020, the peak value of pollution distribution became smaller and presented as unimodal. This indicates that the EP situation was improved, and the polarization development phenomenon was alleviated to a certain extent.

3.1.2. Main Explanatory Variable

Combined with the concept of the digital economy (Dig) and the availability of data, the evaluation index system was constructed by selecting the Internet penetration rate, the number of access ports, the number of domain names, the proportion of Internet employees, the total amount of telecom business per capita, the proportion of e-commerce and software business in Gross Domestic Product (GDP), and the Digital Inclusive Finance Index from the industrial development environment, digital industrialization, industrial digitization, fundamentals of digital industry development, and other dimensions [16,22], to calculate the level of Dig in all regions of China.
As can be seen from the Figure 1: First, the center of distribution keeps moving to the right, which means that the development level of the Dig is on the rise. Second, it shows a trend of right-trailing, indicating that there are large differences in Dig between regions. Thirdly, since 2011, the distribution of Dig has shifted from a single peak to multiple peaks, and the span of peaks has gradually increased. It can be seen that the Dig has a trend of multi-polarization, and the development gap between regions is increasing. Hence, generally speaking, the development level of China’s Dig is constantly improving, and there are obvious differences between different regions.

3.1.3. Control Variables

The level of economic development (egdp) is expressed using the logarithm of GDP per capita [68,72]; Grossman and Krueger found an inverted U-shaped relationship between economic development level and EP, according to the EKC theory [18]. Therefore, the quadratic form of economic development level was considered (egdp2). Opening to the outside world (open) can bring in advanced technology and talents and reduce the cost of production and operation. This article is expressed by the proportion of foreign investment to GDP [52,73]. High levels of human capital (hc) mean that administrative costs are likely to be reduced, as reflected in the ratio of the number of students with a university degree or above to the number of employees [40]. Transport facilities (trf) use a logarithmic measure of highway length per capita [74]. Government intervention (gov) is directly related to the independent initiative of the government, enterprises, and people to protect the environment in their daily life. It is measured by the proportion of government fiscal expenditure to GDP [75].

3.1.4. Mechanism Variables

Technological innovation (inn): The development of Dig is helpful to effectively improve the efficiency and ability of technological innovation, thus helping to alleviate environmental stress. The logarithm of sales revenue of new product is taken as the output index to measure technological innovation [14,29]. Industrial structure (ins) Dig promotes the development of green economy by promoting the transformation and upgrading of industrial association and industrial structure. The ratio of the value added from the tertiary industry to GDP is used to measure the change of industrial structure [76,77]. Asset allocation efficiency (aae): The application and development of digital technology can help optimize the allocation of resources, improve the utilization efficiency, and then reduce the waste of resources. It is expressed by the proportion of fixed asset investment in the tertiary industry and the added value of the tertiary industry [37,78].

3.2. Data Source

We used panel data of 30 Chinese provinces from 2010 to 2020 (excluding Tibet, Hong Kong, Macao, and Taiwan). Relevant data were obtained from the China Statistical Yearbook, China Environmental Statistical Yearbook, China Industrial Economic Statistical Yearbook, China Tertiary Industry Statistical Yearbook, China Energy Statistical Yearbook, Internet Finance Research Center of Peking University, Official Website of the National Bureau of Statistics, and statistical yearbooks of provinces and cities.

3.3. Model Setting

The following panel model is established to study the impact of Dig development on EP:
E P i t = α + α 1 D i g + α 2 X i t + μ i + δ t + ϵ i t
E P i t = α + α 1 D i g + α 2 ( D i g i t ) 2 + α 3 X i t + μ i + δ t + ϵ i t
According to theoretical analysis, Dig may affect EP through indirect effects, such as technological innovation, industrial structure optimization, and resource allocation efficiency improvement. Therefore, the transmission effect model is established to analyze its influence mechanism:
M i t = β + β 1 D i g i t + β 2 X i t + μ i + δ t + ϵ i t
E P i t = γ + γ 1   M i t + γ 2 X i t + μ i + δ t + ϵ i t
Considering that the Dig may have spatial effects on EP, it is necessary to predict the estimated value W*Y first. Then, this paper analyzes its spatial effect by means of spatial quantile regression, as shown below:
E P i t = σ + σ 1 D i g i t + σ 2 ( D i g i t ) 2 + σ 3 X i t + μ i + δ t + ϵ i t
E P i t = σ + ρ W E P i t + σ 1 D i g i t + σ 2 ( D i g i t ) 2 + σ 3 X i t + μ i + δ t + ϵ i t
W 1 =   d i j d i a g ( y 1 ¯ y ¯ , y 2 ¯ y ¯ , , y n ¯ y ¯ )
W 2 = d i j = { 0 , d i j < d 1 d i j 2 , d i j d
E P i t represents the EP of region i in the period t. α 1 ,   β 1 ,   γ 1 ,   σ 1 , respectively, represent the regression coefficient. X i t is the control variable, η i is the individual fixed effect, δ t is the time fixed effects, ϵ i t is the random disturbance term, i is the sample, and t is the time. D i g i t stands for Dig, M i t represents the mechanism variable. Meanwhile, W 1 , W 2 are the economic and geospatial spatial weight matrix, W E P i t represents the spatial lag term, and ρ is the spatial lag coefficient. In the formula, y ¯ i represents the average GDP of region i during the sample period, y ¯ is the mean value of the national GDP during the observation period, and d i a g represents the diagonal matrix.

4. Empirical Analysis

4.1. Benchmark Regression

First, a collinearity test is performed to exclude the effects of multicollinearity. The Levin, Lin, and Chu (LLC) test and the Im, Pesaran, and Shin (IPS) test found that economic development level, human capital, and related variables all meet the requirements of regression analysis. In addition, considering that there may be some objective uncontrollable factors in different regions and years, this thesis studies whether the development of Dig has alleviated EP under the premise of controlling individual fixed effects and time fixed effects, as shown in Table 1.
Due to the Hausman test, finding that the fixed effects model is superior to the random effects model, the fixed effects model was chosen for analysis. The regression results of columns (1) and (2) both show that the regression coefficient for the development of the Dig is negative and significant at a significance level of 1%; the coefficient of the Dig is −2.253, indicating that the development of the Dig has an inhibitory effect on EP, which is consistent with the conclusion of Zou and Pan [70]. At the same time, hypothesis 1 is also verified. However, columns (3) and (4) are quadratic terms of Dig, and it is found that the regression coefficients of Dig and its quadratic forms are both significant and have different symbols, indicating that the impact of Dig development on EP is not a simple linear relationship, which is similar to the conclusion of Ma and Xu [79]. Additionally, the coefficients of egdp and egdp2 are 3.076 and −2.767, respectively, and both are significant. This result means that, with the improvement of the economic level, the degree of pollution increases, but when the economic level reaches a certain degree, the EP will gradually improve and reduce. The possible explanation is that, when the economy reaches a certain level of development, the investment in environmental protection is large, the participation enthusiasm is strong, the waste disposal is relatively scientific, and the enterprise restraint and supervision mechanism is relatively sound. Therefore, EP has been alleviated to a certain extent. Furthermore, the coefficients of opening to the outside and human capital are both significantly negative, indicating that they have significant inhibitory effect on EP. The regression coefficient of government intervention is negative, indicating that government intervention helps to enhance citizens’ environmental awareness and establish the concept of green development. Traffic facilities have no significant impact on EP.
The baseline regression analysis found that the impact of Dig on EP may be non-linear. In order to accurately judge the existence of an inverted U-shaped relationship, the nonlinear relationship between Dig and EP was tested by the U-test [80]. According to the test results, the extreme value point of the Dig is 0.6338, and the extreme value is within the value range of the Dig [0.0135, 0.9022], and the null hypothesis can be rejected at the 5% statistical level. At the same time, the slope of the result has a negative sign in the interval. It can be seen that the inverted U-shaped relationship between the development of Dig and EP has been verified.

4.2. Robustness Test

In order to alleviate the endogenous problems, the development level of Dig lagging behind one stage is tested again. Then, according to the research methods of Nunn and Qian [81], the interaction terms between the number of fixed telephones (per 100 people), the number of post offices in 1984 (per 1 million people) and the number of Internet users in the previous year are constructed as instrumental variables, and the validity of the instrumental variables is verified through the K-P Wald F test and the LM test. Meanwhile, the Dig replaces the Digital Inclusive Finance Index as the explanatory variable, the results of which are shown in Table 2.
It can be seen from columns (5) to (8) that the primary coefficient of the Dig is positive, while the secondary coefficient is negative, and both have passed the 1% significance test. The results show that the non-linear impact of the Dig on EP is still significant, which is consistent with the previous conclusion. In addition, according to the developmental course of Dig, the research samples are divided into two stages, 2010–2015 and 2016–2020, respectively, for regression. In columns (9) and (10), the coefficients of the Dig are 3.065 and 3.351, respectively, and are significant at the level of 5%, while the quadratic coefficients are negative and significant. It is indicated that the impact of Dig development on EP is an inverted U-shape, and the results are still robust.

4.3. Heterogeneity Analysis

Considering the characteristics of regional imbalance in China’s economic development, the whole sample is divided into eastern, central, and western regions for sub-regional analysis, and the results are summarized in Table 3. The regression results of columns (11) and (12) show that the coefficients of the Dig and its quadratic coefficients in the eastern and central regions are different signs, and significant at the 5% level, while the digital economic coefficients in the western region are not significant. The result explains that the impact of Dig on EP has significant regional heterogeneity, and the inhibition effect of Dig on EP in the eastern region is significantly higher than that in other regions. This may be related to regional industrial development foundation, technological innovation, industrial structure optimization, and rational allocation efficiency of resources. Furthermore, according to the level of industrial structure, China’s regions were divided into technology-intensive and non-technology-intensive areas for analysis. It can be seen from columns (14) and (15) that the Dig development in technology-intensive areas has a significant impact on EP, while the impact on non-technology-intensive areas is not significant. The possible explanations are related to the differences in Dig development and application levels, the degree of science and technology informatization, and industrial optimization and upgrading.

4.4. Influence Mechanism Analysis

In order to explore the specific impact mechanism of Dig development on EP, we established a transmission effect model to analyze the impact of Dig on EP through three aspects: technological innovation effect, industrial structure effect, and resource allocation effect. The results are summarized in Table 4. Among them, the regression coefficients of columns (16), (18), and (20) are 3.433, 2.237, and 0.749, respectively, and are significant at the 1% level. This indicates that the Dig has promoted technological innovation and optimized industrial structure and rational allocation of resources. Further, the degree of impact of technological innovation is greater than that of industrial structure and resource allocation. Meanwhile, the coefficients of column (17) and (19) are negative and significant, indicating that technological innovation and industrial structure optimization have an inhibitory effect on EP. The research from columns (16) to (19) show that the development of the Dig has alleviated EP by promoting technological innovation and optimizing industrial structure, and the impact of technological innovation is greater than that of industrial structure. Therefore, hypothesis 2 and hypothesis 3 were also tested. From the analysis of the results in (20) and (21), it can be seen that the Dig has promoted the optimal allocation of resources, but has no impact on EP. Thus, hypothesis 4 was not supported. This may be related to the low utilization rate of production factors and the inaccurate matching of resource information in China.

4.5. Spatial Impact Analysis

4.5.1. Spatial Autocorrelation Analysis

Whether there is a spatial correlation between the Dig and EP, the global autocorrelation index of each province in China is calculated using the Moran’s I index method. Subsequently, the spatial autocorrelation analysis is carried out.
The Moran index formula of global space autocorrelation test is as follows:
I = i = 1 n j = 1 n w i j   ( x i x ¯ )   ( x j x ¯ ) S 2   i = 1 n j = 1 n w i j
Among them, S 2 is the variance of the sample; x ¯ represents the mean; i = 1 n j = 1 n ;   w i j represents the space weight matrix, and the value range is [−1, 1].
The results show that the Moran’s I index of data economy development and EP both show an upward trend through the significance test, showing a strong spatial positive correlation. In addition, the Moran’s I index of EP in each province and city in China from 2010 to 2020 was measured, and the mean value was 0.473. The spatial distribution is shown in Figure 2. Only one third were lower than the average level, and they were mainly concentrated in the southeast, indicating that China’s overall EP was serious, and the environmental situation was unbalanced among regions.

4.5.2. Spatial Effect Analysis

This paper further uses spatial quantile regression analysis. The fixed effect model was selected according to the Hausman test, and the representative quantiles of 10%, 25%, 50%, 75%, 80%, and 95% were used. The spatial impacts of different levels of Dig on EP are analyzed and summarized in Table 5. The results show that the regression coefficients of Dig are all positive at different quantile levels, and, with the increase of quantile level, the Dig effect on EP becomes more and more significant. The quadratic coefficients of Dig are all negative, and most of them pass the significance test of more than 5%, with the maximum coefficient being −1.712, which is located in the 50% quantile. This shows that the Dig economy has a more significant impact on the distribution of EP at the middle quantile level. Moreover, with the increase of quantile level, the mitigation effect of economic development level on EP becomes significant, and its maximum coefficient is −1.961, which is located at the 75% quantile. The inhibitory effects of opening to the outside world, human capital, and government intervention on EP also become more significant with the change of quantile level.
In addition, the spatial lag coefficient of EP is significantly positive. With the increase of the quantile level, the coefficient showed a trend of first increasing, then decreasing, and then increasing again, and the maximum coefficient was 2.152 at the 80% quantile. At this time, the spatial effect between Dig and EP in neighboring areas is the most significant. This indicates that pollution in the region is affected not only by the development of digital technology in the region, but also by spillover effects from surrounding areas. However, the coefficient of the spatial lag term cannot be directly used to analyze the spatial spillover effect of Dig on EP, because point regression analysis will produce the wrong estimation of the spatial spillover effect between regions. Therefore, the spatial spillover effect is decomposed by the partial differential method of Pace and Lesage [82]; two spatial matrices were used for analysis, and the decomposition results are shown in Table 6. It can be found that the direct effects and indirect effects of Dig on EP are negative and significant at the 1% level. Consequently, Dig has a negative spatial spillover effect on EP in neighboring areas. Therefore, hypothesis 5 is validated.

4.6. Further Discussion

In order to more clearly analyze the specific impact of Dig on EP in sulfur dioxide (so2), industrial soot (smoke), and industrial wastewater (water) discharge, the indicators were decomposed, and spatial quantile regression analysis was conducted respectively (see Table 7). The results show that there is still a significant inverted U-shaped relationship between the Dig and sulfur dioxide and soot emissions. With the increase of the quantile level, the effect becomes significant, and the coefficient reaches the maximum when the quantile level is 50% and 75%, respectively. The results show that the development of Dig can help reduce sulfur dioxide emission, and the maximum coefficient of effect is −2.512. The mitigation effect of Dig development on soot emission is relatively obvious at the 75% quantile. However, Dig and wastewater discharge show a positive U-shaped relationship, most of its coefficients pass the significance test of 5%, and the quadratic coefficient reaches the maximum value of 3.312, which is located at the 50% quantile. This means that Dig has a significant impact on the distribution of industrial wastewater at the middle quantile level. In addition, through the analysis of the two spatial matrices, it can be found that the direct and indirect effects of Dig on sulfur dioxide, soot, and industrial wastewater are negative and significant at the level of 1%. It shows that the development of Dig can significantly reduce the discharge of sulfur dioxide, soot, and industrial wastewater in this region, and indirectly affect the EP in neighboring areas. The reason may be the discharge of sulfur dioxide, soot, and industrial wastewater in neighboring areas through spatial spillover effect. However, the growth of the digital economy may result in the creation of new business models and industrial economies. Their enormous demand for electricity and information technology will also have unanticipated environmental consequences. We will undertake additional study in the future.

5. Conclusions and Suggestions

The paper establishes an index system to estimate the development level of Dig in Chinese provinces and cities during 2010–2020, and empirically analyzes the influencing mechanisms and spatial effects of Dig on EP. Based on the research findings, this paper proposes countermeasures and suggestions.

5.1. Conclusions

The results indicate that: (1) Dig development can reduce EP, and there is an inverted U-shaped relationship between the two. Meanwhile, the robustness tests and instrumental variable methods still support these conclusions; (2) The impact of Dig development on EP shows obvious regional heterogeneity, and the inhibition effect of Dig on EP in eastern China is obviously higher than that in other regions. Additionally, the inhibition effect of the development of Dig on EP is more obvious in technology-intensive areas; (3) The analysis of influence mechanisms found that the development of Dig alleviates EP by promoting technological innovation and industrial structure optimization. However, the Dig has promoted the optimal allocation of resources, but has not played a role in EP; (4) With the improvement of the quantile level, the impact of Dig development on EP has become significant. Meanwhile, the development of Dig has a more obvious impact on the areas where EP is distributed in the middle quantile. Further discussion shows that Dig still has a significant inverted U-shaped relationship with sulfur dioxide and soot emissions, and a positive U-shaped relationship with wastewater emissions. Moreover, Dig has a negative spatial spillover effect on EP.

5.2. Suggestions

First, it is necessary to attach importance to the construction and improvement of Dig, information technology, and Internet infrastructure. The government should build new information technology development centers and information technology sharing platforms, vigorously develop new advantages of the new generation of information technology, strengthen policy support and management, and constantly improve the level of Dig. Besides, the government should formulate reasonable policies related to supporting subsidies, tax incentives, and the introduction of high-tech talents, establish a sound high-quality economy development system, deepen and accelerate the development of Dig, promote green economic development, and improve ecological progress.
Second, we should implement a differentiated industrial development strategy. Combined with the economic foundation, resource endowment, and industrial structure characteristics of each region, we should fully leverage the comparative advantages of various regions and formulate a gradient, differentiation, and dynamic digital industry development strategy. The advantages of industrial resources, upstream and downstream industrial chains, and information platform sharing in the region and surrounding areas should be utilized according to local conditions. Furthermore, through spatial spillover and radiation effects, the integrated and collaborative development of Dig and related industries in surrounding areas can be driven, thus improving production efficiency and promoting the transformation and upgrading of industrial structure.
Third, we need to leverage the new advantages of the Dig, enhance research and development innovation capabilities, and promote green and circular economic development. On the one hand, the government needs to encourage and support brick-and-mortar enterprises to enhance their technological innovation capabilities and strengthen green innovation. In this process, enterprises, the government, and the public should cultivate the awareness of green environmentalism, optimize the management system, improve the relevant mechanisms and systems of environmental management, and reduce the generation of pollution sources. On the other hand, the depth and breadth of the digital industry should be further expanded in more areas, so as to promote the deep integration of the Dig and the real economy and improve the efficiency of resource utilization, improve the utilization rate, production efficiency and allocative efficiency of various production factors, give play to the effect of pollution reduction, and reduce EP.
Finally, we need to accelerate the development of a China which is strong in manufacturing, strong in quality, and strong in cyberspace and digital, and provide new ideas and methods for promoting green economic development and building a beautiful China. At the same time, this study can provide a reference for other countries to develop a green economy and improve their environmental protection systems.
The limitation of this paper is the availability of data. Using provincial data to study Dig may be macro, but it is limited by micro-level data. Future research should focus on using urban and enterprise data to analyze the regional differences and spatial convergence of Dig and EP from a micro perspective, as well as in-depth analysis of nonlinear effects.

Author Contributions

Conceptualization, X.Z. and J.Z.; methodology, X.Z.; software, X.Z.; validation, X.Z., J.Z. and H.W.; formal analysis, X.Z.; investigation, X.Z.; resources, X.Z.; data curation, J.Z.; writing—original draft preparation, X.Z.; writing—review and editing, X.Z. and J.Z.; visualization, J.Z.; supervision, H.W.; project administration, H.W.; funding acquisition, J.Z. and H.W. All authors have read and agreed to the published version of the manuscript.

Funding

This research was funded by the “National Social Science Fund of China (Grant Number: 20BJY093) and (Grant Number: 18BKS059)”.

Institutional Review Board Statement

Not applicable.

Informed Consent Statement

Not applicable.

Data Availability Statement

The datasets used and analyzed during the current study are available from the corresponding author on reasonable request.

Conflicts of Interest

The authors declare no conflict of interest.

References

  1. Zhang, W.; Zhao, S.Q.; Wan, X.Y.; Yao, Y. Study on the effect of digital economy on high-quality economic development in China. PLoS ONE 2021, 16, e0257365. [Google Scholar] [CrossRef]
  2. Moyer, J.D.; Hughes, B.B. ICTs: Do they contribute to increased carbon emissions? Technol. Forecast. Soc. 2012, 79, 919–931. [Google Scholar] [CrossRef]
  3. Cui, L.; Hou, Y.; Liu, Y.; Zhang, L. Text mining to explore the influencing factors of sharing economy driven digital platforms to promote social and economic development. Inform. Technol. Dev. 2021, 27, 779–801. [Google Scholar] [CrossRef]
  4. Shapiro, J.S.; Walker, R. Why Is Pollution from US Manufacturing Declining? The Roles of Environmental Regulation, Productivity, and Trade. Am. Econ. Rev. 2018, 108, 3814–3854. [Google Scholar] [CrossRef] [Green Version]
  5. Zhang, C.H.; Liu, H.Y.; Bressers, H.T.A.; Buchanan, K.S. Productivity growth and environmental regulations—Accounting for undesirable outputs: Analysis of China’s thirty provincial regions using the Malmquist-Luenberger index. Ecol. Econ. 2011, 70, 2369–2379. [Google Scholar] [CrossRef]
  6. Yang, Z.B.; Fan, M.L.; Shao, S.; Yang, L.L. Does carbon intensity constraint policy improve industrial green production performance in China? A quasi-DID analysis. Energ. Econ. 2017, 68, 271–282. [Google Scholar] [CrossRef]
  7. Hering, L.; Poncet, S. Environmental policy and exports: Evidence from Chinese cities. J. Environ. Econ. Manag. 2014, 68, 296–318. [Google Scholar] [CrossRef]
  8. Li, P.; Lu, Y.; Wang, J. Does flattening government improve economic performance? Evidence from China. J. Dev. Econ. 2016, 123, 18–37. [Google Scholar] [CrossRef]
  9. Wu, J.; Wu, Z.F.; Si, S. The influences of Internet-based collaboration and intimate interactions in buyer-supplier relationship on product innovation. J. Bus. Res. 2016, 69, 3780–3787. [Google Scholar] [CrossRef]
  10. Yunis, M.; Tarhini, A.; Kassar, A. The role of ICT and innovation in enhancing organizational performance: The catalysing effect of corporate entrepreneurship. J. Bus. Res. 2018, 88, 344–356. [Google Scholar] [CrossRef]
  11. Mirolyubova, T.V.; Karlina, T.V.; Nikolaev, R.S. Digital Economy: Identification and Measurements Problems in Regional Economy. Ekon. Reg. 2020, 16, 377–390. [Google Scholar] [CrossRef]
  12. Lyu, Y.; Wang, W.; Wu, Y.; Zhang, J. How does digital economy affect green total factor productivity? Evidence from China. Sci. Total. Environ. 2023, 857 Pt 2, 159428. [Google Scholar] [CrossRef]
  13. Zhao, C.Y.; Liu, Z.Q.; Yan, X.F. Does the Digital Economy Increase Green TFP in Cities? Int. J. Env. Res. Public Health 2023, 20, 1442. [Google Scholar] [CrossRef]
  14. Ma, D.; Zhu, Q. Innovation in emerging economies: Research on the digital economy driving high-quality green development. J. Bus. Res. 2022, 145, 801–813. [Google Scholar] [CrossRef]
  15. Tang, R. A study of the effects and mechanisms of the digital economy on high-quality tourism development: Evidence from the Yangtze River Delta in China. Asia Pac. J. Tour. Res. 2022, 27, 1217–1232. [Google Scholar] [CrossRef]
  16. Zhang, J.; Lyu, Y.; Li, Y.; Geng, Y. Digital economy: An innovation driving factor for low-carbon development. Environ. Impact. Asses. 2022, 96, 106821. [Google Scholar] [CrossRef]
  17. Song, M.L.; Zheng, C.B.; Wang, J.Q. The role of digital economy in China’s sustainable development in a post-pandemic environment. J. Enterp. Inf. Manag. 2022, 35, 58–77. [Google Scholar] [CrossRef]
  18. Grossman, G.M.; Krueger, A.B. Economic-Growth and the Environment. Q. J. Econ. 1995, 110, 353–377. [Google Scholar] [CrossRef] [Green Version]
  19. Smulders, S.; Bretschger, L.; Egli, H. Economic Growth and the Diffusion of Clean Technologies: Explaining Environmental Kuznets Curves. Environ. Resour. Econ. 2011, 49, 79–99. [Google Scholar] [CrossRef] [Green Version]
  20. Levinson, A. Technology, International Trade, and Pollution from US Manufacturing. Am. Econ. Rev. 2009, 99, 2177–2192. [Google Scholar] [CrossRef] [Green Version]
  21. Milani, S. The Impact of Environmental Policy Stringency on Industrial R&D Conditional on Pollution Intensity and Relocation Costs. Environ. Resour. Econ. 2017, 68, 595–620. [Google Scholar]
  22. Wang, C.G.; Liu, T.S.; Zhu, Y.; Lin, M.; Chang, W.H.; Wang, X.Y.; Li, D.R.; Wang, H.; Yoo, J. Digital Economy, Environmental Regulation and Corporate Green Technology Innovation: Evidence from China. Int. J. Env. Res. Public Health 2022, 19, 14084. [Google Scholar] [CrossRef] [PubMed]
  23. Zhou, K.L.; Yang, S.L.; Shen, C.; Ding, S.; Sun, C.P. Energy conservation and emission reduction of China’s electric power industry. Renew. Sust. Energ. Rev. 2015, 45, 10–19. [Google Scholar] [CrossRef]
  24. Bauman, Y.; Lee, M.; Seeley, K. Does technological innovation really reduce marginal abatement costs? Some theory, algebraic evidence, and policy implications. Environ. Resour. Econ. 2008, 40, 507–527. [Google Scholar] [CrossRef]
  25. Aguilera-Caracuel, J.; Ortiz-de-Mandojana, N. Green Innovation and Financial Performance: An Institutional Approach. Organ. Environ. 2013, 26, 365–385. [Google Scholar] [CrossRef]
  26. Aldieri, L.; Vinci, C.P. The Role of Technology Spillovers in the Process of Water Pollution Abatement for Large International Firms. Sustainability 2017, 9, 868. [Google Scholar] [CrossRef] [Green Version]
  27. Yuan, B.L.; Ren, S.G.; Chen, X.H. Can environmental regulation promote the coordinated development of economy and environment in China’s manufacturing industry?—A panel data analysis of 28 sub-sectors. J. Clean. Prod. 2017, 149, 11–24. [Google Scholar] [CrossRef]
  28. Zhang, Y.J.; Song, Y.; Zou, H. Transformation of pollution control and green development: Evidence from China’s chemical industry. J. Environ. Manag. 2020, 275, 111246. [Google Scholar] [CrossRef]
  29. Wang, X.T.; Luo, Y. Has technological innovation capability addressed environmental pollution from the dual perspective of FDI quantity and quality? Evidence from China. J. Clean. Prod. 2020, 258, 120941. [Google Scholar] [CrossRef]
  30. Chishti, M.Z.; Sinha, A. Do the shocks in technological and financial innovation influence the environmental quality? Evidence from BRIGS economies. Technol. Soc. 2022, 68, 101828. [Google Scholar] [CrossRef]
  31. Du, M.Y.; Hou, Y.F.; Zhou, Q.J.; Ren, S.Y. Going green in China: How does digital finance affect environmental pollution? Mechanism discussion and empirical test. Environ. Sci. Pollut. R 2022, 29, 89996–90010. [Google Scholar] [CrossRef] [PubMed]
  32. Li, G.X.; Zhang, R.; Feng, S.L.; Wang, Y.Q. Digital finance and sustainable development: Evidence from environmental inequality in China. Bus. Strateg. Environ. 2022, 31, 3574–3594. [Google Scholar] [CrossRef]
  33. Triebswetter, U.; Wackerbauer, J. Integrated environmental product innovation in the region of Munich and its impact on company competitiveness. J. Clean. Prod. 2008, 16, 1484–1493. [Google Scholar] [CrossRef]
  34. Li, Z.H.X.; Li, N.Y.; Wen, H.W. Digital Economy and Environmental Quality: Evidence from 217 Cities in China. Sustainability 2021, 13, 8058. [Google Scholar] [CrossRef]
  35. Chen, Z.; Kahn, M.E.; Liu, Y.; Wang, Z. The consequences of spatially differentiated water pollution regulation in China. J. Environ. Econ. Manag. 2018, 88, 468–485. [Google Scholar] [CrossRef]
  36. Che, S.; Wang, J. Digital economy development and haze pollution: Evidence from China. Environ. Sci. Pollut. R 2022, 29, 73210–73226. [Google Scholar] [CrossRef]
  37. Rodseth, K.L. Environmental regulations and allocative efficiency: Application to coal-to-gas substitution in the US electricity sector. J. Prod. Anal. 2017, 47, 129–142. [Google Scholar] [CrossRef]
  38. Zhou, J.; Lan, H.L.; Zhao, C.; Zhou, J.P. Haze Pollution Levels, Spatial Spillover Influence, and Impacts of the Digital Economy: Empirical Evidence from China. Sustainability 2021, 13, 9076. [Google Scholar] [CrossRef]
  39. Xu, Q.; Zhong, M.R.; Cao, M.Y. Does digital investment affect carbon efficiency? Spatial effect and mechanism discussion. Sci. Total. Environ. 2022, 827, 154321. [Google Scholar] [CrossRef]
  40. Ouyang, X.L.; Li, Q.; Du, K.R. How does environmental regulation promote technological innovations in the industrial sector? Evidence from Chinese provincial panel data. Energ. Policy 2020, 139, 111310. [Google Scholar] [CrossRef]
  41. Jia, L.J.; Hu, X.L.; Zhao, Z.W.; He, B.; Liu, W.M. How Environmental Regulation, Digital Development and Technological Innovation Affect China’s Green Economy Performance: Evidence from Dynamic Thresholds and System GMM Panel Data Approaches. Energies 2022, 15, 884. [Google Scholar] [CrossRef]
  42. Hampton, S.E.; Strasser, C.A.; Tewksbury, J.J.; Gram, W.K.; Budden, A.E.; Batcheller, A.L.; Duke, C.S.; Porter, J.H. Big data and the future of ecology. Front. Ecol. Environ. 2013, 11, 156–162. [Google Scholar] [CrossRef] [PubMed] [Green Version]
  43. Shin, D.H.; Choi, M.J. Ecological views of big data: Perspectives and issues. Telemat. Inform. 2015, 32, 311–320. [Google Scholar] [CrossRef]
  44. Wan, Q.Q.; Shi, D.Q. Smarter and Cleaner: The Digital Economy and Environmental Pollution. China World Econ. 2022, 30, 59–85. [Google Scholar] [CrossRef]
  45. Bacco, M.; Delmastro, F.; Ferro, E.; Gotta, A. Environmental Monitoring for Smart Cities. IEEE Sens. J. 2017, 17, 7767–7774. [Google Scholar] [CrossRef]
  46. Li, X.Y.; Liu, J.; Ni, P.J. The Impact of the Digital Economy on CO2 Emissions: A Theoretical and Empirical Analysis. Sustainability 2021, 13, 7267. [Google Scholar] [CrossRef]
  47. Yang, J.; Li, X.M.; Huang, S.J. Impacts on environmental quality and required environmental regulation adjustments: A perspective of directed technical change driven by big data. J. Clean. Prod. 2020, 275, 124126. [Google Scholar] [CrossRef]
  48. Wang, J.; Zhang, G.X. Can Environmental Regulation Improve High-Quality Economic Development in China? The Mediating Effects of Digital Economy. Sustainability 2022, 14, 12143. [Google Scholar] [CrossRef]
  49. Solow, R.M. A Contribution to the Theory of Economic-Growth. Q. J. Econ. 1956, 70, 65–94. [Google Scholar] [CrossRef]
  50. Rosenberg, N. Technological-Change in the Machine-Tool Industry, 1840–1910. J. Econ. Hist. 1963, 23, 414–443. [Google Scholar] [CrossRef]
  51. Yoffie, D.B. Nonmarket strategy system. Sloan Manage. Rev. 1996, 37, 5. [Google Scholar]
  52. Luo, S.Y.; Yimamu, N.; Li, Y.R.; Wu, H.T.; Irfan, M.; Hao, Y. Digitalization and sustainable development: How could digital economy development improve green innovation in China? Bus. Strateg. Environ. 2022, 32, 1847–1871. [Google Scholar] [CrossRef]
  53. Cao, S.; Nie, L.; Sun, H.; Sun, W.; Taghizadeh-Hesary, F. Digital finance, green technological innovation and energy-environmental performance: Evidence from China’s regional economies. J. Clean. Prod. 2021, 327, 129458. [Google Scholar] [CrossRef]
  54. Anderson, D. Technical progress and pollution abatement: An economic view of selected technologies and practices. Environ. Dev. Econ. 2001, 6, 283–311. [Google Scholar] [CrossRef]
  55. Ren, X.H.; Zeng, G.D.; Gozgor, G. How does digital finance affect industrial structure upgrading? Evidence from Chinese prefecture-level cities. J. Environ. Manage. 2023, 330, 117125. [Google Scholar] [CrossRef]
  56. Wu, B.Z.; Yang, W.G. Empirical test of the impact of the digital economy on China’s employment structure. Financ. Res. Lett. 2022, 49, 103047. [Google Scholar] [CrossRef]
  57. Janicke, M. “Green growth”: From a growing eco-industry to economic sustainability. Energ. Policy 2012, 48, 13–21. [Google Scholar] [CrossRef]
  58. Sun, X.X.; Chen, Z.W.; Shi, T.T.; Yang, G.Q.; Yang, X.Y. Influence of digital economy on industrial wastewater discharge: Evidence from 281 Chinese prefecture-level cities. J. Water Clim. Chang. 2022, 13, 593–606. [Google Scholar] [CrossRef]
  59. Chen, W. Can low-carbon development force enterprises to make digital transformation? Bus. Strateg. Environ. 2022, 32, 1292–1307. [Google Scholar] [CrossRef]
  60. Zhang, M.; Sun, X.R.; Wang, W.W. Study on the effect of environmental regulations and industrial structure on haze pollution in China from the dual perspective of independence and linkage. J. Clean. Prod. 2020, 256, 120748. [Google Scholar] [CrossRef]
  61. Yin, X.M.; Qi, L.Y.; Zhou, J.L. The impact of heterogeneous environmental regulation on high-quality economic development in China: Based on the moderating effect of digital finance. Environ. Sci. Pollut. R 2022, 30, 24013–24026. [Google Scholar] [CrossRef]
  62. Sun, X.X.; Chen, Z.W.; Loh, L. Exploring the Effect of Digital Economy on PM2.5 Pollution: The Role of Technological Innovation in China. Front. Env. Sci. 2022, 10, 904254. [Google Scholar] [CrossRef]
  63. Pang, J.N.; Jiao, F.Y.; Zhang, Y.M. An Analysis of the Impact of the Digital Economy on High-Quality Economic Development in China-A Study Based on the Effects of Supply and Demand. Sustainability 2022, 14, 16991. [Google Scholar] [CrossRef]
  64. Jalil, A.; Feridun, M. The impact of growth, energy and financial development on the environment in China: A cointegration analysis. Energ. Econ. 2011, 33, 284–291. [Google Scholar] [CrossRef]
  65. Khan, S.A.R.; Piprani, A.Z.; Yu, Z. Digital technology and circular economy practices: Future of supply chains. Oper. Manage. Res. 2022, 15, 676–688. [Google Scholar] [CrossRef]
  66. Zhao, S.Q.; Peng, D.Y.; Wen, H.W.; Wu, Y.Z. Nonlinear and spatial spillover effects of the digital economy on green total factor energy efficiency: Evidence from 281 cities in China. Environ. Sci. Pollut. R 2022. [Google Scholar] [CrossRef] [PubMed]
  67. Xu, S.; Yang, C.Y.; Huang, Z.H.; Failler, P. Interaction between Digital Economy and Environmental Pollution: New Evidence from a Spatial Perspective. Int. J. Env. Res. Public Health 2022, 19, 5074. [Google Scholar] [CrossRef]
  68. Liu, Y.; Liu, M.; Wang, G.G.; Zhao, L.L.; An, P. Effect of Environmental Regulation on High-quality Economic Development in China-An Empirical Analysis Based on Dynamic Spatial Durbin Model. Environ. Sci. Pollut. R 2021, 28, 54661–54678. [Google Scholar] [CrossRef] [PubMed]
  69. Yilmaz, S.; Haynes, K.E.; Dine, M. Geographic and network neighbors: Spillover effects of telecommunications infrastructure. J. Regional. Sci. 2002, 42, 339–360. [Google Scholar] [CrossRef]
  70. Zou, W.Y.; Pan, M.J. Does the construction of network infrastructure reduce environmental pollution?-evidence from a quasi-natural experiment in “Broadband China”. Environ. Sci. Pollut. R 2022, 30, 242–258. [Google Scholar] [CrossRef]
  71. Qiu, S.L.; Wang, Z.L.; Geng, S.S. How do environmental regulation and foreign investment behavior affect green productivity growth in the industrial sector? An empirical test based on Chinese provincial panel data. J. Environ. Manage. 2021, 287, 112282. [Google Scholar] [CrossRef]
  72. Li, X.S.; Lu, Y.L.; Huang, R.T. Whether foreign direct investment can promote high-quality economic development under environmental regulation: Evidence from the Yangtze River Economic Belt, China. Environ. Sci. Pollut. R 2021, 28, 21674–21683. [Google Scholar] [CrossRef] [PubMed]
  73. He, Z.X.; Lu, W.Q.; Hua, G.H.; Wang, J.M. Factors Affecting Enterprise Level Green Innovation Efficiency in the Digital Economy Era—Evidence from Listed Paper Enterprises in China. Bioresources 2021, 16, 7647–7669. [Google Scholar] [CrossRef]
  74. Chen, L.M.; Ye, W.Z.; Huo, C.J.; James, K. Environmental Regulations, the Industrial Structure, and High-Quality Regional Economic Development: Evidence from China. Land 2020, 9, 517. [Google Scholar] [CrossRef]
  75. Lei, P.; Tian, X.Y.; Huang, Q.; He, D.Y. Firm size, government capacity, and regional environmental regulation: Theoretical analysis and empirical evidence from China. J. Clean. Prod. 2017, 164, 524–533. [Google Scholar] [CrossRef]
  76. Wen, S.; Lin, B.; Zhou, Y. Does financial structure promote energy conservation and emission reduction? Evidence from China. Int. Rev. Econ. Financ. 2021, 76, 755–766. [Google Scholar] [CrossRef]
  77. Li, F.F.; Huang, J.Y.; Du, M.Y. Spatial and nonlinear effects of local government debt on environmental pollution: Evidence from China. Front. Environ. Sci. 2022, 10, 1031691. [Google Scholar] [CrossRef]
  78. Zhu, X.W. Have carbon emissions been reduced due to the upgrading of industrial structure? Analysis of the mediating effect based on technological innovation. Environ. Sci. Pollut. R 2022, 29, 54890–54901. [Google Scholar] [CrossRef]
  79. Ma, X.W.; Xu, J.W. Impact of Environmental Regulation on High-Quality Economic Development. Front. Environ. Sci. 2022, 10, 896892. [Google Scholar] [CrossRef]
  80. Lind, J.T.; Mehlum, H. With or Without U? The Appropriate Test for a U-Shaped Relationship. Oxf. Bull. Econ. Stat. 2010, 72, 109–118. [Google Scholar] [CrossRef] [Green Version]
  81. Nunn, N.; Qian, N. US Food Aid and Civil Conflict. Am. Econ. Rev. 2014, 104, 1630–1666. [Google Scholar] [CrossRef] [Green Version]
  82. Pace, R.K.; LeSage, J.P. A sampling approach to estimate the log determinant used in spatial likelihood problems. J. Geogr. Syst. 2009, 11, 209–225. [Google Scholar] [CrossRef]
Figure 1. The kernel density distribution of China’s environmental pollution (a) and digital economy development (b) from 2010 to 2020.
Sustainability 15 09162 g001
Figure 2. Moran’s I index of the distribution of environmental pollution in China.
Sustainability 15 09162 g002
Table 1. Summary of benchmark regression results on the impact of Dig development on EP.
Variable(1)(2)(3)(4)
Dig−3.566 ***−2.253 ***3.518 ***3.204 ***
(−25.67)(3.28)(4.03)(6.91)
Dig2 −2.303 ***−2.792 ***
(3.73)(−3.82)
egdp 3.076 *** 3.371 ***
(2.81) (2.85)
egdp2 −2.767 *** −2.497 ***
(−2.78) (−3.08)
open −0.779 ** −0.567 ***
(−2.33) (−3.71)
hc −0.367 *** −0.587 **
(−2.96) (−2.16)
trf 0.952 * 0.557
(2.00) (0.96)
gov −0.416 *** −0.405 **
(−6.35) (2.04)
time effectsyesyesyesyes
region effectsyesyesyesyes
_cons4.267 ***−18.425 ***4.386 ***−21.261 ***
(10.31)(−2.89)(9.93)(−3.92)
N330330330330
R20.7020.8960.8710.902
F39.76371.36649.65140.632
Note: The values of t are displayed in parentheses, * p < 0.1, ** p < 0.05, *** p < 0.01.
Table 2. Robustness test results of the impact of Dig development on EP.
(5)(6)(7)(8)(9)(10)
Lag 1 PeriodInstrumental VariableReplace VariableShrink Tail2010–20152016–2020
L.Dig3.173 ***
(2.09)
L.Dig2−2.139 **
(−2.12)
Dig 3.226 *** 3.203 ***3.065 **3.351 ***
(3.19) (2.91)(2.15)(3.61)
Dig2 −2.712 *** −2.363 ***−2.355 ***−2.992 ***
(−2.75) (−2.82)(−3.12)(−3.25)
Dig1 1.882 ***
(3.12)
Dig12 −1.297 ***
(−2.86)
control variablesyesyesyesyesyesyes
time effectsyesyesyesyesyesyes
region effectsyesyesyesyesyesyes
_cons−16.907 ***−15.633 ***−16.028 ***−13.261 ***−12.615 ***−18.326 ***
(2.86)(2.06)(3.16)(−3.92)(3.11)(4.23)
K-P Wald 18.330
LM 23.560
R20.8220.8570.8930.8510.8730.881
Note: The values of t are displayed in parentheses, ** p < 0.05, *** p < 0.01.
Table 3. Heterogeneity analysis of the impact of Dig development on EP.
(11)(12)(13)(14)(15)
VariableEastern RegionsCentral RegionsWestern RegionsTechnology IntensiveNon-Technology-Intensive
Dig3.272 ***3.574 **−2.7943.316 ***−0.332
(3.03)(2.89)(−1.55)(5.88)(−0.10)
Dig2−3.318 ***−3.603 ***3.233 *−2.327 ***3.521
(−3.32)(−3.54)(2.05)(−5.90)(1.13)
control variablesyesyesyesyesyes
time effectsyesyesyesyesyes
region effectsyesyesyesyesyes
_cons−16.057 ***−17.797 **−21.692−15.882 ***−19.256 ***
(−2.93)(−2.43)(−1.70)(−3.01)(−9.02)
R20.8560.8220.7570.8130.859
Note: The values of t are displayed in parentheses, * p < 0.1, ** p < 0.05, *** p < 0.01.
Table 4. Results of mechanism analysis of the impact of Dig development on EP.
(16)(17)(18)(19)(20)(21)
VariableinnEPinsEPaaeEP
Dig3.433 *** 2.237 *** 0.749 ***
(2.95) (3.41) (3.35)
inn −1.329 ***
(−3.82)
ins −1.735 **
(−2.01)
aae 0.194
(1.29)
control variablesyesyesyesyesyesyes
time effectsyesyesyesyesyesyes
region effectsyesyesyesyesyesyes
_cons−12.836 ***−14.042 ***−13.492 ***−19.453 ***−10.206 **−12.825 *
(3.99)(3.36)(−3.05)(−2.78)(−2.26)(−1.91)
R20.6260.6770.6020.6960.6830.703
Note: The values of t are displayed in parentheses, * p < 0.1, ** p < 0.05, *** p < 0.01.
Table 5. Results of spatial quantile regression of the impact of Dig development on EP.
(22)(23)(24)(25)(26)(27)
Variable10%25%50%75%80%95%
W*EP1.438 ***1.575 ***1.781 ***2.013 ***2.152 ***1.823 ***
(3.17)(2.73)(2.30)(2.55)(2.96)(3.09)
Dig1.884 *2.109 *2.139 ***2.652 ***3.165 ***3.390 ***
(2.07)(2.01)(2.46)(2.63)(2.77)(2.61)
Dig2−2.078 **−2.017 ***−1.712 **−2.067 ***−2.311 ***−2.515 **
(2.61)(2.51)(2.35)(2.93)(3.17)(2.08)
egdp2.912 ***3.228 ***3.324 ***3.361 ***3.393 ***3.587 ***
(3.11)(2.78)(2.93)(2.97)(3.25)(3.16)
egdp2−2.377 **−2.264 ***−2.253 ***−1.961 ***−2.329 ***−2.455 ***
(2.12)(3.71)(3.26)(3.35)(3.64)(3.66)
open−0.378 *−0.354 **−0.267 ***−0.247 ***−0.232 ***−0.225 ***
(2.01)(2.18)(2.95)(2.98)(3.65)(3.73)
hc−0.450−0.398 **−0.387 ***−0.357 ***−0.422 **−0.518 **
(1.65)(2.06)(2.97)(3.21)(2.21)(2.13)
trf0.681*0.596*0.6700.6430.7250.649
(2.03)(1.98)(1.27)(0.97)(1.25)(1.16)
gov−0.492 ***−0.476 **−0.456 ***−0.351 ***−0.353 ***−0.392 ***
(3.07)(3.18)(3.63)(3.99)(3.75)(3.87)
control variablesyesyesyesyesyesyes
time effectsyesyesyesyesyesyes
region effectsyesyesyesyesyesyes
_cons−10.393 *−17.169 ***−13.071 ***−16.366 ***−18.423 ***−15.761 ***
(3.23)(3.37)(3.21)(3.92)(3.68)(2.93)
R20.8120.8370.8360.8460.8520.861
Note: The values of t are displayed in parentheses, * p < 0.1, ** p < 0.05, *** p < 0.01.
Table 6. Spatial effect decomposition of the impact of Dig development on EP.
W1 W2
VariableDirect EffectIndirect EffectTotal EffectDirect EffectIndirect EffectTotal Effect
Dig−0.823 ***−3.216 ***−4.039 ***−0.935 ***−2.976 ***−3.911 ***
(3.17)(2.73)(3.31)(2.55)(2.96)(3.09)
control variablesyesyesyesyesyesyes
Note: The values of t are displayed in parentheses, *** p < 0.01.
Table 7. Spatial regression results of the impact of Dig development on so2, smoke, and water emissions.
(28)(29)(30)(31)(32)(33)
lnso210%25%50%75%80%95%
Dig1.685 **1.869 *2.033 ***2.326 ***2.867 ***3.112 ***
(2.21)(2.02)(2.65)(2.73)(3.27)(3.51)
Dig2−3.972 **−3.176 ***−2.512 ***−2.825 ***−2.916 ***−2.815 **
(2.63)(2.55)(2.75)(2.93)(3.19)(2.05)
lnsomke10%25%50%75%80%95%
Dig1.865 *2.012 *2.339 ***2.653 ***3.226 ***3.512 ***
(1.99)(2.01)(2.66)(2.81)(2.87)(2.91)
Dig2−2.278 **−2.017 **−1.712 ***−1.667 ***−2.122 ***−2.337 ***
(2.11)(2.05)(2.35)(2.93)(3.17)(3.11)
lnwater10%25%50%75%80%95%
Dig−2.561 *−2.302 *−2.139 ***−1.652 ***−2.165 ***−2.390 ***
(2.02)(2.01)(2.67)(2.79)(2.91)(3.66)
Dig23.082 **3.117 ***3.312 ***3.067 ***2.625 ***2.812 ***
(2.23)(2.53)(2.75)(2.96)(3.52)(3.18)
Note: The values of t are displayed in parentheses, * p < 0.1, ** p < 0.05, *** p < 0.01.
Disclaimer/Publisher’s Note: The statements, opinions and data contained in all publications are solely those of the individual author(s) and contributor(s) and not of MDPI and/or the editor(s). MDPI and/or the editor(s) disclaim responsibility for any injury to people or property resulting from any ideas, methods, instructions or products referred to in the content.

