Article

Drivers of Small-Scale Fishers’ Acceptability across Mediterranean Marine Protected Areas at Different Stages of Establishment

1
Department of Economics and Management, University of Pisa, Via C. Ridolfi 10, 56124 Pisa, Italy
2
Department of Economics and Law, University of Macerata, Via Crescimbeni 20, 62100 Macerata, Italy
3
Department of Integrative Marine Ecology (EMI), Genoa Marine Centre (GMC), Stazione Zoologica Anton Dohrn, National Institute of Marine Biology, Ecology and Biotechnology, Villa del Principe, Piazza del Principe 4, 16126 Genoa, Italy
4
National Research Council, Institute for the Study of Anthropic Impact and Sustainability in the Marine Environment (CNR-IAS), Via de Marini 6, 16149 Genoa, Italy
5
Stazione Zoologica Anton Dohrn, Department of Integrative Marine Ecology, Sicily Marine Center, Lungomare Cristofor Colombo (Ex Complesso Roosevelt), 90142 Palermo, Italy
6
Department of Earth and Marine Sciences (DiSTeM), University of Palermo, Via Archirafi 20–22, 90123 Palermo, Italy
7
Department of Political Science, University of Pisa, Via Filippo Serafini 3, 56124 Pisa, Italy
*
Author to whom correspondence should be addressed.
Sustainability 2023, 15(11), 9138; https://doi.org/10.3390/su15119138
Submission received: 10 February 2023 / Revised: 21 May 2023 / Accepted: 23 May 2023 / Published: 5 June 2023
(This article belongs to the Special Issue Fisheries from the Perspective of Sustainable Development)

Abstract

:
The success of marine protected areas (MPAs) in achieving conservation and sustainable development goals hinges on, among other things, their social acceptability by local communities. Small-scale fishing communities represent a key stakeholder category within and around MPAs. Although many authors have examined the social acceptability of MPAs, relatively few studies have addressed this issue by considering how MPA acceptability is built and can be preserved. This study assessed the latent structure of MPA social acceptability and identified the individual and institutional variables driving stakeholders’ acceptability. Using questionnaire surveys, 124 small-scale fishers’ perceptions of MPAs and their social acceptability were explored in six Mediterranean MPAs (three were implemented, and three were designated). The results show that MPA acceptability is positively related to fishers’ age. The findings also highlight that the formal establishment of MPAs is not a sufficient condition for increasing MPA acceptability among fishers. Considerations about the possibility that MPA acceptability can be increased by building support and compliance emerged. MPA managers should implement successful long-term stakeholder engagement initiatives to increase commitment around conservation measures and to improve overall MPA effectiveness.

1. Introduction

Marine protected areas (MPAs) are globally acknowledged as a key management tool to ensure biodiversity conservation [1,2,3,4,5] and the sustainable uses of marine resources with related benefits for local communities [6,7,8,9,10,11]. MPAs’ potential to reconcile biodiversity protection and sustainable development goals has contributed to a considerable increase in the ocean surface waters under protection [12]. However, researchers have identified great variability in MPA effectiveness, with a non-negligible proportion of MPAs unable to achieve their goals [4,5,13]. Along with the lack of political will, conflicts between stakeholders and community resistance to MPAs are among the major causes of failure to reach the 2020 Aichi Target worldwide [14].
Researchers and MPA managers agree that MPAs’ effectiveness in meeting conservation and socio-economic goals is not just an issue of legal designation but also involves the interplay between conservation policies and stakeholders’ perceptions and attitudes [13,15,16,17,18]. Accordingly, several studies demonstrated the relationship between social factors—such as stakeholders’ needs, expectations, and engagement with the environment—and MPAs’ ecological effectiveness [16,19,20,21,22,23,24]. Failure in achieving MPAs’ multiple goals is often related to (1) inadequate governance, with a lack of regulation, management authority, capacity shortfalls [4,5,6,21,25,26,27], and ineffective enforcement [24,28,29]; (2) a lack of public support [26,30,31,32]; (3) a low level of stakeholder satisfaction [33,34]; and (4) poor stakeholder compliance [28,29,34,35]. These social factors being given little consideration can lead to ineffective MPAs that can be reduced to ‘paper parks’ [28,36].
In this scenario, the ability to achieve positive outcomes for both the nature and human dimensions depends on MPAs’ social acceptability by local communities [37,38].
For MPAs, social acceptability refers to stakeholder communities’ willingness to comply with management regulations and tools regarding natural resource use and to legitimate the governance authority to fulfil its mission [27,39]. Social acceptability can be a cornerstone of stakeholders’ support and engagement in conservation measures and how resources and their use should be managed [18,40,41]. Social acceptability is thus key to long-term, successful MPA management [14], but it is still a poorly explored area [39,42]. Thus, research on social acceptability is strategically important to legitimate conservation policies’ implementation for existing and future MPAs.
MPAs’ success is associated with how they are perceived by stakeholders, including small-scale fishers (SSF) [43]. Fishers’ perception towards MPA management and governance can be a useful indicator of MPA social acceptability [44]. Previous studies explored the association between fishers’ individual characteristics—such as their age [18,30,32,43,45,46], place of origin [32], type of gear [32,43,46,47], education level [18,48], and degree of dependence on fishing [32]—and their attitude toward biodiversity conservation. Social acceptability is also associated with MPAs’ institutional maturity regarding their stage of implementation [7].
Although several authors have investigated this topic [16,43,44,49,50], relatively few studies have considered how MPA acceptability can be built and preserved.
This study seeks to advance the understanding of the social acceptability of implemented and designated MPAs by exploring the perceptions of SSF around six Mediterranean coastal areas. Accordingly, our study aims to develop a quantitative framework to assess the latent structure of and the factors driving MPAs’ social acceptability at different stages of establishment.

2. Materials and Methods

2.1. Research Context and Study Design

MPAs’ institutional framework in the Mediterranean is quite heterogenous [51], encompassing different design, management, and governance features and ranging from multiple-use MPAs with centralised approach to community-based MPAs focusing on co-management initiatives [52]. According to Grorud-Colvert et al.’s [7] framework on MPA establishment stage, several MPAs (especially in the northern part of the basin) are ‘implemented’, while some are ‘actively managed’ [53]. A non-negligible number of MPAs across the Mediterranean face significant financial and staff capacity shortfalls and could be considered merely ‘paper parks’ that are ‘designated and legislated in paper’ and not functioning in practice. Additionally, many MPAs in the Southern Mediterranean Region are in the preliminary ‘proposed stage of establishment’, requiring technical support to overcome legislative and structural inadequacy and to ensure pro-active stakeholder engagement and a participatory process [53].
This study focused on SSF operating inside or close to three ‘actively managed’ MPAs located in EU waters—Egadi Islands MPA (Italy), Telašćica Nature Park (Croatia) and Torre Guaceto MPA (Italy)—and three proposed MPAs in Northern Africa—Taza, Gouraya (Algeria), and Tabarka (Tunisia)—that are currently under consideration for establishment (Figure 1).
The three MPAs in EU waters were established between 1988 and 1991, while the proposed Northern Africa MPAs started their establishment process between 2003 and 2017. Table S1—Supplementary Materials—presents detailed description of each case study’s main aspects.
We developed a survey to investigate SSF’ perceptions of MPAs, assessing their acceptability regarding conservation measures. The questionnaire included questions related to fishers’ (1) socio-demographic characteristics; (2) perceptions regarding environmental quality, conflicts, and threats; (3) perceptions of MPA impacts; and (4) level of support for MPAs (see Tables S2 and S3—Supplementary Materials—for the detailed survey questions and related potential responses). In some cases, the questions differed slightly between the African MPAs and those in EU waters to capture differences in perceptions of MPAs at different stages of establishment. The survey questions were constructed using different scales ranging from three to five points. The survey involved 124 small-scale fishers (usually boat owners) operating in small-scale fishing fleets [54] (Table 1). As in this study, we targeted SSF, and we selected local fishers who owned vessels under 12 m in length, engaging in fishing at short distance from their harbours and targeting multiple species by using a wide variety of traditional non-towed gears [55,56,57] (Despite the fact that SSF’s definition may slightly vary across regions and countries, there are some defining features used to define it. However, the understanding of what constitutes SSF is an ongoing process since the definition boundaries are mutable over time [58]). For the actively managed MPAs, we considered local fishers operating inside or close to the MPA. The sample size accounted for at least 40% of SSF for in each area [59,60] (Table 1). Given the time and resource constraints, it was not possible to personally administer the questionnaires in all the areas selected as case studies. In these contexts, the questionnaire administration was entrusted to local operators. Before proceeding with the survey, the participants were informed about the survey’s purpose, the intended use of the information collected, and how the survey data would be kept anonymous and confidential. Then, their verbal consent was obtained.
The research design addressed the issue of MPA acceptability to explore perceptions and support for MPAs [42]. We assumed that MPA acceptability was a latent theoretical construct [61] not observed but only measured indirectly using observed variables (see Table 2 below and Table S2—Supplementary Materials—for detailed descriptions of each variable, range of values, and related item). As ‘Trust’ is conceptually closest to the considered latent construct, it was used as a proxy for MPA acceptability. The questions ‘How would you classify the overall level of SSF’ support for the MPA’? (for MPAs in EU waters) and ‘On the whole, how do you evaluate the establishment of an MPA’? (for the proposed Northern Africa MPAs) are related to ‘Trust’.
Moreover, a set of contextual variables [71] were included in the conceptual model to identify potential contextual influences correlated with MPA social acceptability (Table S4—Supplementary Materials).
We performed an exploratory analysis to explain the latent constructs of MPA acceptability by examining the correlation between the proxy variable ‘Trust’ and other variables assessed through the survey. Figure 2 describes the nature of MPA acceptability and its hypothetical relationships with observed variables.
Variables assessed through the survey were also used to investigate potential drivers of MPA social acceptability. We hypothesised that demographic, social, and governance factors could determine differences in levels of acceptability towards existing and proposed MPAs. Figure 3 describes the proposed theoretical model.
Based on the fishers’ age (AGE) and study degree (SD) as well as the institutional maturity (IM) of the MPA where each fisher lives (whether ‘legally gazetted’ or not), we profiled the fishers and compared their MPA acceptability. Tables S3—Supplementary Materials—describes the three predictors.
The type of study did not allow for estimating causal relationships but did allow for the identification of variables uncorrelated with MPA acceptability that thus did not affect it. Thus, based on the literature review [16,32,37,43,44], we developed the following hypotheses (H):
Hypothesis 1 (H1).
SSF’s age is positively associated with MPA acceptability. Older fishers generally have a more positive attitude towards MPAs and their conservation measures.
Hypothesis 2 (H2).
SSF’s education is positively associated with MPA acceptability. Fishers with higher educational level generally have more positive perception towards MPAs’ conservation measures.
Hypothesis 3 (H3).
MPA acceptability is correlated with MPAs’ institutional maturity. Presence of a legally gazetted and managed MPA authority promotes greater acceptability.

2.2. Data Analysis

Data analysis was conducted using R software 4.3.0 [72]. In some cases, respondents did not answer some questions, generating missing values in the dataset. Although the interviews were all supposed to take place face to face, in some cases, especially in the proposed Northern Africa MPAs, respondents actually self-completed the questionnaire, and this resulted in some missing answers. To not lose relevant data, we used the package missMDA in R to impute the missing data using principal component methods by considering similarities between the observations and relationships between variables. In particular, the package missMDA imputed the incomplete dataset in such a way that the imputed values did not have any weight on the results of PCA. In this way, we did not need to discard any questionnaire, thus exploiting all the information collected, and in the meantime, we did not risk data imputation distorting the results of the PCA. By replacing missing entries, we thus obtained a complete dataset on which the analysis in Section 3.2 and Section 3.3 is based. Principle component analysis (PCA) was performed to graphically investigate the correlation structure of MPA social acceptability and all other variables likely linked to it. This represented the fishers on a correlation circle and highlighted possible clusters to identify characteristics potentially associated with MPA acceptability. Fourteen active variables were included through varimax rotation and reduced to four dimensions. The number of dimensions to retain was selected based on the Kaiser eigenvalues criterion, scree plot observation, and examination of the proportion of total variance explained by the principal components (the first four PCs accounted for 72% of the overall variation as shown in Table S5—Supplementary Materials). Context variables were instead treated as supplementary variables. This choice was motivated by the fact that these variables did not concern fishers’ perception or opinion, and they were thus not considered as predictors of MPA acceptability. Nevertheless, it could be interesting to compare these context variables to principal components. We also implemented the Wilcoxon test to verify whether average MPA acceptability (measured by the proxy variable ‘Trust’) differed according to the levels of variables AGE, SD, and IM.

3. Results

3.1. Sample Characteristics

The fishers’ average age was 47 years old, with only 6% aged between 20 and 30 years old (Table 3). Most of the respondents had a medium-high educational level (34% had a high school diploma), while 12% had no formal education. Moreover, 94% of the fishers operated trammel nets and gillnets followed by the 44% of whom employed longlines. Their average family unit constituted four people (see Table S6—Supplementary Materials—for further details regarding the survey sample).

3.2. Assessing MPA Social Acceptability

Figure 4 shows the correlation between all the possible variable pairs (see Table S2—Supplementary Materials—for detailed descriptions of each variable and Table S7—Supplementary Materials—for the correlation coefficients). The ‘Trust’ variable was highly and positively correlated with the ‘Environmental Quality’ (0.567). The relationship between SSF and other professional fishers was strongly and negatively correlated with the contextual variable for the contribution of ‘Natural resources’ to the gross domestic product (GDP) (−0.911). Variables related to the threat of illegal fishing, while strongly correlated with each other, were also strongly and positively correlated with the context variables referring to MPAs and, more widely, to protected area coverage at the national level. However, a strong negative correlation existed between the abovementioned variables linked to the perceived threats of illegal fishing and the contribution of ‘Natural resources’ to the GDP. Finally, the variable ‘MPAs’ managerial role’ was positively correlated with the ‘Environmental Quality’ (0.657), the relationship between SSF and other professional fishers (0.625), and ‘Trust’ (0.515); it was negatively correlated with the variable related to the contribution of ‘ Natural resources’ to the GDP (0.627).
Figure 5 presents the PCA results through a correlation circle, where the correlation between a variable and PC was used as the coordinates of the variable on the PC. The variables associated with MPA acceptability and all the related dimensions are represented by black arrows; blue arrows correspond to context variables, which are treated as supplementary variables. Positively correlated variables are grouped together, while negatively correlated variables are positioned in opposite quadrants. The distance between the variables and the origin measures the quality of the variables’ representation on the factor map. The variables away from the origin are well represented on the factor map and are important in interpreting the PC on which they scored high.
PC1 (Dim 1) accounted for 32% of the total data variation. It can be named ‘MPAs’ effectiveness’ because all the variables loading the highest on PC1 are linked to the effectiveness asset, such as the ecological, social, managerial, and relational outcomes. Fishers claiming to support MPAs also positively perceived MPAs’ institutional, social, and managerial roles; perceived improvements in the conservation of marine resources; and had good relationships with other professional fishers. PC2 (Dim 2) accounted for 18% of the total data variation and had high positive weights on perceived threats. It is considered the ‘Threat’ indicator because the two variables with greater loadings indicate the fishers’ perceived illegal fishing level in the area and its perceived impact on fishers’ activities.
The correlation circle in Figure 5 (last two panels) represents the correlations between the variables related to PC3 and PC4. PC3 (Dim3) accounted for 13% of the total variation and had high positive weights on attributes related to the ‘Degree of sharing MPA mission’ (biodiversity conservation, environmental education, and stewardship). PC4 (Dim4) accounted for 7% of the total variation and is interpreted as a ‘Relationship’ indicator because the only variable loading the strongest and positively on this component refers to the perceived quality of the relationship between SSF and recreational fishers. We stress that the variable ‘Trust’ did not score high regarding any of the last three components, and it was thus not substantially correlated or only mildly correlated with the variables determining PC2, PC3, and PC4. However, it scored high on PC1, which accounted for a large portion of data variability and is related to MPA effectiveness. Further details on the PCA results can be found in the Supplemental Materials—Table S8 and Figure S1.

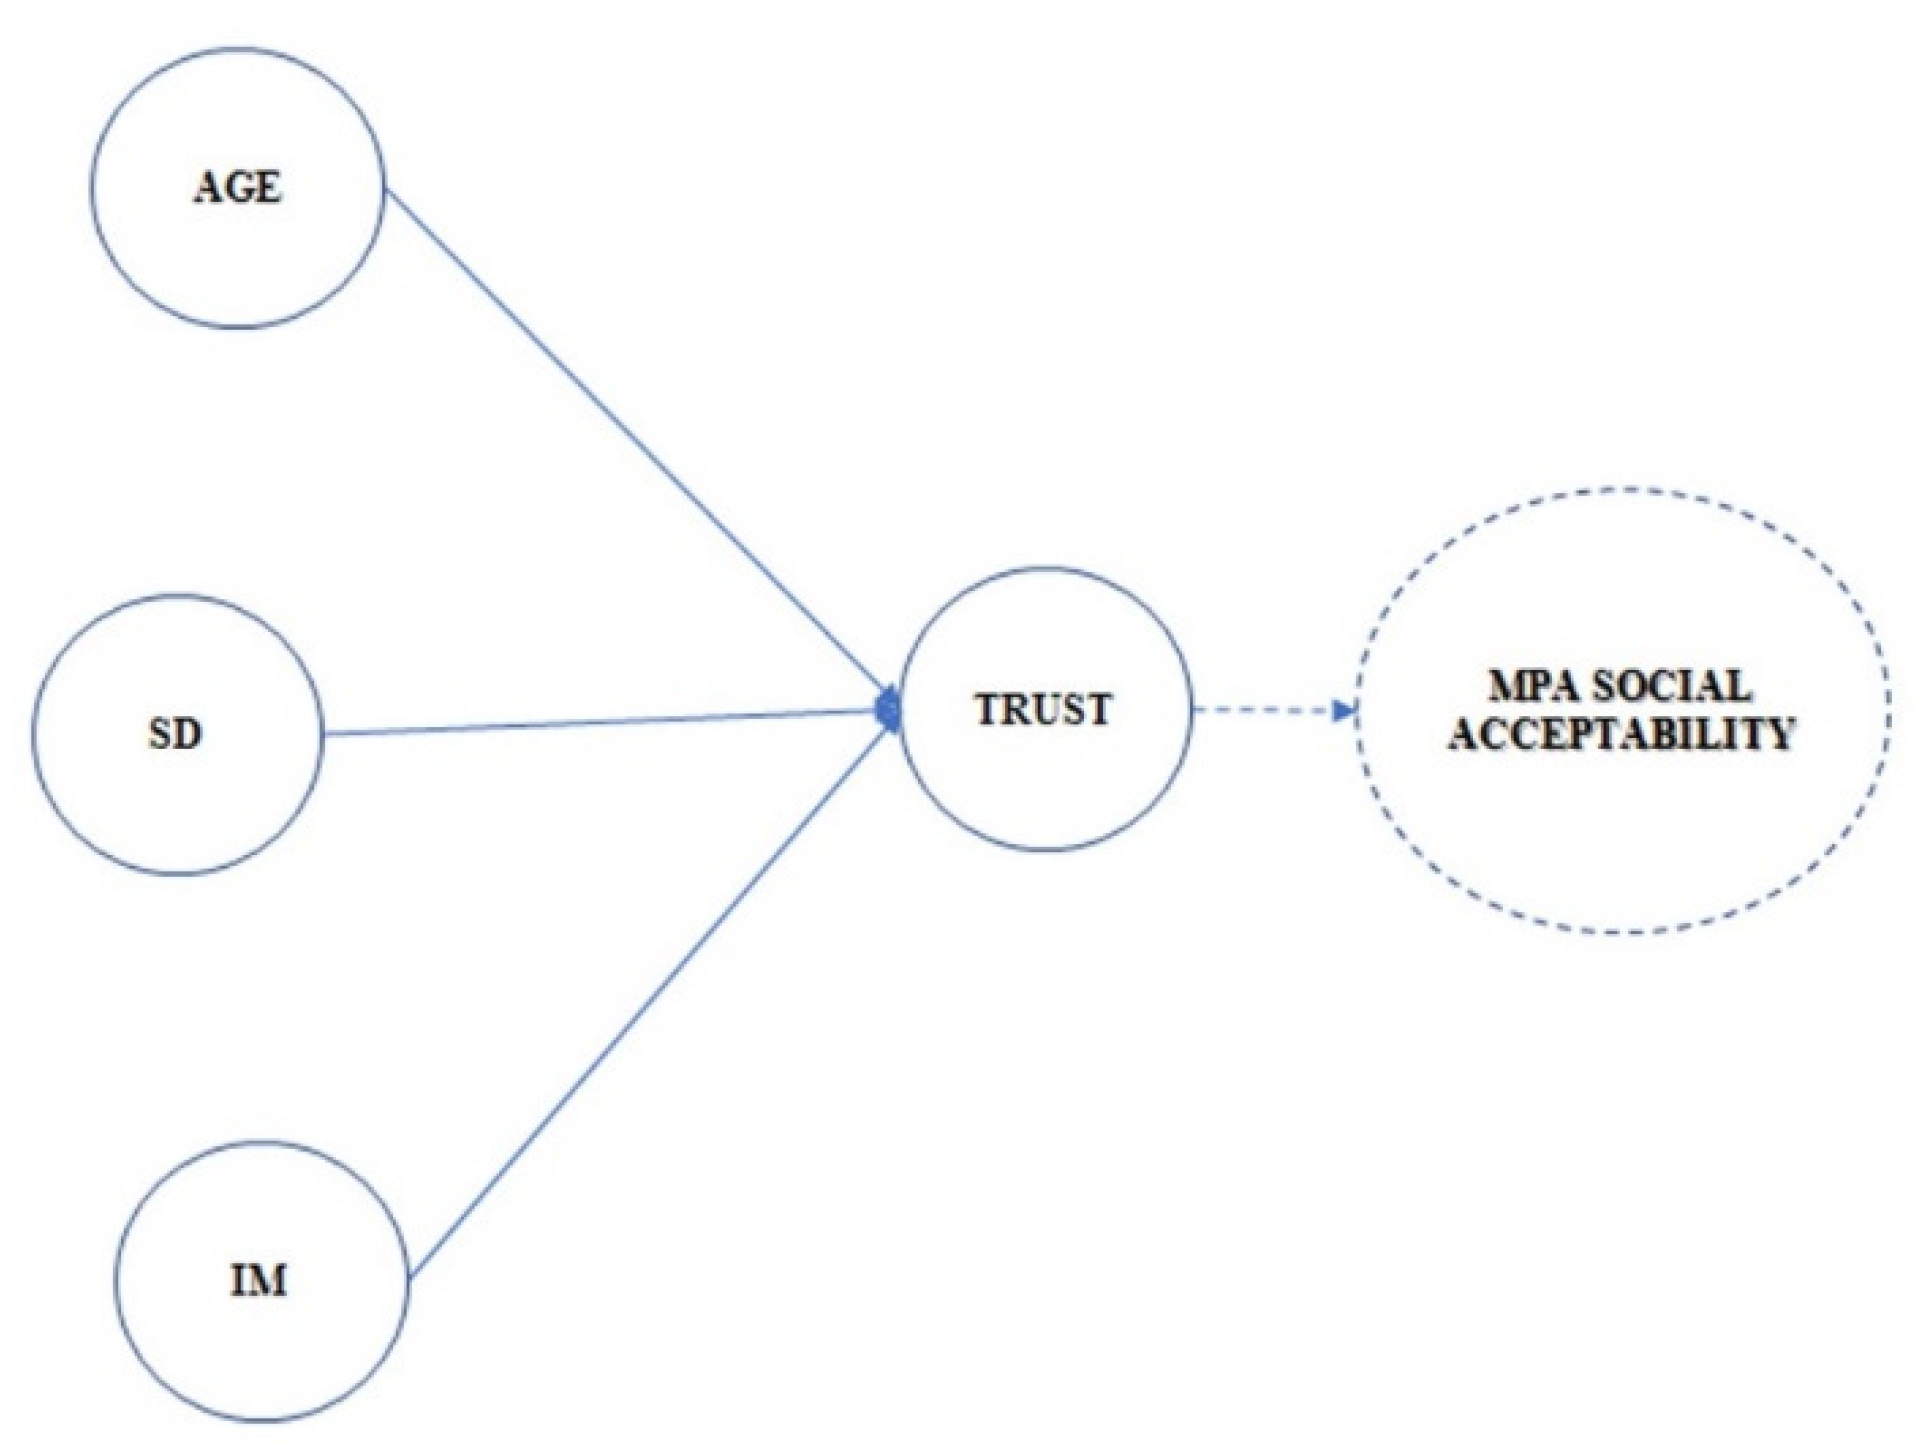
3.3. Predictors of MPA Social Acceptability

Figure 6 shows the differences between the fishers, classified according to the most significant supplementary categorical variables in the model (see also Table S3 and Figure S2—Supplementary Materials). SSF in Torre Guaceto and Tabarka scored higher on the first PC, which is highly related to MPA acceptability. SSF from Taza and Gouraya scored lower on average on this PC and seemed less favourable towards MPA establishment. This only partially confirms the association between the presence of a legally gazetted MPA and the level of acceptability. On the other hand, the legal MPA status was correlated with the dimension of perceived threats (PC2), as observations from legally gazetted MPAs scored higher on the second PC than those from not legally gazetted ones. This indicates that fishers from legally gazetted MPAs perceived higher levels of illegal fishing, which impacts their fishing activity, than fishers in not legally gazetted MPAs. Regarding the variables age, study degree, and family size, SSF did not score differently on the first PC1, that is, in terms of MPA acceptability.
Table 4 shows the Wilcoxon test results, which formally verify whether the fishers classified according to a certain characteristic showed significant differences in average MPA acceptability (measured through the proxy variable ‘Trust’). The fishers in legally gazetted MPAs seemed to have a greater acceptability, as well as those aged > 50 years, although the data showed only weak evidence of this (α = 0.1).

4. Discussion

Discourse around MPA social acceptability is part of the broad debate on the human dimension of biodiversity conservation [20] and its implications for MPA effectiveness [5]. Understanding how consensus or dissent around MPA is built may help MPA managers promote effective stakeholder engagement strategies [37] and successful conservation measures.
We collected data on SSF’ acceptability of MPAs in six Mediterranean contexts at different MPA establishment stages. Our findings provide an exploratory overview of the dynamic structure of perceptions towards MPAs and the factors driving their variability. A correlation analysis and a PCA demonstrated that high MPA acceptability is associated with positive perceptions of MPAs’ ability to ensure a broad spectrum of ecological, social, relational, managerial, and governance benefits [16]. In contexts with satisfactory MPA management, the environmental quality was higher, the relationship between SSF and other professional fishers was characterised by a lower level of conflict, the overall MPA acceptability was higher, and the contribution of ‘Natural resources’ to the GDP was lower. Moreover, in countries with a higher contribution of ‘Natural resources to the GDP, the relationship between SSF and other professional fishers was characterised by a higher level of conflict. Thus, our results concur with previous studies that identified in these attributes a source of consensus for MPAs [15,16,18]. As MPAs’ success is a social construct [33], how people perceive MPAs’ role in the local community is an integral part of the methodological framework to assess MPAs’ effectiveness [5,36]. Variables related to threats of illegal fishing were uncorrelated with MPA acceptability. The fishers’ acceptability was not associated with MPAs’ ability to tackle illegal fishing and its impact on SSF. The comparative analysis showed that fishers inside a legally gazetted MPA perceived a higher illegal fishing level compared to those in contexts where the MPA establishment process was underway. This result has multiple interpretations. Some authors claim that increased fish biomass, thanks to MPA conservation measures, could simultaneously increase illegal fishing activities as the area becomes more attractive to poachers [67]. Focusing on the three legally gazetted MPAs (Torre Guaceto, Egadi Islands, and Telašćica), we observed a higher score on PC2 referring to illegal fishing in Egadi Islands and Telašćica compared to that in Torre Guaceto. This is likely because of Torre Guaceto’s more effective enforcement strategy making it difficult for illegal fishers to access the area [6,66]. The Torre Guaceto MPA management authority directly involved SSF in a co-management process through the definition of fishing policies. This strategy allowed the SSF to become MPA rangers, allowing a decrease in illegal fishing in a few years [25]. In Egadi Island, the lack of communication between SSF and the MPA management authority has contributed to generating an ineffective enforcement strategy, dissatisfaction about regulations, and a high level of illegal fishing observed throughout the MPA [73]. Despite an increased surveillance effort and a satisfactory number of staff and boats, the enforcement strategy of Telašćica can be strengthened [74]. The park’s guards do not have sufficient powers to enforce and sanction [75]. Besides the greater attractiveness of the protected territory (in terms of fish biomass) and ineffective enforcement [66], some authors argue that fishers’ higher perceived illegal fishing level could be linked to their involvement in awareness-raising activities inside MPAs on the biological and economic impacts of illegal fishing and the need to face this threat [35]. However, Thomassin et al. [39] believe that increased illegal fishing inside MPAs could be partly attributed to a significant decline in social acceptability. This could challenge MPA managers’ ability to control and regulate access to marine resources.
The hypothesis that SSF age is related to MPA acceptability (H1) was supported by very mild evidence, with a p-value just above the 5% significance level. Older fishers generally had more positive opinions regarding MPAs, which is in line with several studies [32,43,76,77]. This is likely because of their awareness of the progressive decrease in fish catches over time; thus, they consider MPAs a useful tool to address this threat [77]. Moreover, no differences were observed between fisher groups in terms of study degree (H2), although fishers with a higher education level were expected to show higher MPA acceptability.
Fishers operating in areas with legally gazetted MPAs were expected to show higher acceptability if they recognised the ecological, social, and economic benefits of an effectively managed MPA (H3). This result was driven by the very high acceptability of the legally gazetted MPA in Torre Guaceto, where the fishers scored very high on PC1, and the low acceptability in Taza and Gouraya, explained by the fishers’ general lack of knowledge on MPAs and their low involvement in the areas’ development plans [43]. However, the PCA results revealed that the fishers from Tabarka scored high on PC1 and thus had a good acceptability level despite not yet having a gazetted MPA. Furthermore, the legally gazetted MPAs of Telašćica and, to a greater extent, Egadi Islands did not score particularly high on PC1, likely because the MPA establishment process did not see various local stakeholders’ engagement [73,75,78,79].
Although Tabarka’s MPA is not yet designated, local stakeholders have joined together to manage the marine area. While waiting for legal recognition, through local non-governmental organisations’ support, local stakeholders created a bottom-up co-management model to unofficially manage the park and support SSF in conserving their fishery resources [53].
This exploratory study thus contributes to the debate on MPAs’ social acceptability and its role in building effective MPAs. We show that MPAs’ legal institutionalisation (publishing in the gazette) is not enough to enhance their acceptability among stakeholders. Based on the research findings, some considerations could be useful to project the question of social acceptability into an evolutionary perspective. From this point of view, MPA acceptability and, consequently, its success in achieving both conservation and sustainable development goals could be increased by focusing on the way through which support and compliance are built [13].
Beyond research on the social aspects related to MPA establishment, the key for MPA managers is the identification of tools and methods to improve MPAs’ stakeholder acceptability. They should be aware that good MPA performance also depends on their ability to build stakeholders’ acceptability and commitment around conservation measures.
Several authors have demonstrated that MPAs’ social acceptability is generated through stakeholder engagement strategies [6,14,37,44]. Some [14,37] stated that developing better communication on the costs and benefits of MPAs may increase their acceptability: stakeholders who experienced MPAs’ benefits could potentially be more willing to support them [37]. Organising informative sessions or meetings with scientists and policymakers for the fishers from Taza and Gouraya, for example, could explain to them clearly and transparently the (1) ecological outcomes, i.e., the spillover effect [80], and (2) the socio-economic benefits of MPAs, i.e., pescatourism [81], fostering MPAs’ establishment and implicit acceptability. Fishers’ active engagement in MPA management is associated with higher acceptability [6], thus supporting a participatory bottom-up model of governance. At the beginning, Egadi MPA was perceived as a top-down implementation project without local stakeholders’ involvement, thus increasing conflictual relationships with MPA managers [78]. Contrastingly, the implementation of an early fisher engagement plan allowed the Torre Guaceto MPA management board to gain trust in the co-management approach’s positive and reciprocal benefits [82].
Information strategy, transparency in MPAs’ design and management, shared goals, and a co-management process (conveyed through stakeholder engagement) could improve MPAs’ social acceptability, providing critical insights for enhancing their management effectiveness [5]. Thus, we prioritised the relational aspect of MPAs’ effectiveness, referring to the ability to manage conflicts among marine resource users. Moreover, MPA acceptability should be linked to realistic goals and benefits: high stakeholder expectations could lead to a decline in support if MPA effectiveness does not provide the expected benefits [44].
In the future, we recommend research on a larger number of MPAs at different stages of establishment to deeply investigate differences in social acceptability. This would require a broader conception of institutional maturity that considers not only MPAs’ legal status but also the existence of a government authority, staff and budget capacity, management plans, and enforcement rules [4]. We also encourage further research using a broader group of recreational users, such as recreational fishers, divers, and local residents. Our approach can help develop a larger monitoring and evaluation project on MPA acceptability considering the different stages of MPAs’ lifecycle.

5. Conclusions

Developing an effective MPA as a social structure requires the evaluation of factors which may influence the MPA acceptability of SSF (as well as other key stakeholders). Thus, besides the importance of promoting the establishment of MPAs to achieve global targets, there is a need to understand how MPAs’ social acceptability can be locally (i.e., at each MPA) achieved and preserved [14]. From a managerial viewpoint, this involves the identification of coherent strategies to enhance local communities’ support toward conservation. Moreover, it is crucial to uncover how this topic could contribute to more effective MPAs and the sustainable management of the sea.
An MPA not legitimated by stakeholders and unable to address social concerns at the local level is likely destined to become the victim of the role for which it was created and of a myopic vision of conservation. However, an MPA that is well accepted by key local stakeholders, such as SSF, can achieve both conservation and socio-economic development goals in an effective, sustainable, and equitable way.

Supplementary Materials

The following supporting information can be downloaded at: https://www.mdpi.com/article/10.3390/su15119138/s1, Table S1. Summary of main features of case studies and survey sample. Table S2. Description of the response variables underlie MPAs social acceptability. Table S3. Description of predictors of MPAs social acceptability. Table S4. Contextual variables description at national level. Table S5. Criteria for determining the number of principle components. Table S6. Frequency distribution of socio-demographic variables. Table S7. Correlation matrix between variables. Table S8. Correlation matrix between variables and principal components. Figure S1. Graphic representation of the correlation matrix between variables and principal components. Figure S2. Small-scale fishers’ representation of the plane defined by the first and second PCs and the third and fourth PCs, classified according to the various supplementary qualitative variables identified in the model.

Author Contributions

Conceptualization, D.M., I.C., P.G. and F.N.; Methodology, D.M., L.S., A.D.F. and A.C.; Software, L.S.; Validation, L.S. and P.G.; Formal analysis, Daniela Marzo and L.S.; Investigation, D.M.; Writing—original draft, D.M.; Writing—review & editing, I.C., P.G., A.D.F., A.C. and F.N.; Supervision, F.N.; Project administration, I.C. and F.N.; Funding acquisition, I.C. All authors have read and agreed to the published version of the manuscript.

Funding

This research received no external funding.

Institutional Review Board Statement

No approval of research ethics committees was required to accomplish the goals of this study because research involved the use of non-sensitive, completely anonymous survey and interview procedures. Participants are not defined as "vulnerable" and participation didn’t induce undue psychological stress or anxiety. Furthermore, verbal informed consent was obtained from all subjects before the study.

Informed Consent Statement

Informed consent was obtained from all subjects involved in the study.

Data Availability Statement

Data sharing is not applicable to this article.

Conflicts of Interest

The authors declare no conflict of interest.

References

  1. Bruno, J.F.; Bates, A.E.; Cacciapaglia, C.; Pike, E.P.; Amstrup, S.C.; van Hooidonk, R.; Henson, S.A.; Aronson, R.B. Climate change threatens the world’s marine protected areas. Nat. Clim. Chang. 2018, 8, 499–503. [Google Scholar] [CrossRef] [Green Version]
  2. Di Franco, A.; Plass-Johnson, J.G.; Di Lorenzo, M.; Meola, B.; Claudet, J.; Gaines, S.D.; García-Charton, J.A.; Giakoumi, S.; Grorud-Colvert, K.; Hackradt, C.W.; et al. Linking home ranges to protected area size: The case study of the Mediterranean Sea. Biol. Conserv. 2018, 221, 175–181. [Google Scholar] [CrossRef] [Green Version]
  3. Fox, H.; Soltanoff, C.S.; Mascia, M.; Haisfield, K.M.; Lombana, A.V.; Pyke, C.R.; Wood, L. Explaining global patterns and trends in marine protected area (MPA) development. Mar. Policy 2012, 36, 1131–1138. [Google Scholar] [CrossRef]
  4. Gill, D.A.; Mascia, M.B.; Ahmadia, G.N.; Glew, L.; Lester, S.E.; Barnes, M.; Craigie, I.; Darling, E.S.; Free, C.M.; Geldmann, J.; et al. Capacity shortfalls hinder the performance of marine protected areas globally. Nature 2017, 543, 665–669. [Google Scholar] [CrossRef] [PubMed]
  5. Scianna, C.; Niccolini, F.; Giakoumi, S.; Di Franco, A.; Gaines, S.D.; Bianchi, C.N.; Scaccia, L.; Bava, S.; Cappanera, V.; Charbonnel, E.; et al. Organization Science improves management effectiveness of Marine Protected Areas. J. Environ. Manag. 2019, 240, 285–292. [Google Scholar] [CrossRef] [PubMed]
  6. Di Franco, A.; Thiriet, P.; Di Carlo, G.; Dimitriadis, C.; Francour, P.; Gutiérrez, N.L.; de Grissac, A.J.; Koutsoubas, D.; Milazzo, M.; Otero, M.D.M.; et al. Five key attributes can increase marine protected areas performance for small-scale fisheries management. Sci. Rep. 2016, 6, 38135. [Google Scholar] [CrossRef] [Green Version]
  7. Grorud-Colvert, K.; Sullivan-Stack, J.; Roberts, C.; Constant, V.; e Costa, B.H.; Pike, E.P.; Kingston, N.; Laffoley, D.; Sala, E.; Claudet, J.; et al. The MPA Guide: A framework to achieve global goals for the ocean. Science 2021, 373, eabf0861. [Google Scholar] [CrossRef]
  8. Hattam, C.; Mangi, S.; Gall, S.; Rodwell, L. Social impacts of a temperate fisheries closure: Understanding stakeholders’ views. Mar. Policy 2014, 45, 269–278. [Google Scholar] [CrossRef]
  9. Kerwath, S.E.; Winker, H.; Götz, A.; Attwood, C.G. Marine protected area improves yield without disadvantaging fishers. Nat. Commun. 2013, 4, 2347. [Google Scholar] [CrossRef] [Green Version]
  10. Sala, E.; Mayorga, J.; Bradley, D.; Cabral, R.B.; Atwood, T.B.; Auber, A.; Cheung, W.; Costello, C.; Ferretti, F.; Friedlander, A.M.; et al. Protecting the global ocean for biodiversity, food and climate. Nature 2021, 592, 397–402. [Google Scholar] [CrossRef]
  11. Sala, E.; Costello, C.; Dougherty, D.; Heal, G.; Kelleher, K.; Murray, J.H.; Rosenberg, A.A.; Sumaila, R. A General Business Model for Marine Reserves. PLoS ONE 2013, 8, e58799. [Google Scholar] [CrossRef] [PubMed] [Green Version]
  12. Lubchenco, J.; Grorud-Colvert, K. Making waves: The science and politics of ocean protection. Science 2015, 350, 382–383. [Google Scholar] [CrossRef] [PubMed]
  13. Jentoft, S.; Pascual-Fernandez, J.J.; Modino, R.D.L.C.; Gonzalez-Ramallal, M.; Chuenpagdee, R. What Stakeholders Think about Marine Protected Areas: Case Studies from Spain. Hum. Ecol. 2012, 40, 185–197. [Google Scholar] [CrossRef]
  14. Voyer, M.; Gladstone, W.; Goodall, H. Obtaining a social licence for MPAs—influences on social acceptability. Mar. Policy 2015, 51, 260–266. [Google Scholar] [CrossRef]
  15. Bennett, N.J. Using perceptions as evidence to improve conservation and environmental management. Conserv. Biol. 2016, 30, 582–592. [Google Scholar] [CrossRef] [Green Version]
  16. Bennett, N.J.; Di Franco, A.; Calò, A.; Nethery, E.; Niccolini, F.; Milazzo, M.; Guidetti, P. Local support for conservation is associated with perceptions of good governance, social impacts, and ecological effectiveness. Conserv. Lett. 2019, 12, e12640. [Google Scholar] [CrossRef]
  17. Charles, A.; Wilson, L. Human dimensions of Marine Protected Areas. ICES J. Mar. Sci. 2009, 66, 6–15. [Google Scholar] [CrossRef] [Green Version]
  18. Di Franco, A.; Hogg, K.E.; Calò, A.; Bennet, N.J.; Sévin-Allouet, M.A.; Alaminos, O.E.; Lang, M.; Kkoutsoubas, D.; Prvan, M.; Santarossa, L.; et al. Improving marine protected area governance through collab-oration and co-production. J. Environ. Manag. 2020, 269, 110757. [Google Scholar] [CrossRef]
  19. Bennett, N.J.; Dearden, P. Why local people do not support conservation: Community perceptions of marine protected area livelihood impacts, governance and management in Thailand. Mar. Policy 2014, 44, 107–116. [Google Scholar] [CrossRef]
  20. Bennett, N.J.; Roth, R.; Klain, S.C.; Chan, K.; Christie, P.; Clark, D.A.; Cullman, G.; Curran, D.; Durbin, T.J.; Epstein, G.; et al. Conservation social science: Understanding and integrating human dimensions to improve conservation. Biol. Conserv. 2017, 205, 93–108. [Google Scholar] [CrossRef] [Green Version]
  21. Gallacher, J.; Simmonds, N.; Fellowes, H.; Brown, N.; Gill, N.; Clark, W.; Biggs, C.; Rodwell, L. Evaluating the success of a marine protected area: A systematic review approach. J. Environ. Manag. 2016, 183, 280–293. [Google Scholar] [CrossRef] [PubMed] [Green Version]
  22. McNeill, A.; Clifton, J.; Harvey, E.S. Attitudes to a marine protected area are associated with perceived social impacts. Mar. Policy 2018, 94, 106–118. [Google Scholar] [CrossRef] [Green Version]
  23. Micheli, F.; Niccolini, F. Achieving Success under Pressure in the Conservation of Intensely Used Coastal Areas. Ecol. Soc. 2013, 18, 19. [Google Scholar] [CrossRef] [Green Version]
  24. Rossiter, J.S.; Levine, A. What makes a “successful” marine protected area? The unique context of Hawaii′s fish replenishment areas. Mar. Policy 2014, 44, 196–203. [Google Scholar] [CrossRef]
  25. Guidetti, P.; Milazzo, M.; Bussotti, S.; Molinari, A.; Murenu, M.; Pais, A.; Spanò, N.; Balzano, R.; Agardy, T.; Boero, F.; et al. Italian marine reserve effectiveness: Does enforcement matter? Biol. Conserv. 2008, 141, 699–709. [Google Scholar] [CrossRef]
  26. Jennings, S. The role of marine protected areas in environmental management. ICES J. Mar. Sci. 2009, 66, 16–21. [Google Scholar] [CrossRef]
  27. Jones, N.; McGinlay, J.; Dimitrakopoulos, P.G. Improving social impact assessment of protected areas: A review of the literature and directions for future research. Environ. Impact Assess. Rev. 2017, 64, 1–7. [Google Scholar] [CrossRef] [Green Version]
  28. Claudet, J.; Guidetti, P. Improving assessments of marine protected areas. Aquat. Conserv. Mar. Freshw. Ecosyst. 2010, 20, 239–242. [Google Scholar] [CrossRef]
  29. Read, A.D.; West, R.J.; Haste, M.; Jordan, A. Optimizing voluntary compliance in marine protected areas: A comparison of recreational fisher and enforcement officer perspectives using multi-criteria analysis. J. Environ. Manag. 2011, 92, 2558–2567. [Google Scholar] [CrossRef]
  30. Dimech, M.; Darmanin, M.; Smith, I.P.; Kaiser, M.J.; Schembri, P.J. Fishers’ perception of a 35-year old exclusive Fisheries Management Zone. Biol. Conserv. 2009, 142, 2691–2702. [Google Scholar] [CrossRef]
  31. McCLANAHAN, T.; Cinner, J.; Kamukuru, A.; Abunge, C.; Ndagala, J. Management preferences, perceived benefits and conflicts among resource users and managers in the Mafia Island Marine Park, Tanzania. Environ. Conserv. 2008, 35, 340–350. [Google Scholar] [CrossRef]
  32. Silva, M.R.; Lopes, P.F. Each fisherman is different: Taking the environmental perception of small-scale fishermen into account to manage marine protected areas. Mar. Policy 2015, 51, 347–355. [Google Scholar] [CrossRef]
  33. Heck, N.; Dearden, P.; McDonald, A. Stakeholders’ expectations towards a proposed marine protected area: A multi-criteria analysis of MPA performance criteria. Ocean Coast. Manag. 2011, 54, 687–695. [Google Scholar] [CrossRef]
  34. Miles, A.; Perea Mũnoz, J.M.; Bayle-Sampere, J.T. Low satisfaction and failed relational coordination among relevant stakeholders in Spanish Mediterranean marine protected areas. J. Environ. Manag. 2020, 272, 111003. [Google Scholar] [CrossRef]
  35. Arias, A.; Cinner, J.E.; Jones, R.E.; Pressey, R.L. Levels and drivers of fishers’ compliance with marine protected areas. Ecol. Soc. 2015, 20, 14. [Google Scholar] [CrossRef] [Green Version]
  36. Coppa, S.; Pronti, A.; Massaro, G.; Brundu, R.; Camedda, A.; Palazzo, L.; Nobile, G.; Pagliarino, E.; de Lucia, G.A. Fishery management in a marine protected area with compliance gaps: Socio-economic and biological insights as a first step on the path of sustainability. J. Environ. Manag. 2021, 280, 111754. [Google Scholar] [CrossRef]
  37. Gall, S.C.; Rodwell, L.D. Evaluating the social acceptability of Marine Protected Areas. Mar. Policy 2016, 65, 30–38. [Google Scholar] [CrossRef]
  38. Yates, K.L.; Clarke, B.; Thurstan, R.H. Purpose vs performance: What does marine protected area success look like? Environ. Sci. Policy 2019, 92, 76–86. [Google Scholar] [CrossRef]
  39. Thomassin, A.; White, C.S.; Stead, S.S.; David, G. Social acceptability of a marine protected area: The case of Reunion Island. Ocean Coast. Manag. 2010, 53, 169–179. [Google Scholar] [CrossRef] [Green Version]
  40. Hogg, K.; Noguera-Méndez, P.; Semitiel-García, M.; Gray, T.; Young, S. Controversies over stakeholder participation in marine protected area (MPA) management: A case study of the Cabo de Palos-Islas Hormigas MPA. Ocean Coast. Manag. 2017, 144, 120–128. [Google Scholar] [CrossRef] [Green Version]
  41. Rodríguez-Martínez, R. Community involvement in marine protected areas: The case of Puerto Morelos reef, México. J. Environ. Manag. 2008, 88, 1151–1160. [Google Scholar] [CrossRef] [PubMed]
  42. Kelly, R.; Fleming, A.; Mackay, M.; García, C.; Pecl, G.T. Social licence for marine protected areas. Mar. Policy 2020, 115, 103782. [Google Scholar] [CrossRef]
  43. Hamilton, M. Perceptions of fishermen towards marine protected areas in Cambodia and the Philippines. Biosci. Horiz. 2012, 5, hzs007. [Google Scholar] [CrossRef]
  44. Leleu, K.; Alban, F.; Pelletier, D.; Charbonnel, E.; Letourneur, Y.; Boudouresque, C.F. Fishers’ perceptions as indicators of the performance of Marine Protected Areas (MPAs). Mar. Policy 2012, 36, 414–422. [Google Scholar] [CrossRef] [Green Version]
  45. Richardson, E.A.; Kaiser, M.J.; Edwards-Jones, G. Variation in fishers’ attitudes within an inshore fishery: Implications for management. Environ. Conserv. 2005, 32, 213–225. [Google Scholar] [CrossRef]
  46. Tzanatos, E.; Dimitriou, E.; Papaharisis, L.; Roussi, A.; Somarakis, S.; Koutsikopoulos, C. Principal socio-economic characteristics of the Greek small-scale coastal fishermen. Ocean Coast. Manag. 2006, 49, 511–527. [Google Scholar] [CrossRef]
  47. Pita, C.; Piearce, G.J.; Theodossiou, I. Stakeholders’ participation in the fisheries management decision-making process: Fishers’ perceptions of participation. Mar. Policy 2010, 34, 1093–1102. [Google Scholar] [CrossRef]
  48. Launio, C.C.; Morooka, Y.; Aizaki, H.; Iiguni, Y. Perceptions of small-scale fishermen on the value of marine resources and protected areas: Case of Claveria, Northern Philippines. Int. J. Sustain. Dev. World Ecol. 2010, 17, 401–409. [Google Scholar] [CrossRef]
  49. Gelcich, S.; Godoy, N.; Castilla, J.C. Artisanal fishers’ perceptions regarding coastal co-management policies in Chile and their potentials to scale-up marine biodiversity conservation. Ocean Coast. Manag. 2009, 52, 424–432. [Google Scholar] [CrossRef]
  50. Russ, G.R.; Alcala, A.C.; Maypa, A.P. Spillover from marine reserves: The case of Naso vlamingii at Apo Island, the Philippines. Mar. Ecol. Prog. Ser. 2003, 264, 15–20. [Google Scholar] [CrossRef]
  51. Niccolini, F.; Marzo, D.; Scipioni, S.; Randone, M.; Hogg, K.; Gomei, M. Ecosystem Services, Socio-Economic Values and Organizational Profiles of Mediterranean Marine Protected Areas; WWF: Rome, Italy, 2019. [Google Scholar]
  52. Hogg, K.; Noguera-Méndez, P.; Semitiel-García, M.; Giménez-Casalduero, M. Marine protected area governance: Prospects for co-management in the European Mediterranean. Adv. Oceanogr. Limnol. 2013, 4, 241–259. [Google Scholar] [CrossRef]
  53. Gomei, M.; Abdulla, S.A.; Schröder, C.; Yadav, S.; Sánchez, A.; Rodriguez, D.; Abdul Malak, D. Towards 2020: How Mediterranean Countries are Performing to Protected their Sea; WWF: Rome, Italy, 2019. [Google Scholar]
  54. Lunn, K.E.; Dearden, P. Fishers’ Needs in Marine Protected Area Zoning: A Case Study from Thailand. Coast. Manag. 2006, 34, 183–198. [Google Scholar] [CrossRef]
  55. Kockel, A.; Ban, N.C.; Costa, M.; Dearden, P. Evaluating approaches for scaling-up community-based marine-protected areas into socially equitable and ecologically representative networks. Conserv. Biol. 2019, 34, 137–147. [Google Scholar] [CrossRef] [PubMed]
  56. FAO. The Regional Plan of Action for Small-Scale Fisheries in the Mediterranean and the Black Sea; General Fisheries Commission for the Mediterranean; FAO: Rome, Italy, 2021. [Google Scholar]
  57. FAO. The State of Mediterranean and Black Sea Fisheries; General Fisheries Commission for the Mediterranean; FAO: Rome, Italy, 2022. [Google Scholar] [CrossRef]
  58. Smith, H.; Basurto, X. Defining Small-Scale Fisheries and Examining the Role of Science in Shaping Perceptions of Who and What Counts: A Systematic Review. Front. Mar. Sci. 2019, 6, 236. [Google Scholar] [CrossRef] [Green Version]
  59. Bennett, N.J.; Calò, A.; Di Franco, A.; Niccolini, F.; Marzo, D.; Domina, I.; Dimitriadis, C.; Sobrado, F.; Santoni, M.-C.; Charbonnel, E.; et al. Social equity and marine protected areas: Perceptions of small-scale fishermen in the Mediterranean Sea. Biol. Conserv. 2020, 244, 108531. [Google Scholar] [CrossRef]
  60. Jimenez, A.; Gonzalez, J.G.; Amaral, M.T.; Frédou, F.L. Sustainability indicators for the integrated assessment of coastal small-scale fisheries in the Brazilian Amazon. Ecol. Econ. 2021, 181, 106910. [Google Scholar] [CrossRef]
  61. Bollen, K.A. Latent Variables in Psychology and the Social Sciences. Annu. Rev. Psychol. 2002, 53, 605–634. [Google Scholar] [CrossRef] [Green Version]
  62. Dare, M.; Schirmer, J.; Vanclay, F. Community engagement and social licence to operate. Impact Assess. Proj. Apprais. 2014, 32, 188–197. [Google Scholar] [CrossRef]
  63. Jones, N.; Clark, J.; Panteli, M.; Proikaki, M.; Dimitrakopoulos, P. Local social capital and the acceptance of Protected Area policies: An empirical study of two Ramsar river delta ecosystems in northern Greece. J. Environ. Manag. 2012, 96, 55–63. [Google Scholar] [CrossRef]
  64. McEvily, B.; Perrone, V.; Zaheer, A. Trust as an Organizing Principle. Organ. Sci. 2003, 14, 91–103. [Google Scholar] [CrossRef]
  65. Rees, S.E.; Rodwell, L.D.; Searle, S.; Bell, A. Identifying the issues and options for managing the social impacts of Marine Protected Areas on a small fishing community. Fish. Res. 2013, 146, 51–58. [Google Scholar] [CrossRef]
  66. Davis, T.R.; Harasti, D. Predictive modelling of illegal fishing in no-take marine protected areas. Fish. Manag. Ecol. 2020, 27, 292–301. [Google Scholar] [CrossRef]
  67. Thiault, L.; Weekers, D.; Curnock, M.; Marshall, N.; Pert, P.L.; Beeden, R.; Dyer, M.; Claudet, J. Predicting poaching risk in marine protected areas for improved patrol efficiency. J. Environ. Manag. 2020, 254, 109808. [Google Scholar] [CrossRef]
  68. Castello, L.; Viana, J.P.; Watkins, G.; Pinedo-Vasquez, M.; Luzadis, V.A. Lessons from Integrating Fishers of Arapaima in Small-Scale Fisheries Management at the Mamirauá Reserve, Amazon. Environ. Manag. 2009, 43, 197–209. [Google Scholar] [CrossRef] [PubMed]
  69. Mangi, S.C.; Austen, M.C. Perceptions of stakeholders towards objectives and zoning of marine-protected areas in southern Europe. J. Nat. Conserv. 2008, 16, 271–280. [Google Scholar] [CrossRef]
  70. Pascual, M.; Rossetto, M.; Ojea, E.; Milchakova, N.; Giakoumi, S.; Kark, S.; Korolesova, D.; Melià, P. Socioeconomic impacts of marine protected areas in the Mediterranean and Black Seas. Ocean Coast. Manag. 2016, 133, 1–10. [Google Scholar] [CrossRef] [Green Version]
  71. World Bank. World Development Indicators. 2019. Available online: http://datatopics.worldbank.org/world-development-indicators/ (accessed on 10 March 2020).
  72. R Core Team. R: A Language and Environment for Statistical Computing; R Foundation for Statistical Computing: Vienna, Austria, 2019; Available online: https://www.R-project.org/ (accessed on 5 July 2021).
  73. Himes-Cornell, A. Small-Scale Sicilian Fisheries: Opinions of Artisanal Fishers and Sociocultural Effects in Two MPA Case Studies. Coast. Manag. 2003, 31, 389–408. [Google Scholar] [CrossRef]
  74. Maestro, M.; Chica-Ruiz, J.A.; Popović Perković, Z.; Pérez-Cayeiro, M.L. Marine Protected Areas Management in the Mediterranean Sea—The case of Croatia. Diversity 2002, 14, 448. [Google Scholar] [CrossRef]
  75. Magaš, D. Nature Park “Telašćica” on Dugi otok (Croatia)—Some aspects of environmental planning. Geoadria 1998, 3, 81–92. [Google Scholar] [CrossRef] [Green Version]
  76. Hatcher, A.; Jaffry, S.; Thebaud, O.; Bennett, E. Normative and Social Influences Affecting Compliance with Fishery Regulations. Land Econ. 2000, 76, 448–461. [Google Scholar] [CrossRef]
  77. Liao, C.-P.; Huang, H.-W.; Lu, H.-J. Fishermen’s perceptions of coastal fisheries management regulations: Key factors to rebuilding coastal fishery resources in Taiwan. Ocean Coast. Manag. 2019, 172, 1–13. [Google Scholar] [CrossRef]
  78. D’anna, G.; Fernández, T.V.; Pipitone, C.; Garofalo, G.; Badalamenti, F. Governance analysis in the Egadi Islands Marine Protected Area: A Mediterranean case study. Mar. Policy 2016, 71, 301–309. [Google Scholar] [CrossRef]
  79. Himes, A.H. Performance indicators in MPA management: Using questionnaires to analyze stakeholder preferences. Ocean Coast. Manag. 2007, 50, 329–351. [Google Scholar] [CrossRef]
  80. Di Lorenzo, M.; Claudet, J.; Guidetti, P. Spillover from marine protected areas to adjacent fisheries has an ecological and a fishery component. J. Nat. Conserv. 2016, 32, 62–66. [Google Scholar] [CrossRef]
  81. Prosperi, P.; Kirwan, J.; Maye, D.; Bartolini, F.; Vergamini, D.; Brunori, G. Adaptation strategies of small-scale fisheries within changing market and regulatory conditions in the EU. Mar. Policy 2019, 100, 316–323. [Google Scholar] [CrossRef]
  82. Russi, D. Governance strategies for a successful marine protected area—The case of Torre Guaceto. Mar. Policy 2020, 115, 103849. [Google Scholar] [CrossRef]
Figure 1. Map of case study sites.
Sustainability 15 09138 g001
Figure 2. Latent structure of the social acceptability of MPAs. SSF represents small-scale fishers, PA represents protected areas, and GDP represents gross domestic product.
Sustainability 15 09138 g002
Figure 3. Theoretical model—predictors of MPA acceptability: AGE (age of SSF), SD (study degree of SSF), and IM (institutional maturity of MPAs).
Sustainability 15 09138 g003
Figure 4. Correlation matrix with the possible variables’ pairs. Positive correlations are displayed in blue, and negative correlations are displayed in red colour. Colour intensity and size of the bubble are proportional to correlation coefficients. The legend on the right side of the correlogram shows the correlation coefficients that correspond to different colours.
Sustainability 15 09138 g004
Figure 5. Correlation circles representing the relationships between (a) all original variables and the first two PCs, (b) the eight variables with the highest sum of scores with respect to the first and second PCs, (c) all original variables and the second two PCs, and (d) the eight variables with the highest sum of scores with respect to the third and fourth PCs. The sum of scores of a variable is the sum of the coordinates of that variable in the plot. In all panels, active variables are represented in black, whereas supplementary variables are represented in blue.
Sustainability 15 09138 g005
Figure 6. (a) SSF’ representation of the plane defined by the first and second PCs. (b) SSF’ representation of the plane defined by the third and fourth PCs. Each point on the plane corresponds to a single fisher. Different colours were used to identify fishers regarding characteristics that might affect MPA acceptability.
Sustainability 15 09138 g006
Table 1. Summary of the case studies and fisher sample.
Case StudiesCountryNo. of Estimated Vessels *No. (%) of Fishers Interviewed (Total = 124)
Egadi IslandsItaly4021 (52%)
Torre GuacetoItaly55 (100%)
TelašćicaCroatia157 (46%)
GourayaAlgeria7337 (50%)
TazaAlgeria5434 (62%)
TabarkaTunisia3620 (55%)
* Estimated vessels operating in the local SSF community.
Table 2. Description of the variables assessed through the questionnaire.
Variable a Description b Main References
Trust (proxy of MPA acceptability)Positive assumption about motivations and intentions of the other part that affects the level of stakeholder support for management activity[62,63,64]
Environmental qualityPerceptions about marine resource conditions and biodiversity [32,39,43,44]
Relationship between SSF and recreational fishersSSF perceptions about the relations and conflicts between resource users[18,65]
Relationship between SSF and other professional fishers
Relationship between SSF and tourists
Level of illegal fishingPerceptions about the major threats affecting SSF activities, such as illegal fishing[66,67]
Illegal fishing impacts
MPA social role Legitimacy of the social, governmental, and managerial roles of MPAs[42,44,59]
MPA governance role
MPA management role
MPA economic impacts
Biodiversity conservationAssessment of SSF support based on shared MPA goals[6,51,68,69,70]
Environmental education
Stewardship
Note: a The range is indicated in Table S2—Supplementary Materials. b The questions are presented in Table S2—Supplementary Materials.
Table 3. Socio-demographic characteristics of the survey sample.
VariableTotal Sample (%)
(N = 124)
Age
20–30 years old 6
31–40 years old 19
41–50 years old 34
51–60 years old 33
61+ years old6
Missing values2
Mean: 47
Standard deviation: 10
Study degree
None12
Elementary school23
Middle school22
High school34
University/bachelor’s degree or higher7
Missing values2
Type of gears
Trammel net/gillnet94
Longlines (bottom and pelagic)44
Traps 8
Lines 3
Other3
Missing values6
No. of people in household
1 9
2 9
3 8
4 36
525
6 8
7 2
8 1
Missing values2
Mean: 4
Standard deviation: 1
Table 4. Impact of explanatory variables on MPAs’ social acceptability (Wilcoxon test).
VariableCategoriesMean of Trustp-Value
StatusLegally gazetted3.450.092
Non-legally gazetted3.14
Age≤503.210.063
>503.58
Education≤Middle school3.40.766
>Middle school3.29
Disclaimer/Publisher’s Note: The statements, opinions and data contained in all publications are solely those of the individual author(s) and contributor(s) and not of MDPI and/or the editor(s). MDPI and/or the editor(s) disclaim responsibility for any injury to people or property resulting from any ideas, methods, instructions or products referred to in the content.

