Abstract
Population growth and urbanization increasingly put pressure on our planet’s availability of areas needed for food production. The dependencies on domestically produced food are increasingly judged favourable, following the consequences of the Ukrainian war, with escalating fuel and grain prices and less accessibilities to low-income groups. It is, however, unclear whether land is domestically available. Applying a food system approach, the main aim of this article is to investigate spatial foodsheds and theoretical self-sufficiency for food production needed to supply increasing future populations in a selection of cities, including estimates for Dhaka in Bangladesh, Nairobi in Kenya and Kampala in Uganda. The projected foodshed scenario areas for the years 2020 and 2050 are estimated for the production of three core products currently extensively produced and consumed in the three countries. They show that it is not possible to feed an ever-increasing urban population based on domestic production alone. International trade, new technological developments and new consumer demands for less area-intensive food production systems may give solutions to the immense challenge of feeding the world’s population with nutritious food in 2050. However, to ensure fair and inclusive transition pathways for low-income groups: (1) affordability and accessibility of trade opportunities, technologies and products, (2) a common vision aiming for the SDGs, including SDG2: Zero hunger and SDG11: Sustainable Cities and Communities as well as (3) best practices in co-creation and cooperation with the most vulnerable urban and rural populations, are highly needed.
1. Introduction
In an ever-changing and globalized world, accomplishing food and nutrition security for all is a major challenge for developing countries in particular [1,2]. Food security is achieved when all people at all times have access to sufficient, safe, nutritious food to maintain a healthy and active life [3]. Food security is a function of food availability, food accessibility, food stability and food utilisation [4]. Urban and rural food security are strongly interlinked [2], as which rural food production may strongly depend on consumers and end markets in urban areas [5]. Hence, influenced by a series of socio-economic drivers, in sub-Saharan Africa and Asia people are increasingly migrating from rural areas into cities in search for work, water and food [6]. As a result, the informal settlements are increasing because of rural–urban migration [7,8].
Hunger affected 278 million people in Africa and 425 million in Asia in 2021, and it has been estimated that nearly 670 million people will still be undernourished in 2030 [9]. The share of people unable to afford a healthy diet is 81% in Kenya, 82% in Uganda and 74% in Bangladesh [9].
Our planet’s available areas needed for food production are increasingly under pressure from population growth and urbanization [10]. A way to fill this gap is to increase imports. Lately, the world order has changed when it comes to trade of basic products needed for food security, among others, by the war in Ukraine since 24 February 2022 just after the COVID-19 pandemic [11,12]. In low-income countries in Africa and Asia, dependency of imports of grain [13] and increasing fuel prices worldwide [14,15] have directly affected food security. Moreover, low- and middle-income countries, such as Kenya, Uganda and Bangladesh, are experiencing harsh consequence of the COVID-19 pandemic [16,17,18].
Moreover, climate change is impacting food security [19]. According to foresight analyses, agricultural production will have to increase by 50% (2012–2050) to provide enough food for a growing and wealthier population [20]. This increase in production will lead to more global climate emissions unless future food systems reduce emissions per unit of output [21]. Moreover, dependency on trade will increase transport with added emissions [22]. Hence, food security for the poor and vulnerable is highly challenged by climate change, for which adaptation requires tackling of [4]: (1) chronic poverty caused by lacking government funds, (2) market challenges which are critical for food security and agricultural growth, (3) farmer attitudes toward managing risks and (4) needed improvements of institutions responsible for managing food and agricultural systems.
Food security in an urban context can be complex because of the relationships between urban consumers and food suppliers [23]. In low-income countries, informality [24], i.e., absence of registration and licensing, characterizes markets and sales, including street vendors who are major providers of food and livelihoods to low-income urban residents, especially women, in Africa and Asia [25]. A food system approach can include such complex relationships and analyse outcomes in the form of food security in search for new opportunities [26]. Gregory et al. [27] (p. 2139) explain the links between food security and the complexities of food systems as follows: ‘Dynamic interactions between and within the bio-geophysical and human environments lead to the production, processing, preparation and consumption of food, resulting in food systems that underpin food security’. Food shortage in Africa and Asia is thus related to socio-economic, as well as environmental and climate drivers [26]. The outcomes of a resilient food system would demonstrate sufficient production of sufficient, safe and healthy food for our growing world population, equitable distribution of costs and profits and sustainable use of land and natural resources, as well as adaptability to climate change [28].
Urban and peri-urban agriculture is judged an interesting strategy for land management and transformation towards more sustainable and resilient food systems coping with climate change, ecological degradation, food insecurity and economic crises [29]. Hence, the shortening of supply chains as a means to enhance food security and increased food system resilience, by reducing ecological footprint of food consumption, self-sufficiency and regionalisation, has received increased attention [30]. By this reasoning, one of the opportunities for increased food security given the recent world developments is an increase in domestic production of crops [31,32,33]. Zasada et al. [30] introduced the concept of foodshed scenarios; more precisely the “Metropolitan Foodshed and Self-sufficiency Scenarios” using a data-driven approach to estimate spatial foodsheds, and theoretical self-sufficiency of the city region by combining regional food consumption and agricultural production variables, following a food system approach.
Against this background, the main aim of this article is to investigate spatial foodsheds and theoretical self-sufficiency for food production needed to supply increasing future populations in a selection of cities, including estimates for Dhaka in Bangladesh, Nairobi in Kenya and Kampala in Uganda. Foodsheds are thus defined as ‘the size of the agricultural area needed to supply a city and its metropolitan region with food as well as the area’s theoretical food self-sufficiency, taking specific regional conditions into consideration’ [30] (p. 26). In particular, foodsheds of the following products are estimated:
- (1)
- Domestic areas needed to produce rice, potatoes and vegetables to an increasing population in Dhaka, Bangladesh;
- (2)
- Domestic areas needed to produce maize, milk and vegetables to an increasing population in Nairobi, Kenya;
- (3)
- Domestic areas needed to produce plantain, cassava and milk to an increasing population in Kampala, Uganda.
Accordingly, this is a contribution to gather knowledge about potential size of area needed for the main consumed crops to sustain the increasing populations in large cities in future [34,35]. Thus, two scenarios for each of the three countries are analysed: (1) projections of potential sizes of areas needed around the cities in 2020 to supply products mostly demanded in each of these cities and (2) projections of the extended sizes of area needed in 2050, taking into account core socio-economic drivers such as the migration into cities, population growth and land available around the cities.
In this article, in the following Section 2, the research approach applied in this study is explained, introducing a rural–urban food system approach to address its complex interrelationships and the relevance to this study, including explanations of foodshed scenario and theoretical food self-sufficiency, as well as the data used, method applied and assumptions set for the estimates. In Section 3, results are presented quantitatively and by means of illustrative maps. In Section 4, a discussion about the scenarios presented is provided in terms of their food accessibility, as well as socio-economic and environmental sustainability outcomes. Final concluding remarks and recommendations for follow-ups are provided in Section 5.
2. Research Approach
2.1. A Rural–Urban Food System Approach
This study applies a rural–urban food system approach designed particularly for addressing rural–urban interlinkages, including a spatial approach following van Berkum et al. [8]. A food system approach is applicable to transition pathways aiming for the Sustainable Development Goals (SDGs) [36], including SDG2: Zero hunger and SDG11: Sustainable cities and communities. Transformation of agriculture and food systems in line with SDGs has become a non-disputable imperative [37,38]. A rural–urban food system framework conceptually explains how socioeconomic and climate factors operate as drivers within a food system, for which multiple (biophysical, economic, political and social) factors and activities relate to the production, processing, distribution, preparation and consumption of food, and the outcomes of these activities [39]. The outcomes are observed in terms of food security (i.e., availability and accessibility of nutritious food), socio-economics (income, employment) and condition of the environment (biodiversity, minerals, water, climate, soils) [26] (see Figure 1).
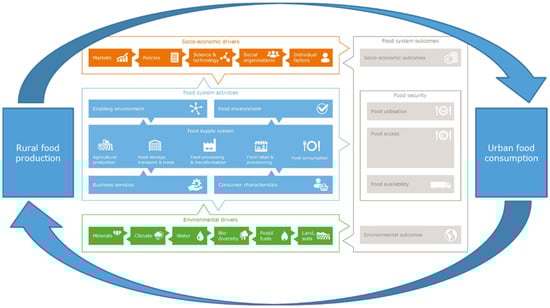
Figure 1.
A rural–urban food systems framework with food system activities, and socio-economic and environmental drivers, bounded in governance and aiming towards outcomes of food security, sustainability and resilience, safe and healthy diets and inclusiveness and equitable benefits.
Different research fields apply divergent food system approaches. On the one hand, the complexities of a food system can be captured conceptually by visually demonstrating interconnectivity and feedback loops. For instance, to explain connections between urban food consumption, food environments, food supply chains and their outcomes in terms of employment, food security and environmental preservation [24], or to investigate rural–urban relations as a factor for food system resilience, conceptualized through dimensions of agency, buffering, connectivity and diversification [40]. On the other hand, a series of quantitative modelling approaches claim to capture the food system dynamics. These include Muller et al. [1] who aim to bridge the gap between the micro and the macro scale, particularly on issues of: food security linked with economic development, population growth, water scarcity, trade-offs in search of a sustainable future and resiliency in the food system. Another quantitative model approach is investigating food systems by developing future global scenarios linking land use and food security, focusing on nutrition and health [41], for which results suggest that changing towards healthier global diets would limit potential expansion in agricultural land area.
Still, for now it is claimed that our food systems are under pressure and failing us [42]. Spatial dimensions of food systems have been recommended to assist in addressing complex interrelationships and to suggest solutions for improved food system outcomes [8,43]. The concept of foodshed scenarios, introduced by Zasada et al. [30], is a reaction meant to potentially deal with a series of observed socio-economic and environmental drivers triggering the needs of investigating how domestic production may be strategic to reduce the risks of: food insecurity, international wars impacting the international trade and access to food in low-income countries, exclusion of marginalised communities from having access to income, increased poverty and hunger as well as enhanced risks for water shortage and environmental degradation. Moreover, food system failures include inabilities to: (1) produce and deliver high-quality diets to meet nutritional needs, (2) produce equal and equitable benefits and (3) mitigate negative consequences [42].
The metropolitan foodshed scenarios and self-sufficiency analyses can reveal whether area availability around city regions can theoretically support the food demands in future. Following a food system approach, when the foodshed scenarios demonstrate theoretical opportunities, the practicalities of implementation must still be carried out, such as setting up logistics for value-chains, governmental support, stable finance regimes, peace-making and climate adaptation strategies, as well as protection of human and social values, and improvements of rural livelihoods, where dignity, equity, inclusion and justice are integral parts of sustainable food systems, trade and employment [44]. Moreover, trust-building and resonance are critically important factors to be addressed when taking the next steps of building a fair food system transition pathways [34,35,45].
Hence, simplified from a city region food system approach designed to target improvements of insights about urban–rural flows of resources, including food, waste, people and knowledge, and the policies and process needed to enable sustainability [46], the focus in this article is on spatial needs for production–consumption dynamics by estimating spatial foodsheds [30]. The spatial foodshed analysis is simply an intervention that can support specific directions of future transition activities. The spatial foodshed analyses investigate the agricultural area needed to supply core food items to the selected cities of Dhaka in Bangladesh, Nairo in Kenya and Kampala in Uganda in 2050. Such a data-driven approach to estimate spatial foodsheds can, from a theoretical perspective, assess the self-sufficiency of the city region; in this study we concentrated on a total of three core products which are highly consumed and produced in the three cities, taking specific regional conditions into consideration.
The foodshed analyses in this study were performed by Global Detector, which is a knowledge-based Geographic Information System (GIS) estimating foodshed potentials for production, demand and market strategies regarding agricultural commodities [47,48].
2.2. Simplifications Made of Reality
The approach applied in this study is based on a simplified definition of the reality. The overall motivation can be explained as: “The trends of urbanization will result in increased demand particularly in and around cities. In a given proposed future situation the world may be in a situation where countries will rely more on domestic food production to ensure domestic food security. If agricultural land is not available domestically for food production, this can turn to be devastating for developing countries with large numbers of people living on only one meal a day. To provide some clues about whether enough areas are available to feed ever growing city demand in developing countries, foodshed scenarios are estimated to find whether agricultural land in the surrounding areas of cities theoretically could be used to produce food to supply the increasing demand in the three selected cities; Dhaka in Bangladesh, Nairobi in Kenya and Kampala in Uganda.”
As such, this study can be characterised as highly resource driven. The complexities related with land are not taken into account, such as land ownership and details of national spatial planning. For instance, the areas included for grassland to produce fodder in this study can in practice be unavailable because they are planned for other purposes within the pre-urban settings. Moreover, the opportunities for using land more effective for food production in future with advanced technologies is addressed simply by estimates of the increase in food production given no area expansion. Moreover, it is not taken into account that future demands in cities may differ substantially from what is currently demanded in cities and rural areas, because of the high diversities and uncertainties of city demands. Notably, it is possible to include differences in consumption patterns in urban and rural areas in future foodshed analyses if sound information becomes available. Further, expenditure elasticities or income elasticities are not taken into account to project demand for a good. As such, this is not an economic analysis projecting changing demand in cities as a result of rising income. There is no indication that income will rise; instead, a more likely scenario is that informal settlements (slums) will expand with larger proportions of the population living in poverty. In a future with shortage of land, substitutes of existing products may be one of the coping strategies, but this is not taken into account in the analyses. Likewise, this is not an economic analysis about inputs in a production system to show how changing demand affects production or output over the projection period. With more information about future income distribution and inputs used for projection of production, such analyses would be interesting as follow up.
Instead of applying advanced modelling analyses, this study estimates foodshed scenarios to know the theoretical level of self-sufficiency across different highly expanding city regions, to support decisions on urban developments and investments to increase future resiliency of the city regions.
2.3. Defining Scenerios with Domestic Production of Main Crops Consumed in Kenya, Uganda and Bangldesh
Foodshed scenario maps. In this study, the foodshed scenarios are presented on maps based on a formula, i.e., Supply (2050) = Supply (2020) × Population growth (2050), for which a projected supply in 2050 is a function of the supply in 2020 times the expected population growth. A supply map shows an amount of area needed to produce a product consumed in an urban area (a grid cell has a size of 6.25 km2 due to the resolution of 2.5 × 2.5 km, and as such the exact grid cell unit is thus ton/6.25 km2). In the two scenarios, for the years 2020 and 2050, it is assumed that all of what is consumed in an urban area is produced as close by the city as possible. Without arguing about practicalities, the scenarios assume that within a specified city border where a product is demanded, this product is produced outside the city border, within a newly defined supply border. The maps thus define an inner circle with demand, as well as an outer circle defining what area would be needed to supply what is demanded. Such a scenario of domestic supply maximization in short distance to demands is favourable as it reduces dependencies on imports, as well as reducing the overall CO2 emissions, and keeping transportation costs to a minimum. The authors are aware that in practical settings, it can be complicated to reach such optimisation given the complicated context specific factors; however, it is believed that this information can assist policy makers in increasing food availability in effective manners, particularly in highly populated cities with high degrees of urbanisation due to rural urban migration in future.
Urbanisation scenario. Important to the Foodshed scenario maps analyses is to understand how many people will move into the main cities by 2050. When the population density increases from 2020 to 2050 it is assumed that part of the cropland will be converted to areas for housing, etc. Consequently, there will be fewer areas available for crop production and the vicinity of the city is expected to go down. The supply of a certain crop is reduced by a percentage given the level that the population density increases. More specifically, a proxy is specified based on expert knowledge for taking account of an increase of 100 people per km2, resulting in a decrease in production area of 10% (i.e., production area = −0.1 people/km2 of each of the crops produced on that grid-cell).
Further, it is assumed that there are no differences between urban and rural consumption per capita. Notably, it is possible to include differences in consumption patterns in urban and rural areas if need to be.
In the calculations for 2050, it is assumed that there will be no increase or decrease in demand (consumption per capita) or productivity (yield per hectare), so the only changing variable is the population growth compared to 2020. To define the city borders, for each city and product a radius around the city central point is assumed to be 50 km. The total demand within this radius is calculated (i.e., the outer radius is defined when border confirms that supply in outer circle radius equals demand in the city region inner circle). To define this outer border of potential supply more precisely, context specific information will be needed. If it is possible to cultivate large production close around the city, then the supply radius is smaller, compared with contexts where the production of, e.g., cassava in Uganda, is far away from the city, which would give a large supply radius.
Yield per hectare (ha) in the scenarios. In this study, we also estimate the productivity as an alternative to expanding the cultivation areas. In this exercise we are not using the maps. In this calculation, we take the production within the fixed radius around the city inner circle for the demand is used (See Formula (1)).
where Yi/ha (2050) and Yi/ha (2020) are the yield per hectare of a crop (i) listed in Table 1 in the years 2050 and 2020, respectively, and the pop(2050)/pop(2020) is a growth factor that determines the population growth between the two years.
Yi/ha (2050) = Yi/ha (2020) × (pop(2050)/pop(2020))
Milk and grassland scenarios. In order to define the inner demand border and the outer supply border of a city, it is necessary to understand which areas are available for milk and grassland. This is because no map has been found in the literature showing the spatial distribution for milk production, i.e., the amount of milk produced on a grid-cell. Instead, a map for an area of grassland of 5′ × 5′ (arcminutes) has been used [49]. It is assumed that grassland is available for the production of milk and that there is a fixed relation between the area grassland (with enough rainfall) and the amount of milk produced. Regions with lower rainfall are assumed to have a lower milk production per ha. Areas with 800 mm rainfall or more are not constrained by too low rainfall, whereas in dryer areas production has been reduced to as low as 20% of the production at 800 mm. The total production of milk equivalents of the country is distributed among the grassland areas (accounting for lower production due to drought) with a resulting milk production map in which the sum of all grid cells equals the production reported by FAO [50]. Notably, water catchment maps, which may have impact on productivity, have not been identified and are therefore not included in the analyses.

Table 1.
Three highly consumed products domestically selected in Bangladesh, Kenya and Uganda [50].
Table 1.
Three highly consumed products domestically selected in Bangladesh, Kenya and Uganda [50].
| Country | Product 1 (Cons. Mkg) | Product 2 (Cons. Mkg) | Product 3 (Cons. Mkg) |
|---|---|---|---|
| Bangladesh | Rice and processed products (41,910) | Potatoes and processed potato products (8337) | Vegetables and crop-based products (3315) |
| Kenya | Maize and products (3874) | Milk equivalents * (4497) | Vegetables and crop-based products (1889) |
| Uganda | Plantains (3339) | Cassava and processed cassava products (2673) | Milk equivalents * (1951) |
* Milk equivalents for Kenya and Uganda are calculated based on FAO data, see estimates following Table 2.
Protected areas in the scenarios. The protected areas are not available for production of the consumed products and are therefore subtracted from the potential production areas in the Foodshed scenario maps. Hence, the protected areas are excluded from the Foodshed scenario maps following UNEP-WCMC and IUCN [51]. Because the protected areas can contain grassland, the grassland maps designed for spatial mapping of milk production are adjusted by excluding protected areas (assuming no milk produced in protected areas). Notably, land ownership in these areas is not taken into account in the scenario analyses.
2.4. Data on Food Production in Kenya, Uganda and Bangladesh
Selection of areas and crops. As part of the project Feeding cities and migration settlements, a project carried out at Wageningen University & Research (WUR), the Netherlands, research has been carried out in the three rural–urban areas around Dhaka in Bangladesh, Nairobi in Kenya and Kampala in Uganda. Different types of research have been conducted in these three areas since 2019 when the project started. They were selected as hotspot areas because: (1) rural–urban migration is extensive at present and expectedly so in future, (2) population growth is relatively high, (3) a large share of its population is impacted by poverty and food insecurity and (4) opportunities are available to build on already established networks, information and insights developed.
Selection of crops in each urban area. In order to select relevant crops to investigate in this study, FAO [50] statistic has been applied (see Table 1, Table 2 and Table 3 below). In each area, a total of three crops were selected which fit to the following criteria: (1) at present, a large amount consumed domestically among the low-income groups and (2) currently among the main domestically produced products in rural areas, supplying the urban population. Accordingly, the following selection of food products was made:
- Dhaka (Bangladesh)—(1) Rice and processed rise products (rice), (2) potatoes and processed potato products (potatoes) and (3) vegetables and crop-based products (vegetables);
- Nairobi (Kenya)—(1) Maize and processed maize products (maize), (2) milk equivalents (see Table 2) (milk) and (3) vegetables and crop-based products (vegetables);
- Kampala (Uganda)—(1) Plantains, (2) cassava and products (cassava) and (3) milk equivalents (see Table 2) (milk).
Table 2.
Milk equivalents include milk, butter, ghee and cream products domestically in Kenya and Uganda [50].
Table 2.
Milk equivalents include milk, butter, ghee and cream products domestically in Kenya and Uganda [50].
| Food (Mkg) | Production (Mkg) | |||||
|---|---|---|---|---|---|---|
| Milk | Butter (Ghee) | Cream | Milk | Butter, Ghee | Cream | |
| Kenya | 3867 | 16 | 23 | 4950 | 16 | 23 |
| Uganda | 1851 | 0 | 10 | 2040 | 0 | 0 |
Estimates of the total country populations. In this study, all maps have the same resolution, which makes it possible to combine data sources and perform spatial analyses. For the current population, demographic data were derived from Worldometers [52], stating that the population in Bangladesh was 164.69 million, in Kenya the population was 53.77 million and in Uganda the population was 45.74 million. Calibration of the population density map is performed for each country separately to ensure that the population of all grid-cells equals the most recent population figure. Maps for population density in 2020 and 2050 are applied based on Gao [53]. The projections of numbers of people are based on the GRUMP method [54]. For most countries subnational estimates of the population were used as the basis of the extrapolation from historical data, applying simple extrapolation methods [55]. Maps were re-projected to Lambert azimuthal equal-area projections into a plain surface with a resolution of 2.5 × 2.5 km per grid-cell (6.25 km2 or 625 hectares) [56].
Estimates of the urban populations. Shares of urban population are needed for calculating urbanisation. According to the World Urbanization Prospects [57], the share of the urban population of the total have been estimated for 2020, and projected for 2050. While in Bangladesh the share of urban population was found to be 38% in 2020 and 56% in 2050, for Kenya these shares were 28% and 44%, respectively. For Uganda, 18% was estimated to live in urban areas in 2020, whilst 32% was projected for 2050. The map for population density per km2 is used to divide the country in rural and urban regions such that the total number of people living in rural areas equals the share of rural population times the total population. The indication of rural into urban on the map is needed to define distinct consumption patterns during analysis. The longitude and latitude of the locations of the cities Dhaka, Nairobi and Kampala were also re-projected to Lambert azimuthal’s equal-area projection to make sure that these coincide with the other maps.
Selection of consumable products. For each of the countries, three main highly consumed products were identified. The selection of products is based on the consumption in Food Balance from FAO [50], element ‘Food’. For the selected products, the consumption in Bangladesh, Kenya and Uganda are provided in Table 1 in 1000 tonnes (Mkg).
Milk equivalents in Kenya and Uganda. The consumption data are defined by FAO [50] and refer to the total amount of the commodities available as human food. Data include commodities derived as a result of further processing. According to FAO, food from maize comprises the amount of maize, maize meal and any other products available for human consumption. Food from milk relates to the amounts of milk as such, as well as the fresh milk equivalent of dairy products [58].
For the calculation of milk consumption and production in Kenya and Uganda, additional data for the fresh milk equivalents were needed. Because the data are provided as “milk including butter”, the butter part was first excluded, and then added to a different data category for butter (more precisely referred to as Ghee). It is generally known that 25 kg milk is needed to produce one kg of butter [59]. For cream, it is known that you need 10 Kg milk to produce 1 kg Cream [60]. The estimated amount of milk equivalents is therefore calculated as ‘Milk—Excluding Butter’ + (‘Butter’ × 25 (kg milk needed to make butter) + ‘Cream’ × 10 (kg milk needed to produce cream)). Whereas the consumption of milk equivalents in Kenya and Uganda amounted 4497 Mkg and 1951 Mkg, respectively, the production of milk equivalent amounted 5580 Mkg and 2040 Mkg, respectively (Table 2).
Land use for production of selected products. To estimate the production area of the selected products, harvest area maps from Mapspam [35] are applied. The source data have a resolution of 5′ × 5′ (arc minutes), approximately 10 × 10 km grid-cell resolution. The maps are re-projected and transformed to Lambert azimuthal equal-area projection with a resolution of 2.5 × 2.5 km per grid-cell [56]. After transformation by means of GIS methods and tools, the Foodshed scenario maps for each crop used in this study coincide in terms of similarities in the map grid with the population density maps.
To convert into Foodshed scenario maps, the production of a specific crop is divided by total area in a country to find the average production intensity of a crop per ha. The area maps are used to create the Foodshed scenario maps of the three selected highly consumed products listed in Table 1. Data from FAO on element production are applied to define the Foodshed scenario maps [50]. For the selected countries and products, the production in Bangladesh, Kenya and Uganda are provided in Table 3 in 1000 tonnes (Mkg).
Table 3.
Production of the three highly consumed products in Bangladesh, Kenya and Uganda [50].
Table 3.
Production of the three highly consumed products in Bangladesh, Kenya and Uganda [50].
| Country | Product 1 (Mkg) | Product 2 (Mkg) | Product 3 (Mkg) |
|---|---|---|---|
| Bangladesh | Rice and processed products (54,416) | Potatoes and processed products (9744) | Vegetables and crop-based products (3572) |
| Kenya | Maize and processed products (4014) | Milk equivalents * (5580) | Vegetables and crop-based products (2081) |
| Uganda | Plantains (3450) | Cassava and processed products (2819) | Milk equivalents * (2040) |
* Milk equivalents are calculated from FAO data, see estimates following Table 2.
For creation of the Foodshed scenario maps, the data from FAO are combined with the production area distribution derived from the Mapspam maps [61]. In the final maps the sum of all grid-cells (2.5 km2) equals the FAO [50] domestic supply.
3. Results
3.1. Overall Results in Dhaka, Nairobi and Kampala
The increase in areas needed for producing domestically what is demanded in 2020 and 2050 of three selected main crops consumed in the respective cities Dhaka, Nairobi and Kampala, are shown in Table 4. This includes the selected products for Dhaka (rice, potato and vegetables), for Nairobi (maize, milk and vegetables) and for Kampala (plantain, cassava and milk). Note that the order of the products indicates the levels of demands and production.
Table 4.
Projections of the areas needed (km2) in 2020 and 2050 to supply projected increase in urban demand of selected core product in Bangladesh, Kenya and Uganda, given increase in yield/ha required, expected population growth, projected demand and supply potentials (Mtons), and radius.
In order to estimate the yield/ha in 2050, the same radius of 2020 is used to meet the extra demand in 2050 by increasing the yield/ha proportionally. In this scenario the areas are not expanding, but the increase in yield per hectare (i.e., amount demanded in 2050/area available in 2020). Because area is not changing for these estimates, they are also not included in the maps in Section 3.2.
Based on the yield/ha variables, the population estimates and the values of the column ‘Demand = supply’ (Mtons), the radius (km) and the area (km2) needed for producing enough to supply for the estimated demands for these products in 2020 and 2050, are listed in the table. The results for three main consumables for the three cities are further explained in separate analyses of the countries in the following.
3.2. Results for Dhaka, Bangladesh
For Dhaka, a total of six maps were designed and are presented in this section (Figure 2, Figure 3 and Figure 4). For each product, rice, potato and vegetables, a map for 2020 and one for 2050 were designed based on the figures provided in Table 4. In all figures, an increase in radius has been implemented.
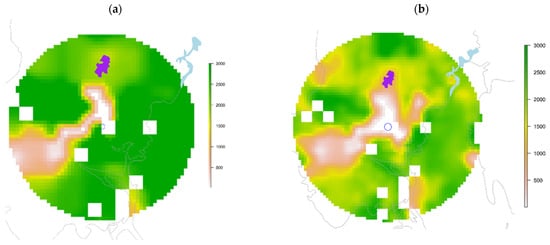
Figure 2.
Rice: Maps of Dhaka showing the difference in area needed (km2) to produce rice locally to supply the demands projected for 2020 (a) and 2050 (b). Purple refers to protected natinal parks. (a) Area needed (14,527 km2) to produce rice demands in Dhaka in 2020 (r = 68 km) (ton per grid-cell). (b) Area needed (23,779 km2) to produce rice demands in Dhaka in 2050 (r = 87 km) (ton per grid-cell).

Figure 3.
Potatoes: Maps of Dhaka showing the difference in area needed (km2) to produce potatoes locally to supply the demands projected for 2020 (a) and 2050 (b). Purple refers to protected natinal parks. (a) Area needed (20,358 km2) to produce potatoes demands in Dhaka in 2020 (r = 80 km) (ton per grid-cell). (b) Area needed (26,590 km2) to produce potatoes demands in Dhaka in 2050 (r = 92 km) (ton per grid-cell).
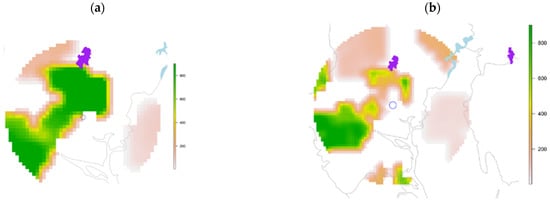
Figure 4.
Vegetables: Maps of Dhaka showing the difference in area needed (km2) to produce vegetables locally to supply the demands projected for 2020 (a) and 2050 (b). Purple refers to protected natinal parks. (a) Area needed (10,207 km2) to produce vegetables demands in Dhaka in 2020 (r = 57 km) (ton per grid-cell). (b) Area needed (21,904 km2) to produce vegetables demands in Dhaka in 2050 (r = 84 km) (ton per grid-cell).
To supply the populations of Dhaka, an increase of 64% in area from 2020 to 2050 is needed to supply rice, an increase of 30% in area is needed to supply potatoes and an increase of more than double (115%) in area is needed to supply vegetables. Note that the areas are not exclusive, implying that it is possible given the assumptions of the estimates to increase the production of all three products without having implications for other crops use of area. The differences in areas needed in 2020 and 2050 are illustrated on the six maps: Figure 2a,b shows the differences in area for rice, whereas Figure 3a,b shows the differences in area for potatoes and Figure 4a,b shows the difference in area needed for vegetables.
3.3. Results for Nairobi, Kenya
For Nairobi a total of six maps have been designed and are presented in this section (Figure 5, Figure 6 and Figure 7). For each product, maize, milk products and vegetables, a map for 2020 and one for 2050 were designed based on the figures provided in Table 4. In all figures, an increase in radius was implemented.
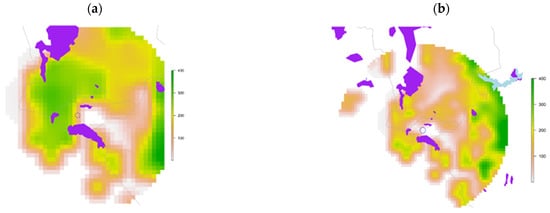
Figure 5.
Maize: Maps of Nairobi showing the difference in area needed (km2) to produce maize locally to supply the demands projected for 2020 (a) and 2050 (b). Purple refers to protected natinal parks. (a) Area needed (11,310 km2) to produce maize demands in Nairobi in 2020 (r = 60 km) (ton per grid-cell). (b) Area needed (21,124 km2) to produce maize demands in Nairobi in 2050 (r = 82 km) (ton per grid-cell).
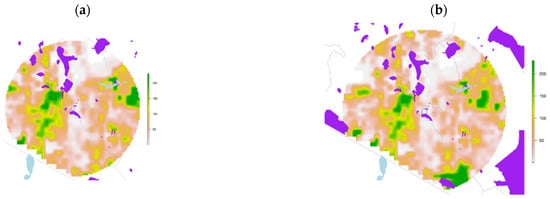
Figure 6.
Milk products: Maps of Nairobi showing the difference in area needed (km2) to produce milk products locally to supply the demands projected for 2020 (a) and 2050 (b). Purple refers to protected natinal parks. (a) Area needed (59,396 km2) to produce milk products demands in Nairobi in 2020 (r = 138 km) (ton per grid-cell). (b) Area needed (91,863 km2) to produce milk products demands in Nairobi in 2050 (r = 171 km) (ton per grid-cell).
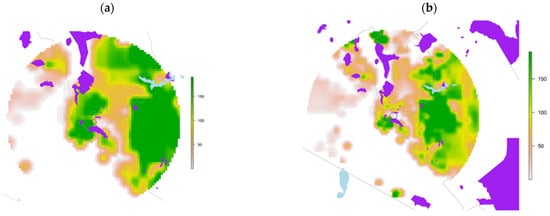
Figure 7.
Vegetables: Maps of Nairobi showing the difference in area needed (km2) to produce vegetables locally to supply the demands projected for 2020 (a) and 2050 (b). Purple refers to protected natinal parks. (a) Area needed (33,006 km2) to produce vegetables demands in Nairobi in 2020(r = 102 km) (ton per grid-cell). (b) Area needed (71,158 km2) to produce vegetables demands in Nairobi in 2050 (r = 150 km) (ton per grid-cell).
Whereas an increase of 87% in area is needed from 2020 to 2050 to supply maize to the population of Nairobi, the increase in area to supply milk products must be 55%, and in the case vegetables, more than double the area (116%) of 2020 will be needed. Note that the areas are not exclusive, implying that it is possible given the assumptions of the estimates to increase the production of all three products without implications for each other. The differences in areas are illustrated on the six maps; Figure 5 shows the differences in area for maize, Figure 6 shows the differences in area for milk products and Figure 7 shows the difference in area needed for vegetables.
3.4. Results for Kampala, Uganda
For Kampala a total of six maps have been designed and are presented in this section (Figure 8, Figure 9 and Figure 10). For each product, plantain, cassava and milk products, a map for 2020 and one for 2050 were designed based on the figures provided in Table 4. In all figures, an increase in radius was implemented.
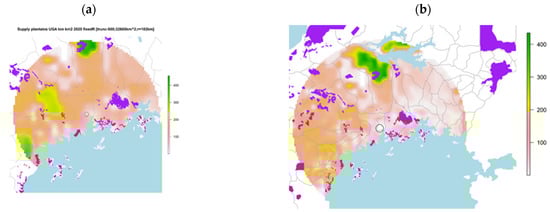
Figure 8.
Plantain: Maps of Kampala showing the difference in area needed (km2) to produce plantain locally to supply the demands projected for 2020 (a) and 2050 (b). Purple refers to protected natinal parks. (a) Area needed (32,685 km2) to produce plantain demands in Kampala in 2020 (r = 102 km) (ton per grid-cell). (b) Area needed (77,437 km2) to produce plantain demands in Kampala in 2050 (r = 157) (ton per grid-cell).
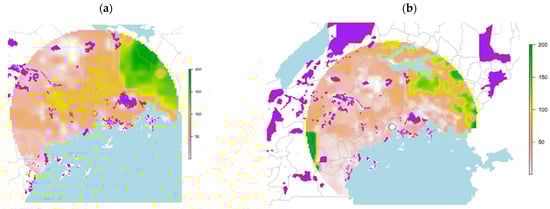
Figure 9.
Cassava: Maps of Kampala showing the difference in area needed (km2) to produce cassava locally to supply the demands projected for 2020 (a) and 2050 (b). Purple refers to protected natinal parks. (a) Area needed (44,488 km2) to produce cassava demands in Kampala in 2020 (r = 119 km) (ton per grid-cell). (b) Area needed (101,223 km2) to produce cassava demands in Kampala in 2050 (r = 180 km) (ton per grid-cell).
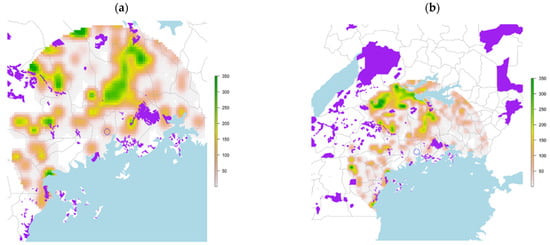
Figure 10.
Milk products: Maps of Kampala showing the difference in area needed (km2) to produce milk products locally to supply the demands projected for 2020 (a) and 2050 (b). Purple refers to protected natinal parks. (a) Area needed (36.0 × 1000 km2) to produce milk products demanded in Kampala in 2020 (ton per grid-cell). (b) Area needed (76.0 × 1000 km2) to produce milk products demanded in Kampala in 2050 (ton per grid-cell).
Whereas an increase in area from 2020 to 2050 is needed to supply demands of these products in Kampala, and more than double (137%) for plantain, this is also the case for the supply of cassava (127%) and supply of milk products (111%). The differences in areas are illustrated on the six maps: Figure 8 shows the differences in area for plantain, Figure 9 shows the differences in area for cassava and Figure 10 shows the difference in area needed for milk products.
4. Discussion
4.1. Discussion of the Results
In this article, estimates are provided of Foodshed scenario maps [30] informing of the potential sizes of areas needed to domestically sustain the increasing urban populations expected in 2020 and 2050 with core food products. In this period, extensive population growth and immigration into large cities are expected for Dhaka in Bangladesh, Nairobi in Kenya and Kampala in Uganda, and they are therefore relevant for illustrative Foodshed scenario maps to find theoretical extents to which self-sufficiency of core food products produced and consumed domestically can be obtained in these countries. Based on a set of assumptions, a series of Foodshed scenario maps inform of areas theoretically available for main domestic crops produced and consumed, for 2020 and 2050, and thus translate the demand of main crops into opportunities for areas close by cities to produce them. Note that the Foodshed scenario maps are based on land availability, and that other resources, such as water and energy availability, are not analysed.
The results (Areas 2020/2050, Table 4) show that in 2020, in Bangladesh, Kenya and Uganda, the total areas needed to produce all the three crops demanded in each country are estimated to be 45.1 km2, 103.7 km2 and 113.2 km2, respectively. In Bangladesh, the areas needed for producing rice, potatoes and vegetables in 2020 are 14.5 km2, 20.4 km2 and 10.2 km2, respectively. In Kenya, maize production requires a relatively small production area in 2020 (11.3 km2) to supply the citizens of Nairobi; however, milk and vegetables require more area (56.4 km2 and 33.0 km2, respectively). In Uganda, the estimated areas needed in 2020 for all three products are relatively high, with 32.7 km2 for plantain production, 44.5 km2 for cassava production and 36 km2 for milk production. Notably, this land is not necessarily available for production domestically due to ownership of farmers, but is an estimated equivalent to self-sufficiency to support the demand in 2020, given the specification of such scenario reported on in Section 2.3.
In order to judge whether the areas estimated are a lot or not, in Table 5, the estimated areas needed for food production in resource-driven traditional production systems at city levels for the three products projected for 2020 and 2050 are compared with the total population at the country level, as well as the total area of the respective countries. The figures show that the projected population for all three cities as a share of total country populations for both years range from 8 to 13%. Investigating the areas needed to feed the urban share of total population in all three countries, the shares of areas for the crop production, of total country areas, have been estimated. For Bangladesh, the areas needed are 30% of total country area in 2020 and 49% in 2050, whereas in Nairobi the areas needed are 18% of total country area in 2020 and 32% in 2050. In Uganda, the areas needed are 47% of total country area in 2020 and 106% in 2050, which is far beyond what the country can provide. In other words, it will become difficult to any of the three countries to produce enough food for all their inhabitants based on domestic supply of these core products alone.
Table 5.
Estimates of shares of area needed in Dhaka, Nairobi and Kampala relative to total population and total areas in the respective countries.
Looking at the figures in Table 5, it becomes evident that the areas needed are not available for domestic produce, foremost not for Uganda, but also not for the other countries. This is a warning in the line of Mc Carthy et al. [33] who notes that the proportion of people suffering from chronic hunger is currently about one billion people (16% of global population), and that before 2050 an increase by 70% of global food production is needed in already overexploited natural resources. Notably, in the projected Foodshed scenario maps in this study, limitations that can provide even more worrying results include that only three products are investigated, and landownership impacts have not been accounted for, while trade effects, new technologies, precision agriculture and shifts in future consumables are factors that are also not included, but which could potentially contribute positively.
Overall, based on the study results of the Foodshed scenario maps, it is possible to conclude that under a resource-driven approach with domestic production of food, food security cannot be met directly. Alternatively, if the areas stay fixed, the increase in productivity of cultivation per area must contribute to supply the increase in demands in 2050. This is indicated by the results showing the yield/ha increase required (Table 4). In Bangladesh, Dhaka, such an increase in productivity to supply rice is 64%, the increase in productivity to supply potatoes is 30% and the increase in productivity needed to supply vegetables is more than double (115%). In Kenya, the increase in productivity to supply maize to the estimated future urban populations in Nairobi is 87%, the increase in productivity to supply milk products is 55% and the increase in productivity needed to supply vegetables is more than double (116%). In Uganda, the increase in productivity needed to supply the urban population in Kampala in 2050 must be more than doubled for all three crops, including for supply of plantain (137%), supply of cassava (127%) and supply of milk products (111%).
4.2. Discussion of Food System Implications
No study can cover the whole rural–urban food system dynamics and this is far from the intention in this study. In particular, the Foodshed scenario analyses intend to contribute with insights that can support decision to be made now to prepare for ensuring fair transitioning towards a sustainable food system in future [64]. The motivation to estimate the Foodshed analyses is based on the past, including changing implications of socio-economic and environmental drivers, such as impacts of the Ukrainian war [11,12], climate change [19,21,22], as well food accessibility, food stability and food utilization [4]. It can thus be seen as an intervention during a food system transition that can enhance future food system sustainability and resiliency. Hence, ensuring fair and sustainable transitioning of current food systems towards a zero-hunger situation in future requires analyses beyond the estimated scenarios in this study. From a rural–urban food system approach [8], relevant discussion themes include social inclusiveness and climate related drivers, such as: (1) levels of accessibilities and affordability by low-income groups such as consumers living in informal settlements and small-scale farmers, (2) improvements of institutional contexts, including international trade developments and land ownership, and (3) accessibility, accessibility and utilization of climate adaptive technologies and future diets.
First, social inclusiveness can be addressed by the levels of accessibilities and affordability food, availability for future supply and demand of basic crops as well as the issues of fair and sustainable transitioning. Low-income producers, including small-scale farmers, as well as the low-income consumers, often living in informal settlements in urban and semi-urban areas, are among the most vulnerable groups to future food insecurity [65,66]. According to ILO [67], in Bangladesh, informal employment constitutes a total of 89% of total employment, and within the agricultural sector, the share is as high as 97.7%. In sub-Saharan countries, including Kenya and Uganda, the total share of the employment is 91.6% of total, including the agricultural sector [67]. A large share of the low-income groups in low-income countries are supported by affordable and accessible agricultural products, supplied cheaply by the local small-scale farmers. As such they are, under very unfair conditions, solving major world challenges of zero hunger on a daily basis for millions of people.
Second, international trade developments stress the vulnerability of dependencies of trade of grain and fuel in the developing world, as well as many other countries because low-income groups are socially excluded [68]. Of main agricultural import products, according to the FAO [50], for all three countries, the most imported product categories are: wheat and wheat products (4842 thousand tonnes, 1816 thousand tonnes and 669 thousand tonnes in Bangladesh, Kenya and Uganda, respectively), followed by sugar (raw equivalent) (1932 thousand tonnes) and maize and maize products (1747 thousand tonnes) in Bangladesh, rice and rice products (929 thousand tonnes) and palm oil (764 thousand tonnes) in Kenya and palm oil (343 thousand tonnes) and sugar (raw equivalent) (188 thousand tonnes) in Uganda. While the imports extensively supply the upper income levels, these products are often too expensive and not affordable and accessible to the slum inhabitants in urban settlements, among other low-income groups, and thus not socially inclusive.
According to FAO [50], the main agricultural exported product categories on a yearly basis in Bangladesh are fruits and fruit products (94 thousand tonnes), sweeteners (46 thousand tonnes) and crustaceans (43 thousand tonnes). Whereas in Kenya, tea (503 thousand tonnes), pineapples and pineapple products (163 thousand tonnes) and vegetables and vegetable products (133 thousand tonnes) were the largest agricultural export categories, in Uganda, they were maize and maize products (531 thousand tonnes), coffee and coffee products (252 thousand tonnes) and beans (232 thousand tonnes). Notably, the earnings from export are not necessarily benefitting the small-scale farmers. For instance, in Kenya, the small-scale farmers are contributing a large share through contract farming with multinationals with exports of tea, which is disadvantageous to local farmers because of many reasons [69]. Because the contracts are unfavourable to the local farmers, currently the national government is looking for reforms to enhance the conditions under which the small-scale farmers are operating. The blooming flower industry is large both in Uganda and Kenya, and employ 100,000 nds of people [70,71]. Investors and business operators are often foreign. Notably, foreign landowners are often producing these products and owning the land, and although the earnings are taken into account in the national GDP, the small-scale farmers are losing high-producing land and opportunities for income. Consequentially, access to land is problematic with relatively small farms, and agriculture generates very little income, and it is therefore very difficult for a farmer to emerge from poverty [72]. The export industry cannot therefore not be regarded as socially inclusive.
Third, technological developments worldwide are providing hope for food security in future, which simultaneously may encourage social inclusiveness and climate adaptive strategies. For instance, precision agriculture can maximize outputs which are minimizing inputs, such as labour, water, land and feed [73]. A positive example has been reported for floating hydroponics not vulnerable to flooding, targeting small-scale farmers in Bangladesh, and providing a sustainable alternative to sustainable farming [74]. While this is judged a good practice case, it has not been inclusive to the Bangladeshi farmers, who mostly are not aware of this opportunity (ibid.). Note that one of the competitive advantages of low-income countries are their provision of highly qualified, large quantities of employment. High tech often replaces labour forces [75]. Moreover, to date it has been shown that investments in high-tech equipment is not affordable to small holders, and often cultural context-specific conditions are not taken into account when investments are made by government or foreign investors, resulting in exclusion of the local small-scale farmers [76]. Moreover, the products are often not targeting the informal settlements, and are not as such affordable and accessible to the low-income groups. Technology development as of today can therefore not be judged socially inclusive.
An interesting adjustment may be that future diets may change, including larger shares of, for instance, microalgae and insects in our food products and feed [77]. Insect as food is promising for dealing with the reduction in the world’s food resources [78]. The insect black soldier fly larvae (BSFL) is suitable for feed for poultry, pigs and aquaculture [77]. Spirulina is an example of microalgae which is currently being developed for aquaculture feed. The insect-based aquaculture feed is currently being scaled in Kenya [79]. Improved fish feed has been shown to directly reduce poverty among small-scale fish farmers [80]. It is thus argued that globally, insects have the potential to serve as a food and feed source with a lower negative impact on the environment [78]. This is a good example of a climate adaptive strategy that is also socially inclusive.
5. Concluding Remarks and Follow-Ups
Following the warning that a 70% increase in global food production is needed to supply the world population in 2050 [33], it is of relevance to investigate whether domestic production of core consumable products can solve the urgencies of sustainably and fairly feeding the world in 2050. In this article, the main aim is to estimate spatial foodsheds and theoretical self-sufficiency for food production needed to supply increasing future populations in a selection of the large cities Dhaka, Nairobi and Kampala, in the countries Bangladesh, Kenya and Uganda, respectively.
Foodshed scenario analyses [30] have been applied to estimate the self-sufficiency of three core food products consumed and produced in each country for 2020 and 2050. The projected demands in 2050 of core consumables in Bangladesh, Kenya and Uganda are thus used to estimate potential areas needed domestically to produce them. The results show that domestic production cannot alone solve the urgency of food security in future due to shortage of suitable areas (see Figure 2, Figure 3, Figure 4, Figure 5, Figure 6, Figure 7, Figure 8, Figure 9 and Figure 10). Estimates show that in 2020 and in 2050, the share of the total country populations living in the three cities ranges from 8 to 13%. In comparison, the areas needed to supply the demands of the core products, as shares of total country areas, are shown to be higher. Most critical is the situation in Uganda, for which the needs of land to supply the consumers of Kampala with plantains, cassava and milk products in 2050, as a share of the total country area, are: 47% in 2020 and 106% in 2050, for which milk products alone would require more than the country area can provide. In Bangladesh, the areas needed to supply the consumers of Dhaka with rice, potato and vegetables, as a share of total country area, are: 30% in 2020 and 49% in 2050, whereas in Kenya the areas needed as a share of total country area to supply the consumers of Nairobi with maize, milk products and vegetables are: 18% in 2020 and 32% in 2050. The spatial Foodshed analysis is a resource-driven approach applied in this study, which could have been expanded from focusing solely on area availability to analyses investigating water and energy availabilities, which are critically important resources. Note that taking account of water and energy restrictions, as well as landownership, regulations and future plans of the city regions, would have set even sharper limitations on domestic food production opportunities than what is estimated in this study.
In this study, focus is on the SDG2: Zero hunger and SDG11: Sustainable cities and communities, particularly reflecting on the opportunities for food security in 2050, while ensuring a fair transitioning and inclusive transition pathway for low-income groups. The food system approach is used to discuss the social inclusion issue in particular, which is part of complex relationships, and linked with socio-economic drivers of urbanization, population growth, trade distractions and the political environment, as well as the climate drivers. A tremendous challenge exists in ensuring inclusiveness of the consumers in informal settlements in urban areas and the small-scale farm producers in the rural areas across developing and emerging countries worldwide.
To solve the problem of area shortage domestically, it is evident that dependencies on international trade will increase in future [68]. For developing and emerging countries with large shares of low-income groups, the risk of social exclusion from accessing imported products is large, given high price levels targeting the formal sector of high-income groups [69]. While a large share of the city inhabitants will live in informal settlements, they will have only access to low priced products [72]. At the same time, large shares of the agricultural areas are already claimed by multinationals or foreign investors who contribute to national GDPs, but do not offer employment for a large share of the population, nor affordable and accessible food for the low-income groups. Social inclusion of low-income groups in developing countries is thus a challenge for taking part in the global economy.
Landownership has over the years been the solution to food security for large shares of small-scale farmers and their families. The increased foreign investments in land and the subdivision of land resulting in ever smaller pieces of land by every generational shift in ownership are both contributing to unfair transitioning [81], and thus social exclusion of low-income groups. It is recommended to further investigate the role of land ownership through reaching fair transitioning processes towards increased food security in future.
Besides international trade, future can be confronted with new creative solutions that not only benefit food security but ensure climate emission is minimized. Although high technology often is too expensive and not accessible to low-income groups in developing and emerging countries [76], developments in making them affordable may make a turn in future. Examples include a floating hydroponics system in Bangladesh that is affordable to small-scale farmers which adapts to flooding caused by climate change [74], as well as Recirculation Aquaculture Systems (RAS), which currently circulate water while escalating fish production per m3 in advanced high-tech constructions [82]. Note that currently, affordable RAS are designed at low prices, targeting the small-scale fish farmers in Kenya. Another development favourable to deal with climate change and food security is the replacement of meat consumption with other protein sources such as insects [78], but also replacing soya with insects in feed will have a great effect on area availability for food security purposes [77]. Further investigations are needed to find opportunities for affordability and accessibilities of advantageous technologies to low-income producers and consumers, and thus enhancing social inclusion as a socio-economic driver in the food system.
Fair transitioning towards the SDGs is a possibility given that trade, technological development and changing consumer behaviour meet the criteria of affordability and accessibility to low-income groups in informal settlements in ever-growing cities, as well as favourability and acknowledgements to small-scale farmers who currently are the main suppliers of food to feed the hungry around the world.
Author Contributions
This paper was compiled and written by K.S., with inputs from all co-authors. While W.H. contributed with all the maps and inputs in the analyses and tests, S.v.B. contributed with supervision and contributions to the analyses and writing. All authors were involved in the research design and paper conceptualization. All authors have read and agreed to the published version of the manuscript.
Funding
The Wageningen University & Research Programme on “Food Security and Valuing Water” that is supported by the Dutch Ministry of Agriculture, Nature and Food Security, in two projects called “Food and Nutrition security for low-income groups in the rural–urban food systems in the global south” (2282700641) and “Feeding cities and migration settlements” (2282700540).
Data Availability Statement
In the analyses, a series of open data sources have been used, provided online by among other: FAO, and the World Bank (see reference list).
Acknowledgments
The authors would like to acknowledge the Wageningen University & Research Programme on “Food Security and Valuing Water” that is supported by the Dutch Ministry of Agriculture, Nature and Food Security, in two projects called “Food and Nutrition security for low-income groups in the rural–urban food systems in the global south” (2282700641) and “Feeding cities and migration settlements” (2282700540).
Conflicts of Interest
The authors declare no conflict of interest.
References
- Müller, B.; Hoffmann, F.; Heckelei, T.; Müller, C.; Hertel, T.W.; Polhill, J.G.; van Wijk, M.; Achterbosch, T.; Alexander, P.; Brown, C.; et al. Modelling food security: Bridging the gap between the micro and the macro scale. Glob. Environ. Chang. 2020, 63, 102085. [Google Scholar] [CrossRef]
- Graef, F.; Sieber, S.; Mutabazi, K.; Asch, F.; Biesalski, H.K.; Bitegeko, J.; Bokelmann, W.; Bruentrup, M.; Dietrich, O.; Elly, N.; et al. Framework for participatory food security research in rural food value chains. Glob. Food Secur. 2014, 3, 8–15. [Google Scholar] [CrossRef]
- FAO. An Introduction to the Basic Concepts of Food Security; UN, FAO: Rome, Italy, 1996; pp. 1–3. Available online: https://www.fao.org/3/al936e/al936e00.pdf (accessed on 20 October 2021).
- Ziervogel, G.; Ericksen, P.J. Adapting to climate change to sustain food security. Wiley Interdiscip. Rev. Clim. Chang. 2010, 1, 525–540. [Google Scholar] [CrossRef]
- USAID. Global Food Security Response: West Africa Rice Value Chain Analysis; MicroReport 161; USAID: Washington, DC, USA, 2009; pp. 1–83. Available online: https://www.marketlinks.org/sites/default/files/resource/files/GFSR_WA_Rice_VC_Analysis.pdf (accessed on 20 October 2021).
- de Bruin, S.; Dengerink, J.; van Vliet, J. Urbanisation as driver of food system transformation and opportunities for rural livelihoods. Food Secur. 2021, 13, 781–798. [Google Scholar] [CrossRef] [PubMed]
- de Rooij, B.; Tabeau, E.; Soma, K.; van Scheltinga, C.T.; Kuiper, M.; Verma, M.; Stuiver, M. The ‘Water, Food, Energy and Ecosystem Nexus’ and Migration: An Explorative Study of Key Drivers of Migration Flows and Their Impacts; No. 2981; Wageningen Environmental Research: Wageningen, The Netherlands, 2020; p. 58. [Google Scholar]
- van Berkum, S.; Broeze, J.; Herens, M.; de Rooij, B.; Soma, K.; Roosendaal, L. Urbanisation, Migration and Food System Transformations: Concepts and Methodologies for a Better Understanding of the Dynamics of Urban Food Systems and Migration Settlements; REPORT 2020-046; Wageningen University and Research, Wageningen Economic Research: The Hague, The Netherlands, 2020; p. 34. [Google Scholar]
- FAO; IFAD; UNICEF; WFP; WHO. The State of Food Security and Nutrition in the World 2022; Repurposing Food and Agricultural Policies to Make Healthy Diets More Affordable; FAO: Rome, Italy, 2022; pp. 1–260. [Google Scholar] [CrossRef]
- Mbow, C.; Rosenzweig, C.; Barioni, L.G.; Benton, T.G.; Herrero, M.; Krishnapillai, M.; Liwenga, E.; Pradhan, P.; Rivera-Ferre, M.-G.; Sapkota, T.; et al. Food Security. In IPCC Special Report on Climate Change and Land; IPCC: Geneva, Switzerland, 2019; p. 105. [Google Scholar] [CrossRef]
- Hunter, R. The Ukraine Crisis: Why and what now? Survival 2022, 64, 7–28. [Google Scholar] [CrossRef]
- Izzeldin, M.; Muradoğlu, Y.G.; Pappas, V.; Petropoulou, A.; Sivaprasad, S. The impact of the Russian-Ukrainian war on global financial markets. Int. Rev. Financ. Anal. 2023, 87, 102598. [Google Scholar] [CrossRef]
- Gutiérrez-Moya, E.; Adenso-Díaz, B.; Lozano, S. Analysis and vulnerability of the international wheat trade network. Food Secur. 2021, 13, 113–128. [Google Scholar] [CrossRef]
- Zhong, W.; An, H.; Shen, L.; Fang, W.; Gao, X.; Dong, D. The roles of countries in the international fossil fuel trade: An energy and network analysis. Energy Policy 2017, 100, 365–376. [Google Scholar] [CrossRef]
- Wang, W.; Fan, L.W.; Zhou, P. Evolution of global fossil fuel trade dependencies. Energy 2022, 238, 121924. [Google Scholar] [CrossRef]
- Hasegawa, T.; Fujimori, S.; Havlík, P.; Valin, H.; Bodirsky, B.L.; Doelman, J.C.; Fellmann, T.; Kyle, P.; Koopman, J.F.L.; Lotze-Campen, H.; et al. Risk of increased food insecurity under stringent global climate change mitigation policy. Nat. Clim. Chang. 2018, 8, 699–703. [Google Scholar] [CrossRef]
- Kansiime, M.K.; Tambo, J.A.; Mugambi, I.; Bundi, M.; Kara, A.; Owuor, C. COVID-19 implications on household income and food security in Kenya and Uganda: Findings from a rapid assessment. World Dev. 2021, 137, 105199. [Google Scholar] [CrossRef] [PubMed]
- Ruszczyk, H.A.; RaHMan, M.F.; Bracken, L.J.; Sudha, S. Contextualizing the COVID-19 pandemic’s impact on food security in two small cities in Bangladesh. Environ. Urban. 2021, 33, 239–254. [Google Scholar] [CrossRef]
- Kogo, B.K.; Kumar, L.; Koech, R. Climate change and variability in Kenya: A review of impacts on agriculture and food security. Environ. Dev. Sustain. 2021, 23, 23–43. [Google Scholar] [CrossRef]
- FAO. The Future of Food and Agriculture—Alternative Pathways to 2050; FAO: Rome, Italy, 2018; pp. 1–224. Available online: http://www.fao.org/3/I8429EN/i8429en.pdf (accessed on 20 October 2021).
- Zimmermann, A.; Rapsomanikis, G. Trade and sustainable food systems. In Science and Innovations for Food Systems Transformation; Springer: Berlin/Heidelberg, Germany, 2023; pp. 685–709. [Google Scholar]
- FAO. The State of Agricultural Commodity Markets 2018. Agricultural Trade, Climate Change and Food Security; FAO: Rome, Italy, 2018; pp. 1–112. Available online: http://www.fao.org/3/I9542EN/i9542en.pdf (accessed on 20 October 2021).
- Blekking, J.; Waldman, K.; Tuholske, C.; Evans, T. Formal/informal employment and urban food security in Sub-Saharan Africa. Appl. Geogr. 2020, 114, 102131. [Google Scholar] [CrossRef]
- Moustier, P.; Holdsworth, M.; Anh, D.T.; Seck, P.A.; Renting, H.; Caron, P.; Bricas, N. The diverse and complementary components of urban food systems in the global South: Characterization and policy implications. Glob. Food Secur. 2023, 36, 100663. [Google Scholar] [CrossRef]
- Vorley, B. Meeting Small-Scale Farmers in Their Markets: Understanding and Improving the Institutions and Governance of Informal Agrifood Trade; International Institute for Environment and Development (IIED): London, UK, 2013; pp. 1–30. [Google Scholar]
- van Berkum, S.; Dengerink, J.; Ruben, R. The Food Systems Approach: Sustainable Solutions for a Sufficient Supply of Healthy Food; Memorandum 2018-064; Wageningen Economic Research: Wageningen, The Netherlands, 2018; p. 34. [Google Scholar]
- Gregory, P.J.; Ingram, J.S.I.; Brklacich, M. Climate change and food security. Philos. Trans. R. Soc. B Biol. Sci. 2005, 360, 2139–2148. [Google Scholar] [CrossRef]
- De Steenhuijsen Piters, B.; Termeer, E.; Bakker, D.; Fonteijn, H.; Brouwer, H. Food System Resilience: Towards a Joint Understanding and Implications for Policy; Wageningen Economic Research, Wageningen University and Research: Wageningen, The Netherlands, 2021; p. 12. [Google Scholar]
- Fantini, A. Urban and peri-urban agriculture as a strategy for creating more sustainable and resilient urban food systems and facing socio-environmental emergencies. Agroecol. Sustain. Food Syst. 2023, 47, 47–71. [Google Scholar] [CrossRef]
- Zasada, I.; Schmutz, U.; Wascher, D.; Kneafsey, M.; Corsi, S.; Mazzocchi, C.; Monaco, F.; Boyce, P.; Doernberg, A.; Sali, G.; et al. Food beyond the city—Analysing foodsheds and self-sufficiency for different food system scenarios in European metropolitan regions. City Cult. Soc. 2019, 16, 25–35. [Google Scholar] [CrossRef]
- Falkendal, T.; Otto, C.; Schewe, J.; Jägermeyr, J.; Konar, M.; Kummu, M.; Watkins, B.; Puma, M.J. Grain export restrictions during COVID-19 risk food insecurity in many low-and middle-income countries. Nat. Food 2021, 2, 11–14. [Google Scholar] [CrossRef]
- de Graaff, J.; Kessler, A.; Nibbering, J.W. Agriculture and food security in selected countries in Sub-Saharan Africa: Diversity in trends and opportunities. Food Secur. 2011, 3, 195–213. [Google Scholar] [CrossRef]
- Mc Carthy, U.; Uysal, I.; Badia-Melis, R.; Mercier, S.; O’Donnell, C.; Ktenioudaki, A. Global food security–Issues, challenges and technological solutions. Trends Food Sci. Technol. 2018, 77, 11–20. [Google Scholar] [CrossRef]
- Mekonnen, D.A.; Termeer, E.; Soma, K.; van Berkum, S.; de Steenhuijsen Piters, B. How to Engage Informal Midstream Agribusiness in Enhancing Food System Outcomes: What We Know and What We Need to Know Better; No. 2022-034; Wageningen Economic Research: Wageningen, The Netherlands, 2022; p. 38. Available online: https://edepot.wur.nl/567791 (accessed on 4 May 2022).
- Soma, K.; Obwanga, B.; Kanyuguto, C.M. A New Rural-Urban Fish Food System was Established in Kenya–Learning from Best Practices. Sustainability 2021, 13, 7254. [Google Scholar] [CrossRef]
- Herrero, M.; Thornton, P.K.; Mason-D’Croz, D.; Palmer, J.; Bodirsky, B.L.; Pradhan, P.; Barrett, C.B.; Benton, T.G.; Hall, A.; Pikaar, I.; et al. Articulating the effect of food systems innovation on the Sustainable Development Goals. Lancet Planet. Health 2021, 5, e50–e62. [Google Scholar] [CrossRef]
- Eyhorn, F.; Müller, A.; Reganold, J.P.; Frison, E.; Herren, H.R.; Luttikholt, L.; Mueller, A.; Sanders, J.; El-Hage Scialabba, N.; Seufert, V.; et al. Sustainability in global agriculture driven by organic farming. Nat. Sustain. 2019, 2, 253–255. [Google Scholar] [CrossRef]
- Niggli, U.; Sonnevelt, M.; Kummer, S. Pathways to advance agroecology for a successful transformation to sustainable food systems. In Science and Innovations for Food Systems Transformation; Springer International Publishing: Cham, Switzerland, 2023; pp. 341–359. [Google Scholar]
- HLPE. Food Losses and Waste in the Context of Sustainable Food Systems; A Report by the High Level of Experts on Food Security and Nutrition of the Committee on World Food Security; HLPE: Rome, Italy, 2014; p. 117. [Google Scholar]
- Berkhout, E.; Sovová, L.; Sonneveld, A. The Role of Urban–Rural Connections in Building Food System Resilience. Sustainability 2023, 15, 1818. [Google Scholar] [CrossRef]
- Mora, O.; Le Mouël, C.; de Lattre-Gasquet, M.; Donnars, C.; Dumas, P.; Réchauchère, O.; Brunelle, T.; Manceron, S.; Marajo-Petitzon, E.; Moreau, C.; et al. Exploring the future of land use and food security: A new set of global scenarios. PLoS ONE 2020, 15, e0235597. [Google Scholar] [CrossRef]
- Baker, P.; Machado, P.; Santos, T.; Sievert, K.; Backholer, K.; Hadjikakou, M.; Russell, C.; Huse, O.; Bell, C.; Scrinis, G.; et al. Ultra-processed foods and the nutrition transition: Global, regional and national trends, food systems transformations and political economy drivers. Obes. Rev. 2020, 21, e13126. [Google Scholar] [CrossRef] [PubMed]
- de Rooij, L.L.; Verweij, P.; Agricola, H. Feeding Cities and Migration: Urban Food Systems in a Spatial Environmental Perspective; No. 3002; Wageningen Environmental Research: Wageningen, The Netherlands, 2020; p. 56. Available online: https://edepot.wur.nl/520018 (accessed on 5 March 2021).
- Hodson de Jaramillo, E.; Niggli, U.; Kitajima, K.; Lal, R.; Sadoff, C. Boost Nature-Positive Production. In Science and Innovations for Food Systems Transformation; Springer International Publishing: Cham, Switzerland, 2023; pp. 319–340. [Google Scholar]
- Termeer, E.E.; Soma, K.; Motovska, N.; Ayuya, O.I.; Kunz, M.; Koster, T. Sustainable Development Ensued by Social Capital Impacts on Food Insecurity: The Case of Kibera, Nairobi. Sustainability 2022, 14, 5504. [Google Scholar] [CrossRef]
- Blay-Palmer, A.; Santini, G.; Dubbeling, M.; Renting, H.; Taguchi, M.; Giordano, T. Validating the city region food system approach: Enacting inclusive, transformational city region food systems. Sustainability 2018, 10, 1680. [Google Scholar] [CrossRef]
- Hennen, W.H.G.J.; Daane, P.A.; Van Duijvendijk, K. Global-Detector; GIS- and Knowledge-based tool for a global detection of the potential for production, supply and demand. In Proceedings of the 3rd International Conference on Geographical Information Systems Theory, Applications and Management, Porto, Portugal, 27–28 April 2017; pp. 161–168. Available online: https://www.wur.nl/en/Publication-details.htm?publicationId=publication-way-353333353634 (accessed on 5 December 2021).
- Hennen, W.H.; Diogo, V.; Polman, N.B.; Dijkshoorn-Dekker, M.W. Comparing cities of the world according to their food security risks and opportunities. WIT Trans. Ecol. Environ. 2018, 217, 953–962. [Google Scholar]
- Earthstat. Grassland Map. 2000. Available online: http://www.earthstat.org/data-download/ (accessed on 22 October 2021).
- FAO. Food Balance. 2021. Available online: https://www.fao.org/faostat/en/#data/FBS (accessed on 20 October 2021).
- UNEP-WCMC; IUCN. Protected Planet: The World Database on Protected Areas (WDPA) and World Database on Other Effective Area-based Conservation Measures (WD-OECM); UNEP-WCMC; IUCN: Cambridge, UK, 2021; Available online: www.protectedplanet.net (accessed on 22 October 2021).
- Worldometers. Demographics. 2021. Available online: https://www.worldometers.info/ (accessed on 22 October 2021).
- Gao, J. Downscaling Global Spatial Population Projections from 1/8-Degree to 1-km Grid Cells; No. NCAR/TN-537+STR; NCR/UCR: Boulder, CO, USA, 2017; pp. 1–14. [Google Scholar] [CrossRef]
- CIESIN. Global Rural-Urban Mapping Project (GRUMP), Version 1; Palisades, (Center for International Earth Science Information Network, Columbia University); NASA Socioeconomic Data and Applications Center (SEDAC): New York, NY, USA, 2011; Available online: http://sedac.ciesin.columbia.edu/data/collection/grump-v1 (accessed on 14 May 2022).
- Balk, D.; Brickman, M.; Anderson, B.; Pozzi, F.; Yetman, G. Mapping Global Urban and Rural Population Distributions: Estimates of Future Global Population Distribution to 2015; FAO Working Paper: Environment and Natural Resources; FAO: Rome, Italy, 2005; pp. 1–83. Available online: https://www.fao.org/3/A0310E/a0310e.pdf (accessed on 20 October 2021).
- Lambert Azimuthal Equal-Area Projection. Available online: http://wiki.gis.com/wiki/index.php/Lambert_azimuthal_equal-area_projection (accessed on 14 May 2022).
- UN (United Nations, Department of Economic and Social Affairs, Population Division). World Urbanization Prospects: The 2018 Revision (ST/ESA/SER.A/420); UN: New York, NY, USA, 2019; pp. 1–126. Available online: https://population.un.org/wup/publications/Files/WUP2018-Report.pdf (accessed on 22 October 2021).
- OECD; FAO. Dairy and dairy products. In Agricultural Outlook 2019–2028; OECD: Paris, France; FAO: Rome, Italy, 2019; Chapter 7; pp. 180–189. Available online: https://www.fao.org/3/CA4076EN/CA4076EN_Chapter7_Dairy.pdf (accessed on 20 October 2021).
- Bereda, A.; Yilma, Z.; Nurfeta, A. Handling, processing and utilization of milk and milk products in Ezha district of the Gurage zone, Southern Ethiopia. J. Agric. Biotechnol. Sustain. Dev. 2013, 5, 91. [Google Scholar] [CrossRef]
- Oldenburg Professional. Available online: https://www.oldenburger-professional.com/from-chef-to-chef/faqs/how-much-milk-is-required-to-produce-1kg-of-cream (accessed on 14 May 2022).
- Mapspam. SPAM 2010 v2.0 Global Data, 2010, Updated 2020-07-15. Available online: https://www.mapspam.info/data/ (accessed on 20 October 2021).
- Worldbank. Rural Population (% of Total Population). 2021. Available online: https://data.worldbank.org/indicator/SP.RUR.TOTL.ZS (accessed on 20 October 2021).
- World Bank. Data. 2023. Available online: https://data.worldbank.org/indicator/ (accessed on 20 October 2021).
- Nechifor, V.; Ramos, M.P.; Ferrari, E.; Laichena, J.; Kihiu, E.; Omanyo, D.; Musamali, R.; Kiriga, B. Food security and welfare changes under COVID-19 in Sub-Saharan Africa: Impacts and responses in Kenya. Glob. Food Secur. 2021, 28, 100514. [Google Scholar] [CrossRef] [PubMed]
- Mekonnen, D.A.; Soma, K.; Ruben, R. The ambivalent links between internal migration and food security in Uganda. Migr. Dev. 2022, 11, 917–936. [Google Scholar] [CrossRef]
- Soma, K.; Cornelia Johanna Janssen, V.; Ayuya, O.I.; Obwanga, B. Food Systems in Informal Urban Settlements—Exploring Differences in Livelihood Welfare Factors across Kibera, Nairobi. Sustainability 2022, 14, 11099. [Google Scholar] [CrossRef]
- ILO. Women and Men in the Informal Economy—A Statistical Picture, 3rd ed.; International Labour Office (ILO): Geneva, Switzerland, 2018; p. 164. Available online: https://www.ilo.org/wcmsp5/groups/public/---dgreports/---dcomm/documents/publication/wcms_626831.pdf (accessed on 4 December 2021).
- Erenstein, O.; Jaleta, M.; Mottaleb, K.A.; Sonder, K.; Donovan, J.; Braun, H.J. Global trends in wheat production, consumption and trade. In Wheat Improvement: Food Security in a Changing Climate; Springer International Publishing: Cham, Switzerland, 2022; pp. 47–66. [Google Scholar]
- Monroy, L.; Mulinge, W.; Witwer, M. Analysis of incentives and disincentives for tea in Kenya. Gates Open Res. 2019, 3, 586. [Google Scholar]
- Adeola, O.; Meru, A.K.; Kinoti, M.W. Kenya’s blooming flower industry: Enhancing global competitiveness. In Africa’s Competitiveness in the Global Economy; Palgrave Macmillan: Cham, Switzerland, 2018; pp. 331–349. [Google Scholar]
- Ksoll, C.; Macchiavello, R.; Morjaria, A. Guns and Roses: Flower Exports and Electoral Violence in Kenya. Global Poverty Research Lab Working Paper, UK. 2021, pp. 17–102. Available online: https://gala.gre.ac.uk/id/eprint/31358/1/31358_KSOLL_Guns_and_roses_Flower_exports_and_electoral_violence_in_Kenya.pdf (accessed on 4 December 2021).
- Angélique, N.C.; Stany, V.; Lebailly, P.; Azadi, H. Agricultural Development in the Fight against Poverty: The Case of South Kivu, DR Congo. Land 2022, 11, 472. [Google Scholar] [CrossRef]
- Amusan, L.; Oyewole, S. Precision agriculture and the prospects of space strategy for food security in Africa. Afr. J. Sci. Technol. Innov. Dev. 2022, 1–12. [Google Scholar] [CrossRef]
- Saha, S.K. Soilless Cultivation for Landless People: An Alternative Livelihood Practice through Indigenous Hydroponic Agriculture in Flood-Prone Bangladesh; Ritsumeikan Asia Pacific University: Beppu, Japan, 2010; pp. 1–14. Available online: https://en.apu.ac.jp/rcaps/uploads/fckeditor/publications/journal/RJAPS_V27_Saha.pdf (accessed on 4 December 2021).
- Djoumessi, Y.F. New trend of agricultural productivity growth in sub-Saharan Africa. Sci. Afr. 2022, 18, e01410. [Google Scholar] [CrossRef]
- Adenle, A.A.; Wedig, K.; Azadi, H. Sustainable agriculture and food security in Africa: The role of innovative technologies and international organizations. Technol. Soc. 2019, 58, 101143. [Google Scholar] [CrossRef]
- Soma, K.; Vernooij, A.; Barbosa, M.; Opiyo, M.; Kals, J.; Cubero, R.; Pishgar Komleh, H.; Rurangwa, E.; Ndambi, A.; Schrijver, R.; et al. The Protein Transition—How to Operationalise Use of Black Soldier Fly Larvae (BSFL) and Spirulina as Feed Ingrediencies in Kenya and Uganda? No. 2023-008; Wageningen Economic Research: Wageningen, The Netherlands, 2023; p. 23. [Google Scholar]
- Govorushko, S. Global status of insects as food and feed source: A review. Trends Food Sci. Technol. 2019, 91, 436–445. [Google Scholar] [CrossRef]
- Wachira, M.N.; Osuga, I.M.; Munguti, J.M.; Ambula, M.K.; Subramanian, S.; Tanga, C.M. Efficiency and improved profitability of insect-based aquafeeds for farming Nile tilapia fish (Oreochromis niloticus L.). Animals 2021, 11, 2599. [Google Scholar] [CrossRef] [PubMed]
- Amankwah, A.; Quagrainie, K.K.; Preckel, P.V. Impact of aquaculture feed technology on fish income and poverty in Kenya. Aquac. Econ. Manag. 2018, 22, 410–430. [Google Scholar] [CrossRef]
- Bon, B. Invisible Sprawl: Land, Money and Politics at the Rural-Urban Interface in Kenya. Disp-Plan. Rev. 2021, 57, 33–49. [Google Scholar] [CrossRef]
- Ahmed, N.; Turchini, G.M. Recirculating aquaculture systems (RAS): Environmental solution and climate change adaptation. J. Clean. Prod. 2021, 297, 126604. [Google Scholar] [CrossRef]
Disclaimer/Publisher’s Note: The statements, opinions and data contained in all publications are solely those of the individual author(s) and contributor(s) and not of MDPI and/or the editor(s). MDPI and/or the editor(s) disclaim responsibility for any injury to people or property resulting from any ideas, methods, instructions or products referred to in the content. |
© 2023 by the authors. Licensee MDPI, Basel, Switzerland. This article is an open access article distributed under the terms and conditions of the Creative Commons Attribution (CC BY) license (https://creativecommons.org/licenses/by/4.0/).