Article

Research on Enterprise R&D Strategy of Product-Service Innovation Guided by Quality Preference

1
School of Information and Software Engineering, University of Electronic Science and Technology of China, Chengdu 610054, China
2
The Institute of Service-Oriented Manufacturing, Hangzhou 311100, China
*
Author to whom correspondence should be addressed.
Sustainability 2023, 15(11), 9004; https://doi.org/10.3390/su15119004
Submission received: 17 April 2023 / Revised: 20 May 2023 / Accepted: 30 May 2023 / Published: 2 June 2023
(This article belongs to the Section Sustainable Products and Services)

Abstract

:
Research and development (R&D) plays a crucial role in reducing enterprise costs and enhancing competitiveness in the market. Customers’ quality preference for product-service is a key driver of enterprise sales. Consequently, studying R&D investment strategies holds significant research value. This paper aims to provide a comprehensive analysis of the relationship between customers’ quality preference for product-service, R&D investment, and product-service price. To achieve this, we improve the Stackelberg game model to consider these factors and use numerical simulation to investigate the optimal R&D strategy. Results show that an enterprise’s absorptive capacity positively influences its market demand and profit, while negatively impacting its competitors. A higher customers’ quality preference coefficient indicates a stronger competitive advantage. Moreover, implementing a non-cooperative R&D strategy not only helps enterprises expand their R&D investment scale and accumulate knowledge and technology, but also plays a positive role in increasing sales volume and profits. We suggest that enterprises should focus on improving their absorptive capacity and diversifying R&D strategy, while also considering customers’ quality preferences and market demand when making R&D investment decisions. Careful consideration should be given to the pros and cons of cooperative and non-cooperative R&D strategies to choose the most suitable approach.

1. Introduction

Nowadays, the manufacturing industry is experiencing intense competition. Innovation has become increasingly important and effective for manufacturing enterprises to gain a market competitive edge in the market and achieve sustainable growth [1]. For many manufacturing enterprises, the traditional product-dominant logic has resulted in homogenization of products within certain industries. Simply relying on product innovation to reduce costs and gain competitiveness has encountered a bottleneck. In order to establish a stronger and more distinctive competitive edge, some manufacturing enterprises have shifted to a customer-dominant logic. They rely on their advantageous manufacturing capabilities, shift their focus to customers’ needs, and develop new or improved services, which is referred to as product-service innovation (PSI) [2]. This transformation is commonly referred to as servitization [3]. A well-executed PSI strategy can effectively mitigate the negative impact of products, which are technology-core-based, highly complex [4], and innovative [5]. It can also enhance service competitiveness [6], leading to significant benefits for enterprise performance and customer value [7]. For instance, IBM’s total solution service business has already accounted for more than half of revenue and fundamentally improved customer satisfaction [8]. In addition, PSI opens up additional avenues for manufacturing enterprise product innovation and development, as well as promotes enterprise product innovation capabilities [9]. Hence, it is essential to recognize PSI as a critical pathway for enterprise R&D.
Traditionally, the R&D strategy of manufacturing enterprises has primarily emphasized factors such as product/service quality, price, R&D investment, and competitive strategies [10,11,12]. Therein, the impact of quality and price are noteworthy in sales and profits [13,14], and they have been proved to be able to delay customers’ purchasing behavior [15], affect customers’ purchasing decisions [16], influence customer loyalty, and corporate gains [17,18]. Moreover, with the growing significance of risk factors stemming from uncertainty and the impact of external competitors in the realm of R&D [19], suitable competitive strategies have become paramount for enterprises to establish a competitive edge in the market [20,21,22]. However, due to adopting PSI, it is not adequate for manufacturing enterprises to focus on the previous factors in recent years. This is because the essence of PSI is to achieve value co-creation between manufacturing enterprises and customers, which requires customers’ deep participation and favorable experience. Therefore, the R&D strategy of manufacturing enterprises should take into account factors related to customers’ experiences, not only including quality and price, but also customers’ quality preferences highlighted in this paper [23]. The basis is that discontinuities in customers’ quality preferences have been shown to trigger technological transformations within an industry [24]. However, there has been limited research conducted on how to integrate these factors into a comprehensive framework for R&D strategy decision-making.
This paper aims to establish a connection between three key factors, namely manufacturing enterprises’ R&D investment, product-service pricing and customers’ quality preference, while taking into account the problem of the order of actions among manufacturing enterprises in the market. The Stackelberg competitive model, which is a classical game model [25,26], is improved to analyze various complex situations in this paper. In this model, we consider two alternative strategies, i.e., non-cooperative and cooperative strategy during the R&D stage. The key innovation of our approach is the inclusion of customers’ quality preference in the product-service demand function, along with the consideration for the asymmetry and the order of actions among manufacturing enterprises. Through this model, we investigate the impact of absorptive capacity on manufacturing enterprise investment and income, shedding light on the motivation for manufacturing enterprises to engage in R&D. The findings suggest that manufacturing enterprises should pay attention to the impact of external factors on R&D strategy in the market with imperfect information. The theoretical and practical implications of these results are significant for both established and new manufacturing enterprises, providing a solid foundation for decision-making and valuable theoretical support in similar markets.
The paper is organized as follows: Section 2 provides a review of the literature. In Section 3, we introduce the Stackelberg game model and build our improved model. Section 4 discusses the model solution under non-cooperative strategies and cooperative strategies and performs parameter analysis. Section 5 includes a numerical experiment to verify effectiveness of the proposed method. Finally, Section 6 concludes the paper and suggests directions for future work.

2. Literature Review

There have been some studies focusing on some of the important factors affecting R&D, i.e., product-service quality, pricing, customers’ quality preferences, absorptive capacity, and competitive strategies.
The quality and price of product service are import factors that can affect customer experience perceptions. Product quality is evaluated based on durability, suitability, appearance and uniqueness [27], and service quality is measured by its reliability, responsiveness, empathy, assurance, etc. [28]. Some scholars have conducted research on the quality of product service. EI Ouardighi and Kogan [29] utilized an intertemporal optimization model to address the problem of enhancing product quality by coordinating investments between manufacturers and suppliers. Yu et al. [15] deemed that providing information on product quality would delay customers’ purchasing behavior. Wei et al. [16] proposed that improving product-service quality can enhance customers’ perception of service value and directly affect purchasing decisions. Permadi et al. [17] and Baskara et al. [18] emphasized that quality can influence customer loyalty and corporate gains.
In the realm of product-service pricing, Basir et al. [10] analyzed the effects of personalized service capabilities, quality, and pricing on customer satisfaction in maritime services. Taleizadeh et al. [11] proposed a coordinated model of pricing and quality for sustainable products, and the model suggested that the demand function is a linear function related to product price, service value, and quality level. Zhang et al. [9] developed a closed-loop pricing coordination model within the supply chain for products with quality issues such as defects or scrap. Research on the impact of service quality on price and customer satisfaction has also garnered attention. Nasib [12] suggested that the impact of price on customer loyalty becomes apparent when service quality and customer satisfaction are considered as intermediary variables.
Research on the impact of customers’ quality preferences is scarce. Han et al. [30] indicated that customers’ quality preference can be regarded as one of the important indicators for manufacturing enterprises to evaluate the expected sales of their product-service sales. Wang et al. [23] developed a model to analyze customers’ quality preference through online review text information, which was used to further guide product innovation and development. Chandrasekhar et al. [31] believed that understanding customers’ service quality preference is more helpful for food supply companies to meet customer needs. However, while these studies have yielded useful results for understanding customers’ quality preferences, they have not yet analyzed the impact of customers’ quality preferences on the R&D strategy for product-service innovation.
As to the competitive strategies for manufacturing enterprises, studies were focused on R&D competitions within the same industry [32]. Increasing investment is the most direct way to compete, which is closely related to product-service quality. Nevertheless, Lambertini et al. [33] and Luo et al. [34] claimed that blindly investing in PSI by manufacturing enterprises will inevitably lead to a loss of profits and a service paradox. To achieve higher profits, manufacturing enterprises should consider customers’ quality preference in the product-service sales stage, and control costs in the product production and service design stage. By doing so, manufacturing enterprises’ R&D can be an effective measurement to achieve low cost and high profitability [35]. Technological spillovers can be an effective way [22], including competition, cooperation, and absorptive capacity. For example, Yu et al. [21] examined four different types of R&D collaboration contracts with different payments, and found that no contract is always the best option from the marketer’s perspective. However, Aschhoff and Schmidt [36,37] analyzed the data of the annual German innovation survey, and revealed that R&D cooperation would reduce more cost. Based on real-world data from Spanish innovating firms, Belderbos et al. [37] indicated that persistent collaboration would benefit innovativeness. Grünfeld [20] analyzed the absorptive capacity effect on gains and found a positive relationship, but indicated that higher spillover rates may not always result in decreased R&D and profits for a multinational enterprise. Moreover, there are also some studies focusing on other factors that influences competitions, like government subsidies [38] and asymmetric information [39,40].

3. Methods

3.1. Hypotheses and Notations

In market competition, enterprises often base their strategies on the actions of their competitors, leading to a sequential decision-making process. The Stackelberg game model is a suitable framework for analyzing such situations. Firstly, the industry leader enterprise determines the retail price of its produce service. Then, the follower enterprises have two possible action strategies. One is to make the optimal response price according to the leader enterprise’s price, which is a classic Stackelberg game, and the sequence of actions between enterprises is shown in Figure 1. The other is to adopt a cooperative strategy in the R&D stage, where the leader and the followers jointly determine the scale of their respective R&D investment according to the principle of maximizing their total profits. However, in the sales stage, they still determine the product-service price according to their respective profits.
Given two manufacturing enterprises, A and B , operating in a market, both integrate their product-service offerings into an integrated solution for packaged sales (written as SOLUTION). In the Stackelberg game model, the basic hypotheses of the two enterprises are as follows:
  • Both enterprises have their own sales channels in the market, and have a risk-neutral attitude, aiming to maximize their profits.
  • In the R&D stage, both enterprises invest in research and development to lower SOLUTION costs and improve R&D efficiency.
  • In the production stage, both enterprises face the same fixed production costs for their SOLUTIONs. They utilize quality inputs to showcase the durability, functionality, aesthetics, and uniqueness of their products, with the objective of enhancing consumer preferences and expanding their market share during the sales stage [27].
  • If collusion occurs between the enterprises during the sales stage, it will result in reduced market competition intensity. For the purpose of this analysis, it is assumed that there is no collusion between the two enterprises during the sales stage.
  • Under the framework of Stackelberg game, both enterprises simultaneously make decisions regarding their R&D investments based on their own profits (or total profits).
  • The Notations part lists the notations and corresponding description.

3.2. Model Building

According to the demand functions of Lu et al. [41] and Taleizadeh et al. [11], we establish the linear demand function for the two enterprises’ SOLUTIONs which depend on price and quality:
D a = ν p a + p b + β a ω a β b ω b D b = ν p b + p a + β b ω b β a ω a
The notation and management significance of Equation (1) are explained as follows:
ν denotes the total demand size for the SOLUTIONs provided by the two enterprises in market competition, and ν > 0 . The total demand size of enterprise A and B are denoted as ν a and ν b respectively, and typically ν a = ν b = ν [42].
p a and p b denote the prices of the SOLUTIONs provided by the two enterprises respectively, and p a , p b > 0 . The demand function indicates that the customer’s price preference for the SOLUTIONs of the two enterprises is equal to 1, indicating that there is no difference in price preference. The demand size per unit of SOLUTION is negatively correlated with the sales price, and positively correlated with the SOLUTION price of the competitor. This means that a higher price for an enterprise’s own SOLUTION will be less conducive to expanding its market share, while for its competitive enterprises, it will be the opposite.
ω a and ω b denote the quality levels of the two enterprises, respectively, and ω a , ω b > 0 . The quality level of an enterprise is positively correlated with its market share.
β a and β b denote the degree of customer’s quality preference for the SOLUTIONs of enterprise A and B , respectively, and β a , β b [ 0,1 ] . Since customers’ quality evaluation of the SOLUTION originates from subjective perception, it is assumed that β a and β b are positively correlated with quality investment level ω a and ω b . That is, as ω increases, β also increases, and then customers are more willing to purchase the enterprise’s SOLUTION.
In the R&D stage, both enterprises carry out R&D strategy to reduce costs. The R&D investment scale of enterprise A and enterprise B is denoted as x a and x b , respectively, and x a , x b > 0 . While the R&D of enterprises often result in unavoidable spillover effects, the enterprises’ learning and absorptive capacities also play a crucial role in new SOLUTION development. To account for these factors, we follow the approach of [43] and assume that both enterprises adopt a relatively lenient policy toward intellectual property rights. Specifically, we normalize the technology spillover coefficient to 1 and define the absorptive capacity coefficients of the two enterprises as θ a and θ b , respectively, and θ a , θ b ( 0 , 1 ) . Then, the cost functions of the two enterprises can be defined as:
C a = C x a θ a x b C b = C θ b x a x b ,
where C represents the fixed costs of an enterprise in the production process and service design. θ a x b represents the extent to which enterprise A ’s SOLUTION can reduce costs through absorptive capacity to learn knowledge and technology from enterprise B ’s technology spillover.
Following the classic assumption of R&D cost in reference [22], we define the R&D costs of the two enterprises as quadratic functions, denoted as γ a x a 2 and γ b x b 2 , where γ a and γ b are the R&D efficiency coefficients of the two enterprises, respectively, and γ a , γ b > 0 . The size of γ a , γ b indicates the relative cost advantage of enterprises in R&D investment. The larger the R&D efficiency coefficient, the higher the R&D cost, and the smaller the relative cost advantage of the enterprise, and vice versa. Furthermore, according to the hypothetical concept of the quality cost function in the literature [41], the cost function of the quality of the two enterprises’ SOLUTIONs is considered as two quadratic functions respectively, denoted as λ a ω a 2 and λ b ω b 2 . Here, λ is the cost coefficient of quality, and its impact on quality cost is similar to the impact of R&D efficiency coefficient on R&D cost.
By combining the above analysis and assumptions, we can obtain the profit functions of the two enterprises as follows:
π a = ( p a C a ) D a γ a x a 2 λ a ω a 2
π b = ( p b C b ) D b γ b x b 2 λ b ω b 2

4. Model Solving

4.1. The Optimal Solution under the Non-Cooperative Strategy

In this Stackelberg game, enterprise A acts as the leader and sets its own SOLUTION price first. Enterprise B , as the follower, observe the prices set by enterprise A and then decides its own SOLUTION price accordingly. This is a typical Stackelberg dynamic game which can be solved by reverse induction. Denote the SOLUTION price of enterprise A as p a . Taking the first derivative of Equation (4) and setting it equal to 0, we get the response function of enterprise B with respect to the SOLUTION price of enterprise A :
p b = 1 2 [ ν + C + p a θ b x a x b ( β a ω a β b ω b ) ]
Substituting Equation (5), D a in Equation (1), and C a in Equation (2) into Equation (3) and using the first-order condition, we obtain the SOLUTION profit function of enterprise A :
π a = ( p a C x a θ a x b ) ( 3 ν + C p a θ b x a x b + β a ω a β b ω b ) γ a x a 2 λ a ω a 2
Find the first order condition for Equation (6) regarding p a and make it equal to zero, i.e., π a p a = 0 :
π a p a = 3 ν + 2 C 2 p a θ b x a x b x a θ b x a + β a ω a β b ω b 2 = 0
The SOLUTION price of enterprise A can be obtained:
p a = 1 2 [ 3 ν + 2 C + ( β a ω a β b ω b ) ( 1 + θ b ) x a ( 1 + θ a ) x b ]
Then, bring Equation (8) into Equation (5) to obtain the SOLUTION price function of the follower enterprise B :
p b = 1 4 [ 5 ν + 4 C ( β a ω a β b ω b ) ( 1 + 3 θ b ) x a ( 3 + θ a ) x b ]
According to Equations (8) and (9), and linking Equations (1), (3), and (4), we get the profit functions of the two enterprises:
π a = 2 3 v + x a 1 θ b x b 1 θ a + ( β a ω a β b ω b ) 4 2 γ a x a 2 λ a ω a 2 π b = 5 v x a 1 θ b + x b 1 θ a ( β a ω a β b ω b ) 4 2 γ b x b 2 λ b ω b 2
According to the principle of maximizing profits, both enterprises make R&D investments based on their own profits. By making the first order condition equal to 0, we can obtain:
π a x a = 3 v 1 θ b x a [ 2 γ a 1 θ b 2 ] x a 1 θ a 1 θ b + 1 θ b β a ω a β b ω b = 0 π b x b = 1 2 5 v 1 θ a x a 1 θ a 1 θ b x b [ 4 γ a 1 θ a 2 ] + 1 θ a β a ω a β b ω b = 0
By eliminating the cross terms of the first order condition of Equation (11), we can obtain the equilibrium solution for enterprises A and B regarding their respective R&D investment x a * , x b * as shown in Table 1. Furthermore, the equilibrium solutions for the two enterprises in Stackelberg game under the non-cooperative strategy during the R&D stage can be obtained.

4.2. The Optimal Solution under the Cooperative Strategy

In the cooperative strategy, the two enterprises firstly determine their R&D investment levels, respectively, to maximize their total profit in R&D stage. Then, in the sales stage, enterprise A still acts as the leader and set the SOLUTION price to maximize its own profits, while the follower, i.e., enterprise B , responds accordingly based on the observed price of enterprise A . Therefore, the SOLUTION price functions of the two enterprises are the same as those in Equations (8) and (9), respectively. Then, denote the total profit function of the two enterprises as H S , which is equal to the sum of the profits under the Stackelberg competition between the two enterprises.
H S = D a 2 + D b 2 γ a x a 2 γ b x b 2 λ a ω a 2 λ b ω b 2
The first-order condition of the total profit function Equation (12), with respect to R&D investment, can be obtained as:
H S x a = ν ( 1 θ b ) ( 1 θ b ) ( β a ω a β b ω b ) + [ 8 γ a ( 1 θ b ) 2 ] x a + ( 1 θ a ) ( 1 θ b ) x b = 0 H S x b = ν ( 1 θ a ) ( 1 θ a ) ( β a ω a β b ω b ) ( 1 θ a ) ( 1 θ b ) x a [ 8 γ b ( 1 θ a ) 2 ] x b = 0
After eliminating the cross items, the equilibrium solution of the R&D investment of the two enterprises x a * * , x b * * can be obtained by sorting out as shown in Table 2. Furthermore, by substituting x a * * , x b * * into the price, demand, and profit functions of the two enterprises, the equilibrium solution when the enterprise A takes the lead is in the case of cooperative strategy in the R&D stage.

4.3. Parameter Discussion

This section discusses the impact of investment factors and parameters on the SOLUTION price, market share, and profit of enterprises during the process of forming SOLUTIONs, based on the first-order partial derivative and mixed partial derivative of the profit function, price function, and demand function of the two enterprises. Relevant methods of mathematical analysis are used to drive the following two corollaries and their proofs.
Corollary 1.
In the Stackelberg competition model, the relationship between an enterprise’s absorptive capacity and R&D investment is affected by actors such as demand scale, R&D efficiency, and SOLUTION quality, regardless of whether the two enterprises cooperate in the R&D stage or not. When adopting an R&D cooperative strategy, if the follower enterprise invests more in improving the SOLUTION quality, an increase in the absorptive capacity of all enterprises will encourage the leader enterprise to increase R&D investment. In this context, the follower enterprise’s R&D investment is positively correlated with the absorptive capacity of the leader enterprise, while negatively correlated with its own absorptive capacity.
Proof of Corollary 1.
 
  • Enterprises adopt a non-cooperative strategy during the R&D stage.
The first-order conditions of x a * and x b * with respect to the absorptive capacity θ yield:
x a * θ a = 4 γ b ( 1 θ a ) ( 1 θ b ) ν [ 5 γ a ( 1 θ b ) 2 ] γ a ( β a ω a β b ω b ) [ 16 γ a γ b γ a ( 1 θ a ) 2 2 γ b ( 1 θ b ) 2 ] 2 x a * θ b = 16 γ a γ b γ a ( 1 θ a ) 2 + 2 γ b ( 1 θ b ) 2 ν [ 6 γ b ( 1 θ a ) 2 ] + 2 γ b ( β a ω a β b ω b ) [ 16 γ a γ b γ a ( 1 θ a ) 2 2 γ b ( 1 θ b ) 2 ] 2 x b * θ a = 16 γ a γ b + γ a ( 1 θ a ) 2 2 γ b ( 1 θ b ) 2 ν [ 5 γ a ( 1 θ b ) 2 ] γ a ( β a ω a β b ω b ) [ 16 γ a γ b γ a ( 1 θ a ) 2 2 γ b ( 1 θ b ) 2 ] 2 x b * θ b = 2 γ a ( 1 θ a ) ( 1 θ b ) ν [ 6 γ b ( 1 θ a ) 2 ] + 2 γ b ( β a ω a β b ω b ) [ 16 γ a γ b γ a ( 1 θ a ) 2 2 γ b ( 1 θ b ) 2 ] 2
According to Equation (14), when β a ω a β b ω b > 0 , x a * θ b < 0 , x b * θ b > 0 , it means that the follower enterprise B ’s absorptive capacity is positively correlated with its own R&D investment, but negatively correlated with the R&D investment of the leader enterprise A , and vice versa. When ν [ 5 γ a ( 1 θ b ) 2 ] γ a ( β a ω a β b ω b ) > 0 , the absorptive capacity of both enterprise A and enterprise B have the same impact on the R&D investment of the two enterprises. However, under certain conditions, i.e., ν [ 5 γ a ( 1 θ b ) 2 ] γ a ( β a ω a β b ω b ) < 0 , the impact of enterprise A ’s absorptive capacity on the R&D investment of both enterprises is opposite to that of enterprise B ’s absorptive capacity.
2.
Enterprises adopt cooperative strategy during the R&D stage.
The following equations are obtained from the first-order conditions of x a * * and x b * * :
x a * * θ a = 2 γ a γ b ( 1 θ a ) ( 1 θ b ) ( ν β a ω a + β b ω b ) [ 8 γ a γ b γ a ( 1 θ a ) 2 γ b ( 1 θ b ) 2 ] 2 x a * * θ b = γ b ( ν β a ω a + β b ω b ) 8 γ a γ b γ a ( 1 θ a ) 2 + γ b ( 1 θ b ) 2 [ 8 γ a γ b γ a ( 1 θ a ) 2 γ b ( 1 θ b ) 2 ] 2 x b * * θ a = γ a ( ν β a ω a + β b ω b ) 8 γ a γ b + γ a ( 1 θ a ) 2 γ b ( 1 θ b ) 2 [ 8 γ a γ b γ a ( 1 θ a ) 2 γ b ( 1 θ b ) 2 ] 2 x b * * θ b = 2 γ a γ b ( 1 θ a ) ( 1 θ b ) ( ν β a ω a + β b ω b ) [ 8 γ a γ b γ a ( 1 θ a ) 2 γ b ( 1 θ b ) 2 ] 2
Equation (15) reveals that the impact of absorptive capacity on R&D investment is constrained by the quantitative relationship among demand scale, customers’ quality preferences and quality investment. When β a ω a β b ω b < 0 , we can get x a * * θ a > 0 , x a * * θ b > 0 and x b * * θ a > 0 , x b * * θ b < 0 , which means that the leader enterprise A ’s absorptive capacity has a positive effect on the two enterprises’ R&D investment, while the follower enterprise B ’s absorptive capacity has a negative impact on its own R&D investment and has a positive impact on the leader enterprise A ’s R&D investment. □
Corollary 2.
An enterprise’s R&D investment is negatively correlated with its SOLUTION price but increases the market share of the SOLUTION. In addition, the demand scale of the leader enterprise is constrained by its own R&D and quality investment when all enterprises participate in market interactions through Stackelberg competition.
Proof of Corollary 2.
 
The difference between Equations (8) and (9) yields the relationship as:
p a p b = ν + 3 ( β a ω a β b ω b ) ( 1 θ b ) x a + ( 1 θ a ) x b 4
There are first-order conditions that can be derived as follows:
( p a p b ) x a = ( 1 θ b ) 4 < 0 ( p a p b ) x a = ( 1 θ a ) 4 > 0
Similarly, according to the demand functions of the two enterprises, we get:
D a D b = ν + ( β a ω a β b ω b ) + ( 1 θ b ) x a ( 1 θ a ) x b 2 ( D a D b ) x a = ( 1 θ b ) 2 > 0 ( D a D b ) x b = ( 1 θ a ) 2 < 0
It can be seen that an enterprise’s R&D investment is negatively correlated with its SOLUTION price, but it is positively correlated with its market share. Only if ν ( β a ω a β b ω b ) ( 1 θ b ) x a + ( 1 θ a ) x b < 0 , the market share of the leader enterprise A is greater than that of the follower enterprise B , which means that the leader enterprise needs to allocate more resources toward R&D and quality investment compared to the follower enterprise. □

5. Results and Discussion

In this section, we conduct numerical simulation using MATLAB R2019b software to explore the impact of absorptive capacity on R&D investment, SOLUTION prices, market demand, and profit under different customer quality preferences.
Consider two enterprises with varying customers’ quality preferences and absorptive capabilities, but equal levels of R&D, we adopt the R&D efficiency of each enterprise as 1, i.e., γ a = γ b = 1 , based on the work of Poyago Theotoky [44]. Then, we assume that the fixed cost is C = 2 , the market demand is v = 10 , the quality cost coefficients of the two enterprises are λ a = λ b = 0.5 , the investment of the two enterprises are ω a = ω b = 5 , the absorptive capacity of enterprise A is θ a = 0.6 . Due to the difference in customers’ quality preferences for SOLUTIONs between the two enterprises, the β is considered to have two cases as follows:
  • When β a > β b , we assume that the difference in customers’ quality preference for the two enterprises’ SOLUTIONs is relatively small, and we set β a = 0.7 , β b = 0.5 .
  • When β a < β b , there is a relatively large difference in customers’ quality preference for the two enterprises’ SOLUTIONs. Then, we set β a = 0.4 , β b = 0.8 .
The model parameters have the following managerial implications. Firstly, the issue of the order of action between the two enterprises has been resolved, and it is believed that competitor can immediately maintain its own SOLUTION’s competitiveness with the same amount of investment. This means that the investment between the two enterprises is symmetrical. Secondly, we consider the symmetry of enterprises in terms of R&D level, but assume that the two enterprises’ absorptive capacities are asymmetric. This reflects that different resource allocation will lead to differences in the accumulation and learning of knowledge and technology for an enterprise [45,46]. Finally, because of the difference in the customers’ quality preference coefficients, we analyze each equilibrium solution under two scenarios: β a > β b (low quality preference difference) and β a < β b (high quality preference difference). Figure 2 illustrates the relationship diagram between these model parameters.
Figure 2a,b illustrate the relationship between absorptive capacity and R&D investment of the enterprises under low-quality preference difference ( β a > β b ) and high-quality preference difference ( β a < β b ), respectively. The common ground between the two figures shows that when customers are more interested in the enterprise A ’s products-service, the follower enterprise B ’s absorptive capacity has a negative effect on the leader enterprise A ’s R&D investment under non-cooperative R&D strategy, while it has a weak positive effect on its own R&D investment. However, the improvement of the follower enterprise B ’s absorptive capacity strengthens the willingness of the leader enterprise A to invest in R&D under the cooperative R&D strategy, while it has no significant impact on its own R&D investment.
After comparison, it can be observed that when the difference in customers’ quality preferences is β a > β b , the follower enterprise B ’s R&D investment is lower than that when the difference in customers’ quality preference is β a < β b . It means that if customers tend to purchase follower enterprise B ’s SOLUTION, this enterprise would be more willing to expand its investment in R&D. Moreover, the R&D investment of the follower enterprise B is higher than that of the leader enterprise A under the cooperative R&D strategy.
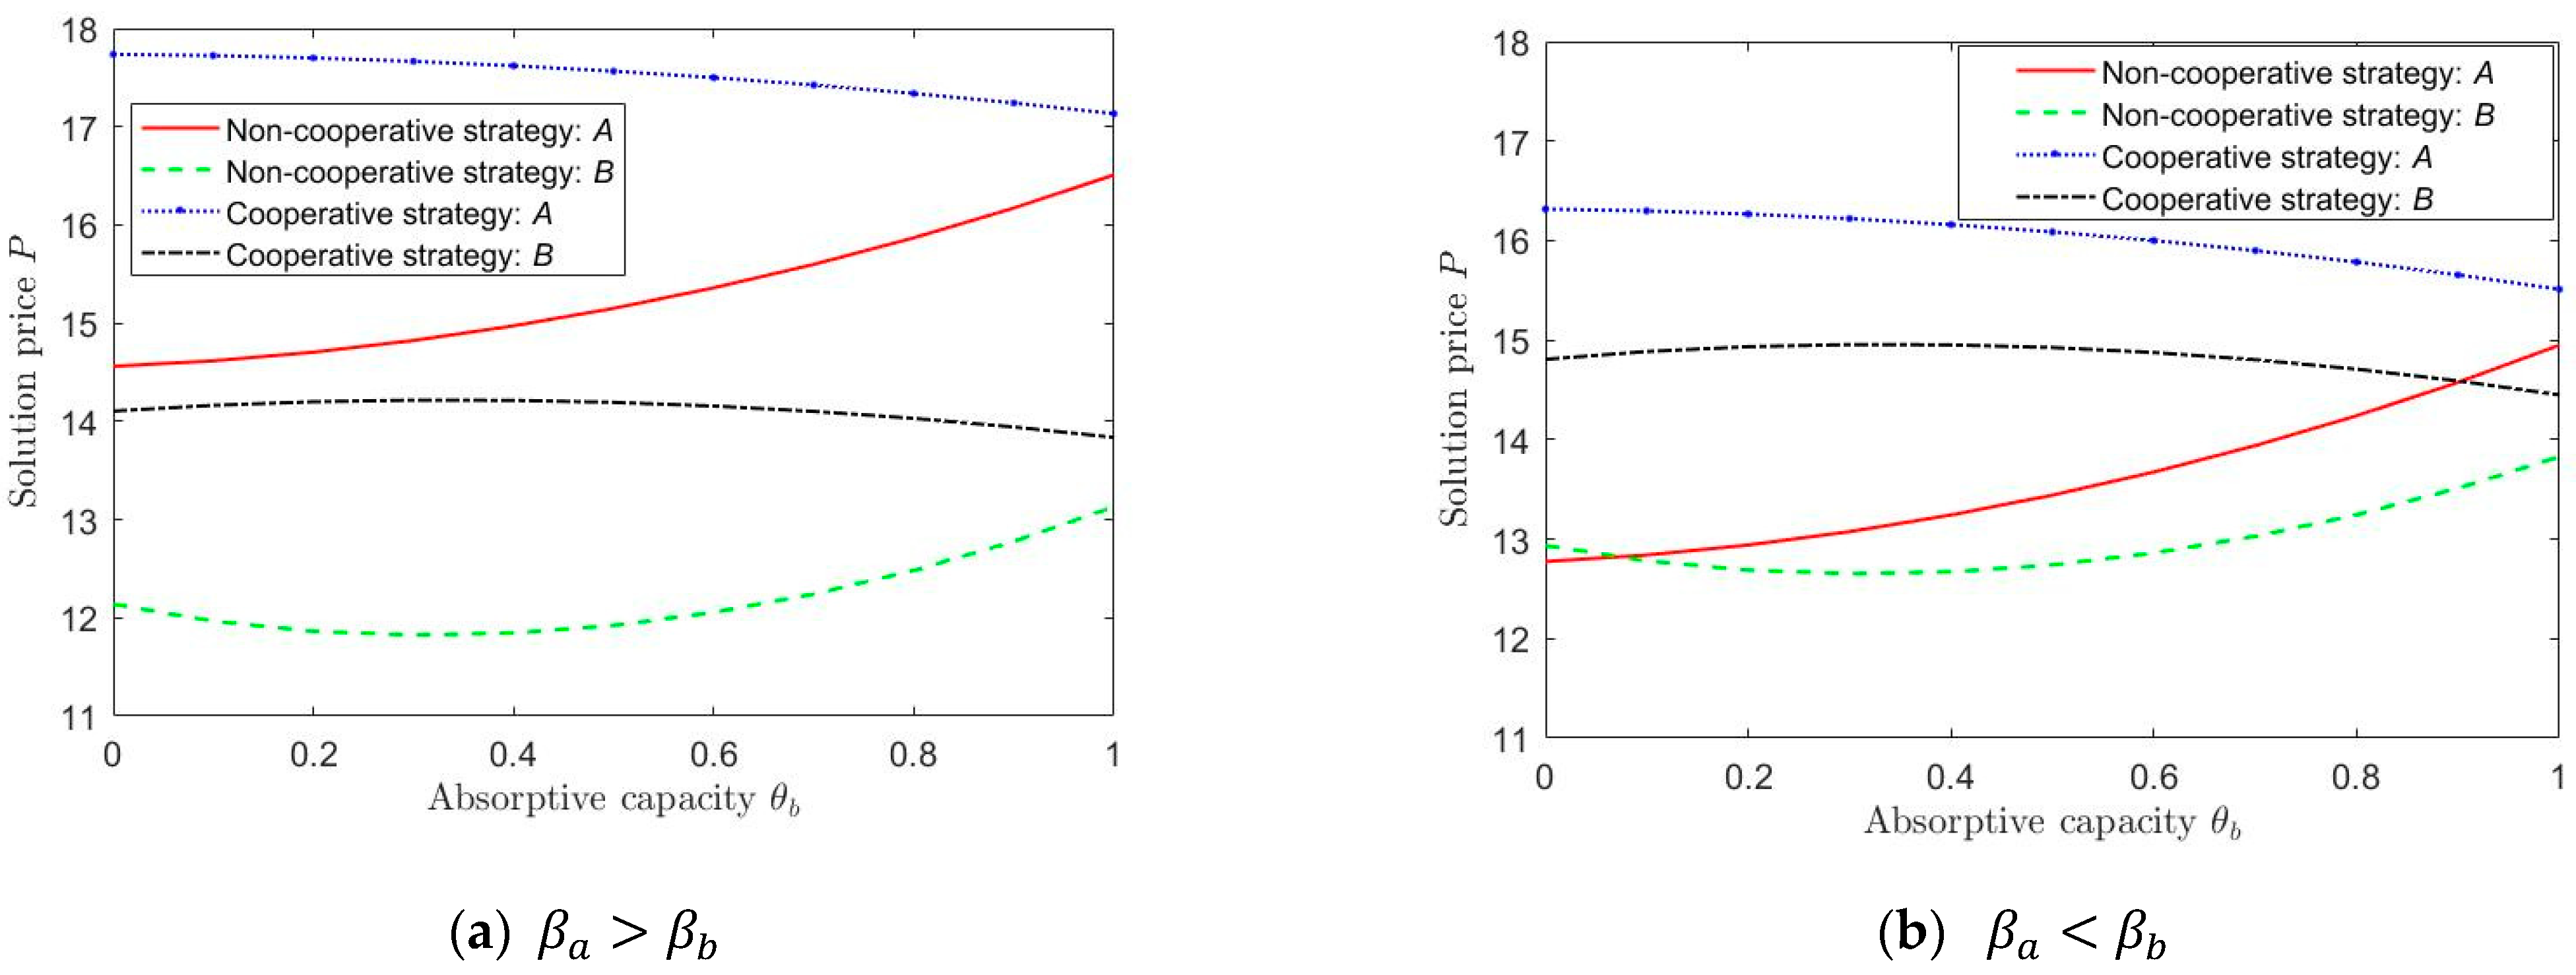
Figure 3a,b depict the relationships between enterprise B ’s absorptive capacity and the two enterprises’ SOLUTION prices for different customers’ quality preferences. Under the non-cooperative R&D strategy, as the follower enterprise B ’s absorptive capacity increases, the price of leader enterprise A ’s SOLUTION also increases, while the price of follower enterprise B ’s SOLUTION first gradually decreases and then increases. Under the cooperative R&D strategy, the follower enterprise B ’s absorptive capacity has a negative impact on the SOLUTION prices of both enterprises. When the customers’ quality preference for the two enterprises’ SOLUTION satisfies β a > β b , the price of the follower enterprise B ’s SOLUTION is lower than that of the leader enterprises A ’s SOLUTION under non-cooperative R&D strategy. It is opposite to the result of the cooperative strategy scenario. In addition, when β a < β b , the price of the leader enterprise A ’s SOLUTION is lower than that of low-quality preference scenarios, while the price of the follower enterprise B ’s SOLUTION is higher than that of low-quality preference scenarios. This indicates that as the customers’ quality preference increases, enterprises benefit from increasing their SOLUTION prices, and vice versa.
The market share of an enterprise reflects the level of customer acceptance of its SOLUTION, and is directly related to the sales performance in the market, which is also known as market demand [47]. According to the general equilibrium theory, an enterprise’s profit is the product of the SOLUTION price and market demand, and the SOLUTION price is inversely proportional to the market demand. However, this relationship is altered when quality preferences come into play.
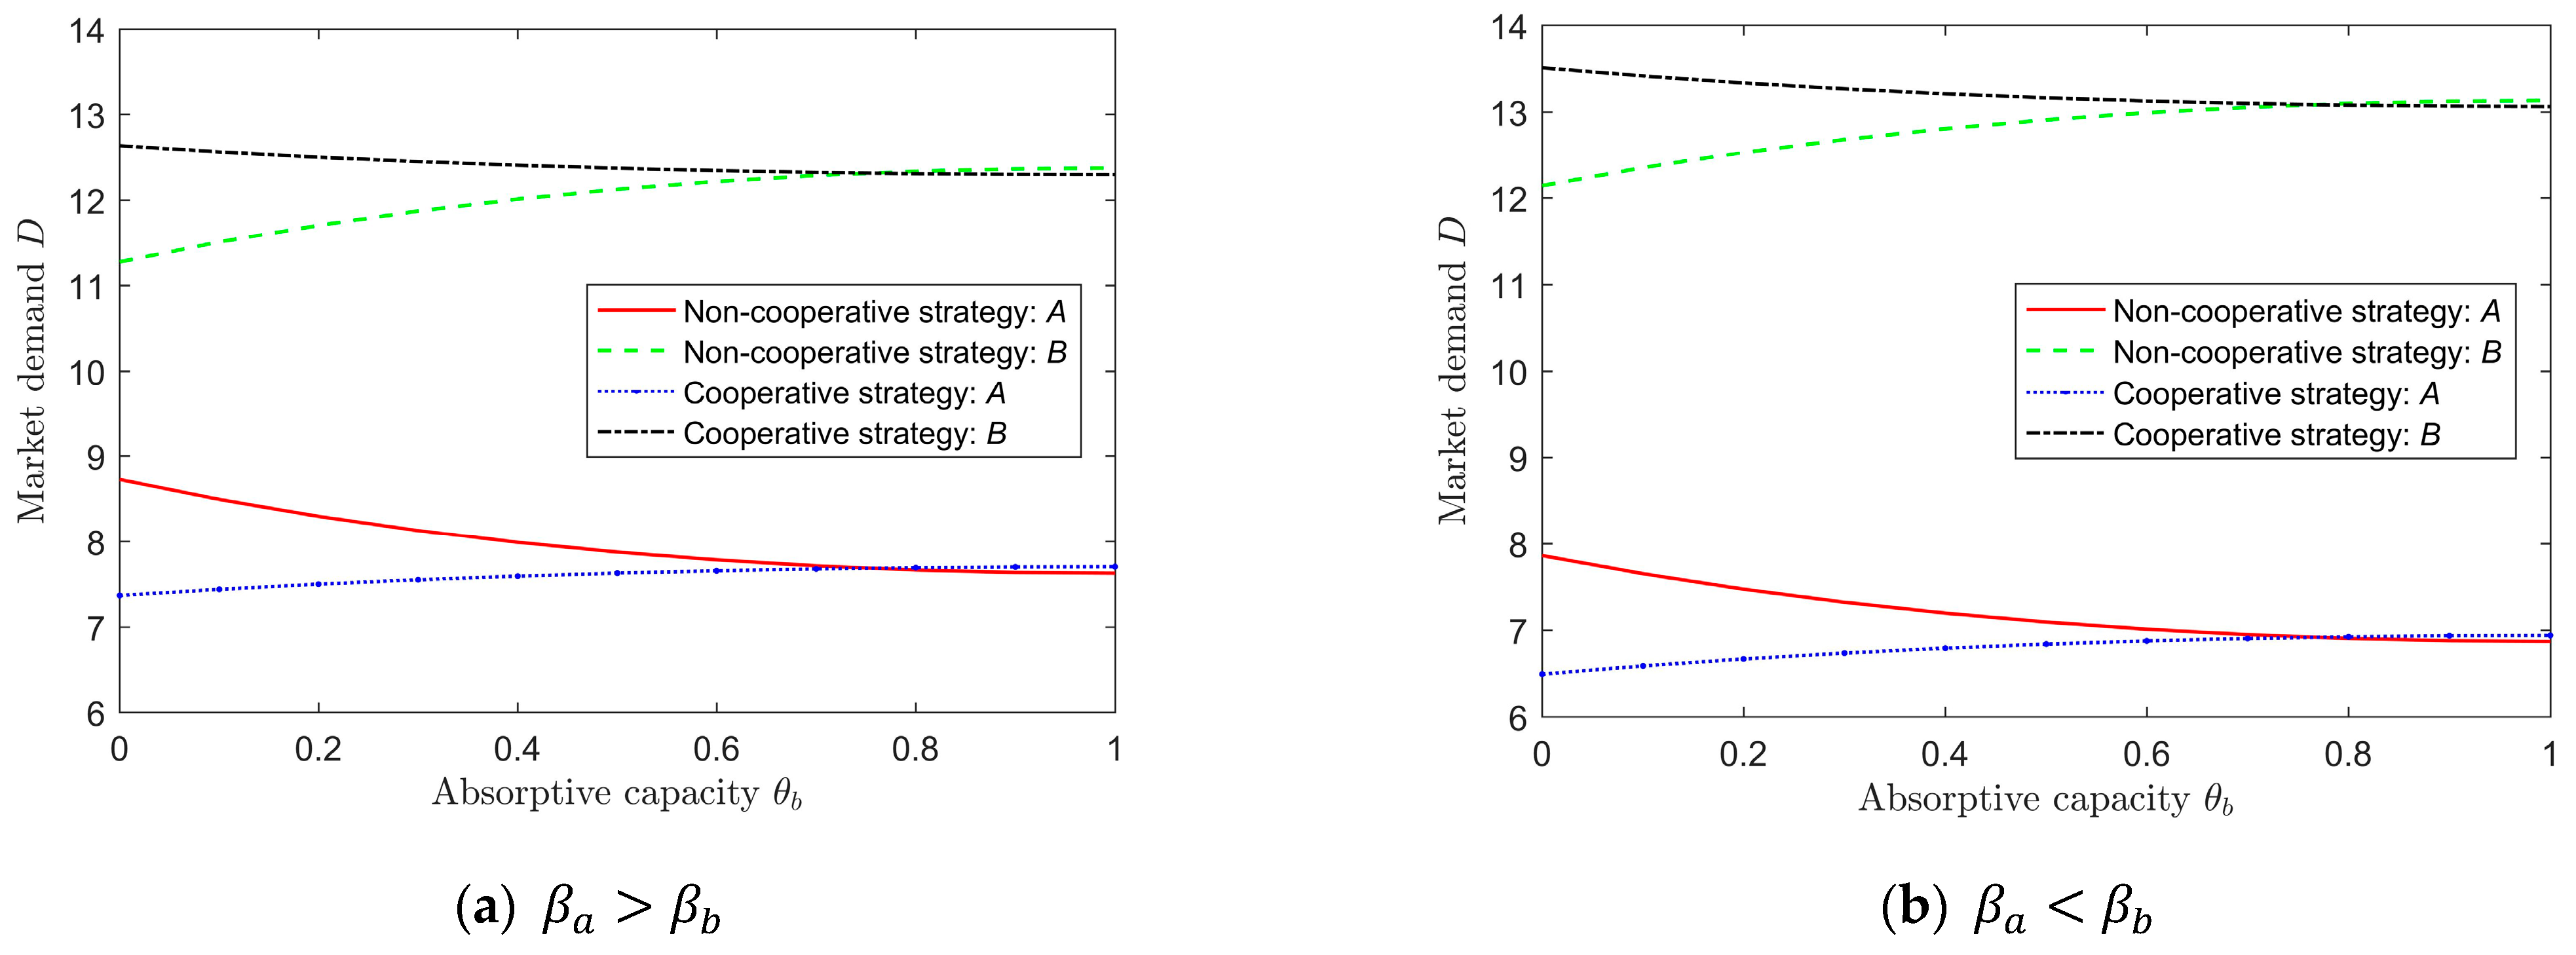
The relationships between the follower enterprise B ’s absorptive capacity and the market demand of both enterprises are depicted in Figure 4a,b. It can be observed that the absorptive capacity of enterprise B has a positive impact on its own market demand, while it presents a negative effect on the market demand of the competing enterprise A . Regardless of the R&D strategy adopted by the two enterprises, the market demand of the follower enterprise B is consistently higher than that of the leader enterprise A . However, in practical economics, newer or recently established enterprises may face challenges in gaining market share due to the limitations in R&D capabilities, operating funds, equipment, and staffing, resulting in a disadvantage in market competition. However, as the R&D efficiency between the enterprises is assumed to be symmetric in this section, the situation shown in Figure 4 can be explained, and it does not affect the relationship between absorptive capacity and market demand. At last, by comparing Figure 4a,b, it can be observed that as the difference in customers’ quality preference for the SOLUTIONs of the two enterprises gradually narrows, the market demand for the follower enterprise B increases, while the market demand for the leader enterprise A correspondingly narrows.
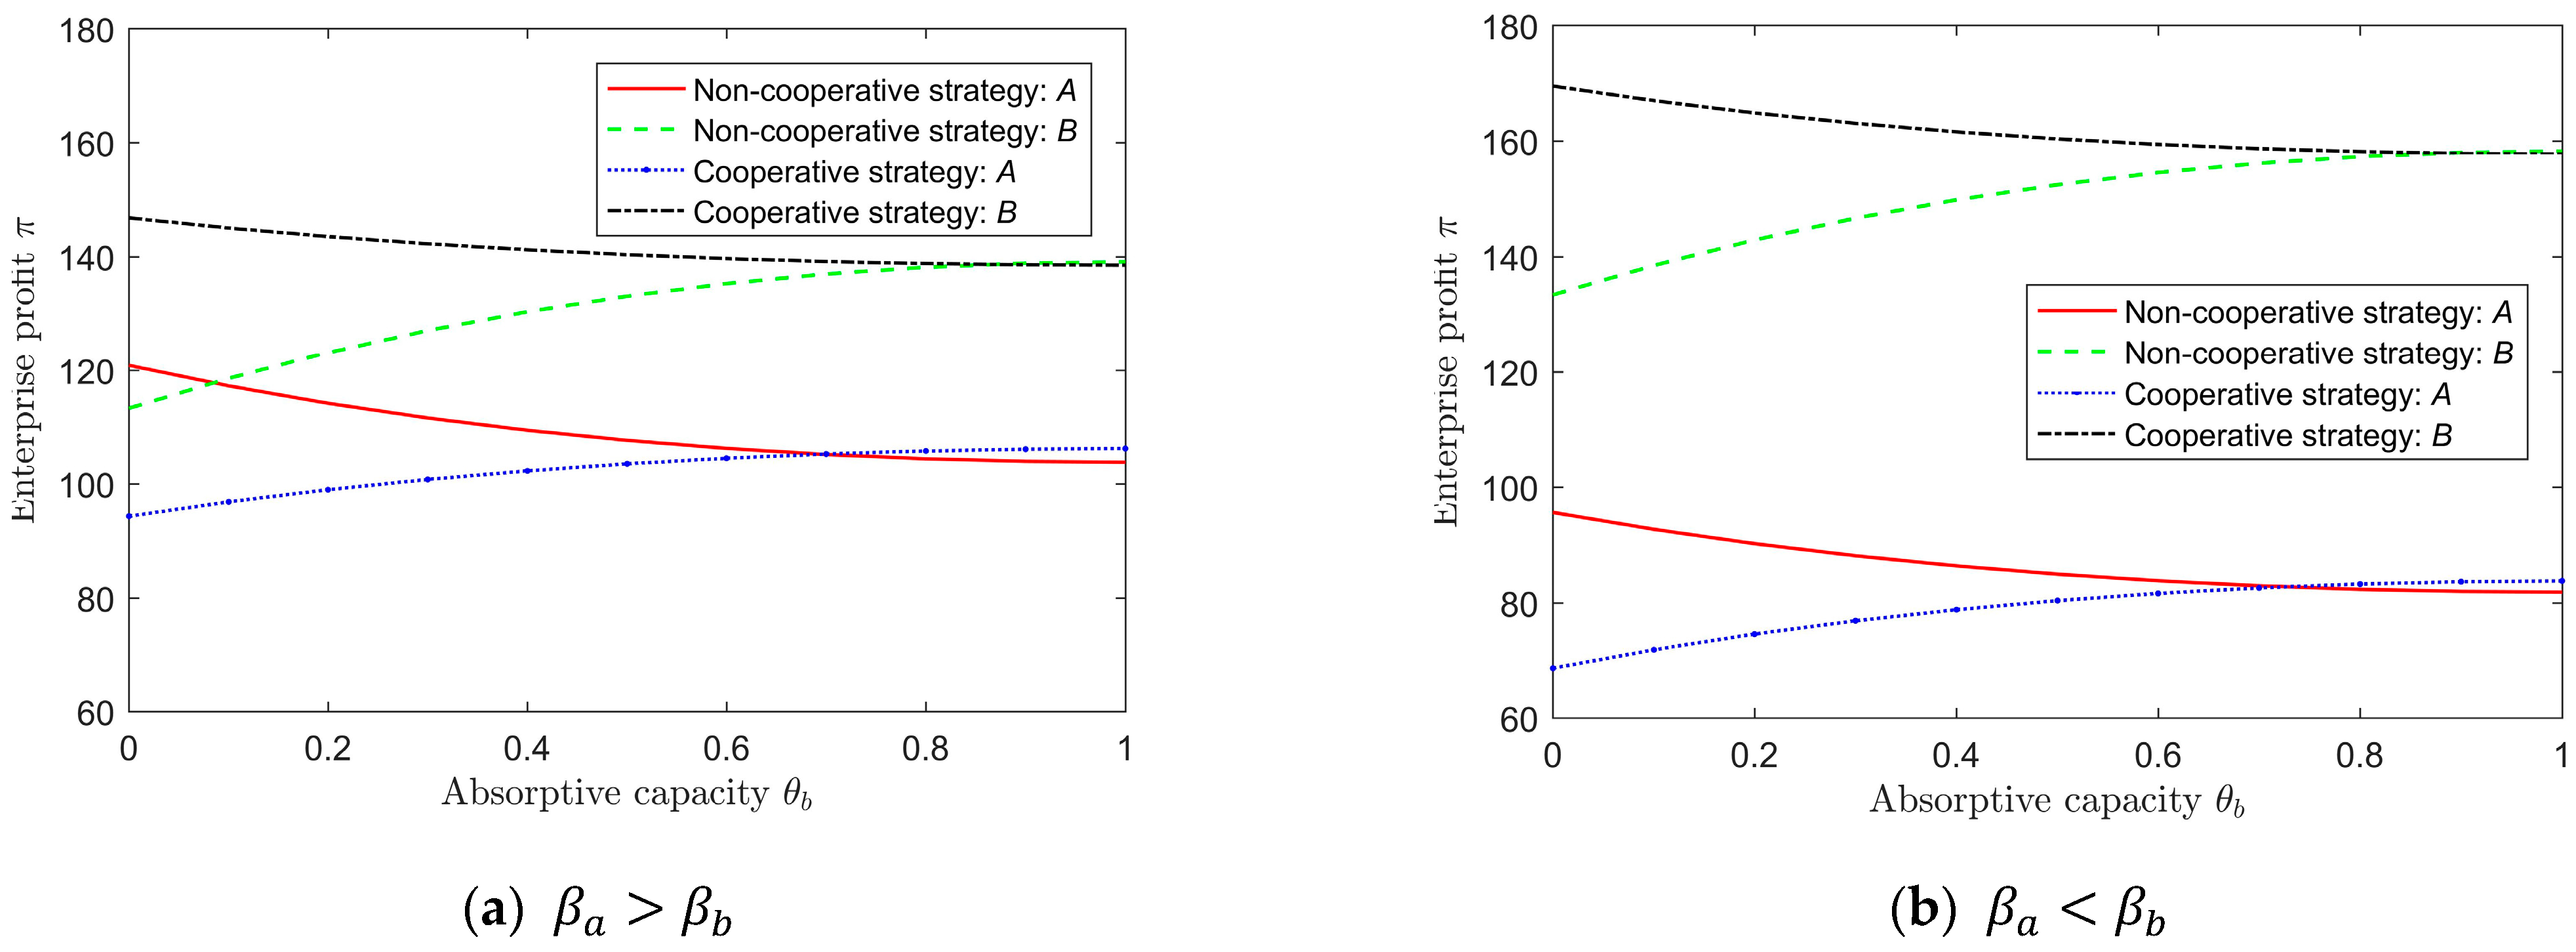
Figure 5a,b illustrates the impact of enterprise B ’s absorptive capacity on the profits of both enterprises. The trends of changes in the two groups of charts are consistent with those in Figure 4 under the same conditions. Since both enterprises are assumed to be risk-neutral, the level of profit is considered as the behavioral goal, and the R&D strategy which can obtain relatively high profits will be regarded as the optimal strategy. When the difference in customers’ quality preferences is relatively low ( β a > β b ), the relationship between the follower enterprise B ’s profit and its absorptive capacity is more pronounced compared to the impact of the difference in customers’ quality preferences ( β a < β b ). This means that the profits of both enterprises are more dependent on their absorptive capacity when customers’ quality preferences for the SOLUTIONs of both enterprises become similar. When 0.7 < θ b < 1 , the impact on an enterprise’s profit is not significant regardless of which R&D strategy the enterprise adopts. When 0 < θ b < 0.7 , it is evident that the leader enterprise A is more inclined to adopt the non-cooperative R&D strategy, and follower enterprise B is more likely to adopt the cooperative R&D strategy to obtain a higher profit.
The purpose of the comparative analysis is to determine the most advantageous R&D strategy for enterprises, whether through cooperative or non-cooperative competition, to enhance market interaction and ensure long-term development. The analysis of customers’ quality preference reveals that adopting a cooperative R&D strategy can generate high profits for enterprises. When both enterprises opt for a non-cooperative R&D strategy, the absorptive capacity positively impacts the scale of their market demand but inhibits their competitive counterparts. This indicates that the absorptive capacity plays an irreplaceable role in the R&D of any enterprise. Enterprises that recognize the relationship between absorptive capacity, market demand and profit would strive to improve their absorptive capacity. One effective way to achieve this is through investing in the R&D. It is evident that enterprises with low or no investment in R&D are not conducive to effectively accumulating knowledge and technology, particularly under a cooperative R&D strategy.
Under the cooperative R&D strategy, customers’ quality preferences can incentivize enterprises to invest more in R&D. Although low or negative R&D investment by the leader enterprise is not conducive to learning and accumulation of knowledge and technology, the R&D investment level under the same quality level is always lower than that under non-cooperative R&D strategies and the profit gap between the two enterprises is not high. Therefore, although adopting a cooperative R&D strategy is advantageous for both enterprises, it is important to note that under such a strategy, the leader enterprise may not invest much in R&D and still make profits. This means that the leader enterprise does not use its own R&D investment to reduce costs, but instead relies on its absorptive capacity to achieve R&D through the R&D investment of the follower enterprise. Such a strategy may not be stable in economic practice and is not popular with partners. Thus, the view that adopting a non-cooperative R&D strategy under the Stackelberg competition mode is the most advantageous for both enterprises is supported.

6. Conclusions and Future Work

It has become a common phenomenon in economic practice for manufacturing enterprises to use R&D investment strategies to reduce costs and improve the competitiveness of product service in the market. This paper considers the factor of customers’ quality preference, establishes a price competition model among manufacturing enterprises and conducts numerical simulation to explore the optimal R&D strategy that can maximize profits. The main conclusions can be summarized as follows. Firstly, it is important to note that the cooperative strategy between manufacturing enterprises may not always be the optimal strategy when considering the customers’ quality preferences for the product service provided by manufacturing enterprises. Secondly, the absorptive capacity of a manufacturing enterprise has a positive impact on its R&D investment, market demand and profit. As the absorptive capacity increases, the manufacturing enterprise can gradually expand the scale of R&D investment and release more market demand, resulting in higher profits. However, the impact of absorptive capacity on competitors is opposite, as it hinders their ability to compete and reduces their profits. Thirdly, manufacturing enterprises can obtain higher market demand with relatively low R&D investment as customers’ quality preference for the product service of the follower enterprise increases. Finally, compared to the cooperative R&D strategy, the leader enterprise obtains relatively higher profits under the non-cooperative R&D strategy. This allows the follower enterprise to potentially gain a larger market share of the product service.
The findings of this study have important implications for manufacturing enterprises engaging in market interaction:
  • Manufacturing enterprises should fully recognize the importance of learning and absorptive capabilities, which can supplement their current R&D capabilities.
  • For the vulnerable follower enterprises which are typically limited by factors such as personnel, capital and R&D capabilities, diversifying their R&D strategies can be crucial. This can include outsourcing R&D, integrating with the industrial chain, or collaborating with industry, university, and research partners. These approaches can serve as effective ways for these enterprises to seek external R&D cooperation.
  • Increasing R&D investment can undoubtedly bring lucrative benefits to strong follower enterprises. However, it is unwise for enterprises to blindly pursue product-service upgrading and ignore customers’ feelings about product service. Enterprises should make efforts to improve the quality and publicity of their product service in order to obtain superior customers’ recognition and loyalty.
  • While the cooperative R&D strategy can enhance the follower enterprise’s relative profit advantage, its actual effect is minimal. Similarly, the non-cooperative R&D strategy does not effectively promote the profits and market demand of the follower enterprise, but it does have a significant incentive effect on enterprise R&D investment. This approach enables effective accumulation during the R&D stage, and enables control over costs incurred during the production process and service design. In contrast, the benefits of adopting a non-collaborative R&D strategy outweigh the disadvantages. Therefore, enterprises should carefully consider their R&D strategies and choose the most suitable approach based on their own circumstances, customers’ quality preferences, and market demand.
This paper has made a significant contribution to understanding the relationship between R&D investment and customers’ quality preferences in manufacturing enterprises, shedding light on the pricing decision-making process. However, there are some limitations to this study as it does not fully consider the asymmetry that exists between manufacturing enterprises in practical settings. Additionally, as knowledge continues to accumulate, customer behavior tends to become more rational, demanding faster product-service updates and shorter R&D cycles for manufacturing enterprises. In future research, we plan to address these limitations by refining customer needs, incorporating different types of customers and their purchasing power into manufacturing enterprise R&D, and considering elements such as the R&D cycle and success time to improve the comprehensiveness and accuracy of our model. Additionally, we will focus on data collection and integration with experimental economics-related methods to ensure the reliability of our results. We will also re-examine research methods for data fitting to ensure the robustness of our conclusions. By addressing these aspects, we aim to provide a more comprehensive and robust understanding of the relationship between R&D investment, customer preferences, and pricing decisions in manufacturing enterprises.

Author Contributions

Conceptualization, S.Z. and S.L.; methodology, S.L., H.G. and Q.-M.Z.; software, S.L. and T.Q.; validation, S.L. and J.L.; formal analysis, S.Z.; resources, S.Z.; data curation, S.L. and T.Q.; writing—original draft preparation, S.L. and H.G.; writing—review and editing, S.Z. and J.L.; supervision, S.Z. and Q.-M.Z.; funding acquisition, S.L. and S.Z. All authors have read and agreed to the published version of the manuscript.

Funding

This research was funded by the Science and Technology Program of Zhejiang Province, grant number 2023C01213, the Ministry of Industry and Information Technology of the People’s Republic of China, grant number TC2108048, the Nature Science Foundation of Heilongjiang, grant number LH2022G002.

Institutional Review Board Statement

Not applicable.

Informed Consent Statement

Not applicable.

Data Availability Statement

The data presented in this study are available in insert article.

Conflicts of Interest

The authors declare no conflict of interest.

Notations

NotationDescription
C Fixed costs of an enterprise
D Demand for an enterprise’s SOLUTIONs
H S Total profit of the two enterprises
p Price of the SOLUTIONs provided by an enterprise
ν Total demand size for the SOLUTIONs provided by the two enterprises
x R&D investment scale of an enterprise
β Degree of customer’s quality preference for an enterprise’s SOLUTION
γ R&D efficiency coefficient of an enterprise
θ Absorptive capacity coefficient of an enterprise
λ Cost coefficient of quality of and enterprise
π Profit of an enterprise’s SOLUTION
ω Quality level of an enterprise

References

  1. Liu, Q.; Geertshuis, S.; Grainger, R. Understanding academics’ adoption of learning technologies: A systematic review. Comput. Educ. 2020, 151, 103857. [Google Scholar] [CrossRef] [Green Version]
  2. Vendrell-Herrero, F.; Bustinza, O.F.; Opazo-Basaez, M. Information technologies and product-service innovation: The moderating role of service R&D team structure. J. Bus. Res. 2021, 128, 673–687. [Google Scholar]
  3. Paschou, T.; Rapaccini, M.; Adrodegari, F.; Saccani, N. Digital servitization in manufacturing: A systematic literature review and research agenda. Ind. Mark. Manag. 2020, 89, 278–292. [Google Scholar] [CrossRef]
  4. Grimpe, C.; Sofka, W.; Bhargava, M.; Chatterjee, R. R&D, marketing innovation, and new product performance: A mixed methods study. J. Prod. Innov. Manag. 2017, 34, 360–383. [Google Scholar]
  5. Hwang, B.-N.; Hsu, M.-Y. The impact of technological innovation upon servitization: Evidence from Taiwan community innovation survey. J. Manuf. Technol. Manag. 2019, 30, 1097–1114. [Google Scholar] [CrossRef]
  6. Guajardo, J.A.; Cohen, M.A.; Netessine, S. Service Competition and Product Quality in the U.S. Automobile Industry. Manag. Sci. 2016, 62, 1860–1877. [Google Scholar] [CrossRef] [Green Version]
  7. Saccani, N.; Visintin, F.; Rapaccini, M. Investigating the linkages between service types and supplier relationships in servitized environments. Int. J. Prod. Econ. 2014, 149, 226–238. [Google Scholar] [CrossRef]
  8. Ganek, A.; Kloeckner, K. An overview of IBM service management. IBM Syst. J. 2007, 46, 375–385. [Google Scholar] [CrossRef]
  9. Zhang, Z.; Liu, S.; Niu, B. Coordination mechanism of dual-channel closed-loop supply chains considering product quality and return. J. Clean. Prod. 2020, 248, 119273. [Google Scholar] [CrossRef]
  10. Basir, M.; Modding, B.; Kamase, J.; Hasan, S. Effect of service quality, orientation services and pricing on loyalty and customer satisfaction in marine transportation services. Int. J. Humanit. Soc. Sci. Invent. 2015, 4, 1–6. [Google Scholar]
  11. Taleizadeh, A.A.; Moshtagh, M.S.; Moon, I. Optimal decisions of price, quality, effort level and return policy in a three-level closed-loop supply chain based on different game theory approaches. Eur. J. Ind. Eng. 2017, 11, 486–525. [Google Scholar] [CrossRef] [Green Version]
  12. Nasib, N. The Role of Costumer Satisfaction in Mediating the Relationship Between Service Quality and Price on Costumer Loyalty. Enrich. J. Manag. 2021, 12, 400–411. [Google Scholar]
  13. Sharma, N.; Sahay, B.S.; Shankar, R.; Sarma, P.R.S. Supply chain agility: Review, classification and synthesis. Int. J. Logist. Res. Appl. 2017, 20, 532–559. [Google Scholar] [CrossRef]
  14. Vaittinen, E.; Martinsuo, M.; Ortt, R. Business customers’ readiness to adopt manufacturer’s new services. J. Serv. Theory Pract. 2017, 28, 52–78. [Google Scholar]
  15. Yu, M.; Debo, L.; Kapuscinski, R. Strategic waiting for consumer-generated quality information: Dynamic pricing of new experience goods. Manag. Sci. 2016, 62, 410–435. [Google Scholar]
  16. Wei, M.M.; Zhang, F. Recent research developments of strategic consumer behavior in operations management. Comput. Oper. Res. 2018, 93, 166–176. [Google Scholar]
  17. Permadi, A.; Silalahi, S. The Effect of Customer Experience and Customer Engagement Through Customer Loyalty on Sales Revenue Achievement at PT United Tractors. Emerg. Mark. Bus. Manag. Stud. J. 2021, 9, 1–17. [Google Scholar]
  18. Baskara, A.; Pranaditya, A. Customer Experience and Customer Engagement in Relationship with Customer Loyalty During Black Swan Events COVID-19. Indones. Interdiscip. J. Sharia Econ. 2022, 5, 481–495. [Google Scholar]
  19. Chuang, F.-M.; Morgan, R.E.; Robson, M.J. Customer and Competitor Insights, New Product Development Competence, and New Product Creativity: Differential, Integrative, and Substitution Effects. J. Prod. Innov. Manag. 2015, 32, 175–182. [Google Scholar] [CrossRef]
  20. Grünfeld, L.A. Multinational Production, Absorptive Capacity, and Endogenous R&D Spillovers. Rev. Int. Econ. 2006, 14, 922–940. [Google Scholar]
  21. Yu, X.; Lan, Y.; Zhao, R. Strategic green technology innovation in a two-stage alliance: Vertical collaboration or co-development? Omega 2021, 98, 102116. [Google Scholar] [CrossRef]
  22. D’Aspremont, C.; Jacquemin, A. Cooperative and noncooperative R & D in duopoly with spillovers. Am. Econ. Rev. 1988, 78, 1133–1137. [Google Scholar]
  23. Wang, A.; Zhang, Q.; Zhao, S.; Lu, X.; Peng, Z. A review-driven customer preference measurement model for product improvement: Sentiment-based importance—Performance analysis. Inf. Syst. E-Bus. Manag. 2020, 18, 61–88. [Google Scholar] [CrossRef]
  24. Tripsas, M. Customer preference discontinuities: A trigger for radical technological change. Manag. Decis. Econ. 2008, 29, 79–97. [Google Scholar] [CrossRef]
  25. Chen, J.; Sun, C.; Wang, Y.; Liu, J.; Zhou, P. Carbon emission reduction policy with privatization in an oligopoly model. Environ. Sci. Pollut. Res. 2023, 30, 45209–45230. [Google Scholar] [CrossRef]
  26. Li, T.; Sethi, S.P. A review of dynamic Stackelberg game models. Discret. Contin. Dyn. Syst. B 2017, 22, 125. [Google Scholar] [CrossRef]
  27. Stone-Romero, E.F.; Stone, D.L.; Grewal, D. Development of a multidimensional measure of perceived product quality. J. Qual. Manag. 1997, 2, 87–111. [Google Scholar] [CrossRef]
  28. Ghotbabadi, A.R.; Feiz, S.; Baharun, R. Service Quality Measurements: A Review. Int. J. Acad. Res. Bus. Soc. Sci. 2015, 5, 267–286. [Google Scholar] [CrossRef]
  29. El Ouardighi, F.; Kogan, K. Dynamic conformance and design quality in a supply chain: An assessment of contracts’ coordinating power. Ann. Oper. Res. 2013, 211, 137–166. [Google Scholar] [CrossRef]
  30. Han, X.; Liu, X. Equilibrium decisions for multi-firms considering consumer quality preference. Int. J. Prod. Econ. 2020, 227, 107688. [Google Scholar] [CrossRef]
  31. Chandrasekhar, N.; Gupta, S.; Nanda, N. Food delivery services and customer preference: A comparative analysis. J. Foodserv. Bus. Res. 2019, 22, 375–386. [Google Scholar] [CrossRef]
  32. Kowalkowski, C.; Gebauer, H.; Kamp, B.; Parry, G. Servitization and deservitization: Overview, concepts, and definitions. Ind. Mark. Manag. 2017, 60, 4–10. [Google Scholar] [CrossRef]
  33. Lambertini, L.; Orsini, R. Quality improvement and process innovation in monopoly: A dynamic analysis. Oper. Res. Lett. 2015, 43, 370–373. [Google Scholar] [CrossRef] [Green Version]
  34. Luo, J.; Guo, Y. Research on value creation mechanism of manufacturing enterprises service innovation under given product technology. Oper. Res. Manag. Sci. 2022, 31, 225–231. [Google Scholar]
  35. Safitri, V.A.D.; Anggara, B. Factors that affect the company innovation. In II. In Traders Uluslararası Ticaret Kongresi Kongre Kitabı the Second in Traders International Conference on International Trade Conference Book; Hiper Yayın: Istanbul, Turkey, 2019. [Google Scholar]
  36. Aschhoff, B.; Schmidt, T. Empirical evidence on the success of R&D cooperation—Happy together? Rev. Ind. Organ. 2008, 33, 41–62. [Google Scholar]
  37. Belderbos, R.; Carree, M.; Lokshin, B.; Fernández Sastre, J. Inter-temporal patterns of R&D collaboration and innovative performance. J. Technol. Transf. 2014, 40, 123–137. [Google Scholar]
  38. Li, C.; Liu, Q.; Zhou, P.; Huang, H. Optimal innovation investment: The role of subsidy schemes and supply chain channel power structure. Comput. Ind. Eng. 2021, 157, 107291. [Google Scholar] [CrossRef]
  39. Gao, L.; Guo, L.; Orsdemir, A. Dual-Channel Distribution: The Case for Cost Information Asymmetry. Prod. Oper. Manag. 2020, 30, 494–521. [Google Scholar] [CrossRef]
  40. Iqbal, N.; Naeem, M.A.; Suleman, M.T. Quantifying the asymmetric spillovers in sustainable investments. J. Int. Financ. Mark. Inst. Money 2022, 77, 101480. [Google Scholar] [CrossRef]
  41. Lu, J.-C.; Tsao, Y.-C.; Charoensiriwath, C. Competition under manufacturer service and retail price. Econ. Model. 2011, 28, 1256–1264. [Google Scholar] [CrossRef] [Green Version]
  42. Wang, Y.; Niu, B.; Guo, P. On the Advantage of Quantity Leadership When Outsourcing Production to a Competitive Contract Manufacturer. Prod. Oper. Manag. 2013, 22, 104–119. [Google Scholar] [CrossRef]
  43. Smith, K.G.; Collins, C.J.; Clark, K.D. Existing knowledge, knowledge creation capability, and the rate of new product introduction in high-technology firms. Acad. Manag. J. 2005, 48, 346–357. [Google Scholar] [CrossRef]
  44. Poyago-Theotoky, J. Research joint ventures and product innovation: Some welfare aspects. Econ. Innov. New Technol. 1997, 5, 51–73. [Google Scholar] [CrossRef]
  45. Engelman, R.M.; Fracasso, E.M.; Schmidt, S.; Zen, A.C. Intellectual capital, absorptive capacity and product innovation. Manag. Decis. 2017, 55, 474–479. [Google Scholar] [CrossRef]
  46. Lin, C.; Tan, B.; Chang, S. The critical factors for technology absorptive capacity. Ind. Manag. Data Syst. 2002, 102, 300–308. [Google Scholar] [CrossRef]
  47. Sadeghi Asl, R.; Bagherzadeh Khajeh, M.; Pasban, M.; Rostamzadeh, R. A systematic literature review on supply chain approaches. J. Model. Manag. 2022, 18, 372–415. [Google Scholar] [CrossRef]
Figure 1. The sequence of actions between enterprises.
Sustainability 15 09004 g001
Figure 2. R&D investment varies with the absorptive capacity of enterprise B .
Sustainability 15 09004 g002
Figure 3. SOLUTION price varies with the absorptive capacity of enterprise B .
Sustainability 15 09004 g003
Figure 4. Market demand varies with the absorptive capacity of enterprise B .
Sustainability 15 09004 g004
Figure 5. Enterprise profit vary with the absorptive capacity of enterprise B .
Sustainability 15 09004 g005
Table 1. Equilibrium solution in the case of non-cooperative strategy.
EntryEquilibrium Solution
x a * ( 1 θ b ) { ν [ 6 γ b ( 1 θ a ) 2 ] + 2 γ b ( β a ω a β b ω b ) } 16 γ a γ b γ a ( 1 θ a ) 2 2 γ b ( 1 θ b ) 2
x b * ( 1 θ a ) { ν [ 5 γ a ( 1 θ b ) 2 ] γ a ( β a ω a β b ω b ) } 16 γ a γ b γ a ( 1 θ a ) 2 2 γ b ( 1 θ b ) 2
p a * 3 ν 2 + C + 2 ( β a ω a β b ω b ) 8 γ a γ b + θ a γ a ( 1 θ a ) + 2 θ b γ b ( 1 θ b ) ν ( 1 θ a ) 5 γ a ( 1 + θ a ) ( 1 θ b ) ( 1 θ a θ b ) ν ( 1 θ b ) 6 γ b ( 1 + θ b ) ( 1 θ a ) ( 1 θ a θ b ) 2 [ 16 γ a γ b γ a ( 1 θ a ) 2 2 γ b ( 1 θ b ) 2 ]
p b * 5 ν 4 + C 2 ( β a ω a β b ω b ) 8 γ a γ b + 4 θ b γ b ( 1 θ b ) γ a ( 1 θ a ) ( 1 + θ a ) + 2 ν ( 1 θ b ) [ 3 γ b ( 1 + 3 θ b ) ( 1 θ a ) ( 1 θ a θ b ) ] + ν ( 1 θ a ) [ 5 γ a ( 3 + θ a ) 2 ( 1 θ b ) ( 1 θ a θ b ) ] 4 [ 16 γ a γ b γ a ( 1 θ a ) 2 2 γ b ( 1 θ b ) 2 ]
D a * 2 γ a { ν [ 6 γ b ( 1 θ a ) 2 ] + 2 γ b ( β a ω a β b ω b ) } 16 γ a γ b γ a ( 1 θ a ) 2 2 γ b ( 1 θ b ) 2
D b * 4 γ b { ν [ 5 γ a ( 1 θ b ) 2 ] γ a ( β a ω a β b ω b ) } 16 γ a γ b γ a ( 1 θ a ) 2 2 γ b ( 1 θ b ) 2
π a * γ a [ 8 γ a ( 1 θ b ) 2 ] [ 2 γ b ( 3 ν + β a ω a β b ω b ) ν ( 1 θ a ) 2 ] 2 [ 16 γ a γ b γ a ( 1 θ a ) 2 2 γ b ( 1 θ b ) 2 ] 2 λ a ω a 2
π b * γ b [ 16 γ b ( 1 θ a ) 2 ] [ γ a ( 5 ν β a ω a + β b ω b ) ν ( 1 θ b ) 2 ] 2 [ 16 γ a γ b γ a ( 1 θ a ) 2 2 γ b ( 1 θ b ) 2 ] 2 λ b ω b 2
Table 2. Equilibrium solution in the case of cooperative strategy.
EntryEquilibrium Solution
x a * * γ b ( 1 θ b ) ( β a ω a β b ω b ν ) 8 γ a γ b γ a ( 1 θ a ) 2 γ b ( 1 θ b ) 2
x b * * γ a ( 1 θ a ) ( ν β a ω a + β b ω b ) 8 γ a γ b γ a ( 1 θ a ) 2 γ b ( 1 θ b ) 2
p a * * 3 ν 2 + C + 2 ( β a ω a β b ω b ) 4 γ a γ b + θ a γ a ( 1 θ a ) γ b ( 1 θ b ) ν [ γ a ( 1 θ a 2 ) γ b ( 1 θ b 2 ) ] 2 [ 8 γ a γ b γ a ( 1 θ a ) 2 γ b ( 1 θ b ) 2 ]
p b * * 5 ν 4 + C 4 ( β a ω a β b ω b ) 2 γ a γ b γ a ( 1 θ a ) + θ b γ b ( 1 θ b ) + ν [ γ a ( 3 + θ a ) ( 1 θ a ) γ b ( 1 + 3 θ b ) ( 1 θ b ) ] 4 [ 8 γ a γ b γ a ( 1 θ a ) 2 γ b ( 1 θ b ) 2 ]
D a * * ν [ 6 γ a γ b γ b ( 1 θ b ) 2 γ a ( 1 θ a ) 2 ] + 2 γ a γ b ( β a ω a β b ω b ) 8 γ a γ b γ a ( 1 θ a ) 2 γ b ( 1 θ b ) 2
D b * * ν [ 10 γ a γ b γ a ( 1 θ a ) 2 γ b ( 1 θ b ) 2 ] 2 γ a γ b ( β a ω a β b ω b ) 8 γ a γ b γ a ( 1 θ a ) 2 γ b ( 1 θ b ) 2
π a * * 2 v 2 8 γ a γ b γ a ( 1 θ a ) 2 γ b ( 1 θ b ) 2 2 + γ a γ b 2 [ 8 γ a ( 1 θ b ) 2 ] ( β a ω a β b ω b ν ) 2 + 8 v γ a γ b ( β a ω a β b ω b ν ) [ 8 γ a γ b γ a ( 1 θ a ) 2 γ b ( 1 θ b ) 2 ] [ 8 γ a γ b γ a ( 1 θ a ) 2 γ b ( 1 θ b ) 2 ] 2 λ a ω a 2
π b * * ν 2 8 γ a γ b γ a ( 1 θ a ) 2 γ b ( 1 θ b ) 2 2 + γ a 2 γ b [ 4 γ b ( 1 θ a ) 2 ] ( ν β a ω a + β b ω b ) 2 + 4 ν γ a γ b [ 8 γ a γ b γ a ( 1 θ a ) 2 γ b ( 1 θ b ) 2 ] ( ν β a ω a + β b ω b ) [ 8 γ a γ b γ a ( 1 θ a ) 2 γ b ( 1 θ b ) 2 ] 2 λ b ω b 2
Disclaimer/Publisher’s Note: The statements, opinions and data contained in all publications are solely those of the individual author(s) and contributor(s) and not of MDPI and/or the editor(s). MDPI and/or the editor(s) disclaim responsibility for any injury to people or property resulting from any ideas, methods, instructions or products referred to in the content.