Article

A Parametric-Simulation Method to Study the Interconnections between Urban-Street-Morphology Indicators and Their Effects on Pedestrian Thermal Comfort in Tropical Summer

1
School of Civil Engineering, Central South University, Changsha 410075, China
2
School of Architecture and Art, Central South University, Changsha 410083, China
*
Author to whom correspondence should be addressed.
Sustainability 2023, 15(11), 8902; https://doi.org/10.3390/su15118902
Submission received: 29 March 2023 / Revised: 1 May 2023 / Accepted: 18 May 2023 / Published: 31 May 2023

Abstract

:
Numerous studies have explored the impact of urban morphology and geometry on outdoor thermal comfort, intending to provide practical guidelines for urban designers. However, research findings have been inconsistent, in part due to differences in the climatic settings and the investigated heat-stress indicators. This study proposes a parametric-simulation framework to observe the behavior of thermal comfort according to the possible combinations of building density (BD), street aspect ratio (AR), and orientation. Conducted specifically under a hot-and-humid tropical-savanna summer condition, the study found that building density and aspect ratio were negatively correlated to the Universal Thermal Climate Index (UTCI), with R2 coefficients of 0.99 and 0.91, respectively. The UTCI was improved by a 1.0 °C per 10% increase in BD and by a 1.02 °C per unit of AR increase. The performance of street orientation was significantly influenced by wind direction, and strong inter-influences were found between the three morphology factors. These findings are useful guidelines not only for designing urban morphology but also for intuitively identifying the need for complementary vegetation and cooling materials when morphology indicators cannot reach their efficiency targets (e.g., when AR < 3.0 or building density is limited by local regulations and project specifications).

1. Introduction

The importance of considering microclimate in urban design has been widely recognized in recent years. Kleerekoper et al. and other researchers have pointed out that climate change and urbanization have contributed to the increase in the urban-heat-island effect, which is the phenomenon of urban areas being significantly warmer than their surrounding rural areas [1,2]. This can cause a variety of negative impacts, such as excessive heat stress, reduced outdoor activity, and increased energy consumption [3,4,5]. As a result, urban designers and planners need to incorporate climate-responsive strategies into their design approaches to address this issue [6,7,8]. Creating comfortable outdoor spaces in cities can be achieved by using sustainable materials and urban greenery, thus reducing the urban-heat-island effect [1,9,10]. Urban designers and planners need to consider factors such as street geometry, building height and orientation, shading, and ventilation to create comfortable and livable pedestrian spaces [11,12,13,14]. A comprehensive analysis of urban-heat-mitigation strategies conducted by Lai et al. showed that urban geometry/morphology is the most determinant component, compared to vegetation, materials, and water, in achieving urban-pedestrian thermal comfort [15]. Based on that knowledge, one can understand that urban designers, through the design of urban morphology (UM), can generate a more efficient impact on outdoor thermal conditions.
Now, architects and urban designers have access to state-of-the-art tools and methods that support climate-responsive urban design. These include microclimate-simulation software such as ENVI-met [16], Urban Weather Generator [17], and RayMan [18,19], which allow urban designers and planners to evaluate the thermal performance of different design scenarios. However, despite the availability of these tools and methods, there is still a great need for intuitive design guidelines on which architects and urban designers can intuitively base their design schemes to achieve thermal comfort in the urban spaces they create. This is important not only because not all urban designers and architects have access to these simulation tools or the expertise to operate them and interpret their results but also because of the time-consuming process that computer simulations entail [20,21]. Intuitive design guidelines on urban geometry that can be easily understood and applied by designers are essential to promoting the integration of climate-responsive strategies into urban-design practices [22].
To generate those design guidelines, many researchers have investigated urban-morphology indicators such as building density, street-canyon aspect ratio (AR), orientation, the sky-view factor, building height, etc., in a great variety of experiments. For instance, building density, which refers to the proportion of building footprint in a given area, was studied by Wong et al., who found that an increase in building density without additional urban greening can reduce air temperature by 1.6 °C [23]. Li et al. found that an increase in building density can reduce the physiologically equivalent temperature (PET) by 5 °C when the frontal density is augmented from 0.25 to 0.75 [24]. Ren et al., studying the relationship between local climate zones and thermal comfort, concluded that high-rise building areas produce the lowest predicted mean votes (PMV) and, therefore, are better for thermal comfort [25]. Xue et al., while studying the impacts of building configuration and anthropogenic heat on daily air-temperature cycles in Hong Kong (subtropical climate), explained that increasing building density tends to mitigate thermal stress because when the building density is low, the proportion of the natural ground area is larger, which that leads to more thermal radiation and hotter air temperatures [26]; this is avoided when building density increases. Although some studies (such as the above ones) agree on the general pattern of the heat mitigation induced by building density, other studies have suggested that a building-density increase may not always be beneficial to thermal comfort. In particular, Yang and Li studied the impact of building density on urban albedo and surface temperature and made a different observation when increasing the building density [27]. They observed that building density was optimal at around 40% because that was when the urban albedo was the lowest (around 0.25). In the same experiment, the urban albedo was significantly reduced only when building density increased from 0% to 30%; increasing building density beyond 40% ended up increasing the urban albedo progressively up to 0.35 and 0.40. Now, this pattern of urban albedo can be translated into thermal comfort, according to Taleghani, who established a positive correlation between urban-surface albedo and outdoor thermal comfort (0.1 increase in albedo led to 0.8 higher PET) [28].
The lack of consensus about the impact pattern of urban-morphology parameters on outdoor thermal comfort can also be noted regarding the street aspect ratio, which refers to the ratio of building height to street width. In an early study conducted on urban street canyons in Ghardaia, Algeria (hot and dry tropical climate), Ali-Toudert and Mayer, by increasing the aspect ratio from 0.5 to 4.0, discovered that the aspect ratio had a negative correlation with the physiological equivalent temperature (PET) [29]. Studies that found similar results explained that the increase in street aspect ratio also increased shading on the ground and reduced solar radiation in pedestrian areas, resulting in better thermal comfort [29,30,31]. Nevertheless, a different observation was made by Bochenek and Klemm when studying the variation of the aspect ratio between 0.5 and 2.0 [32]. They found that the correlation between aspect ratio and air-temperature difference (heat mitigation) was positive on N–S streets but that the heat-mitigation pattern was different on E–W streets. They specifically observed that the temperature difference increased from 0.2 °C to 0.5 °C only for aspect ratios below 1.0; increasing the aspect ratio beyond 1.0 had the opposite effect on the temperature difference. Another observation was made by Memon et al. through a hypothetical experiment [33]. They varied the aspect ratio between 0.5 and 8.0 and then calculated a “normalized” temperature difference to measure the heat-mitigation effect in each case. They concluded that, during the daytime, the aspect ratio had a low correlation with heat mitigation (R2 = 0.1).
Regarding street orientation, there are even more disparate results and conclusions from various studies. For example, the study by Ali-Toudert and Mayer showed that N–S streets performed slightly better than E–W streets, but intermediary orientations such as NE–SW and NW–SE had a similar pattern as N–S streets. They explained that the main difference resides in the duration of extreme discomfort throughout the day and that intermediary orientations have longer extreme discomfort during the day [29]. Acero et al. studied the influence of street orientation on outdoor thermal comfort in high-rise-building areas and ended up with some other conclusions: N–S streets performed the best only during the hottest parts of the daytime, and E–W streets did not perform as badly as other studies pointed out. They added that sky cloudiness and wind patterns played a big role in the performance of street orientation. Furthermore, they specified that there was no big difference between street orientations regarding their annual outdoor-thermal-comfort performances [34].
Despite the large amount of work that has been done on urban-morphology descriptors and how they influence pedestrian thermal comfort [1,15,34,35], one can notice through the existing literature that the conclusions are quite disparate, sometimes contradictory. Thus, for a variety of possible reasons, among which are the background climatic settings, the target morphology indicators, and the thermal comfort indicators observed, all can lead to different results and conclusions.
The following questions emerge:
-
Under a specific and typical climate condition (e.g., a clear-sky summer daytime in the hot-and-humid tropical-savanna climate), can a unified theory be formulated about the combined effects of adjacent morphology indicators on pedestrian outdoor thermal comfort?
-
Are there limits/thresholds to the performance of urban-morphology parameters (building density, aspect ratio, and orientation) that could serve as specific urban-design targets?
Focusing on hot-and-humid tropical climates, this study intends to clarify the correlation of urban-street-morphology indicators such as building density, street orientation, and aspect ratio through a parametric simulation of thermal comfort to observe the variation of thermal comfort according to the change in each morphology indicator while under the influence of adjacent indicators. Despite the multitude of urban-morphology indicators, very few of them (sky-view factor, building density, street aspect ratio, and street orientation) have been extensively studied and proven to be the most relevant to microclimate-responsive design strategies [15]. The sky-view factor and street aspect ratio are both equally indicated for measuring sky openness, but the calculation of the sky-view factor has a wider application and may take into account vegetation and other shading devices. Since this study focuses on street-canyon morphology and urban vegetation and shading devices will not be investigated, it is not deemed necessary to investigate both the sky-view factor and the aspect ratio. Hypothetically, they will have the same impact pattern on pedestrian outdoor thermal comfort. Aspect ratio was chosen because its calculation is simple and indicative enough to measure sky openness in a street canyon in the absence of vegetation and shading devices. Therefore, three street-canyon-morphology indicators will be investigated in relation to thermal comfort.
In the following, the research materials and methods are presented: a brief overview of the methodology (Section 2.1); the target climatic area and its significance on a global scale (Section 2.2); how the experimental values of building density, aspect ratio, and orientation are determined (Section 2.3); the parametric scenarios showing the systematic value-combination logic (Section 2.4); the validity of the simulation model and its calibration (Section 2.5 ); and the simulation-output processing (Section 2.7). Then, the results are presented and analyzed (Section 3.1, Section 3.2 and Section 3.3). The Discussion section offers an in-depth analysis of individual correlations (Section 4.1) and the interconnections between morphology indicators and how they can be interpreted (Section 4.2).

2. Materials and Methods

2.1. Overview

The study used a parametric-simulation technique, which consists of building as many spatial-configuration scenarios as possible by combining predetermined values of spatial parameters. The spatial parameters used in this study were urban-street-morphology indicators: building density, street aspect ratio, and orientation. The values were selected based on benchmarks reported in relevant previous studies, then adjusted to facilitate the design of the experimental models. Later in the process, the analyses and the interpretation of the results were performed. A reliable and globally used microclimate-simulation software (ENVI-met) was employed for the experiment. First, each urban-morphology scenario was represented by a 3D model built in ENVI-met. Second, a typical parameterization of ENVI-met (grid resolution, boundary conditions, simulation time and duration, etc.) was defined based on relatively accurate parameterizations reported by previous ENVI-met studies under warm-and-humid tropical climates; the same grid resolution and weather boundary conditions were applied for every scenario. Third, 117 receptors were implanted in each experimental model and their locations were conserved for all the scenarios. Fourth, the output Universal Thermal Climate Index (UTCI) values at pedestrian height were exported to and centralized in Excel for post-processing. The UTCI values were then grouped by morphology configuration to observe the behavior of the overall UTCI. The variation trends were graphed to observe the basic patterns, based on which nominal rules were derived to classify and express the level of pedestrian thermal comfort achieved by different combinations of urban density, street aspect ratio, and street orientation.
In the following subsections, the selection of the humid and warm tropical climate as the target of the experiment is explained, and then each step of the numerical experiment is described, starting with the street-morphology indicators and the selection of their values. Then, the simulation scenarios are presented, followed by the ENVI-met software parameterization, the output processing, and how the classification rules were derived.

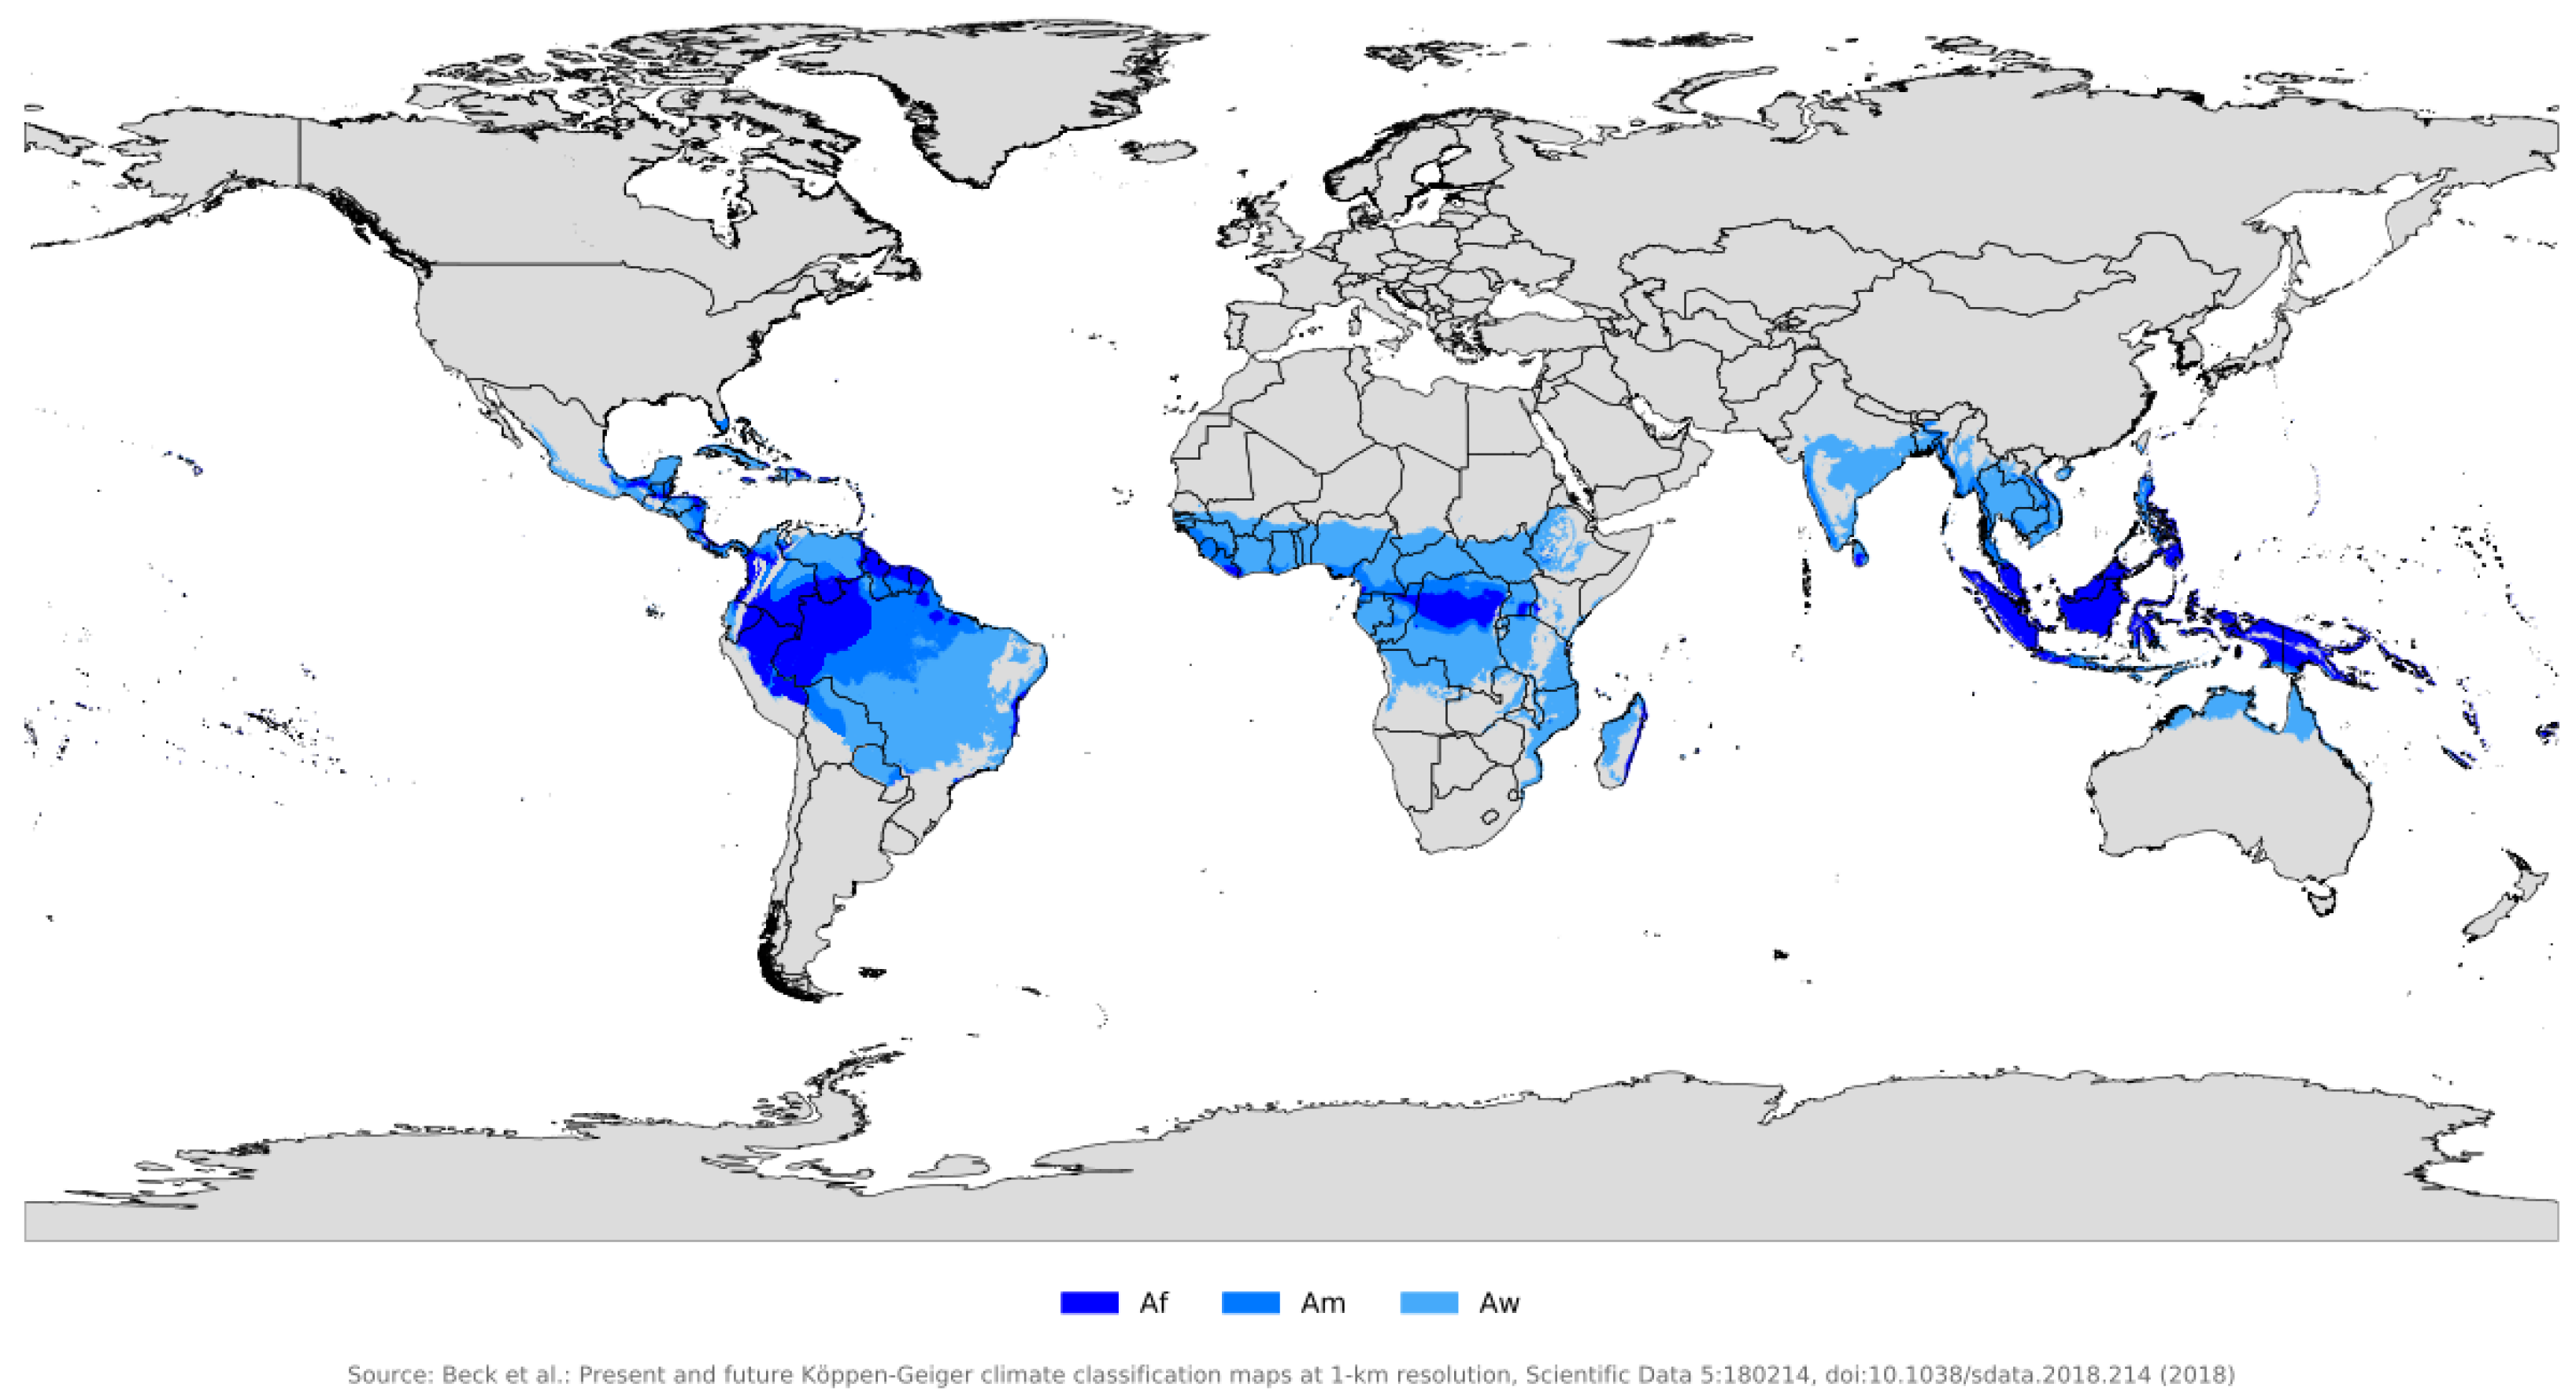
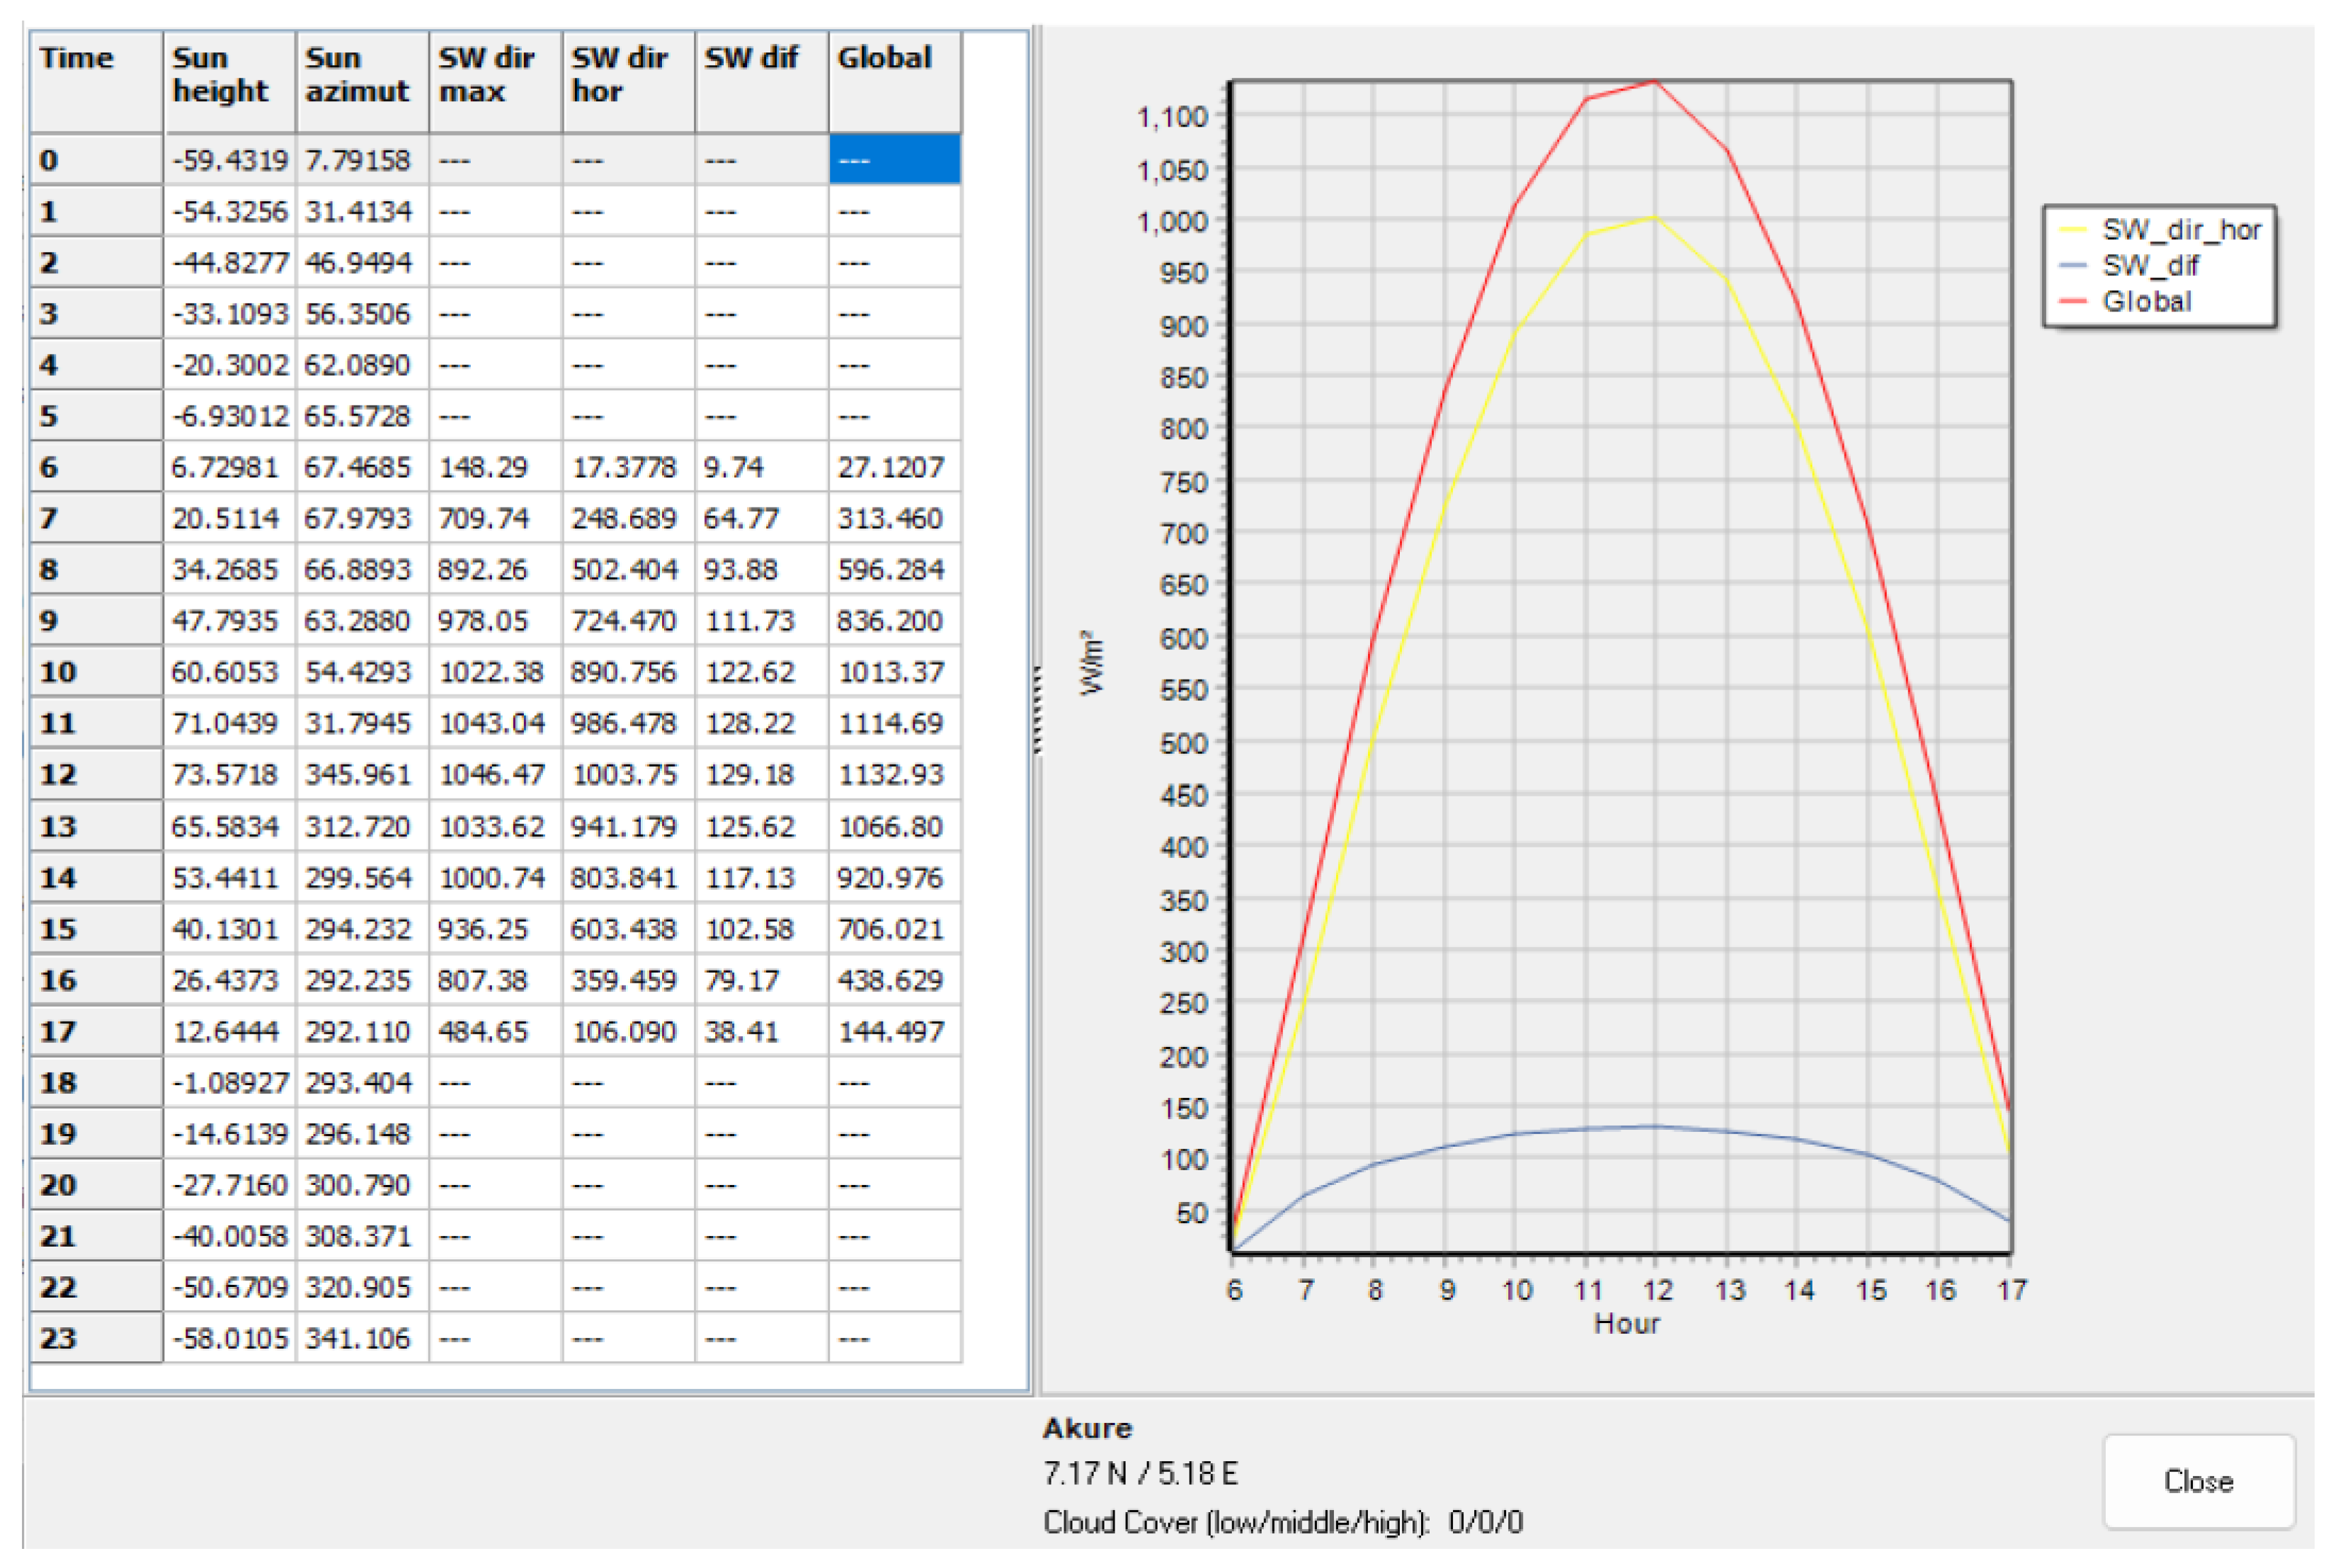
2.2. Target Climatic Area

This study intends to address tropical climates considering the important urban demographics they cover. Since the 1990s, 17.5% of the world population has been reported to live in a tropical savanna climate (Aw according to the Köppen climate classification) areas, the second most populated climate zone just after the temperate-subtropical-climate type (19.5%) [36]. Despite the great urban population that they cover, tropical rainforest, tropical monsoon, and tropical savanna were shown to be among the most understudied climate zones in the world in a recent study by Richards et al. [37].
According to the Köppen world-climate classification, there are three types of tropical climate: tropical rainforest (Af), tropical monsoon (Aw), and tropical savanna (Aw/As), mainly distributed over Latin America, Sub-Saharan Africa, and Southeast Asia [38] as shown in Figure 1. It turns out that these three regions have the fastest urban-population growth, and is expected to have the fastest urbanization by 2050 [39]. Unfortunately, as Mellinger argued, tropical climates could be “highly detrimental” to human settlement and challenging for long-term economic development [40].
The superposition of urban demographics with the difficult climatic conditions and the economic challenges they implicate should make the tropical climate very compelling for urban planners. This study considered, therefore, the tropical climate for the application of the thermal-comfort-based classification of urban geometry. Numerical microclimate simulations and their boundary conditions were therefore calibrated as is typical for the tropical-savanna climate zone (Aw), which represents roughly the largest proportion (60%) of the total tropical climate area.

2.3. Morphology Indicators and Value Selection

Land-use intensity, building form, building layout, and canyon geometry have been identified as the urban-morphology descriptors that affect urban outdoor thermal comfort [35]. Since the scope of this study is pedestrian thermal comfort, only canyon-geometry indicators (building density, street aspect ratio, and street orientation) were investigated. For the selection of the experimental values, the results of previous studies on building density, street aspect ratio, and orientation were referenced.
The building-density value selection was based on a study by Ye and Van Nes on building density at different urban-maturation stages. They reported that building-density values could range from 3.2% to 80.7% [41]. For the convenience of the modeling, the experiment in this paper started with 80% and progressively decreased the building density at a 20% rate, resulting in four density values: 80%, 60%, 40%, and 20%.
The street-aspect-ratio value selection was based on a literature review by Ahmad and Chaudhry on simulation studies in urban street canyons and intersections [42]. They listed three basic values—0.5, 1, and 2—as respective benchmarks for shallow, uniform, and deep streets, respectively. In addition to these three values, Ali-Toudert and Mayer considered a fourth value (aspect ratio = 4) [29]. For the experiment presented in this paper, a fifth value was inserted (aspect ratio = 3) to reduce the gap between the third and the last value. Therefore, the list of values defined for the street aspect ratio is 0.5, 1.0, 2.0, 3.0, and 4.0.
The values of street orientation were simply taken from what was considered by Ali-Toudert and Mayer (2006): north–south (N–S), east–west (E–W), northeast–southwest (NE–SW), and northwest–southeast (NW–SE) [29].

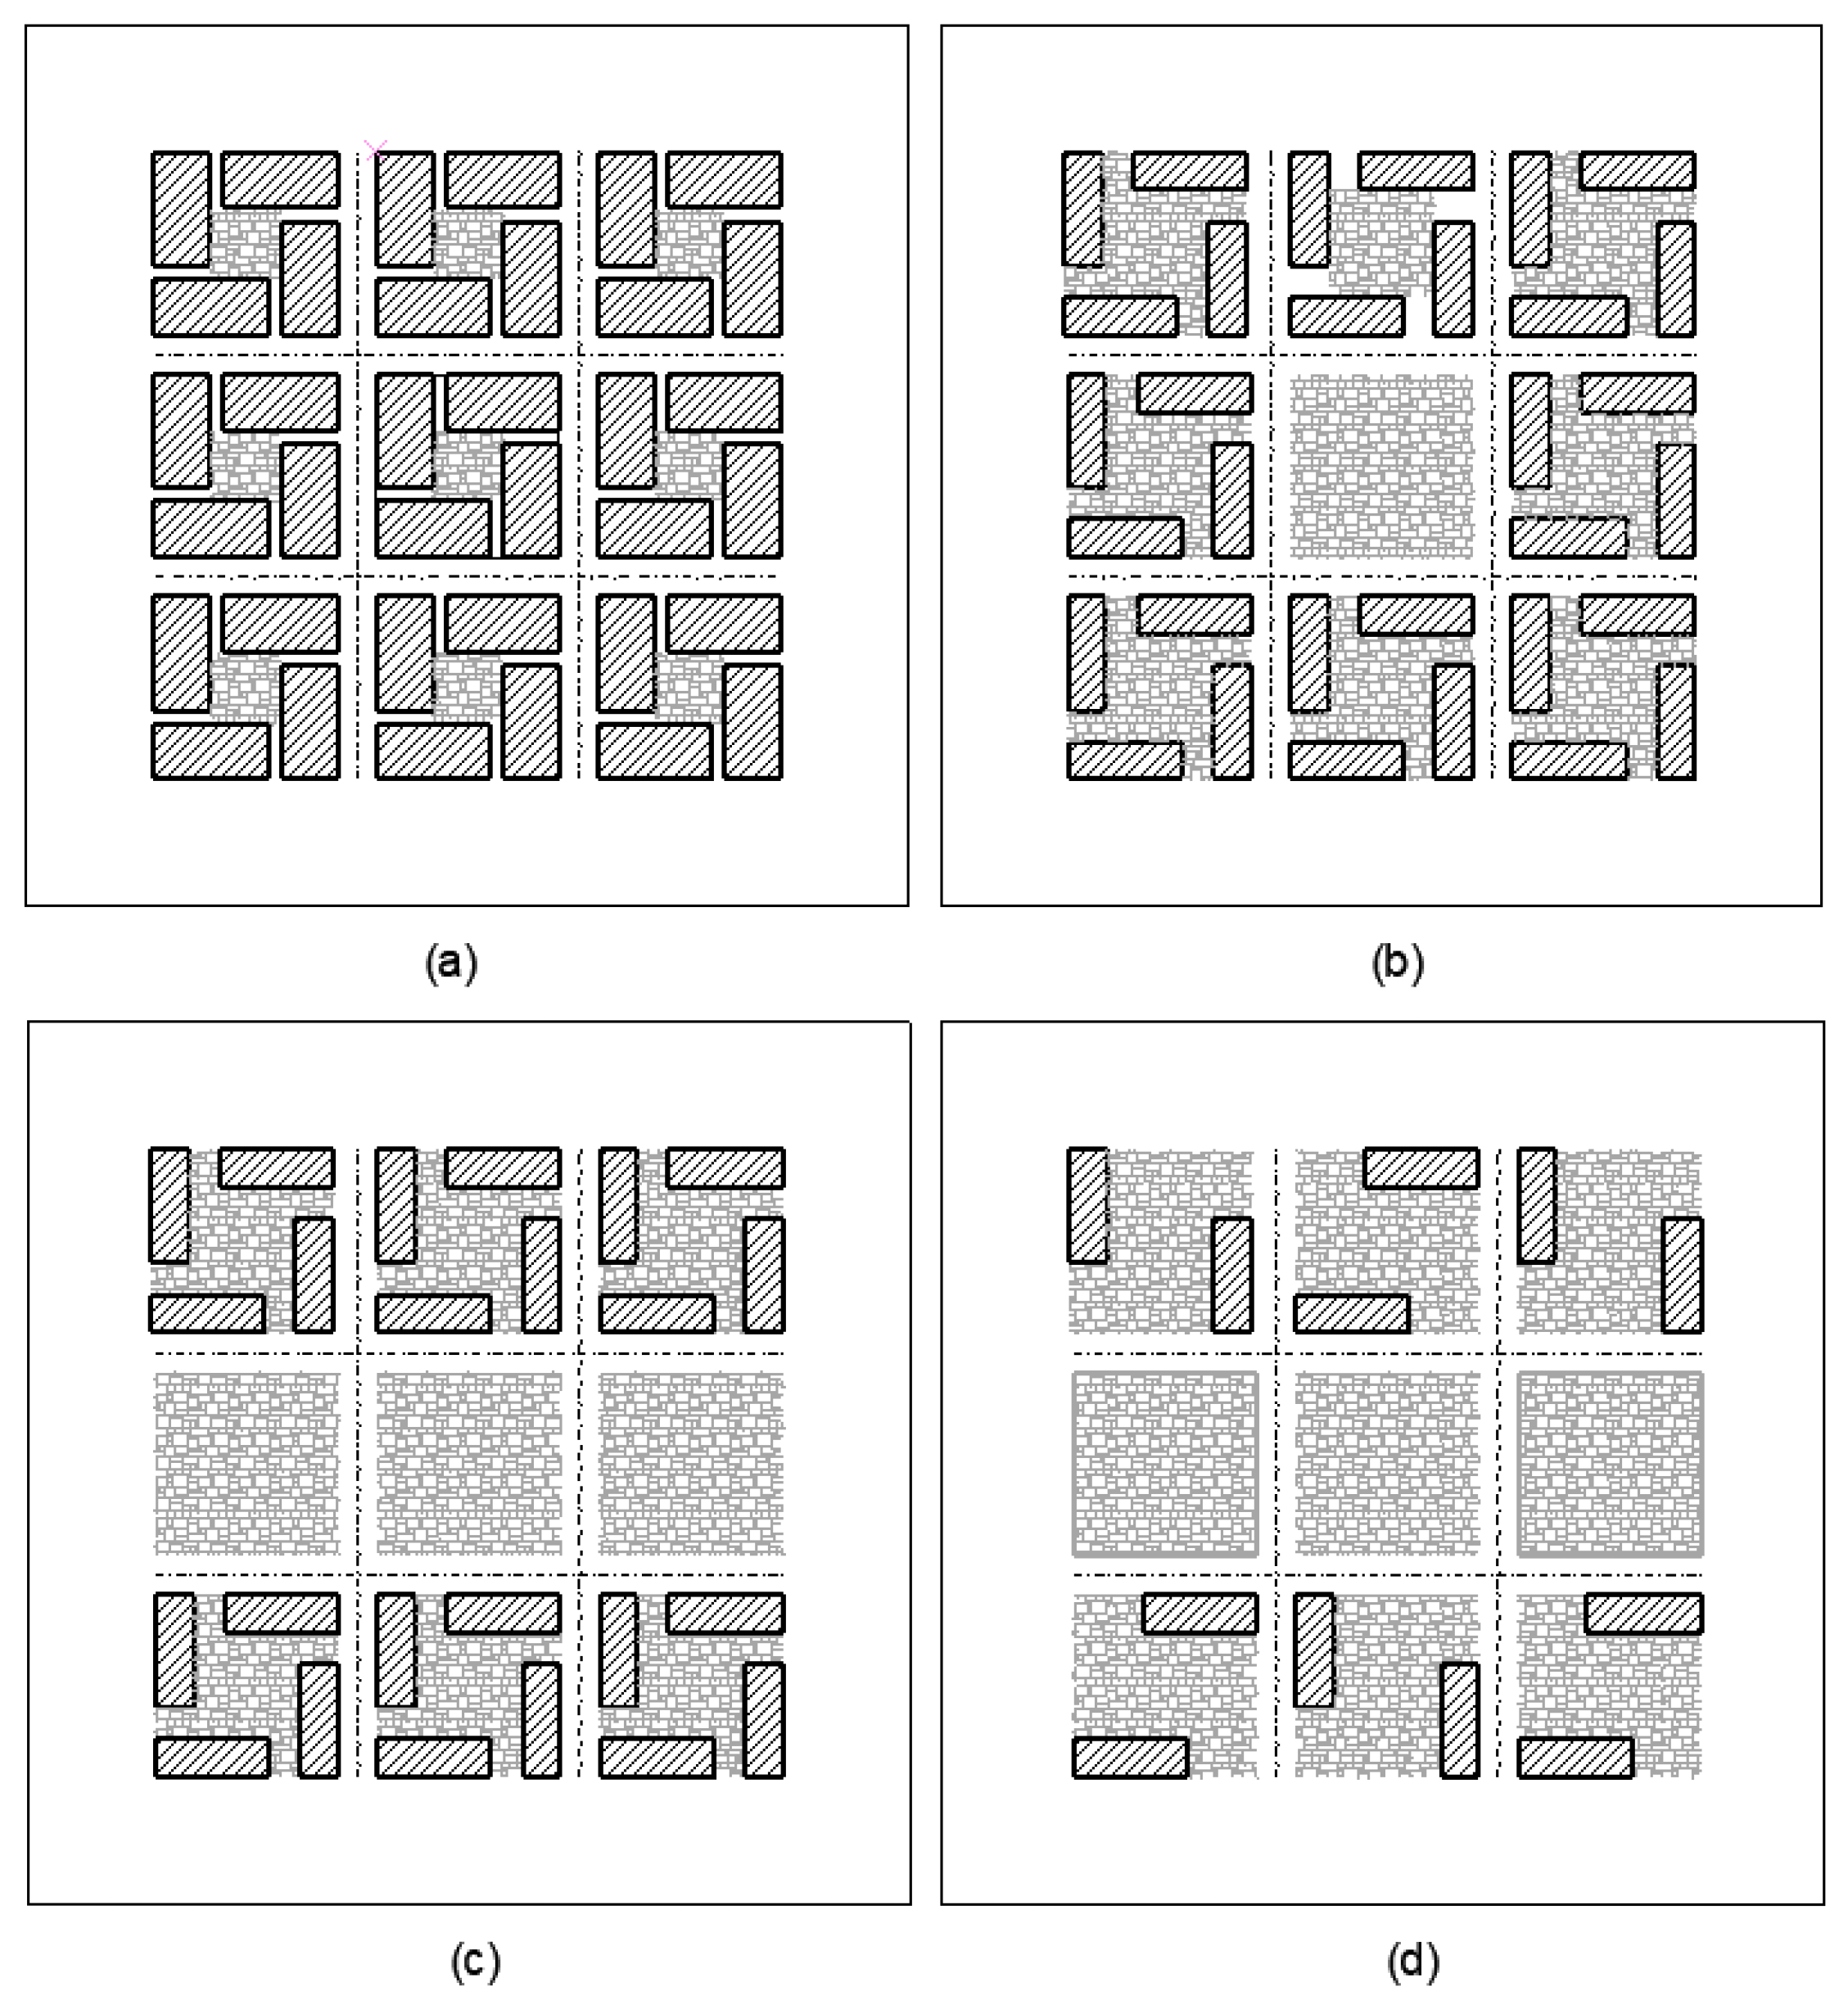
2.4. Parametric-Simulation Scenarios
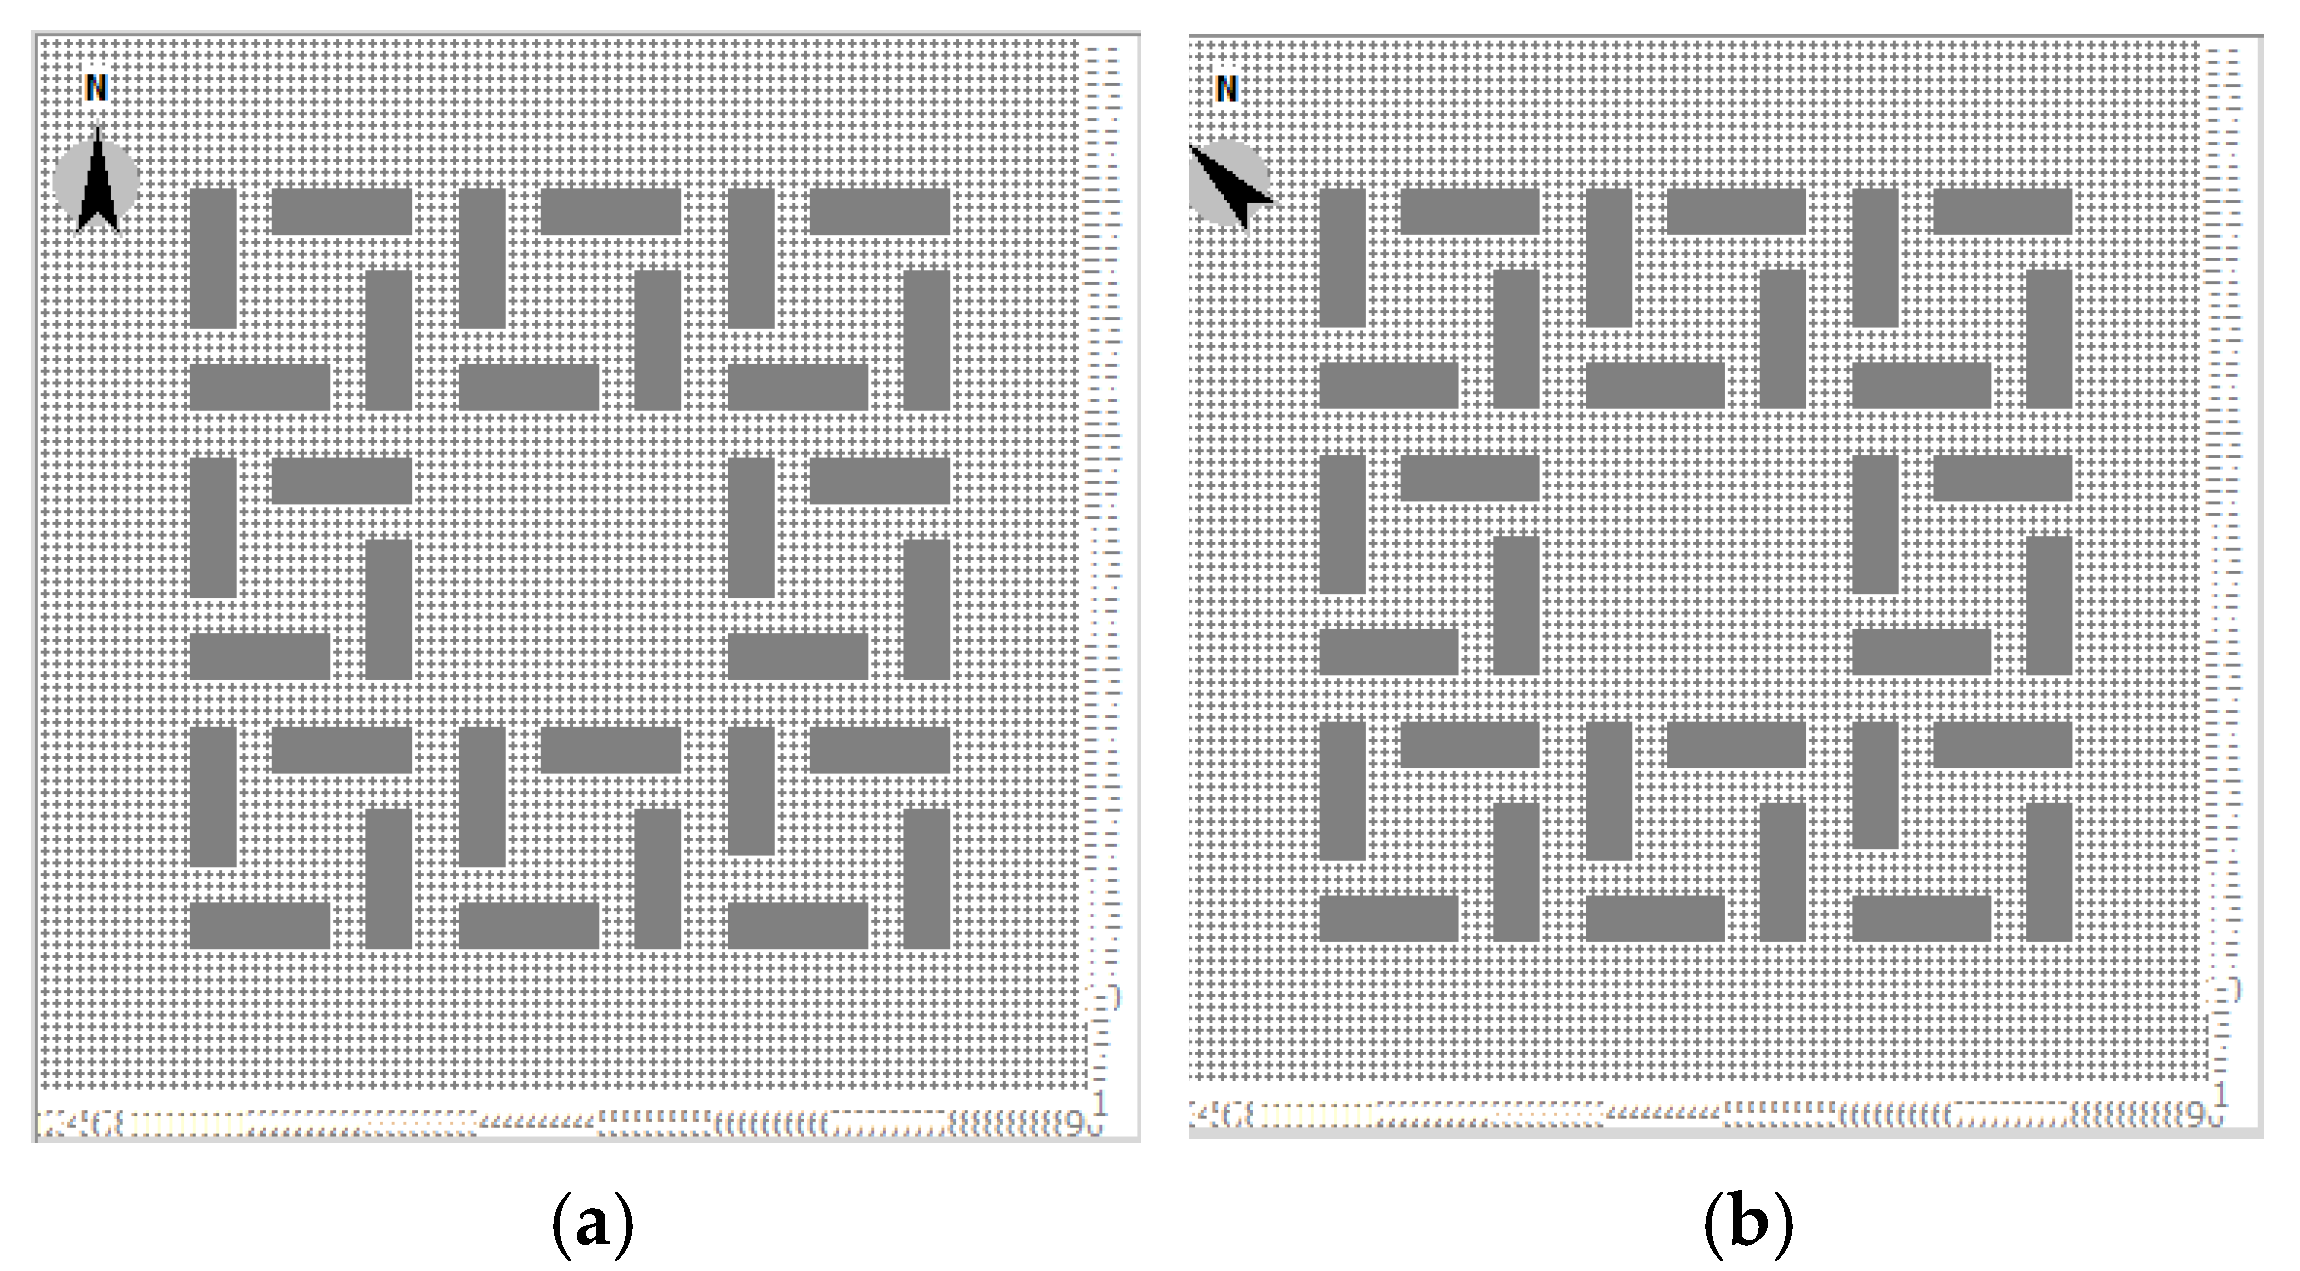
In total, 80 (4 × 4 × 5) urban-morphology (UMi) scenarios were built for this study. As shown in the following table (Table 1), each of the four values of building density (BDi) was combined with the five aspect-ratio values (ARi). Then, each of the 20 BDi/ARi scenarios was combined with 4 street orientations (Oi), yielding 80 scenarios in total.

2.5. Modeling

The numerical models were built on a 360 m × 360 m area. The built-up zone covers a 130 m × 130 m area, which left a 115 m-wide perimeter around the building model for a good wind-flow simulation because the computational-fluid-dynamic-based wind simulations in ENVI-met require a sufficient “empty” perimeter around the building model for a good wind-flow simulation [43]. Figure 2, below, shows the building footprint for each building-density value. Starting from 80% density, the number of buildings and their size were incrementally adjusted to reduce the overall density to 60%, 40%, and 20%. The streets are 8 m wide, based on which the building heights were set to 4 m, 8 m, 16 m, 24 m, and 32 m to obtain the intended street aspect ratios (0.5, 1.0, 2.0, 3.0, and 4.0, respectively).
A perpendicular street network was adopted so that one model could include two street orientations at once. As shown in Figure 3, the model’s north was rotated by 45° to simulate a different set of street orientations. When the model’s north was set to 0°, N–S and E–W street orientations were simulated, and when north was set to 45°, NE–SW and NW–SE street orientations were simulated.

2.6. Microclimate Simulation

Software
The microclimate-simulation software ENVI-met 4.4.4 was used to conduct the 3D modeling and the outdoor-thermal-comfort calculation for each of the 80 urban-morphology scenarios. ENVI-met was chosen for this experiment first for its wide-spread use among urban-microclimate researchers and second for the confirmed reliability of its simulations, as reported by many studies around the globe and across different climatic zones, including 8.5% of the studies in tropical climates (5.8% in tropical-rainforest climates, 0.4% in tropical-monsoon climates, and 2.3% in tropical-savanna climates) [44].
As this study targeted tropical climates, it is important to highlight the reliability of the ENVI-met microclimate-simulation model for the experiment. For that purpose, the existing literature was screened for ENVI-met model-validation metrics. To provide an overview, Table 2 presents the results of the correlation, error, and bias analyses obtained by comparing the ENVI-met simulation with field-measurement data at significantly distant locations in the world (Bangkok, Thailand; Cuiaba, Brazil; Akure, Nigeria; and Pathanamthitta, India) that all have in common tropical climate conditions. There are many more reported ENVI-met validation studies in tropical climates, but not all of them provide detailed and complete analyses on the correlations, errors, and biases between simulated data and field measurements [44]. Nevertheless, these four were selected because they are significantly distant geographically, and they provide rather detailed validation metrics—the point being to show that the ENVI-met simulation model can be quite reliable for tropical areas around the world. To conform with the scope of this study, only summertime validation metrics are presented here. Overall, regarding the correlation ratio (R2 > 0.8), one can deduce that ENVI-met is quite reliable for simulating microclimate in tropical areas. One should also note differences in the errors and biases (especially for relative humidity), which are often due to discrepancies between the simulation-parameterization and field-measurement settings.
ENVI-met Simulation Settings
ENVI-met has been used for many studies around the world in hot-and-warm, humid tropical climates [49]. Few of those studies have published the detailed parameterization of the ENVI-met model that led to relatively accurate predictions. Studies have shown that the accuracy of the ENVI-met simulation is determined by the grid resolution (size of grid cells), the domain size (number of grids), and boundary conditions (air temperature, relative humidity, wind speed, wind direction, cloud conditions, etc.). Table 3 below shows a representative summary of the ENVI-met simulation settings at different locations in tropical climates (Pathanamthitta, Kerala (India) [48]; Cuiaba, Brazil [46,49,50]; and Akure Nigeria [47]). One may notice that the simulation settings were significantly similar. Apart from reasonable differences in the domain size, the simulation period, and the start time, the simulation duration was typically more than 48 h and the grid resolution was around 2 m or 2.5 m in the x, y, and z directions. For the meteorological-boundary conditions, wind speed was not more than 3 m/s; the dominant wind direction was often east, south, or southwest, depending on the location; air temperature varied between 24 °C and 38 °C; relative humidity was between 50% and 90%; and a clear-sky condition was often applied.
Based on the reported simulation settings and their accuracy (Table 2), calibrating ENVI-met simulations around these values should yield acceptable results. In this study in particular, except for the domain size, the experimental simulations were run with ENVI-met V4 and calibrated on the same setup as reported by Morakinyo et al. in Akure, Nigeria (Table 3), because they had a significantly high correlation with the site measurements and fewer errors [47]. The domain size used in this study was 360 m × 360 m × 100 m, corresponding to 180 × 180 grids in the x and y directions. In the z direction, the first grid-subdivision function was applied with 10% telescoping grids above 2 m. The so-called “two-equation” or “standard” turbulence-kinetic-energy (TKE) model [43], which is integrated into the ENVI-met computational model, was applied for turbulence calculation during the wind-flow simulation. In ENVI-met, the hourly position of the sun and solar-radiation assumptions were derived from the input geoinformation of Akure (latitude: 7°17′ N; longitude: 5°18′ E; time zone: UTC+1; elevation: 1.15 m above sea level) and the simulation date (1 September) under cloud-free conditions. The derived global solar radiation increased from 27.12 W/m2 at 6:00 to 1132.93 W/m2 at 12:00 and dropped to 144.50 W/m2 at 17:00. The detailed variations of sun position and those of direct, diffuse, and global solar radiation are shown in Appendix A.

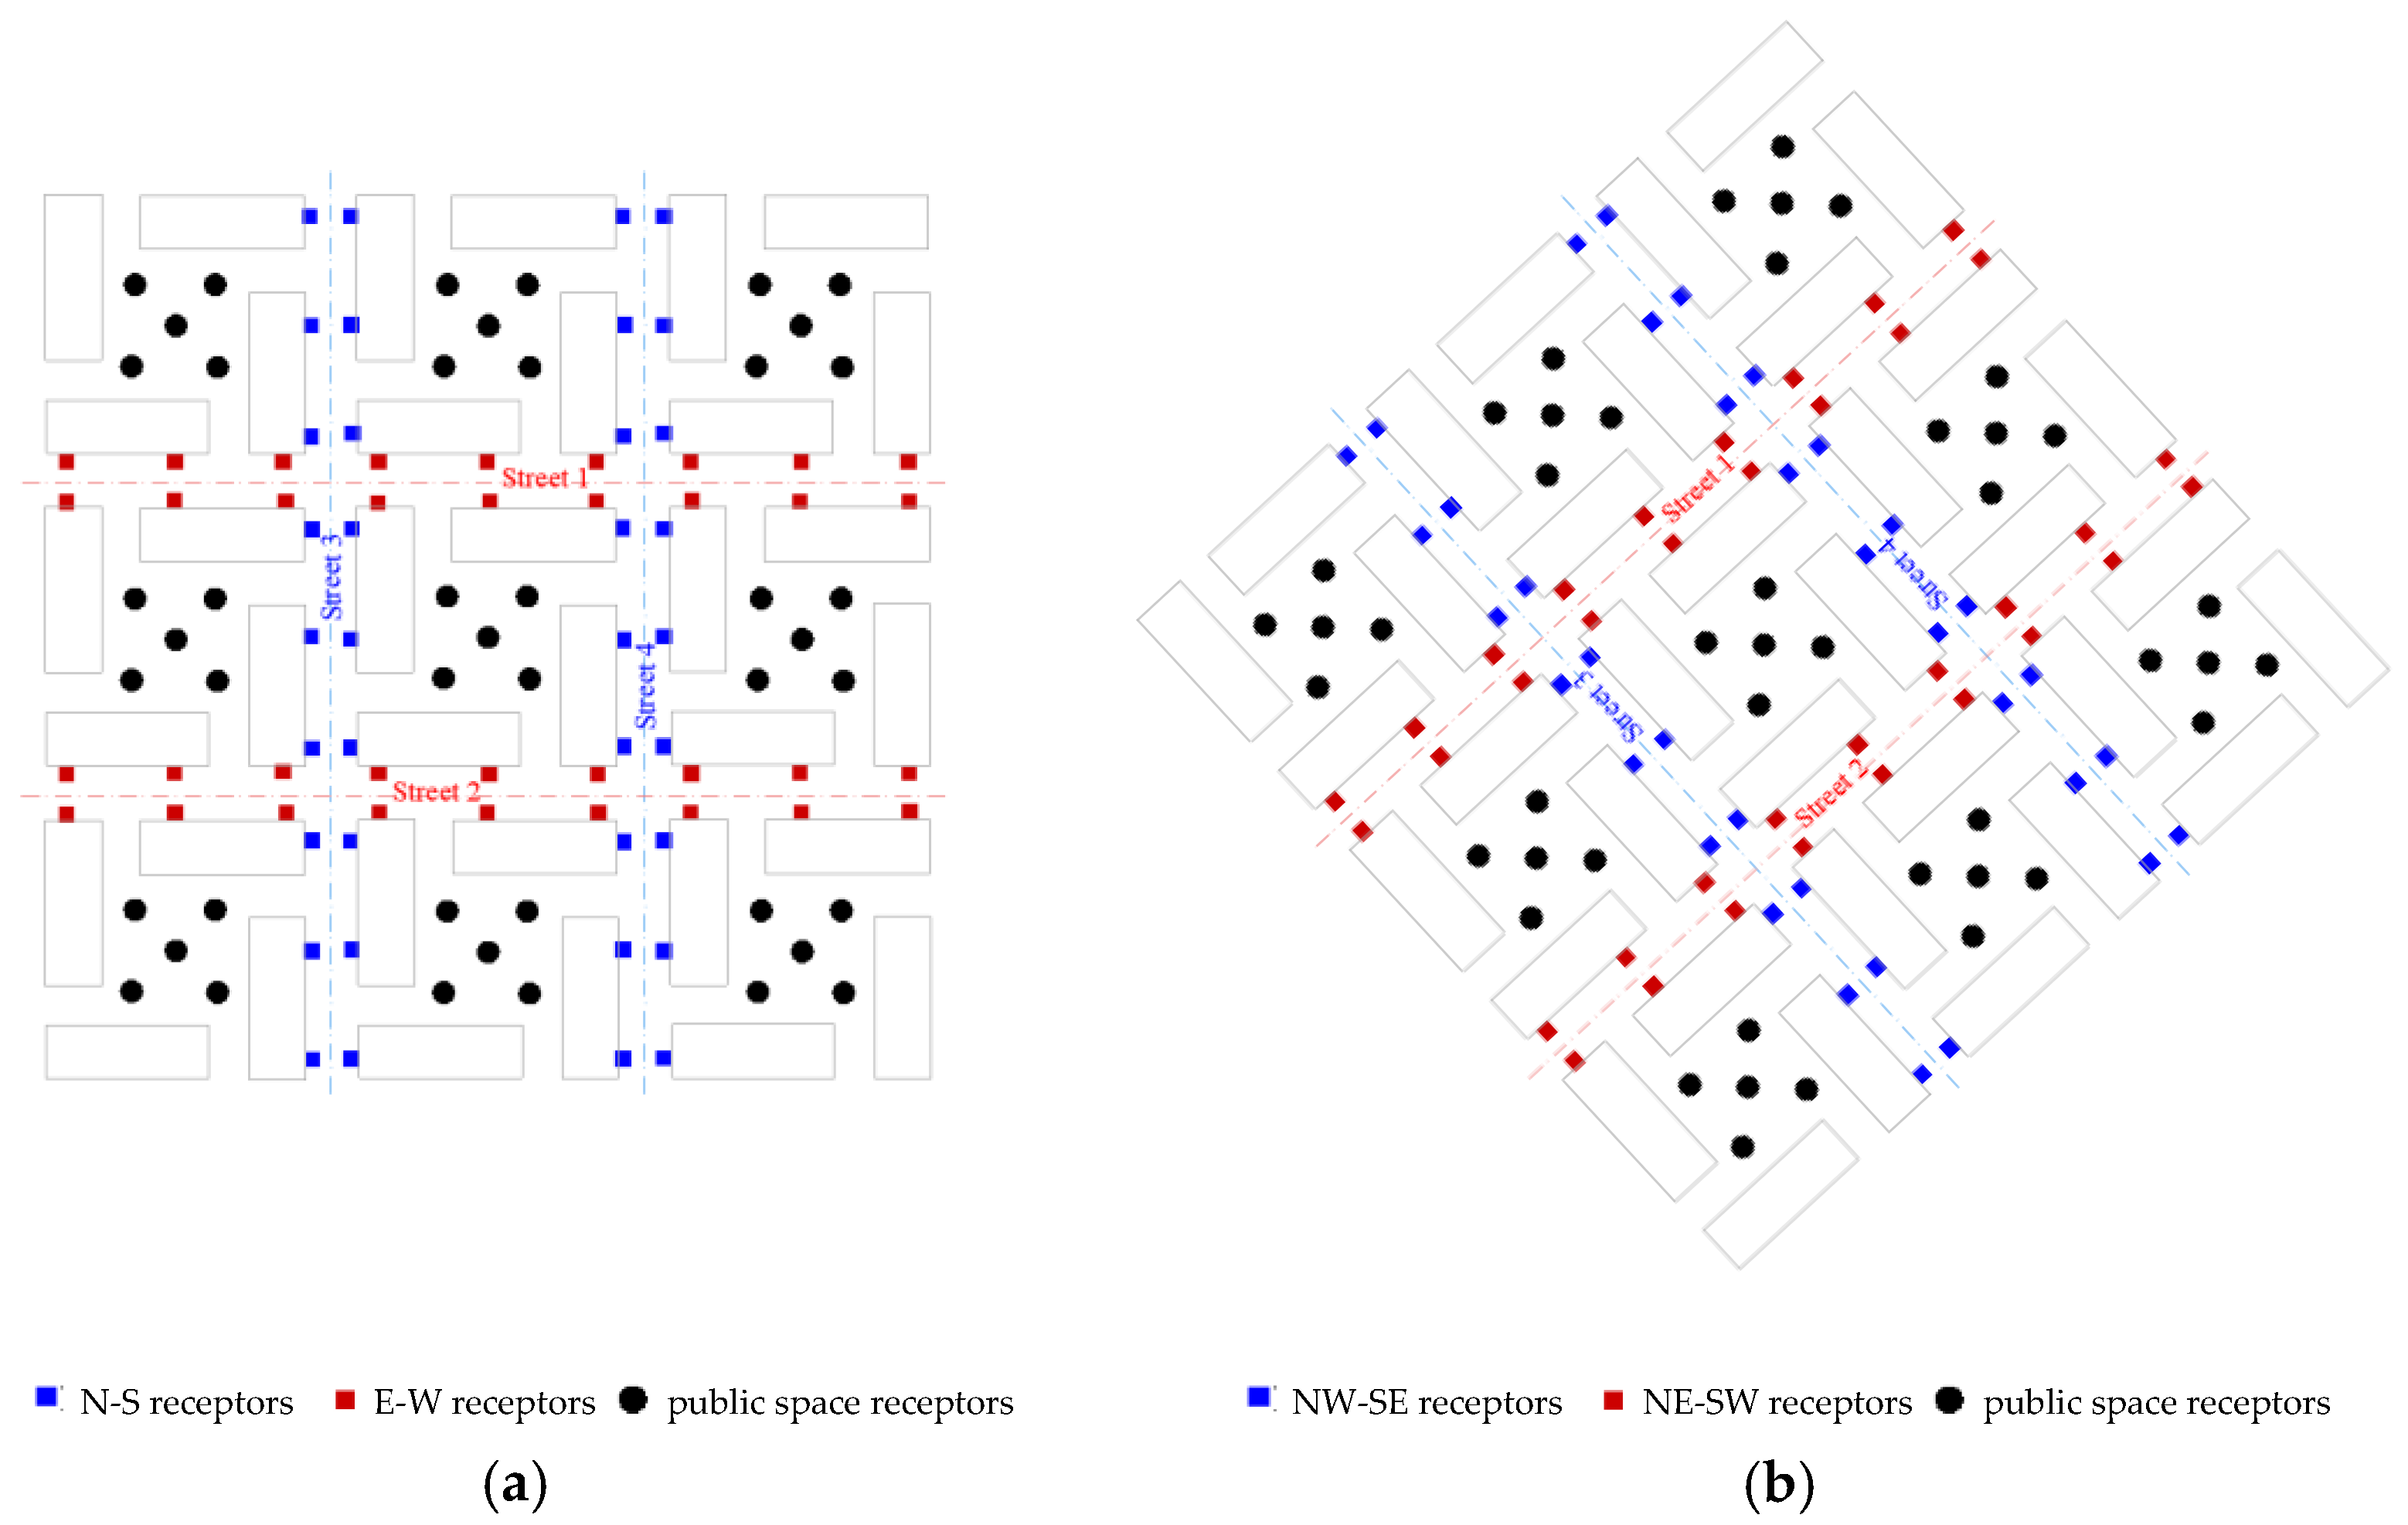
2.7. Output Processing

The simulation outputs were first processed in the Biomet software incorporated into ENVI-met for thermal-comfort calculation. Many urban-microclimate studies have used ground temperature, air temperature, mean radiant temperature, and the like to measure heat stress. Recently, there has been a larger tendency and recommendation to use indicators that reflect the human physiological response to heat sensation [51]. The most commonly employed thermal-comfort indicators include the physiological equivalent temperature (PET), the predicted mean vote (PMV), the predicted percentage dissatisfied (PPD), the standard effective temperature (SET), the thermal-sensation vote (TSV), and the Universal Thermal Climate Index (UTCI) [52]. To the authors’ best knowledge, there is still an ongoing debate about the scope of applicability of these thermal-comfort indices and their suitability for different climate conditions [52,53,54,55]. Setting aside the uncertainties, the PET and the UTCI were computed in the process of this research, and the high correlation between these two indices, as previously mentioned by Zare et al., was confirmed [56]. For the sake of the simplicity of this paper, only the UTCI was chosen to display the results. Not only is the UTCI among the most used worldwide but it also has been consistently and reliably applied in scientific research over the last decade [57,58].
The UTCI is a multi-node human-thermoregulation model that takes into account meteorological conditions (air temperature, relative humidity, wind velocity, radiation fluxes that impact the human thermo-physiological state) and human-body parameters [54,59]. In ENVI-met, the UTCI was calculated in each scenario based on the ISO 7730 standard values for human biological parameters (height = 1.75, weight = 75 kg, age = 35, sex = male, clothing = 0.5). Walking is considered the typical activity in urban streets, and the activity level was set accordingly (80 W) [60]. The output UTCI values were then exported to Excel for post-processing.
There were 40 models for the 80 scenarios, with each model representing 2 street orientations at a time. In each model, there were 117 receptors (Figure 4). Depending on the model orientation, the receptors were organized into three categories to calculate the average UTCI values for different street orientations in different building-density and aspect-ratio combinations. At each location, the UTCI was calculated at 1.5 m from the ground.
UTCI data tables were generated from 6:00 to 17:00 on 2 September. The classification of the receptor data to obtain the hourly averages is explained in Appendix B. Since there were 40 models, a total of 520 tables were generated. In each table, the daytime average UTCI values for each type of space (streets and public courtyards) were calculated. The values were then grouped by street aspect ratio and building density to obtain the following tables (Table 4, Table 5, Table 6, Table 7 and Table 8), which express the variation of the UTCI according to building density (BD) and street aspect ratio (AR) on different streets and in public courtyards.
To specifically observe the behavior of the UTCI according to each of the variables (AR, BD, and OR), the UTCI data in the five tables (Table 4, Table 5, Table 6, Table 7 and Table 8) were rearranged to generate different graphs showing the correlation trends between the three urban-morphology indicators and eventually deduce correlation rules and guidelines.

3. Results

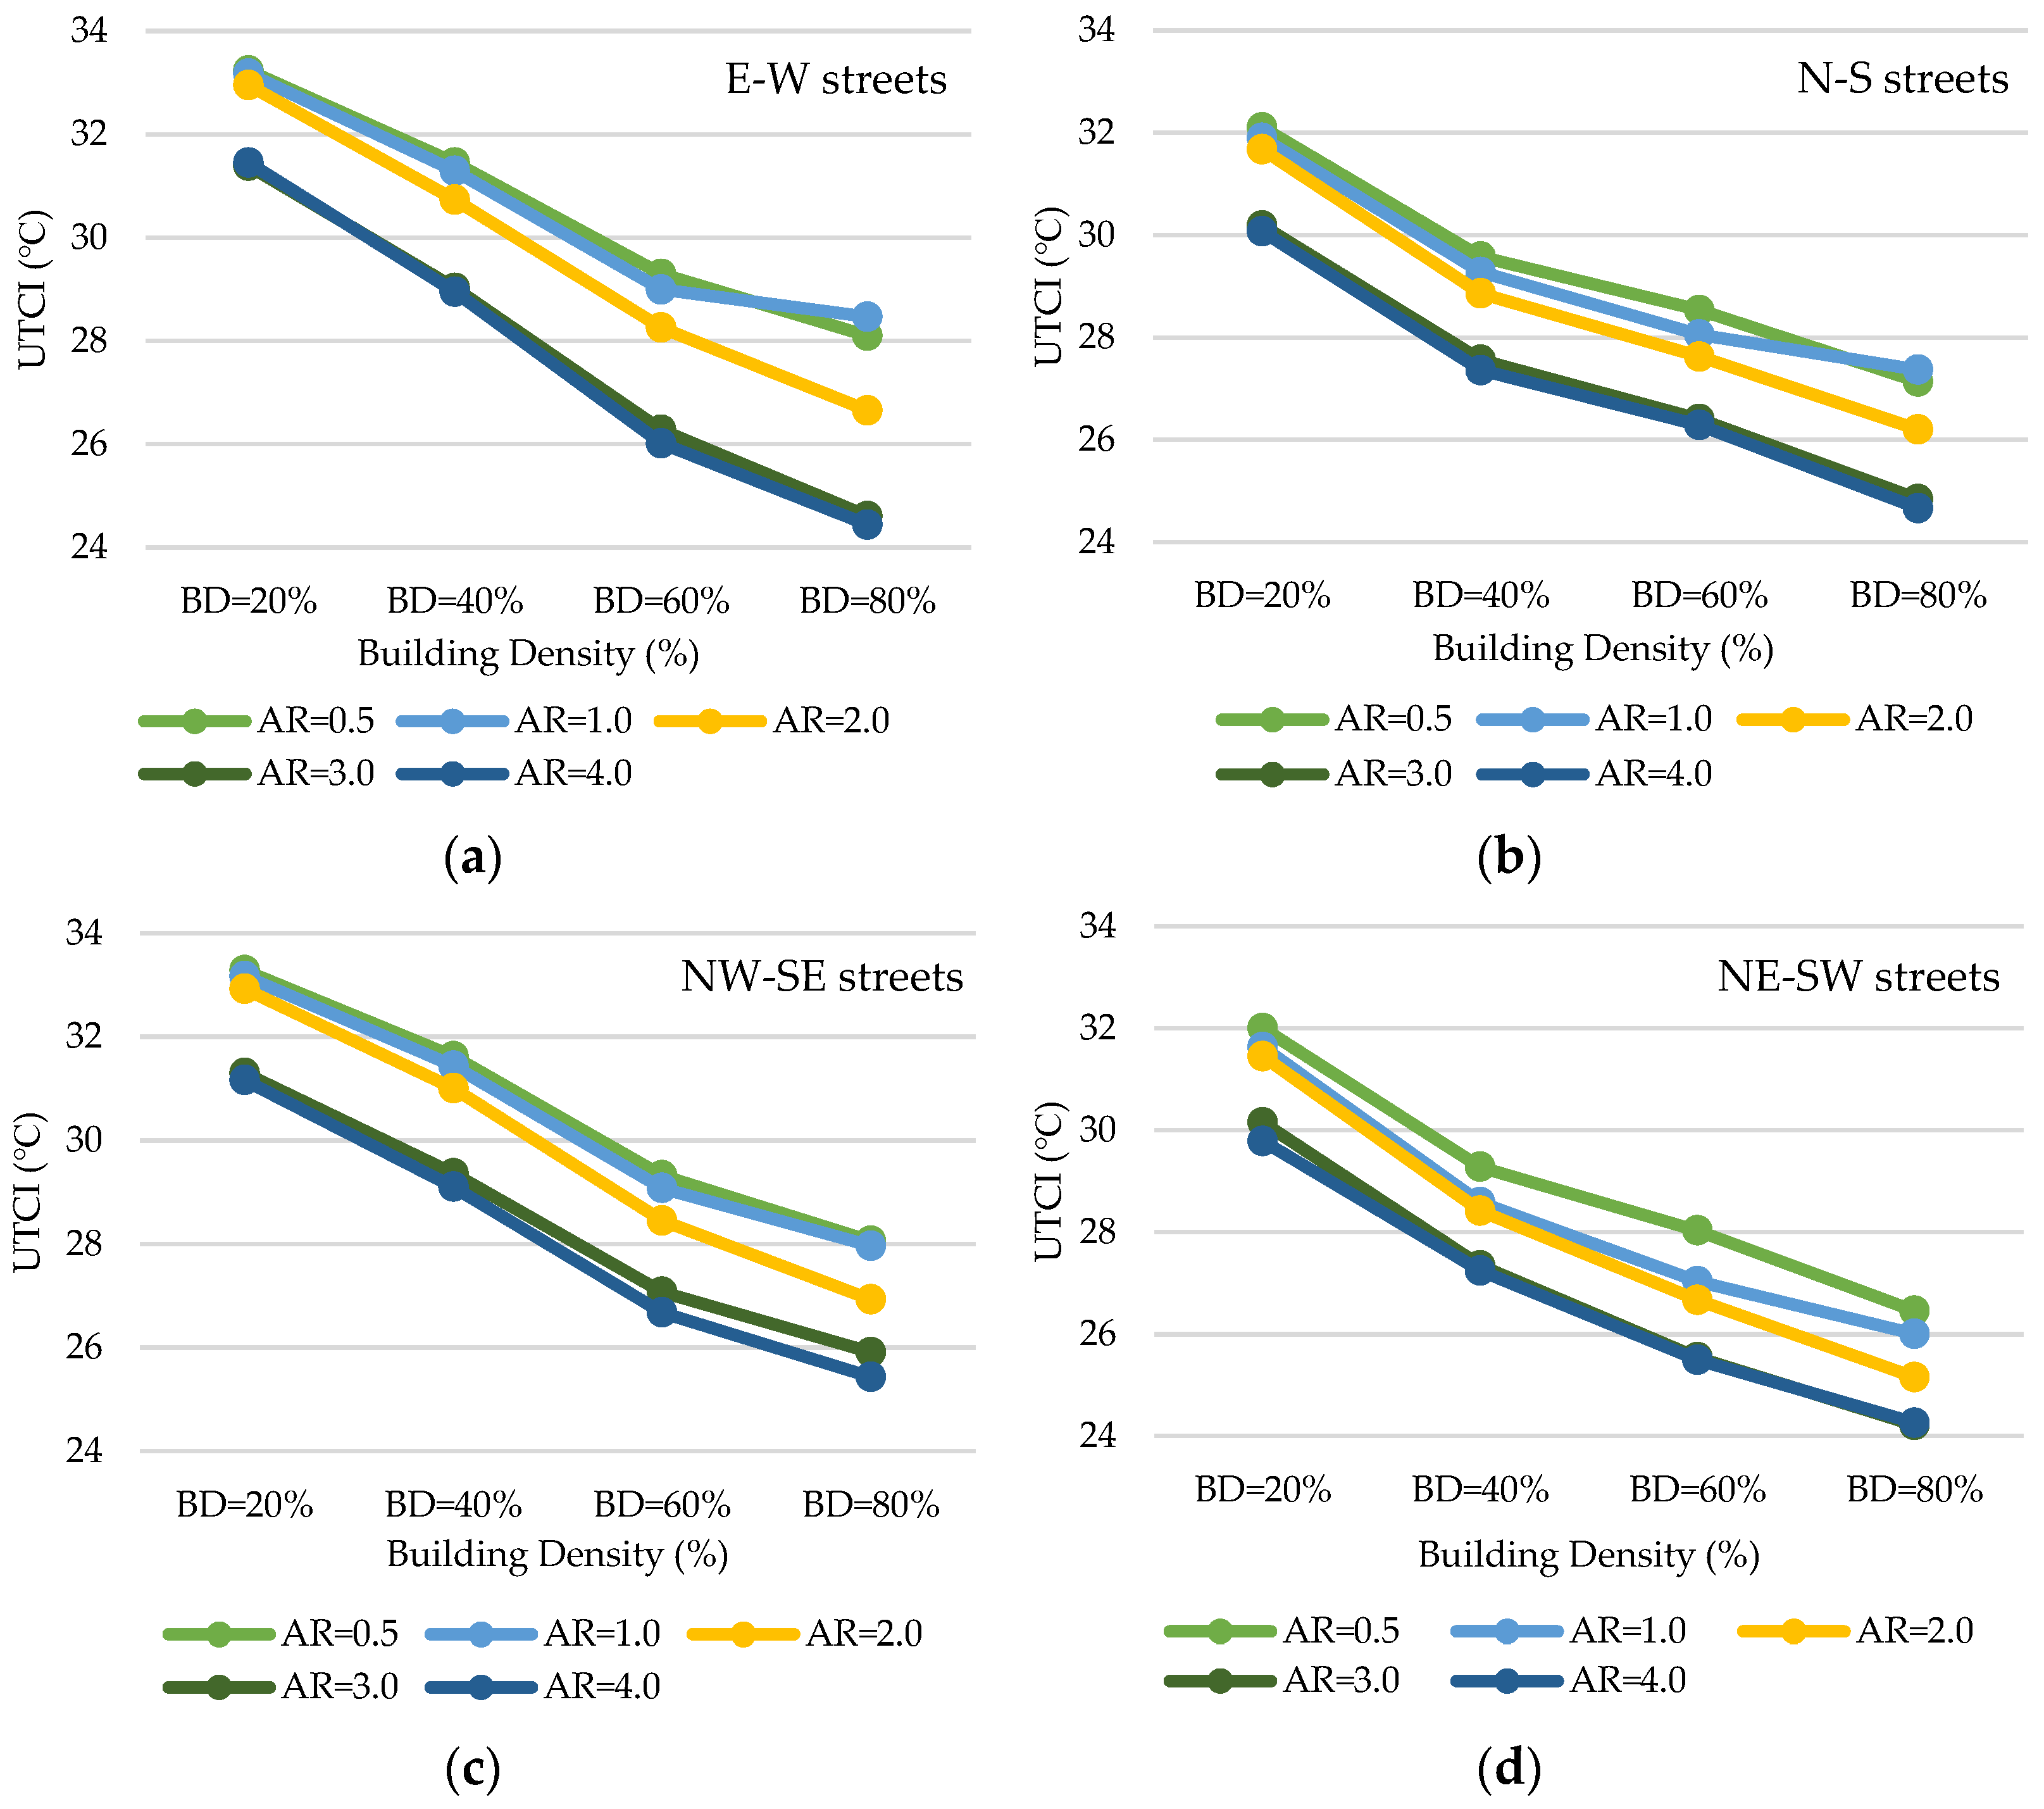
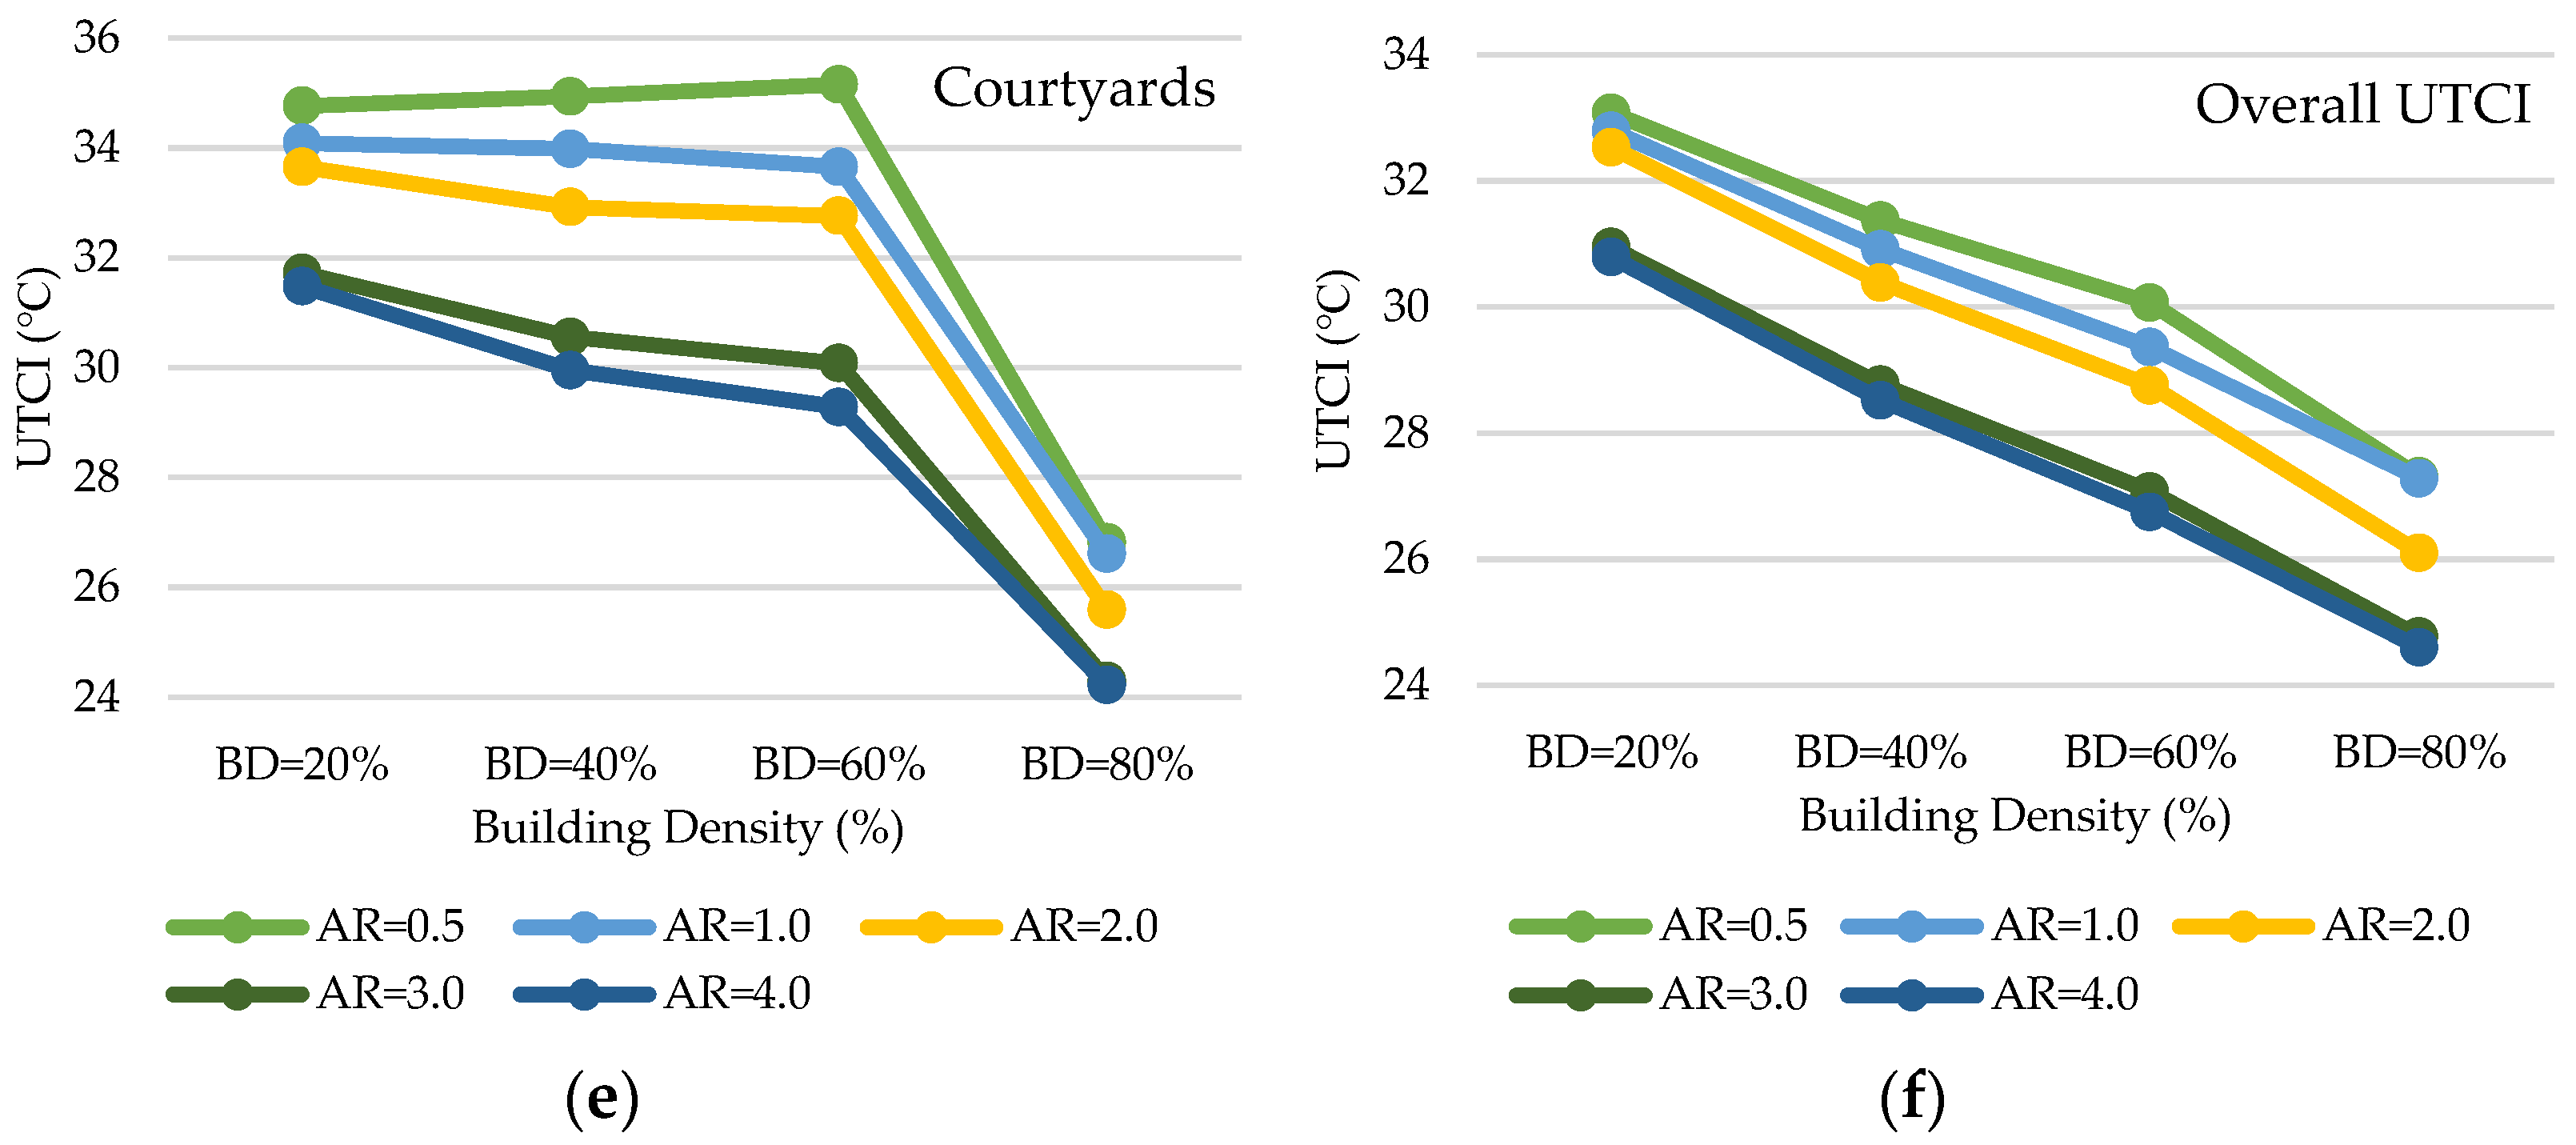
3.1. UTCI Variation Based on the Building Density

The UTCI output values were rearranged to show the variation of the UTCI based on the building density and the following graphs were generated (Figure 5).
In general, a relatively steady increase in discomfort was observed when the building density decreased. This was observable in the UTCI-variation graphs for streets as well as in the overall UTCI-variation graph, which simply means that the higher the building density was, the better the outdoor thermal conditions were. The linear regression on the average UTCI per building density yielded a highly significant average correlation (R2 = 0.9944). One should note that this correlation trend was not significantly influenced by the adjacent factors (aspect ratio and orientation). Explicitly, the impact pattern and the correlation between the UTCI and the building density stayed considerably the same even when the aspect ratio and the orientation changed. Respectively, for E–W, N–S, NW–SE, and NE–SW orientations, building density was still highly correlated with R2 values of 0.9860, 0.9594, 0.9875, and 0.9678, respectively. Likewise, when the aspect ratio changed from 0.5 to 1.0, 2.0, 3.0, and 4.0, the building density stayed highly correlated, with R2 values varying from 0.9748 to 0.9971, 0.9919, 0.9969, and 0.9980, respectively.
Moreover, it can also be noticed that when the building density was very high (80%), the UTCI values in public courtyards were much lower than when the building densities were 60%, 40%, and 20%. This observation was arguably due to the fact that wind flow (which significantly influences thermal comfort) tended to be greater in public courtyards. Therefore, when the courtyards’ sizes were considerably reduced as building density became higher, the hot tropical winds penetrated less, air humidity was conserved, and the resulting UTCI was much lower. It was also observed that there was no obvious threshold value for the UTCI as building density varied, except for the UTCI in public courtyards. In public courtyards, the UTCI values appeared to change just slightly (when AR = 3.0 and AR = 4.0) or stagnate (when AR = 3.0 and AR = 4.0) for building densities below 60%. Within that range of building density, the average rate of change Δ U T C I / Δ B D for public courtyards was barely −0.24 °C per 10% increase in density, which was roughly five times less than that for street canyons (−1 °C per 10% increase in density).

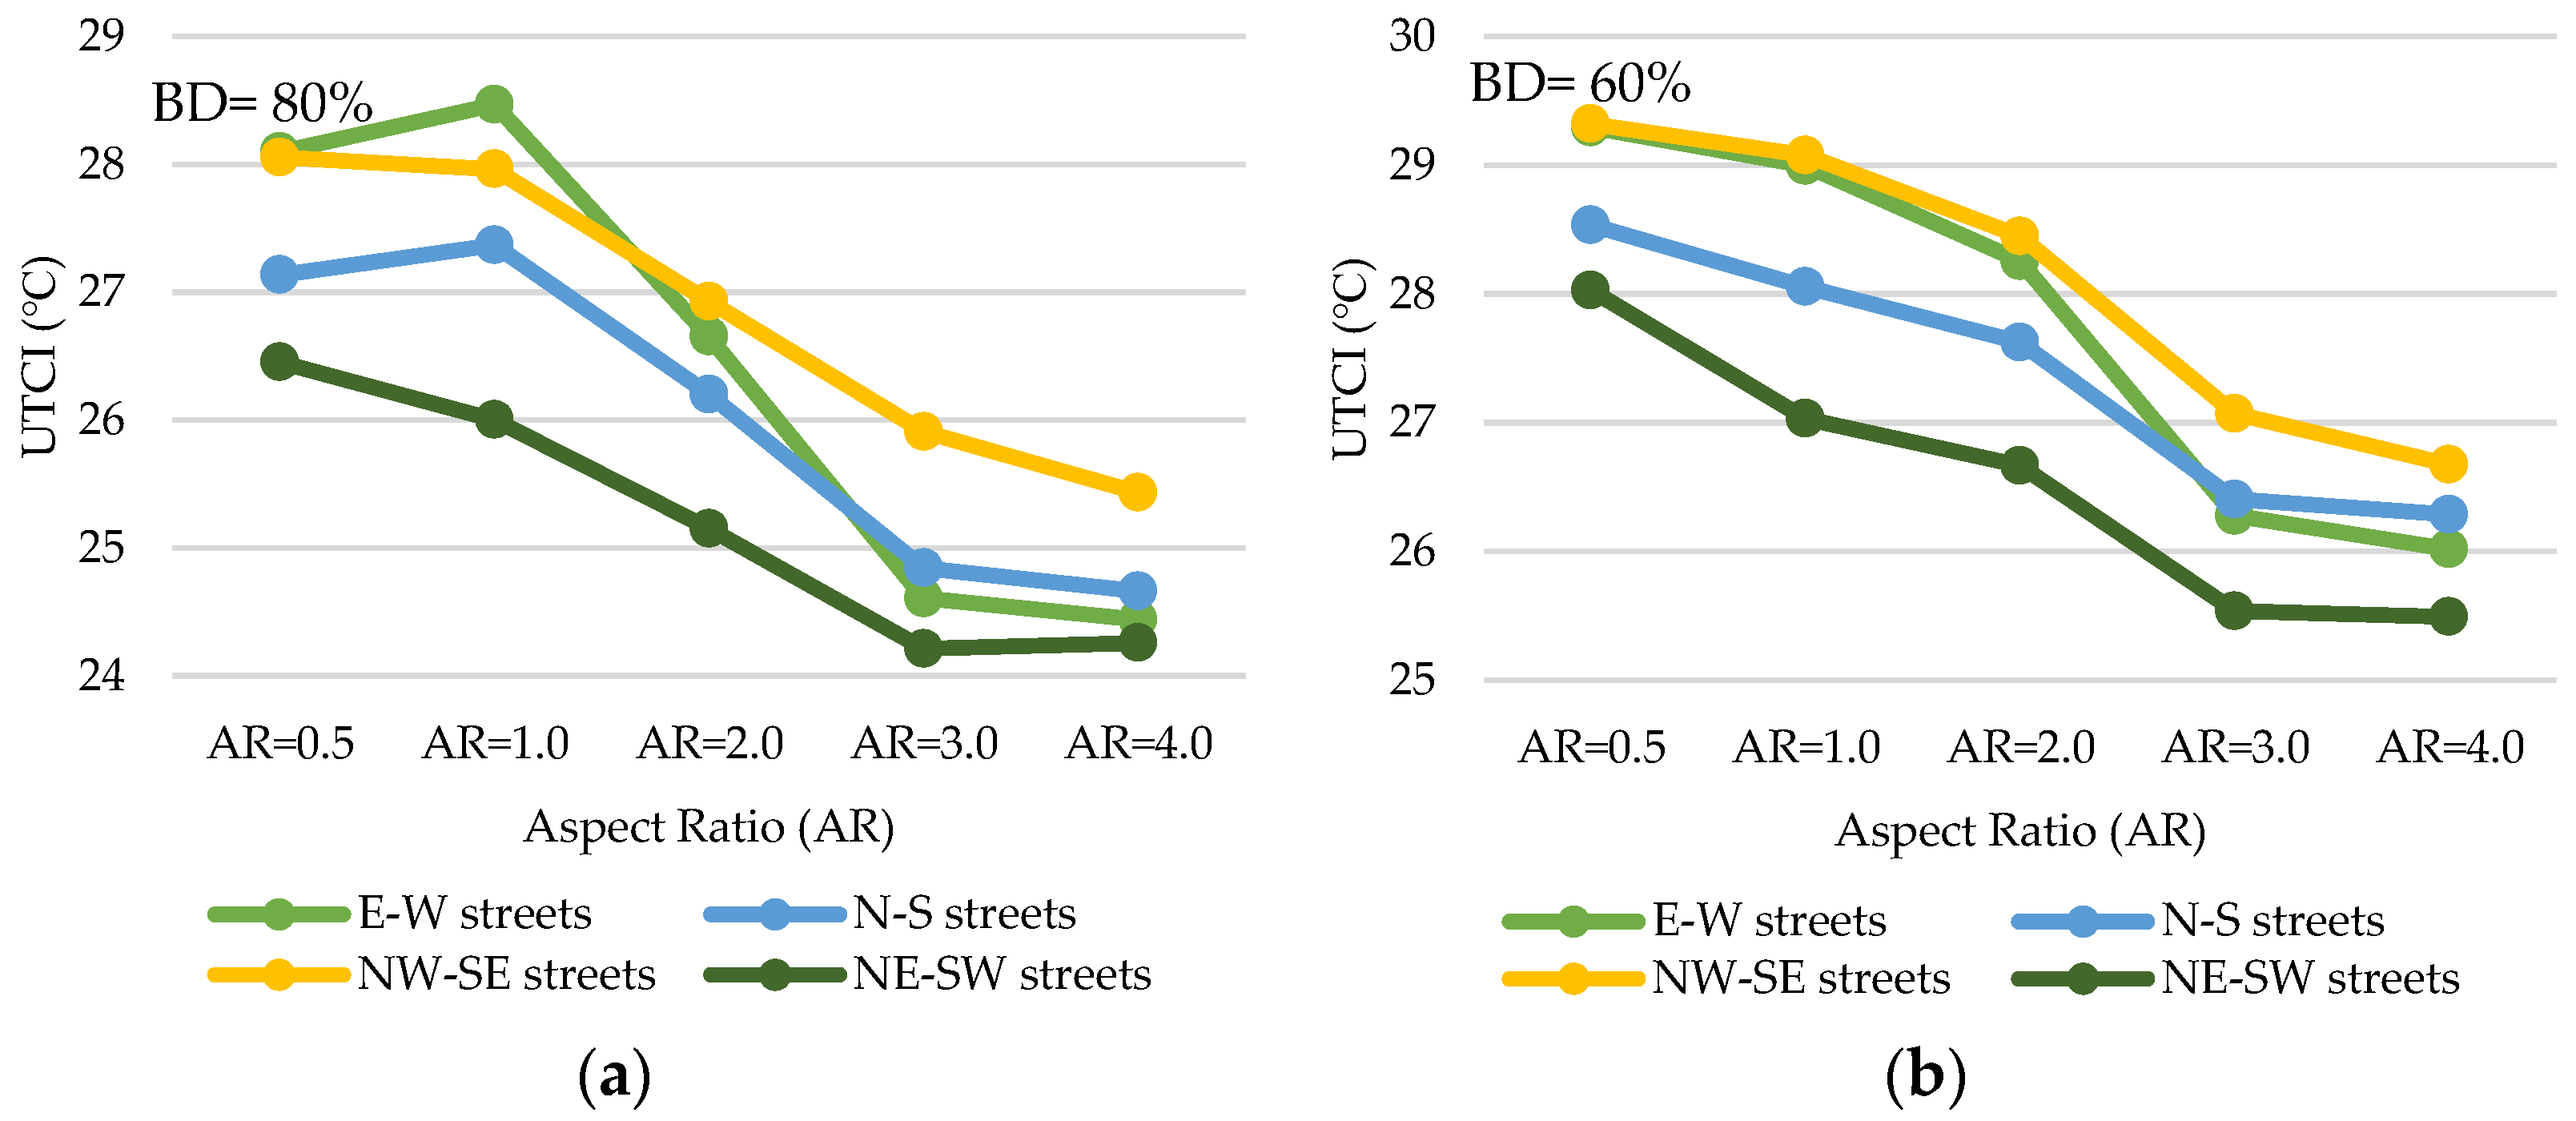
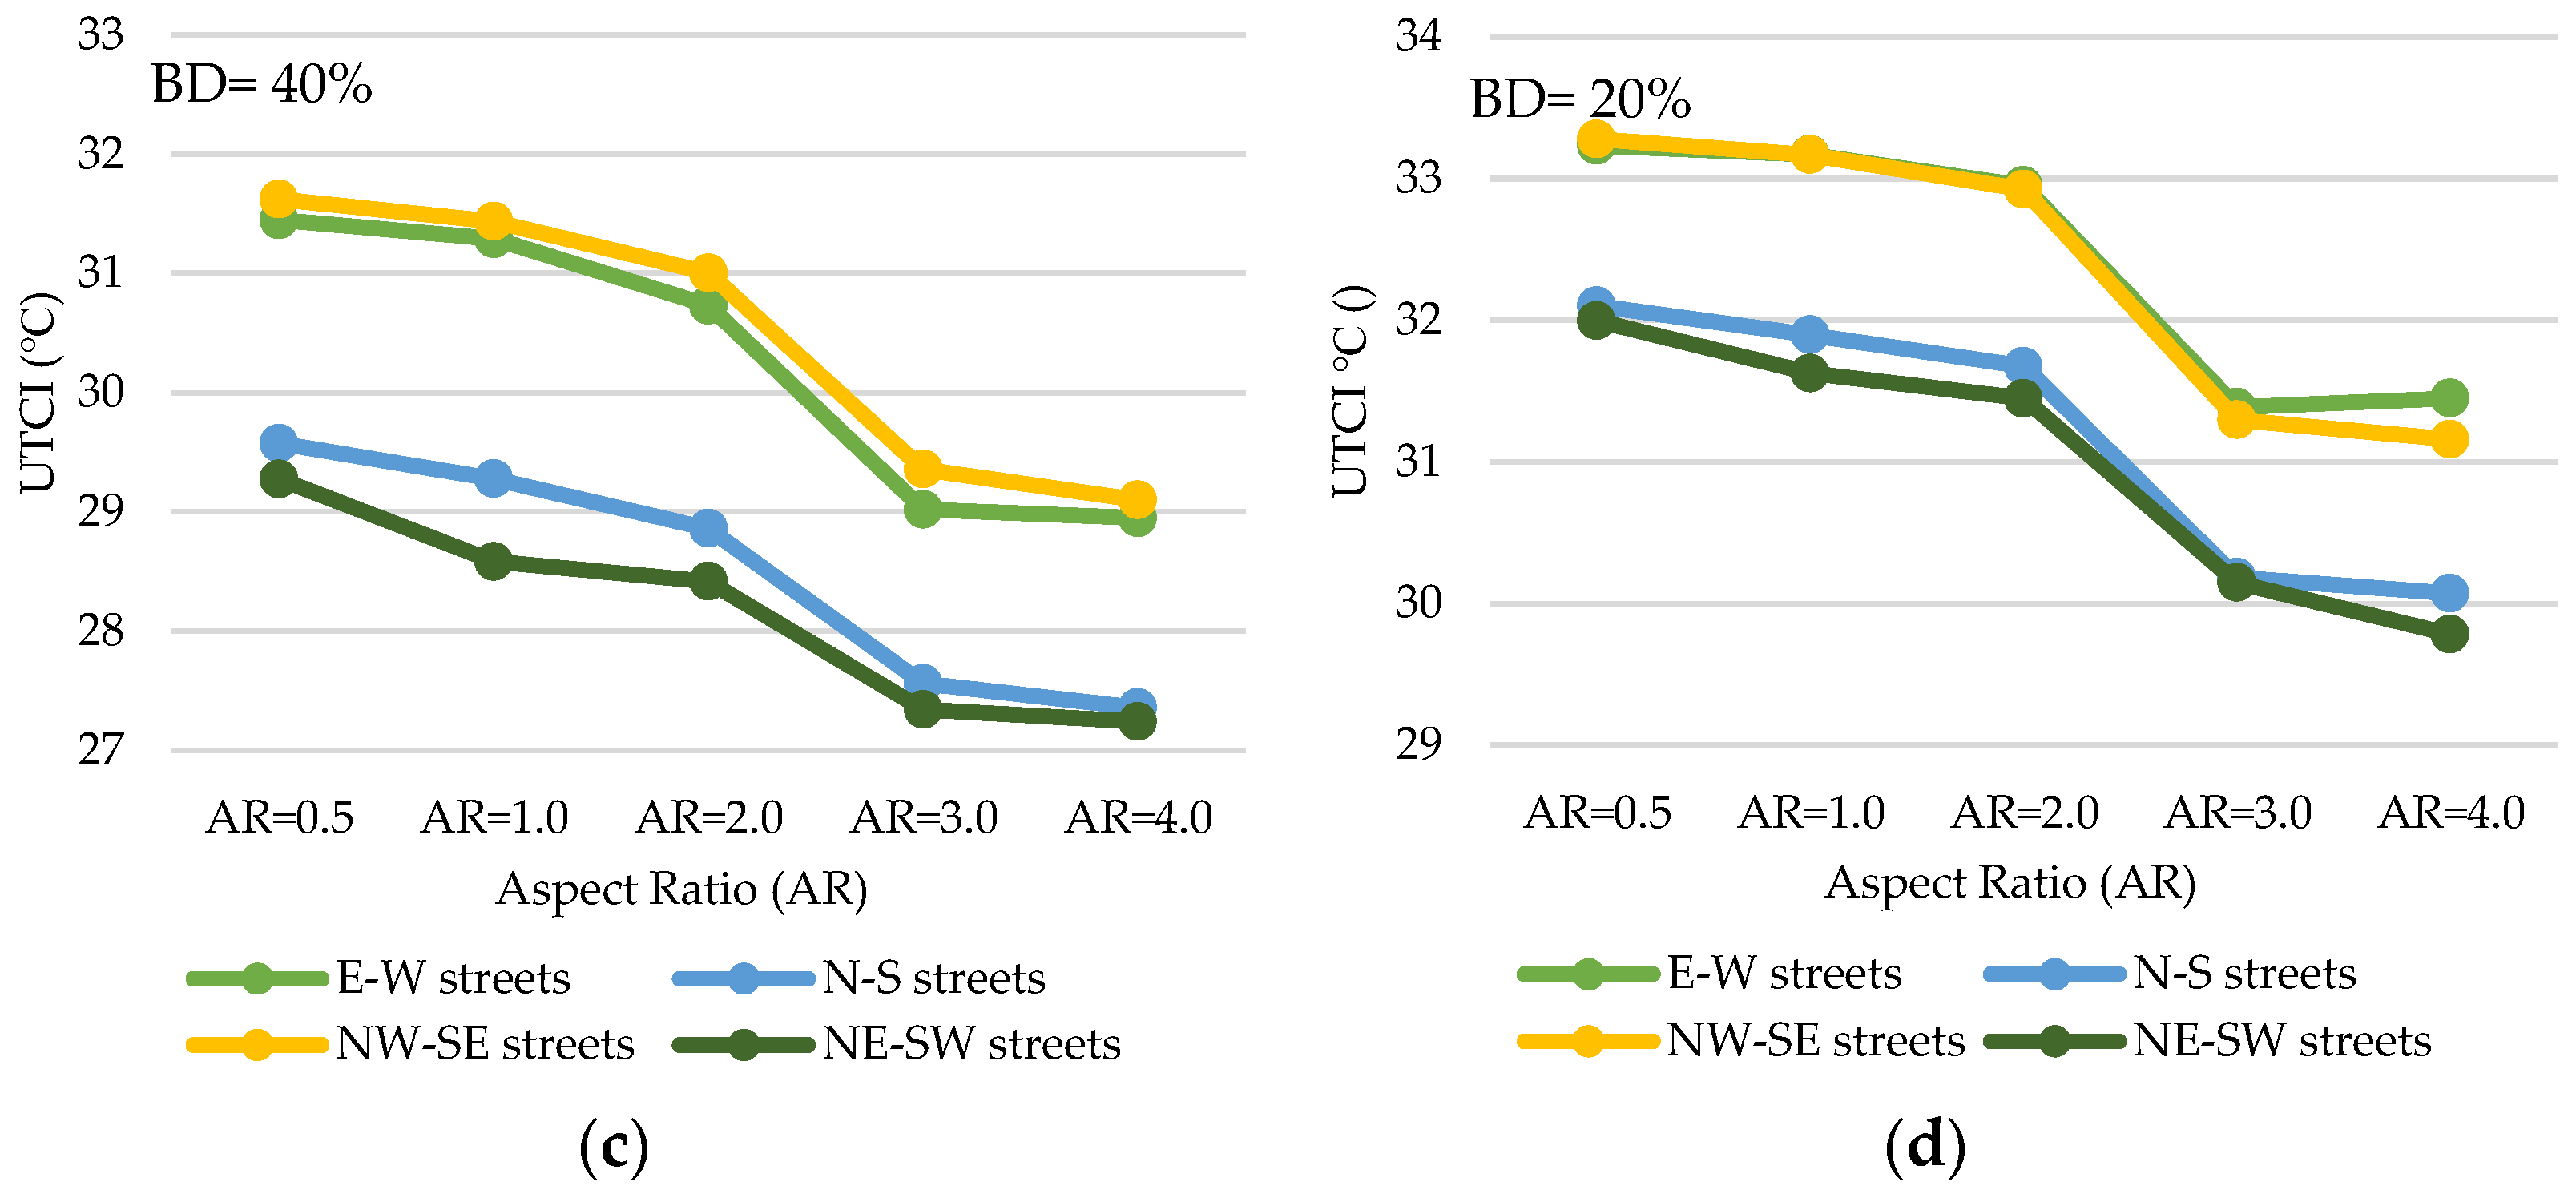
3.2. UTCI Variation According to Street Aspect Ratio (AR)

The graphs presented below (Figure 6) were generated by organizing the simulation outputs to show the variation in the UTCI according to street-aspect-ratio values on different street orientations; then, the analysis was repeated for different building densities to confirm the variation pattern of thermal comfort. The observation of the four graphs showed a general decrease in the UTCI when the aspect ratio increased from 0.5 to 4.0. The decrease in the UTCI means that heat stress was reduced. Unlike building density, aspect ratio did not have a simple linear correlation with thermal comfort. Consequently, the linear regression between aspect ratio values and the UTCI yielded an average R2 value of 0.91, which, despite representing quite a significant correlation, was smaller than that of building density. Specifically, the R2 values between aspect ratio and the UTCI were 0.9167, 0.9489, 0.9193, and 0.8684 when the building density was 80%, 60%, 40%, and 20%, respectively.
One can also notice that the UTCI decrease was steady in general until AR = 3.0. For AR beyond 3.0, the UTCI tended to stagnate; the increase in aspect ratio had no significant effect on the UTCI, which also means that an aspect ratio greater than 3.0 had no significant heat-mitigation effects. Since an aspect ratio of 3.0 appeared to be a threshold point, the rate of change in the UTCI per aspect-ratio variation was calculated for aspect-ratio values below and above 3.0. For values between 0.5 and 3.0, the rate of change of the ∆UTCI was −1.02 °C per unit of aspect-ratio increase; that is significantly bigger than when the aspect ratio exceeded 3.0, in which case, the ∆UTCI was only −0.19 °C per unit of aspect-ratio increase.

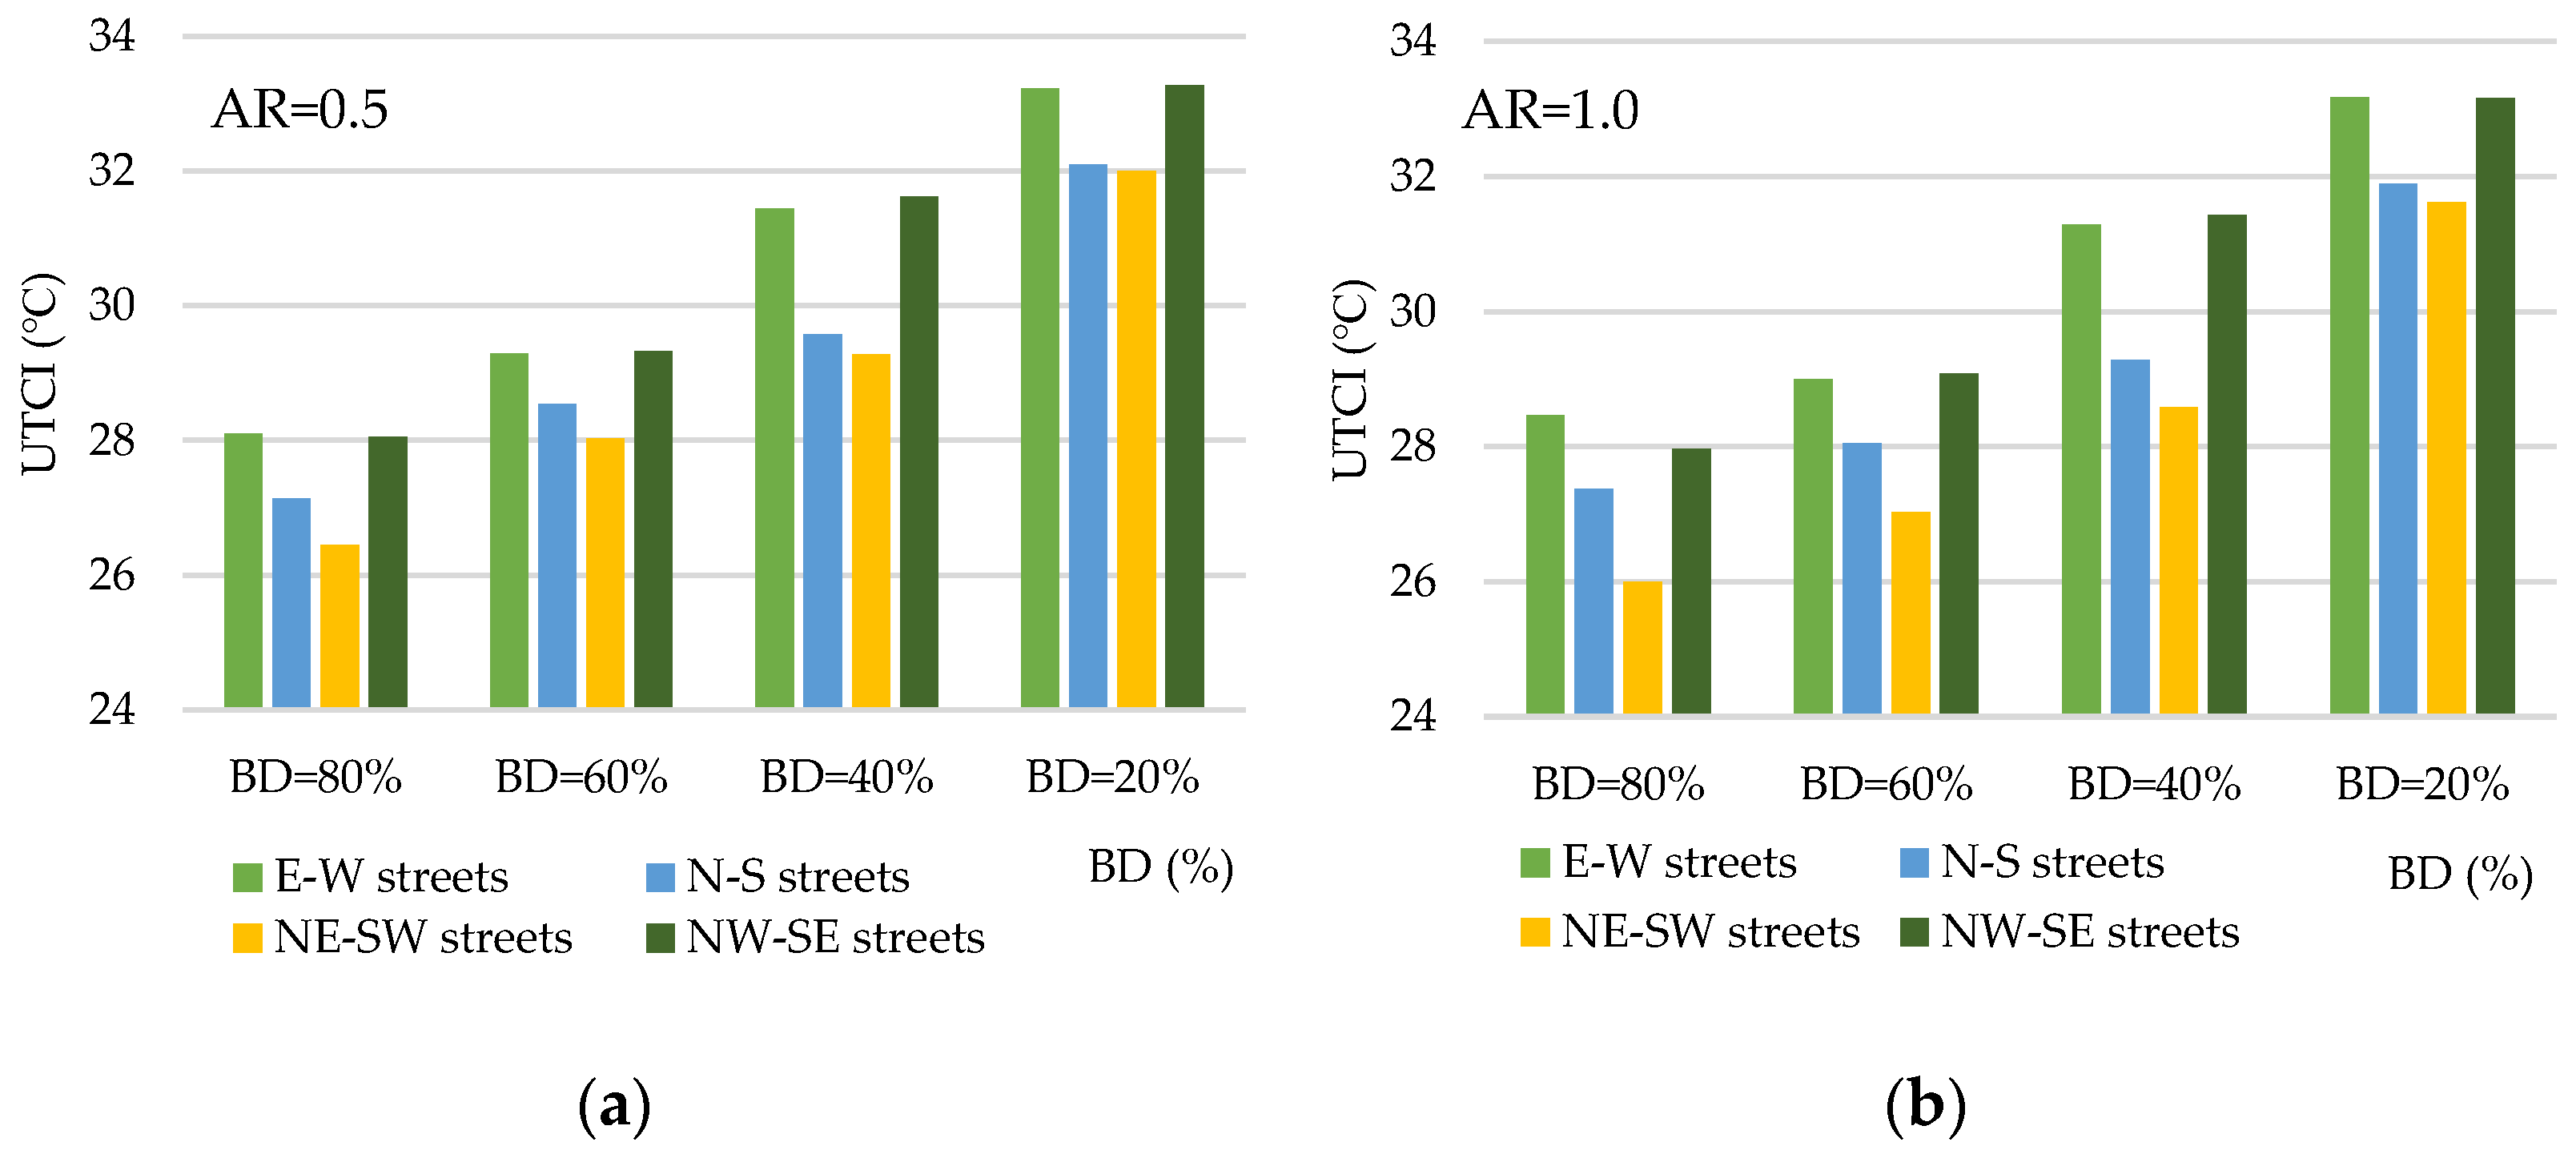
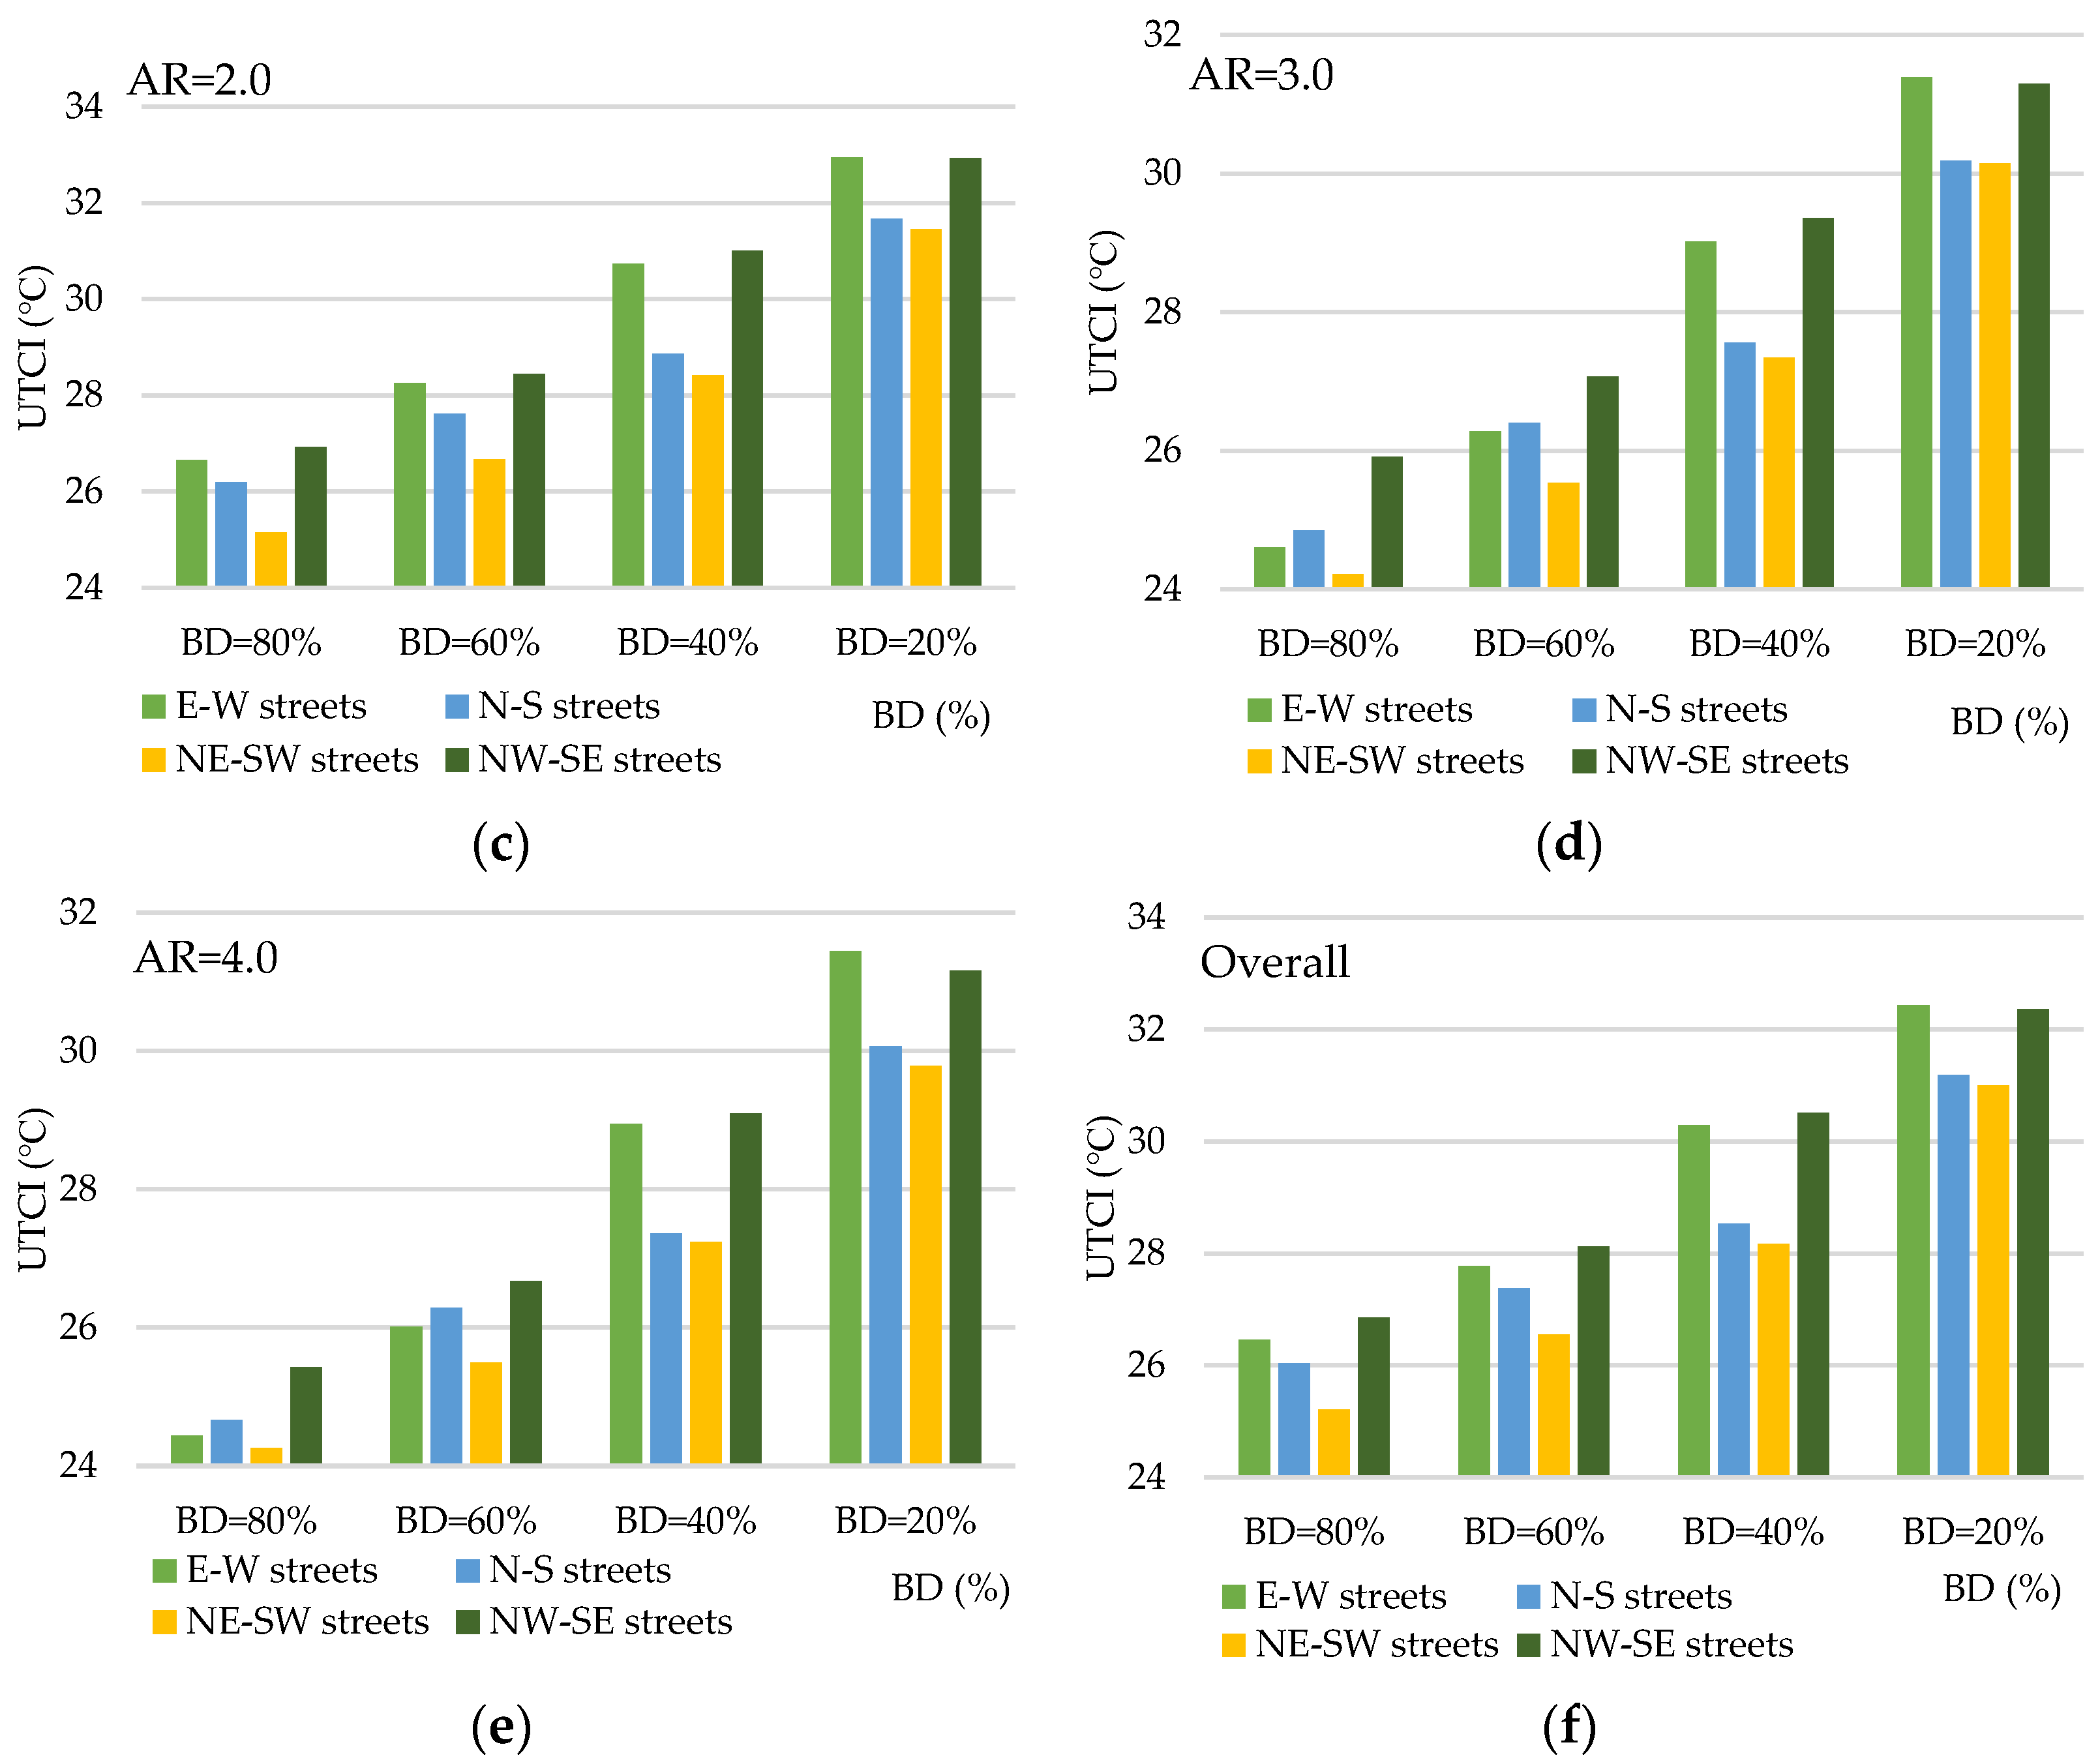
3.3. UTCI Variation According to Street Orientation

The UTCI output data for different aspect ratios were grouped by building density and street orientation to see the variation of thermal comfort in relation to the latter. The resulting graphs (Figure 7) show a net difference in the influence on thermal comfort by different street orientations when the building density was high (80% and 60%), but when the density was relatively low (40% and 20%), the thermal comfort on N–S- and NE–SW-oriented streets, on the one hand, tended to be close to each other, and the thermal comfort on E–W- and SE–NW-oriented streets, on the other hand, tended to be close of each other, as well. However, as a general observation, NE–SW streets had lower UTCI values (better thermal comfort) than N–S streets, which in their turn were better than E–W those of streets; SE–NW streets had the worst thermal-comfort performance.
Based on these patterns, it can be deduced that the relation of street orientation to outdoor thermal comfort is not a linear one. Neither does it depend on the orientation itself. The pattern seems to be conditioned by the dominant wind direction. Considering that the southwest direction (265°) was set as the dominant wind direction for the simulation, one should notice that SE–NW streets were perpendicular to the dominant wind direction, which may explain why they were less thermally comfortable. On the other hand, NE–SW streets performed better because they were aligned with the southwest winds. From this, it can be theorized that the impact of a street orientation on UTCI reduction is proportional to its angle with the wind direction, as it is to the degree of exposure to sun radiation.

4. Discussion

4.1. Impact of Individual Morphology Indicators on Outdoor Thermal Comfort

From the results presented above, it was found that building density and street aspect ratio were negatively correlated with the UTCI (R2 = 0.99 and R2 = 0.91, respectively), meaning the higher the building density, the lower the UTCI value. Likewise, as the aspect ratio increased, the UTCI decreased. These results are aligned with the findings of Ali-Toudert et al. [29], Ren et al. [25], and Xue et al. [26], who, despite studying different climatic backgrounds, found that increasing building density and aspect ratio had heat-mitigation effects. Additionally, the parametric investigation presented in this paper demonstrated that in hot-and-humid tropical-climate conditions, each of these correlation trends (for BD and AR) remained consistent despite the variation of the adjacent morphology factors; explicitly, the variation pattern of the thermal-comfort index (UTCI) according to building density stayed the same even when the aspect ratio changed, and vice-versa. It is worth remembering that few studies have pointed out that an increase in building density and aspect ratio may be detrimental to ventilation [61,62,63], but it is recommended to base the relevant design guidelines on human physiological thermal sensation rather than single meteorological parameters, as some studies have done in the past. The UTCI patterns here show that in hot-and-humid tropical climates, an increase in building density and aspect ratio is beneficial overall to outdoor thermal comfort, even if it may slightly reduce ventilation [61,62,63].
The current results can be explained by the fact that in hot-and-humid tropical climates, buildings are a major protection against constant sun exposure at the pedestrian level. Indeed, building density is an expression of spatial compactness that is highly correlated to pedestrian sun exposure [64,65]. The empirical observation in this study is that building density tends to reduce the sky view, which indicates the level of exposure to solar radiation [66]. Similarly, the increase in building height, which also leads to an increase in the aspect ratio, leads to a reduction of the sky-view factor, augments the proportion of shadowed areas on the ground, and therefore reduces the heat stress in summer. Similar observations have been made in some studies, which also concluded that deep street canyons (with a high aspect ratio) are beneficial to pedestrian thermal comfort [67].
The UTCI pattern based on building density was relatively steady (−1 °C per 10% increase in density) and did not show any specific threshold value. This indicates that for urban-design purposes, given the negative correlation with the UTCI (which can also be interpreted as a positive correlation with the level of thermal comfort), the best building-density value would be the highest density allowed by the project’s goals and relevant regulations. The aspect ratio, on the other hand, has shown a threshold of 3.0, beyond which the heat-mitigation rate is barely −0.19°C per unit of aspect-ratio increase. Therefore, in hot-and-humid tropical-savanna climates, the AR = 3.0 can serve as an urban-design target, as previously recommended in tropical-rainforest climates [68].
As for the street orientation, it was noted that NE–SW and N–S streets performed better (lower UTCI) than NW–SE and E–W streets. Broadly, in many previous research findings, it was found that E–W streets tended to have longer exposure to direct sun radiation than N–S streets [65,67]. Additionally, the results of this experiment confirm that wind direction may also have a great implication for the performance of street orientation. In fact, considering that the dominant wind direction set for the experimental simulations was southwest, one may understand why NE–SW streets performed the best compared to all other street orientations. One may also notice that NW–SE streets, in every scenario, despite the variation of other indicators and their influences, were the worst performers, arguably because they were opposed to the dominant wind in this case. Based on this, the authors highlight that the conclusions on the relation of street orientation to pedestrian thermal comfort are, very probably, not as generalizable as the observations on building density and aspect ratio, even in the same climatic zone. An attempt at generalization could be that the impact of a street orientation on UTCI reduction is proportional to its angle with the wind direction, as it is to the degree of exposure to sun radiation.

4.2. Interconnections between Morphology Indicators

From the results presented above, one may notice, based on the behavior of thermal comfort according to the three morphology indicators, that building density, street aspect ratio, and orientation appear to have had some inter-influences on one another regarding the intensity of their heat-mitigation effects.
Between building density and aspect ratio, one of these observations is that when the building density was low, the aspect ratio tended to matter less. For example, on E–W streets, when BD = 20%, the absolute gap ( U T C I ) between low and high aspect ratio was U T C I = 1.78   ° C , which is a 51% lower heat-mitigation effect than when building density was high ( U T C I = 3.65   ° C ).
Between aspect ratio and street orientation, the UTCI variation pattern according to street orientation changed very little in different aspect-ratio cases, and conversely, the UTCI variation pattern based on aspect ratio stayed roughly the same for all street orientations. There was no obvious or consistent interconnection between aspect ratio and street orientation, and they may not be influenced by building density in how they co-influence thermal comfort.
Comprehensively among the three morphology indicators there were more observable interconnections. For example, in the case of a very high building density (80%, for example) and a high aspect ratio (AR = 4.0), there were fewer differences in street orientations ( U T C I = 0.18 ) than there were in the case of, say, high building density and low aspect ratio ( U T C I = 1.64 ). However, this can be understood as a big impact from building density, because building density can influence the other two indicators in how they influence the overall thermal comfort. Another emple is that, in the case of low building density (20%), the UTCI values were all high (roughly between 30 °C and 34 °C), but the values of N–S and NE–SW streets tended to converge (30–32 °C) and those of NW–SE and E–W tended to converge as well, and when the aspect ratio was very low, they converged even closer (around UTCI = 33 °C). Let us note that that is not typically the case, based on the data overview. This confirms that when thermal conditions are at their worst, ventilation makes the biggest difference.
This last observation ultimately highlights the importance of the interconnections between different morphology indicators, because it appears that NW–SE orientations, which can perform much better than E–W streets in a high-building-density case, can also perform equally well when thermal conditions are at their worst with low building density. This does not, nevertheless, mean that when thermal conditions worsen, NW–SE and E–W streets will always perform equally well; that depends on the dominant wind direction. Of course, one should, once again, keep in mind the context and the preconditions in which these conclusions are applicable with certainty: first, the type of climate (hot-and-humid tropical savanna); second, the period (summer); and third, the dominant wind (southwest wind), not to mention that no complementary passive heat-mitigation strategies such as vegetation, water, etc., were considered in this analysis—just pure urban morphology. Perhaps the right attempt at generalization/theorization could be formulated as follows: The impact of street orientation on UTCI reduction is proportional to its angle with the wind direction, as it is to the degree of exposure to sun radiation. An example is that streets canyons that are aligned with the dominant wind tended to perform better than those that were opposed to it, and more so when the solar radiation on the ground was the worst (e.g., because of low building density), in which case even the aspect ratio was quite irrelevant.

5. Conclusions

Over the past few years, many studies have investigated many spatial factors, including urban morphology/geometry and how they influence urban outdoor thermal comfort, attempting to provide practical guidelines for urban designers [34]. Nevertheless, considering the great variety in the contexts of existing studies, research findings are quite disparate, arguably because of the differences in their climatic settings. Moreover, different studies have based their observations on different heat-stress indicators (air temperature, mean radian temperature, wind speed, or thermal comfort indices such as the UTCI, PET, etc.). Furthermore, different experimental settings, most of which investigate spatial indicators either separately or in a few combinations, may lead to different results and conclusions [15,34].
In this study, a parametric-simulation method was applied to observe, under a hot-and-humid tropical-savanna summer condition, the responses of outdoor thermal comfort to possible morphology configurations provided by the systematic combination of building density (20%, 40%, 60%, 80%), aspect ratio (0.5, 1.0, 2.0, 4.0), and four street orientations (N–S, E–W, NE–SW, NW–SE). The purpose of the systematic parametric combination of these values was to limit unobserved scenarios so as to confirm or provide new insights into the relevant guidelines in tropical climates, particularly for hot-and-humid tropical-savanna zones (Cf).
The results show that building density and aspect ratio had a negative correlation with the Universal Thermal Climate Index (UTCI), with R2 coefficients of 0.99 and 0.91, respectively, which means that the increase in building density and street aspect ratio improved the UTCI by 1 °C per building-density-value increase and 1.02 °C per aspect-ratio-value increase (for AR ≤ 3.0). Meanwhile, the performance of street orientation was observed to be strongly in favor of alignment with the wind direction (southwest in this case). It was also found that building density, street aspect ratio, and orientation had inter-influences on each other’s performance. For instance, aspect ratio mattered less under a low-building-density condition, as the heat-mitigation effect ( U T C I ) was bigger when the building density was higher. Few co-influences were found between street orientation and aspect ratio. Nevertheless, the combination of building density and aspect ratio had a more significant influence on the performance of street orientations, which was also significantly influenced by the dominant wind direction.
These findings provide a clear insight into the comprehensive and systematic performance of different configurations of street morphology based on the observation of pedestrian thermal comfort. They can serve as guidelines for the design process, indicating quite intuitively when and where passive heat-mitigation strategies such as street vegetation and cooling materials are needed.
Finally, it is important to remember that the correlation patterns specifically observed in the hot-and-humid tropical-savanna summer might be different in other climate conditions [29,67]. That is why there is still room for future research on applying the parametric-simulation method to other climatic zones and experimental settings to further enrich the existing knowledge about the responses of outdoor thermal comfort to urban spatial configurations and the derived urban-design guidelines.

Author Contributions

Conceptualization, K.B.B. and B.Z.; methodology, K.B.B.; software, K.B.B.; validation, K.B.B., B.Z., J.L. and X.L.; formal analysis, K.B.B. and J.L.; investigation, K.B.B. and J.L.; resources, K.B.B.; data curation, K.B.B.; writing—original draft preparation, K.B.B.; writing—review and editing, K.B.B.; visualization, J.L. and X.L.; supervision, B.Z. and X.L.; project administration, B.Z. and X.L. All authors have read and agreed to the published version of the manuscript.

Funding

This research was funded by the Hunan Provincial Natural Science Foundation, grant numbers 2023JJ30693 and 2023JJ40728; the Hunan Provincial Philosophy and Social Science Planning Fund, grant number XSP20ZDI020; the Central South University New Teachers Research Funding, grant number: 502044009; the 2022 Hunan Province Postgraduate Research and Innovation Project, grant number CX20220123; and the 2020 Central South University Postgraduate Teaching Case Library Construction Project—Postgraduate Teaching Case Library of Land and Space Master Plan, grant number 2020ALK49.

Informed Consent Statement

Not applicable.

Data Availability Statement

The data presented in this study are available on request from the corresponding author.

Conflicts of Interest

The authors declare no conflict of interest.

Appendix A

Solar-radiation assumptions in the study were calculated in ENVI-met. ENVI-met estimated the hourly position of the sun (height and azimuth) and the hourly change of direct and diffuse short-wave radiation based on the georeferences of the simulation location (7°17′ N, 5°18′ E in this case). The radiation estimations are shown in Figure A1 below.
Figure A1. The solar radiation parameterization in ENVI-met based on the georeferences of Akure (7°17′ N, 5°18′ E).
Sustainability 15 08902 g0a1

Appendix B

The UTCI data processing started with retrieving output files from ENVI-met of the data recorded by the 117 receptors (numbered from 00 to 116). For each scenario and each hour, data tables similar to Table A1 and Table A2 were created. Table A1 is an example of receptor data calculated from a model in which BD = 80% and AR = 0.5. The model was oriented north, which means that the perpendicular street network contained both N–S streets and E–W streets. Table A2 contains the data for receptors located in public courtyards. Next, based on the average values of the receptors on street 1 and street 2 (R00–R35), the average UTCI on E–W streets was obtained. On the other hand, the receptors on street 3 and street 4 (R36–R71) yielded the average UTCI on N–S streets, and likewise, the receptors R72 to R116 provided the average UTCI for public courtyards.
In summary, based on these two tables, for BD = 80% and AR = 0.5, the averages were obtained for two street orientations (N–S and E–W) and public courtyards at a given hour (e.g., 13:00). Then, these tables were generated for each hour (from 6:00 to 17:00) to calculate the daytime average of the UTCI for the two scenarios: 80%/N–S/0.5 and 80%/E–W/0.5.
Then, the calculation was repeated for all the scenarios to obtain the data tables presented in the main text (Table 4, Table 5, Table 6, Table 7 and Table 8).
Table A1. Example of street-receptor classification with UTCI output data for 80%/N–S/0.5 and 80%/E–W/0.5 at 13:00.
E–W StreetsN–S Streets
Recept.Coord.
(x, y)
UTCITotal
Average
Recept.Coord.
(x, y)
UTCI
Street 1R0015, 5821.5263 Street 3R3633, 7632.6661
R0115, 5533.5523 R3736, 7621.5126
R0223, 5821.4803 R3833, 6732.4237
R0323, 5532.6962 R3936, 6721.5537
R0431, 5822.1595 R4033, 6032.7209
R0531, 5532.9184 R4136, 6021.4666
R0638, 5821.5095 R4233, 5332.4257
R0738, 5532.7610 R4336, 5321.5081
R0846, 5821.5856 R4433, 4432.4912
R0946, 5532.1867 R4536, 4421.5534
R1054, 5821.5163 R4633, 3732.7998
R1154, 5532.5814 R4736, 3721.6528
R1261, 5821.5856 R4833, 3032.8975
R1361, 5532.5725 R4936, 3021.5386
R1469, 5821.6669 R5033, 2232.9287
R1569, 5532.0904 R5136, 2221.4714
R1677, 5821.5499 R5233, 1433.3795
R1777, 5532.4326 R5336, 1421.5095
Street 2R1815, 3521.5095 Street 4R5456, 7632.4669
R1915, 3233.5575 R5559, 7621.5835
R2023, 3521.4666 R5656, 6832.2351
R2123, 3232.6743 R5759, 6821.6381
R2231, 3521.5397 R5856, 6032.5077
R2331, 3232.8937 R5959, 6021.5047
R2438, 3521.5105 R6056, 5332.6544
R2538, 3232.9246 R6159, 5321.5050
R2646, 3521.4783 R6256, 4532.4185
R2746, 3232.3115 R6359, 4521.5698
R2854, 3521.7409 R6456, 3732.7075
R2954, 3232.6650 R6559, 3721.6453
R3061, 3521.7557 R6656, 3033.0329
R3161, 3232.8913 R6759, 3021.5835
R3269, 3521.5523 R6856, 2232.9822
R3369, 3232.2594 R6959, 2221.6453
R3477, 3521.4714 R7056, 1433.4166
R3577, 3232.504627.1411R7159, 1421.507827.1418
Table A2. Example of public open-space receptor classification with UTCI output data at 13:00.
Public Courtyards
Recept.Coord.
(x, y)
PMVRecept.Coord.
(x, y)
PMVTotal
Average
R7220, 7121.4776R9543, 4232.6935
R7326, 7121.5537R9646, 4532.7603
R7426, 6521.5698R9766, 4821.4965
R7520, 6533.1382R9872, 4821.5088
R7623, 6833.1327R9972, 4221.5115
R7743, 7121.7594R10066, 4232.6325
R7849, 7121.7557R10169, 4532.7103
R7949, 6521.4409R10220, 2521.5527
R8043, 6532.6469R10326, 2521.5520
R8146, 6832.7055R10426, 1921.5458
R8266, 7121.4409R10520, 1933.1413
R8372, 7121.4440R10623, 2233.1690
R8472, 6521.4450R10743, 2521.6147
R8566, 6532.4693R10849, 2521.6453
R8669, 6832.5474R10949, 1921.5698
R8720, 4821.5157R1154, 5532.5814
R8826, 4821.7488R11043, 1933.0813
R8926, 4221.7601R11146, 2233.1313
R9020, 4233.1248R11266, 2521.7653
R9123, 4533.1234R11372, 2521.5582
R9243, 4821.5390R11472, 1921.7557
R9349, 4821.5352R11566, 1933.0857
R9449, 4221.5698R11669, 2233.135426.2531

References

  1. Kleerekoper, L.; van Esch, M.; Salcedo, T.B. How to make a city climate-proof, addressing the urban heat island effect. Resour. Conserv. Recycl. 2012, 64, 30–38. [Google Scholar] [CrossRef]
  2. Mallen, E.; Bakin, J.; Stone, B.; Sivakumar, R.; Lanza, K. Thermal impacts of built and vegetated environments on local microclimates in an Urban University campus. Urban Clim. 2020, 32, 100640. [Google Scholar] [CrossRef]
  3. He, B.J. Towards the next generation of green building for urban heat island mitigation: Zero UHI impact building. Sustain. Cities Soc. 2019, 50, 101647. [Google Scholar] [CrossRef]
  4. Nikolopoulou, M. Urban Open Spaces and Adaptation to Climate Change. In Applied Urban Ecology: A Global Framework; Wiley: Hoboken, NJ, USA, 2011; pp. 106–122. [Google Scholar] [CrossRef]
  5. Sharifi, E.; Sivam, A.; Boland, J. Resilience to heat in public space: A case study of Adelaide, South Australia. J. Environ. Plan. Manag. 2015, 59, 1833–1854. [Google Scholar] [CrossRef]
  6. Lenzholzer, S.; Brown, R.D. Climate-responsive landscape architecture design education. J. Clean. Prod. 2013, 61, 89–99. [Google Scholar] [CrossRef]
  7. Ruefenacht, L.; Adelia, A.S.; Acero, J.A.; Nevat, I. Climate-Responsive Design Guidelines. 2020. Available online: https://www.research-collection.ethz.ch/handle/20.500.11850/448072 (accessed on 18 March 2023).
  8. Tamminga, K.; Cortesão, J.; Bakx, M. Convivial Greenstreets: A Concept for Climate-Responsive Urban Design. Sustainability 2020, 12, 3790. [Google Scholar] [CrossRef]
  9. Gago, E.J.; Roldan, J.; Pacheco-Torres, R.; Ordóñez, J. The city and urban heat islands: A review of strategies to mitigate adverse effects. Renew. Sustain. Energy Rev. 2013, 25, 749–758. [Google Scholar] [CrossRef]
  10. Faragallah, R.N.; Ragheb, R.A. Evaluation of thermal comfort and urban heat island through cool paving materials using ENVI-Met. Ain Shams Eng. J. 2022, 13, 101609. [Google Scholar] [CrossRef]
  11. Chatzidimitriou, A.; Yannas, S. Street canyon design and improvement potential for urban open spaces; the influence of canyon Aspect Ratio and orientation on microclimate and outdoor comfort. Sustain. Cities Soc. 2017, 33, 85–101. [Google Scholar] [CrossRef]
  12. Yahia, M.W.; Johansson, E.; Thorsson, S.; Lindberg, F.; Rasmussen, M.I. Effect of urban design on microclimate and thermal comfort outdoors in warm-humid Dar es Salaam, Tanzania. Int. J. Biometeorol. 2018, 62, 373–385. [Google Scholar] [CrossRef]
  13. Jamei, E.; Ossen, D.R.; Seyedmahmoudian, M.; Sandanayake, M.; Stojcevski, A.; Horan, B. Urban design parameters for heat mitigation in tropics. Renew. Sustain. Energy Rev. 2020, 134, 110362. [Google Scholar] [CrossRef]
  14. Muniz-Gäal, L.P.; Pezzuto, C.C.; de Carvalho, M.F.H.; Mota, L.T.M. Urban geometry and the microclimate of street canyons in tropical climate. Build. Environ. 2020, 169, 106547. [Google Scholar] [CrossRef]
  15. Lai, D.; Liu, W.; Gan, T.; Liu, K.; Chen, Q. A review of mitigating strategies to improve the thermal environment and thermal comfort in urban outdoor spaces. Sci. Total Environ. 2019, 661, 337–353. [Google Scholar] [CrossRef]
  16. Bruse, M. ENVI-met 3.0: Updated Model Overview. 2004. Available online: www.envi-met.com (accessed on 29 September 2022).
  17. Bueno, B.; Norford, L.; Hidalgo, J.; Pigeon, G. The urban weather generator. J. Build. Perform. Simul. 2013, 6, 269–281. [Google Scholar] [CrossRef]
  18. Freiburg, U.; Meteorological Institute. RayMan—Modelling Mean Radiant Temperature and Thermal Indices. Available online: https://www.urbanclimate.net/rayman/introraymanpro.htm (accessed on 12 April 2020).
  19. Matzarakis, A.; Rutz, F.; Mayer, H. Modelling the thermal bioclimate in urban areas with the RayMan Model. In Proceedings of the 23rd Conference on Passive and Low Energy Architecture, Geneva, Switzerland, 6–8 September 2006. [Google Scholar]
  20. Stavrakakis, G.M.; Al Katsaprakakis, D.; Damasiotis, M. Basic Principles, Most Common Computational Tools, and Capabilities for Building Energy and Urban Microclimate Simulations. Energies 2021, 14, 6707. [Google Scholar] [CrossRef]
  21. Vanky, P. Numerical Simulations of the Urban Microclimate. Licentiate Thesis, No. 2023:01. Department of Mechanics and Maritime Sciences, Division of Fluid Dinamics, Chalmers University of Technology, Gothenburg, Sweden, 2023. [Google Scholar]
  22. Shi, Y.; Ren, C.; Zheng, Y.; Ng, E. Mapping the urban microclimatic spatial distribution in a sub-tropical high-density urban environment. Archit. Sci. Rev. 2015, 59, 370–384. [Google Scholar] [CrossRef]
  23. Wong, N.H.; Jusuf, S.K.; Syafii, N.I.; Chen, Y.; Hajadi, N.; Sathyanarayanan, H.; Manickavasagam, Y.V. Evaluation of the impact of the surrounding urban morphology on building energy consumption. Solar Energy 2011, 85, 57–71. [Google Scholar] [CrossRef]
  24. Li, Z.; Zhang, H.; Wen, C.Y.; Yang, A.S.; Juan, Y.H. Effects of frontal area density on outdoor thermal comfort and air quality. Build. Environ. 2020, 180, 107028. [Google Scholar] [CrossRef]
  25. Ren, J.; Yang, J.; Zhang, Y.; Xiao, X.; Xia, J.C.; Li, X.; Wang, S. Exploring thermal comfort of urban buildings based on local climate zones. J. Clean. Prod. 2022, 340, 130744. [Google Scholar] [CrossRef]
  26. Xue, Y.; Wang, Y.; Peng, H.; Wang, H.; Shen, J. The impact of building configurations and anthropogenic heat on daily urban air temperature cycles. Build. Environ. 2020, 169, 106564. [Google Scholar] [CrossRef]
  27. Yang, X.; Li, Y. The impact of Building Density and building height heterogeneity on average urban albedo and street surface temperature. Build. Environ. 2015, 90, 146–156. [Google Scholar] [CrossRef]
  28. Taleghani, M. The impact of increasing urban surface albedo on outdoor summer thermal comfort within a university campus. Urban Clim. 2018, 24, 175–184. [Google Scholar] [CrossRef]
  29. Ali-Toudert, F.; Mayer, H. Numerical study on the effects of Aspect Ratio and orientation of an urban street canyon on outdoor thermal comfort in hot and dry climate. Build. Environ. 2006, 41, 94–108. [Google Scholar] [CrossRef]
  30. Takebayashi, H.; Moriyama, M. Relationships between the properties of an urban street canyon and its radiant environment: Introduction of appropriate urban heat island mitigation technologies. Solar Energy 2012, 86, 2255–2262. [Google Scholar] [CrossRef]
  31. Zhang, Y.; Du, X.; Shi, Y. Effects of street canyon design on pedestrian thermal comfort in the hot-humid area of China. Int. J. Biometeorol. 2017, 61, 1421–1432. [Google Scholar] [CrossRef]
  32. Bochenek, A.; Klemm, K. Influence of canyon Aspect Ratio on microclimatic conditions: Case of Lodz, Poland. MATEC Web Conf. 2019, 282, 02045. [Google Scholar] [CrossRef]
  33. Memon, R.A.; Leung, D.Y.C.; Liu, C.H. Effects of building Aspect Ratio and wind speed on air temperatures in urban-like street canyons. Build. Environ. 2010, 45, 176–188. [Google Scholar] [CrossRef]
  34. Jamei, E.; Rajagopalan, P.; Seyedmahmoudian, M.; Jamei, Y. Review on the impact of urban geometry and pedestrian level greening on outdoor thermal comfort. Renew. Sustain. Energy Rev. 2016, 54, 1002–1017. [Google Scholar] [CrossRef]
  35. Lin, P.; Gou, Z.; Lau, S.; Qin, H. The Impact of Urban Design Descriptors on Outdoor Thermal Environment: A Literature Review. Energies 2017, 10, 2151. [Google Scholar] [CrossRef]
  36. Tobler, W.; Deichmann, U.; Gottsegen, J.; Maloy, K. The Global Demography Project (95-6). 1995. Available online: https://escholarship.org/uc/item/0kt69058 (accessed on 18 March 2023).
  37. Richards, D.; Masoudi, M.; Oh, R.R.; Yando, E.S.; Zhang, J.; Friess, D.A.; Grêt-Regamey, A.; Tan, P.Y.; Edwards, P.J. Global Variation in Climate, Human Development, and Population Density Has Implications for Urban Ecosystem Services. Sustainability 2019, 11, 6200. [Google Scholar] [CrossRef]
  38. Beck, H.E.; Zimmermann, N.E.; McVicar, T.R.; Vergopolan, N.; Berg, A.; Wood, E.F. Present and future köppen-geiger climate classification maps at 1-km resolution. Sci. Data 2018, 5, 180214. [Google Scholar] [CrossRef]
  39. United Nations. 2018 Revision of World Urbanization Prospects; United Nations: Rome, Italy, 2018. [Google Scholar]
  40. Mellinger, A.D.; Sachs, J.D.; Gallup, J.L. Climate, Water Navigability, and Economic Development. CID Work. Pap. Ser. 1999, 24, 1–30. Available online: https://dash.harvard.edu/handle/1/39403786 (accessed on 12 March 2023).
  41. Ye, Y.; Van Nes, A. Measuring urban maturation processes in Dutch and Chinese new towns: Combining street network configuration with Building Density and degree of land use diversification through GIS. J. Space Syntax. 2013, 4, 18–37. [Google Scholar]
  42. Ahmad, K.; Khare, M.; Chaudhry, K.K. Wind tunnel simulation studies on dispersion at urban street canyons and intersections—A review. J. Wind. Eng. Ind. Aerodyn. 2005, 93, 697–717. [Google Scholar] [CrossRef]
  43. ENVI-MET. Nesting Grids. Available online: https://envi-met.info/doku.php?id=kb:nesting (accessed on 19 March 2023).
  44. Tsoka, S.; Tsikaloudaki, A.; Theodosiou, T. Analyzing the ENVI-met microclimate model’s performance and assessing cool materials and urban vegetation applications—A review. Sustain. Cities Soc. 2018, 43, 55–76. [Google Scholar] [CrossRef]
  45. Jareemit, D.; Srivanit, M. Modelling the Urban Microclimate Effects of Street Configurations on Thermal Environment in the Residential Townhouse of Bangkok. 2019. Available online: https://www.researchgate.net/publication/331296242 (accessed on 3 December 2020).
  46. Efeitos De Telhados Vegetados No Conforto Térmico de Pedestres, Simulação Pelo Software ENVI-MET (Portuguese) Green Roofs Effects on Pedestrians Thermal Comfort: Simulation Using Envi-Met Software (English). Available online: https://www.researchgate.net/publication/271136294_EFEITOS_DE_TELHADOS_VEGETADOS_NO_CONFORTO_TERMICO_DE_PEDESTRES_SIMULACAO_PELO_SOFTWARE_ENVI-MET_portuguese_Green_roofs_effects_on_pedestrians_thermal_comfort_simulation_using_Envi-Met_software_English?channel=doi&linkId=54be9c1b0cf28ce68e69e72a&showFulltext=true (accessed on 12 March 2023).
  47. Morakinyo, T.E.; Dahanayake, K.W.D.K.C.; Adegun, O.B.; Balogun, A.A. Modelling the effect of tree-shading on summer indoor and outdoor thermal condition of two similar buildings in a Nigerian university. Energy Build. 2016, 130, 721–732. [Google Scholar] [CrossRef]
  48. Thomas, G.; Thomas, J.; Mathews, G.M.; Alexander, S.P.; Jose, J. Assessment of the potential of green wall on modification of local urban microclimate in humid tropical climate using ENVI-met model. Ecol. Eng. 2023, 187, 106868. [Google Scholar] [CrossRef]
  49. Spangenberg, J.; Shinzato, P.; Johansson, E.; Duarte, D. Simulation of the Influence of Vegetation on Microclimate and Thermal Comfort in the City of São Paulo. Rev. Soc. Bras. Arborização Urbana 2008, 3, 1–19. Available online: https://revistas.ufpr.br/revsbau/article/view/66265 (accessed on 18 March 2023). [CrossRef]
  50. Maciel, C.D.R.; Kolokotroni, M.; Paulo, S. Cool materials in the urban built environment to mitigate heat islands: Potential consequences for building ventilation. In Proceedings of the 38th AIVC International Conference, Nottingham, UK, 13–14 September 2017; Available online: https://bura.brunel.ac.uk/handle/2438/15309 (accessed on 3 December 2020).
  51. Honjo, T. Thermal Comfort in Outdoor Environment. Global Environmental Research. 2009. Available online: https://www.researchgate.net/publication/228521038 (accessed on 27 April 2023).
  52. Binarti, F.; Koerniawan, M.D.; Triyadi, S.; Utami, S.S.; Matzarakis, A. A review of outdoor thermal comfort indices and neutral ranges for hot-humid regions. Urban Clim. 2020, 31, 100531. [Google Scholar] [CrossRef]
  53. Kumar, P.; Sharma, A. Study on importance, procedure, and scope of outdoor thermal comfort—A review. Sustain. Cities Soc. 2020, 61, 102297. [Google Scholar] [CrossRef]
  54. Fang, Z.; Lin, Z.; Mak, C.M.; Niu, J.; Tse, K.T. Investigation into sensitivities of factors in outdoor thermal comfort indices. Build. Environ. 2018, 128, 129–142. [Google Scholar] [CrossRef]
  55. Epstein, Y.; Moran, D.S. Thermal Comfort and the Heat Stress Indices. Ind. Health 2006, 44, 388–398. [Google Scholar] [CrossRef] [PubMed]
  56. Zare, S.; Hasheminejad, N.; Shirvan, H.E.; Hemmatjo, R.; Sarebanzadeh, K.; Ahmadi, S. Comparing Universal Thermal Climate Index (UTCI) with selected thermal indices/environmental parameters during 12 months of the year. Weather Clim. Extrem. 2018, 19, 49–57. [Google Scholar] [CrossRef]
  57. Blazejczyk, K.; Epstein, Y.; Jendritzky, G.; Staiger, H.; Tinz, B. Comparison of UTCI to selected thermal indices. Int. J. Biometeorol. 2012, 56, 515–535. [Google Scholar] [CrossRef]
  58. Jendritzky, G.; de Dear, R.; Havenith, G. UTCI—Why another thermal index? Int. J. Biometeorol. 2012, 56, 421–428. [Google Scholar] [CrossRef]
  59. Fiala, D.; Havenith, G.; Bröde, P.; Kampmann, B.; Jendritzky, G. UTCI-Fiala multi-node model of human heat transfer and temperature regulation. Int. J. Biometeorol. 2012, 56, 429–441. [Google Scholar] [CrossRef]
  60. ISO. ISO 7730: Ergonomics of the thermal environment Analytical determination and interpretation of thermal comfort using calculation of the PMV and PPD indices and local thermal comfort criteria. Management 2005, 3, 605–615. Available online: https://www.iso.org/standard/39155.html (accessed on 27 April 2023).
  61. Jin, H.; Liu, Z.; Jin, Y.; Kang, J.; Liu, J. The effects of residential area building layout on outdoor wind environment at the pedestrian level in severe cold regions of China. Sustainability 2017, 9, 2310. [Google Scholar] [CrossRef]
  62. Ok, V.; Aygün, M. The Variations of Wind Speeds with Building Density in Urban Areas. Archit. Sci. Rev. 2011, 38, 87–95. [Google Scholar] [CrossRef]
  63. Guo, F.; Zhu, P.; Wang, S.; Duan, D.; Jin, Y. Improving Natural Ventilation Performance in a High-Density Urban District: A Building Morphology Method. Procedia Eng. 2017, 205, 952–958. [Google Scholar] [CrossRef]
  64. Li, X.; Yoshimura, Y.; Tu, W.; Ratti, C. A Pedestrian-Level Strategy to Minimize Outdoor Sunlight Exposure. In Artificial Intelligence, Machine Learning, and Optimization Tools for Smart Cities; Springer Optimization and Its Applications; Springer: Berlin/Heidelberg, Germany, 2022; Volume 186, pp. 123–134. [Google Scholar] [CrossRef]
  65. Ali-Toudert, F.; Mayer, H. Thermal comfort in an east-west oriented street canyon in Freiburg (Germany) under hot summer conditions. Theor. Appl. Climatol. 2007, 87, 223–237. [Google Scholar] [CrossRef]
  66. Jin, H.; Qiao, L.; Cui, P. Study on the Effect of Streets’ Space Forms on Campus Microclimate in the Severe Cold Region of China—Case Study of a University Campus in Daqing City. Int. J. Environ. Res. Public Health 2020, 17, 8389. [Google Scholar] [CrossRef]
  67. Abdelhafez, M.H.H.; Altaf, F.; Alshenaifi, M.; Hamdy, O.; Ragab, A. Achieving Effective Thermal Performance of Street Canyons in Various Climatic Zones. Sustainability 2022, 14, 10780. [Google Scholar] [CrossRef]
  68. Acero, J.A.; Koh, E.J.Y.; Ruefenacht, L.A.; Norford, L.K. Modelling the influence of high-rise urban geometry on outdoor thermal comfort in Singapore. Urban Clim. 2021, 36, 100775. [Google Scholar] [CrossRef]
Figure 1. The global footprint of tropical climates [38].
Sustainability 15 08902 g001
Figure 2. Building-density values and their corresponding footprint: (a) = 80%; (b) = 60%; (c) = 40%; (d) = 20%.
Sustainability 15 08902 g002
Figure 3. ENVI-Met model’s north according to street-orientation cases: (a) E–W and N–S; (b) NE–SW and NW–SE.
Sustainability 15 08902 g003
Figure 4. Receptor classification as inserted in the ENVI-met 3D model: (a) E–W and N–S orientations; (b) NE–SW and NW–SE orientations.
Sustainability 15 08902 g004
Figure 5. UTCI variation according to building density for different street orientations: (a) E-W streets; (b) N-S streets; (c)NW-SE streets; (d) NE-SW streets; (e) Courtyards; (f) Overall UTCI.
Sustainability 15 08902 g005aSustainability 15 08902 g005b
Figure 6. UTCI variation according to AR for different building densities: (a) BD = 80%; (b) BD = 80%; (c) BD = 80%; (d) BD = 80%.
Sustainability 15 08902 g006aSustainability 15 08902 g006b
Figure 7. UTCI comparison for different street orientations and building densities: (a) AR = 0.5; (b) AR = 1.0; (c) AR = 2.0; (d) AR = 3.0; (e) AR = 4.0; (f) all AR values considered.
Sustainability 15 08902 g007aSustainability 15 08902 g007b
Table 1. Parametric combination of street-morphology indicators.
BDi = 80%; 60%; 40%; 20%ARi = 0.5; 1.0; 2.0; 3.0; 4.0Oi = E–W; N–S; NE–SW; NW–SEScenario No.
80%80%/0.580%/0.5/E–WUM1
80%/0.5/N–SUM2
80%/0.5/NE–SWUM3
80%/0.5/NW–SEUM4
80%/1.080%/1.0/E–WUM5
80%/1.0/N–SUM6
80%/1.0/NE–SWUM7
80%/1.0/NW–SEUM8
80%/2.080%/2.0/E–WUM9
80%/2.0/N–SUM10
80%/2.0/NE–SWUM11
80%/2.0/NW–SEUM12
80%/3.080%/3.0/E–WUM13
80%/3.0/N–SUM14
80%/3.0/NE–SWUM15
80%/3.0/NW–SEUM16
80%/4.080%/4.0/E–WUM17
80%/4.0/N–SUM18
80%/4.0/NE–SWUM19
80%/4.0/NW–SEUM20
60%60%/0.560%/0.5/E–WUM21
60%/0.5/N–SUM22
60%/0.5/NE–SWUM23
60%/0.5/NW–SEUM24
60%/1.060%/1.0/E–WUM25
60%/1.0/N–SUM26
60%/1.0/NE–SWUM27
60%/1.0/NW–SEUM28
60%/2.060%/2.0/E–WUM29
60%/2.0/N–SUM30
60%/2.0/NE–SWUM31
60%/2.0/NW–SEUM32
60%/3.060%/3.0/E–WUM33
60%/3.0/N–SUM34
60%/3.0/NE–SWUM35
60%/3.0/NW–SEUM36
60%/4.060%/4.0/E–WUM37
60%/4.0/N–SUM38
60%/4.0/NE–SWUM39
60%/4.0/NW–SEUM40
40%40%/0.540%/0.5/E–WUM41
40%/0.5/N–SUM42
40%/0.5/NE–SWUM43
40%/0.5/NW–SEUM44
40%/1.040%/1.0/E–WUM45
40%/1.0/N–SUM46
40%/1.0/NE–SWUM47
40%/1.0/NW–SEUM48
40%/2.040%/2.0/E–WUM49
40%/2.0/N–SUM50
40%/2.0/NE–SWUM51
40%/2.0/NW–SEUM52
40%/3.040%/3.0/E–WUM53
40%/3.0/N–SUM54
40%/3.0/NE–SWUM55
40%/3.0/NW–SEUM56
40%/4.040%/4.0/E–WUM57
40%/4.0/N–SUM58
40%/4.0/NE–SWUM59
40%/4.0/NW–SEUM60
20%20%/0.520%/0.5/E–WUM61
20%/0.5/N–SUM62
20%/0.5/NE–SWUM63
20%/0.5/NW–SEUM64
20%/1.020%/1.0/E–WUM65
20%/1.0/N–SUM66
20%/1.0/NE–SWUM67
20%/1.0/NW–SEUM68
20%/2.020%/2.0/E–WUM69
20%/2.0/N–SUM70
20%/2.0/NE–SWUM71
20%/2.0/NW–SEUM72
20%/3.020%/3.0/E–WUM73
20%/3.0/N–SUM74
20%/3.0/NE–SWUM75
20%/3.0/NW–SEUM76
20%/4.020%/4.0/E–WUM77
20%/4.0/N–SUM78
20%/4.0/NE–SWUM79
20%/4.0/NW–SEUM80
Table 2. ENVI-met model-validation metrics as reported in Bangkok, Cuiaba, Akure, and Pathanamthitta.
LocationParametersModel-Validation Criteria
Correlation (R2)ErrorBias
Bangkok, Thailand [45]MRT0.91---
Cuiaba, Brazil [46]Air temperature0.95
0.98
2.39 (RMSE)2.00 (MAE)1.29
Relative humidity 0.9114.32 (RMSE) 14.31 (MAE) −14.31 (MBE)
0.902.72
(RMSE)
4.21 (MAE) −2.25
(MBE)
Akure, Nigeria [47]Air temperature 0.96–0.990.00–0.01
(NMSE)
-0.01–0.06
(FB)
Relative humidity0.82–0.900.00–0.01
(NMSE)
-0.01–0.07
(FB)
Pathanamthitta, Kerala (India) [48]Air temperature0.80–0.920.58–0.72
(RMSE)
0.48–0.77
(MAE)
Table 3. Model configuration and initialization-parameter values in Thailand, Brazil, and Nigeria.
LocationPathanamthitta, Kerala, India) [48]; Bangkok, Thailand [45]Cuiaba, Brazil [46,49,50]Akure, Nigeria [47]
Climate typeWarm–humid tropical (Af) Hot–humid (Aw2) [50]Warm–humid (Aw)
Simulated summer periodMarch [48]
April [45]
March [50]September-November
Simulation duration48 h [48]48 h [46]72 h
Start time00:00 [48]
6:00 [45]
20:00 [46] 7:00 [50]6:00
Spatial resolution (grid size)2 m × 2 m × 1 m [48]2 m × 2 m × 2 m [46]2 m × 2 m × 2 m
2.5 m × 2.5 × 2.5 m [50]
Domain size90 × 90 × 25 grids [48]180 × 180 × 30 grids [46]
600 m × 600 m [50]
120 m × 80 m × 60 m
Wind speed (m/s)1.6 m/s [48]-3 m/s
Wind direction (°)East [48]330° (south) [50]265° (southwest)
Air temperature (°C)25.4–38.6 [48]24–38 [50]25.1–29
Relative humidity (%)50–68 [48]8490 (shaded)/85 (unshaded)
Sky conditionCloud free (clear) [48]-Clear
Table 4. Average UTCI data for different BD and AR combinations on E–W streets.
BD = 80%BD = 60%BD = 40%BD = 20%
AR028.1029.2931.4533.23
AR128.4729.0031.2933.17
AR226.6528.2630.7332.95
AR324.6126.2829.0231.39
AR424.4426.0228.9531.45
Table 5. Average UTCI data for different BD and AR combinations on N–S streets.
BD = 80%BD = 60%BD = 40%BD = 20%
AR027.1428.5329.5832.10
AR127.3728.0629.2831.90
AR226.2027.6228.8631.67
AR324.8426.4027.5630.19
AR424.6626.2927.3630.07
Table 6. Average UTCI data for different BD and AR combinations on NW–SE streets.
BD = 80%BD = 60%BD = 40%BD = 20%
AR028.0529.3231.6233.28
AR127.9629.0831.4433.17
AR226.9328.4531.0032.92
AR325.9127.0729.3631.30
AR425.4326.6729.1031.16
Table 7. Average UTCI data for different BD and AR combinations on NE–SW streets.
BD = 80%BD = 60%BD = 40%BD = 20%
AR026.4528.0329.2832.00
AR126.0027.0328.5831.63
AR225.1526.6728.4231.45
AR324.2125.5427.3430.15
AR424.2625.4927.2429.78
Table 8. Average UTCI data for different BD and AR combinations in public courtyards.
BD = 80%BD = 60%BD = 40%BD = 20%
AR026.8235.1534.9434.76
AR126.6133.6533.9834.09
AR225.5932.7632.9233.65
AR324.3030.0830.5631.72
AR424.2229.2829.9531.48
Disclaimer/Publisher’s Note: The statements, opinions and data contained in all publications are solely those of the individual author(s) and contributor(s) and not of MDPI and/or the editor(s). MDPI and/or the editor(s) disclaim responsibility for any injury to people or property resulting from any ideas, methods, instructions or products referred to in the content.

