Article

A Decision Support Software Application for the Design of Agrophotovoltaic Systems in Republic of Korea

1
Department of Industrial and Systems Engineering, Dongguk University-Seoul, Seoul 04620, Republic of Korea
2
Department of Environmental Horticulture & Landscape Architecture, College of Life Science & Biotechnology, Dankook University, Cheonan-si 31116, Republic of Korea
*
Authors to whom correspondence should be addressed.
Sustainability 2023, 15(11), 8830; https://doi.org/10.3390/su15118830
Submission received: 20 March 2023 / Revised: 25 April 2023 / Accepted: 29 May 2023 / Published: 30 May 2023

Abstract

:
Agrophotovoltaic (APV) systems produce both solar energy and crops, so they are considered a sustainable alternative to traditional solar power plants, which can potentially destroy farmlands. However, it is challenging to diffuse APV systems because of their high installation and operating costs. Thus, to resolve the issue by maximizing the productivity and profits of an APV system, this study aims to propose a mobile-phone-based decision support system (DSS) for a supply chain network design for APV systems in South Korea using satellite imagery incorporating geographic information system (GIS) data. Particularly, polynomial regression models estimating annual corn (Zea mays) yields and the predicted generation of electricity were developed and integrated with the proposed DSS. Field experiment data provided by the APV system at Jeollanamdo Agricultural Research and Extension Services in South Korea were utilized. Two photovoltaic (PV) module types (mono-facial and bi-facial) and three different shading ratios for APV systems (21.3%, 25.6%, and 32.0%) were considered design factors for APV systems. An optimal network structure of 6 candidate APV systems and 15 agricultural markets was devised using the generalized reduced gradient (GRG) method. The profits of the six candidate APV systems are mainly affected by the transportation costs to the markets and the policy of the electricity selling prices. As a result, the proposed supply chain design framework successfully identifies an APV system network with maximum profits from crop production as well as electricity generation.

1. Introduction

An agrophotovoltaic (APV) system that produces both crops and solar energy is considered one of the best sustainable alternatives to solar power plants, which potentially destroy existing farmland [1]. Particularly, a country with a land shortage problem such as South Korea faces a trade-off between solar energy production and food security conservation. More specifically, since the Korean government intends to produce 32.2 GW of solar energy by 2030, 425.04 km2 of land, which is 70% of the land in Seoul, South Korea, needs to be used for solar power plant construction [2]. This implies that approximately 5.16% of rice paddy fields will be converted to solar power plants to produce renewable energy [2].
In fact, the climate change issue is vital to the survival of humanity. Countries around the world signed annual agreements at the United Nations Climate Change Conference and at the Glasgow Climate Pact in Glasgow, England in 2021 [3]. All developed countries have agreed to spend USD 100 billion annually on climate finance to develop renewable energy sources and reduce the use of fossil fuels. In particular, as coal power accelerates global warming, renewable energy has an important role in reducing greenhouse gas (GHG) emissions [3]. As in other countries, the Korean government has made great efforts to use renewable energy and reduce GHG emissions. As mentioned earlier, the Ministry of Trade, Industry, and Energy has announced that by 2030 it will expand the share of renewable energy generation in Korea to 20% [4]. In 2020, 10 APVs were tested in Republic of Korea, and about 67% of people said that the renewable energy expansion policy is important [5]. Therefore, APV systems are a sustainable way of generating renewable energy, especially in densely populated countries [6].
One of the challenges in reviving the use of renewable energy is associated with the economic aspect. For example, for solar energy to be competitive, the selling price, including production costs, should be lower than or similar to the price of existing fossil-fuel-based energy sources. To this end, the Korean government provides a Renewable Energy Certificate (REC) in addition to the system marginal price (SMP). In 2022 in Republic of Korea [7], the production cost of solar energy, coal, natural gas, and nuclear power is USD 148/MWh, USD 123/MWh, USD 186/MWh, and USD 41/MWh, respectively. The global weighted average levelized cost of electricity (LOCE) for utility-scale photovoltaic (PV) projects decreased from 55/MWh in 2020 to 48/MWh in 2021 because of renewable energy policies such as the Solar Investment Tax Credit (ITC) in the U.S. and the Solar Energy Strategy in Europe [8]. Therefore, most ground-mounted solar power plants were installed in Republic of Korea before 2022, but this caused environmental problems such as damage to the natural environment and soil leakage. In addition, given that most farmlands have sufficient solar radiation to produce solar energy, it is true that destroying farmland to build a solar power plant is one of the easiest options [9].
This study aims to make solar energy competitive by reducing the production cost. To this end, an optimal supply chain network of agrophotovoltaic (APV) systems in Republic of Korea is designed using satellite imagery incorporating geographic information system (GIS) data as part of a mobile-phone-based decision support system (DSS). Polynomial regression models estimating corn (Zea mays) yields and electricity are integrated into the proposed system, and the models are calibrated against field experiment data collected from an APV system at Jeollanamdo Agricultural Research and Extension Services in Republic of Korea. An optimal network structure of 6 candidate APV systems and 15 agricultural markets is devised using the generalized reduced gradient (GRG) method. The decision variables of the network design problem are two PV module types (mono-facial and bi-facial) and three different shading ratios for APV systems (21.3%, 25.6%, and 32.0%). As a result, the proposed decision support system can help farmers and system engineers efficiently construct APV systems under various conditions (or environmental factors).

2. Background

Supply Chain Network of Agrophotovoltaic Systems

In general, a supply chain network consists of three major actors: suppliers (or farms), storage facilities, and retail markets (or agricultural markets) [10]. Similar to other areas, efficient supply chain management in agriculture is challenging because of its correlation with many factors such as food quality, food safety, shelf life, and different demands in each market [11]. An and Ouyang [12] made a robust grain (corn and soybean) supply chain considering post-harvest loss and harvest timing to maximize potential profits and minimize transportation costs. In particular, a short food supply chain reduces transportation costs and CO2 emissions, which is helpful for the environment, and this is proven by increasing EU and national legislation [13].
Among the three major actors in the agriculture supply chain, storage facilities are necessary components to ensure the freshness of the raw material (corn) and reduce dry matter losses [14]. However, in a large tower silo (or the storage facility), there is a loss of corn matter between 7.2% and 14.1% in the first month of storage [15]. More specifically, the loss of 28% of dry matter with 72% moisture is 18.05%, and the loss of 45% of dry matter with 55% moisture is 10.47%. Given that each crop has its own cultivation period depending on environmental conditions, storage facilities are essential actors in the agricultural supply chain. Nevertheless, since warehouse facilities are generally located next to farms in Republic of Korea, only the transportation time between farms and retail markets can be considered a major factor in effective supply chain management. In fact, most corn crops are run by individual farmers with small-scale farms in Republic of Korea, so corn production is stored in a storage facility in the same village, operated by an agricultural cooperative [16].
The supply chain associated with the APV system covers the main characteristics of the existing corn supply chain. This is because the APV system also produces corn under PV modules in addition to generating electricity and delivering it to the power grid [17]. Figure 1a shows the APV system at the Jeollanam-do Agricultural Research and Extension Services in Naju-si (35.0161° N, 126.7108° E), Jeollanam-do, Republic of Korea. As shown in Figure 1b, it has two photovoltaic (PV) module types (mono-facial and bi-facial) and three different shading ratios (21.3%, 25.6%, and 32.0%) [1].
Moreover, the construction costs of the tested APV system are illustrated in Table 1. In fact, the APV system has high investment costs because of its high ground clearance height for small tractor use [14]. In addition, the total construction cost increases as the shading ratio increases. This is because there exists a positive correlation between the number of modules per unit and the shading ratio. The highest number of PV modules per unit area (m2) is 0.089 at a shading ratio of 32%.
To make the APV system competitive, not only energy sales but also crop sales should be considered for APV system management. This implies that an efficient supply chain management system with minimum operational costs should be devised. According to Huang et al. [18], large-scale centralized storage enables the minimization of the total transportation costs of the supply chain of corn in the U.S. because it reduces small-scale transactions between supply chain facilities. However, the study is for biofuel (or ethanol) production. Unlike commercial-scale farms, storage facilities are operated by farmer communities so that farmers can easily consume their harvested crops until the next harvest season [19]. In addition, stored crops can be easily converted into cash when farmers need it [20]. Thus, for the management of non-commercial-scale farms, an appropriate location selection for a farm can be a significant issue. This is not exceptional for supply chain designs for APV systems that are operated by individual farmers.
According to Sharma et al. [21], the geographic information system (GIS) is the most recommended technology for designing an agriculture supply chain under a precision agriculture environment. Because an APV system involves a farm underneath solar panels, this finding can also be applied to an APV system design. Since the GIS provides accurate location information to a user on a map, it is a useful technology for site-planning activities [22]. Multiple factors such as soil quality, terrain properties, drainage, and slope length can be considered under a GIS map [23]. Moreover, Schmedtmann and Campagnolo et al. [24] utilized satellite imagery to develop a common agriculture policy for agricultural subsidy control. They adopted computer-assisted photo interpretation (CAPI) with a support vector machine (SVM) classifier to identify crop types from a satellite image. In this study, we use K-Means clustering to identify potential locations for APV systems that produce corn (see Section 3 for more details).

3. Decision Support System for APV System Design

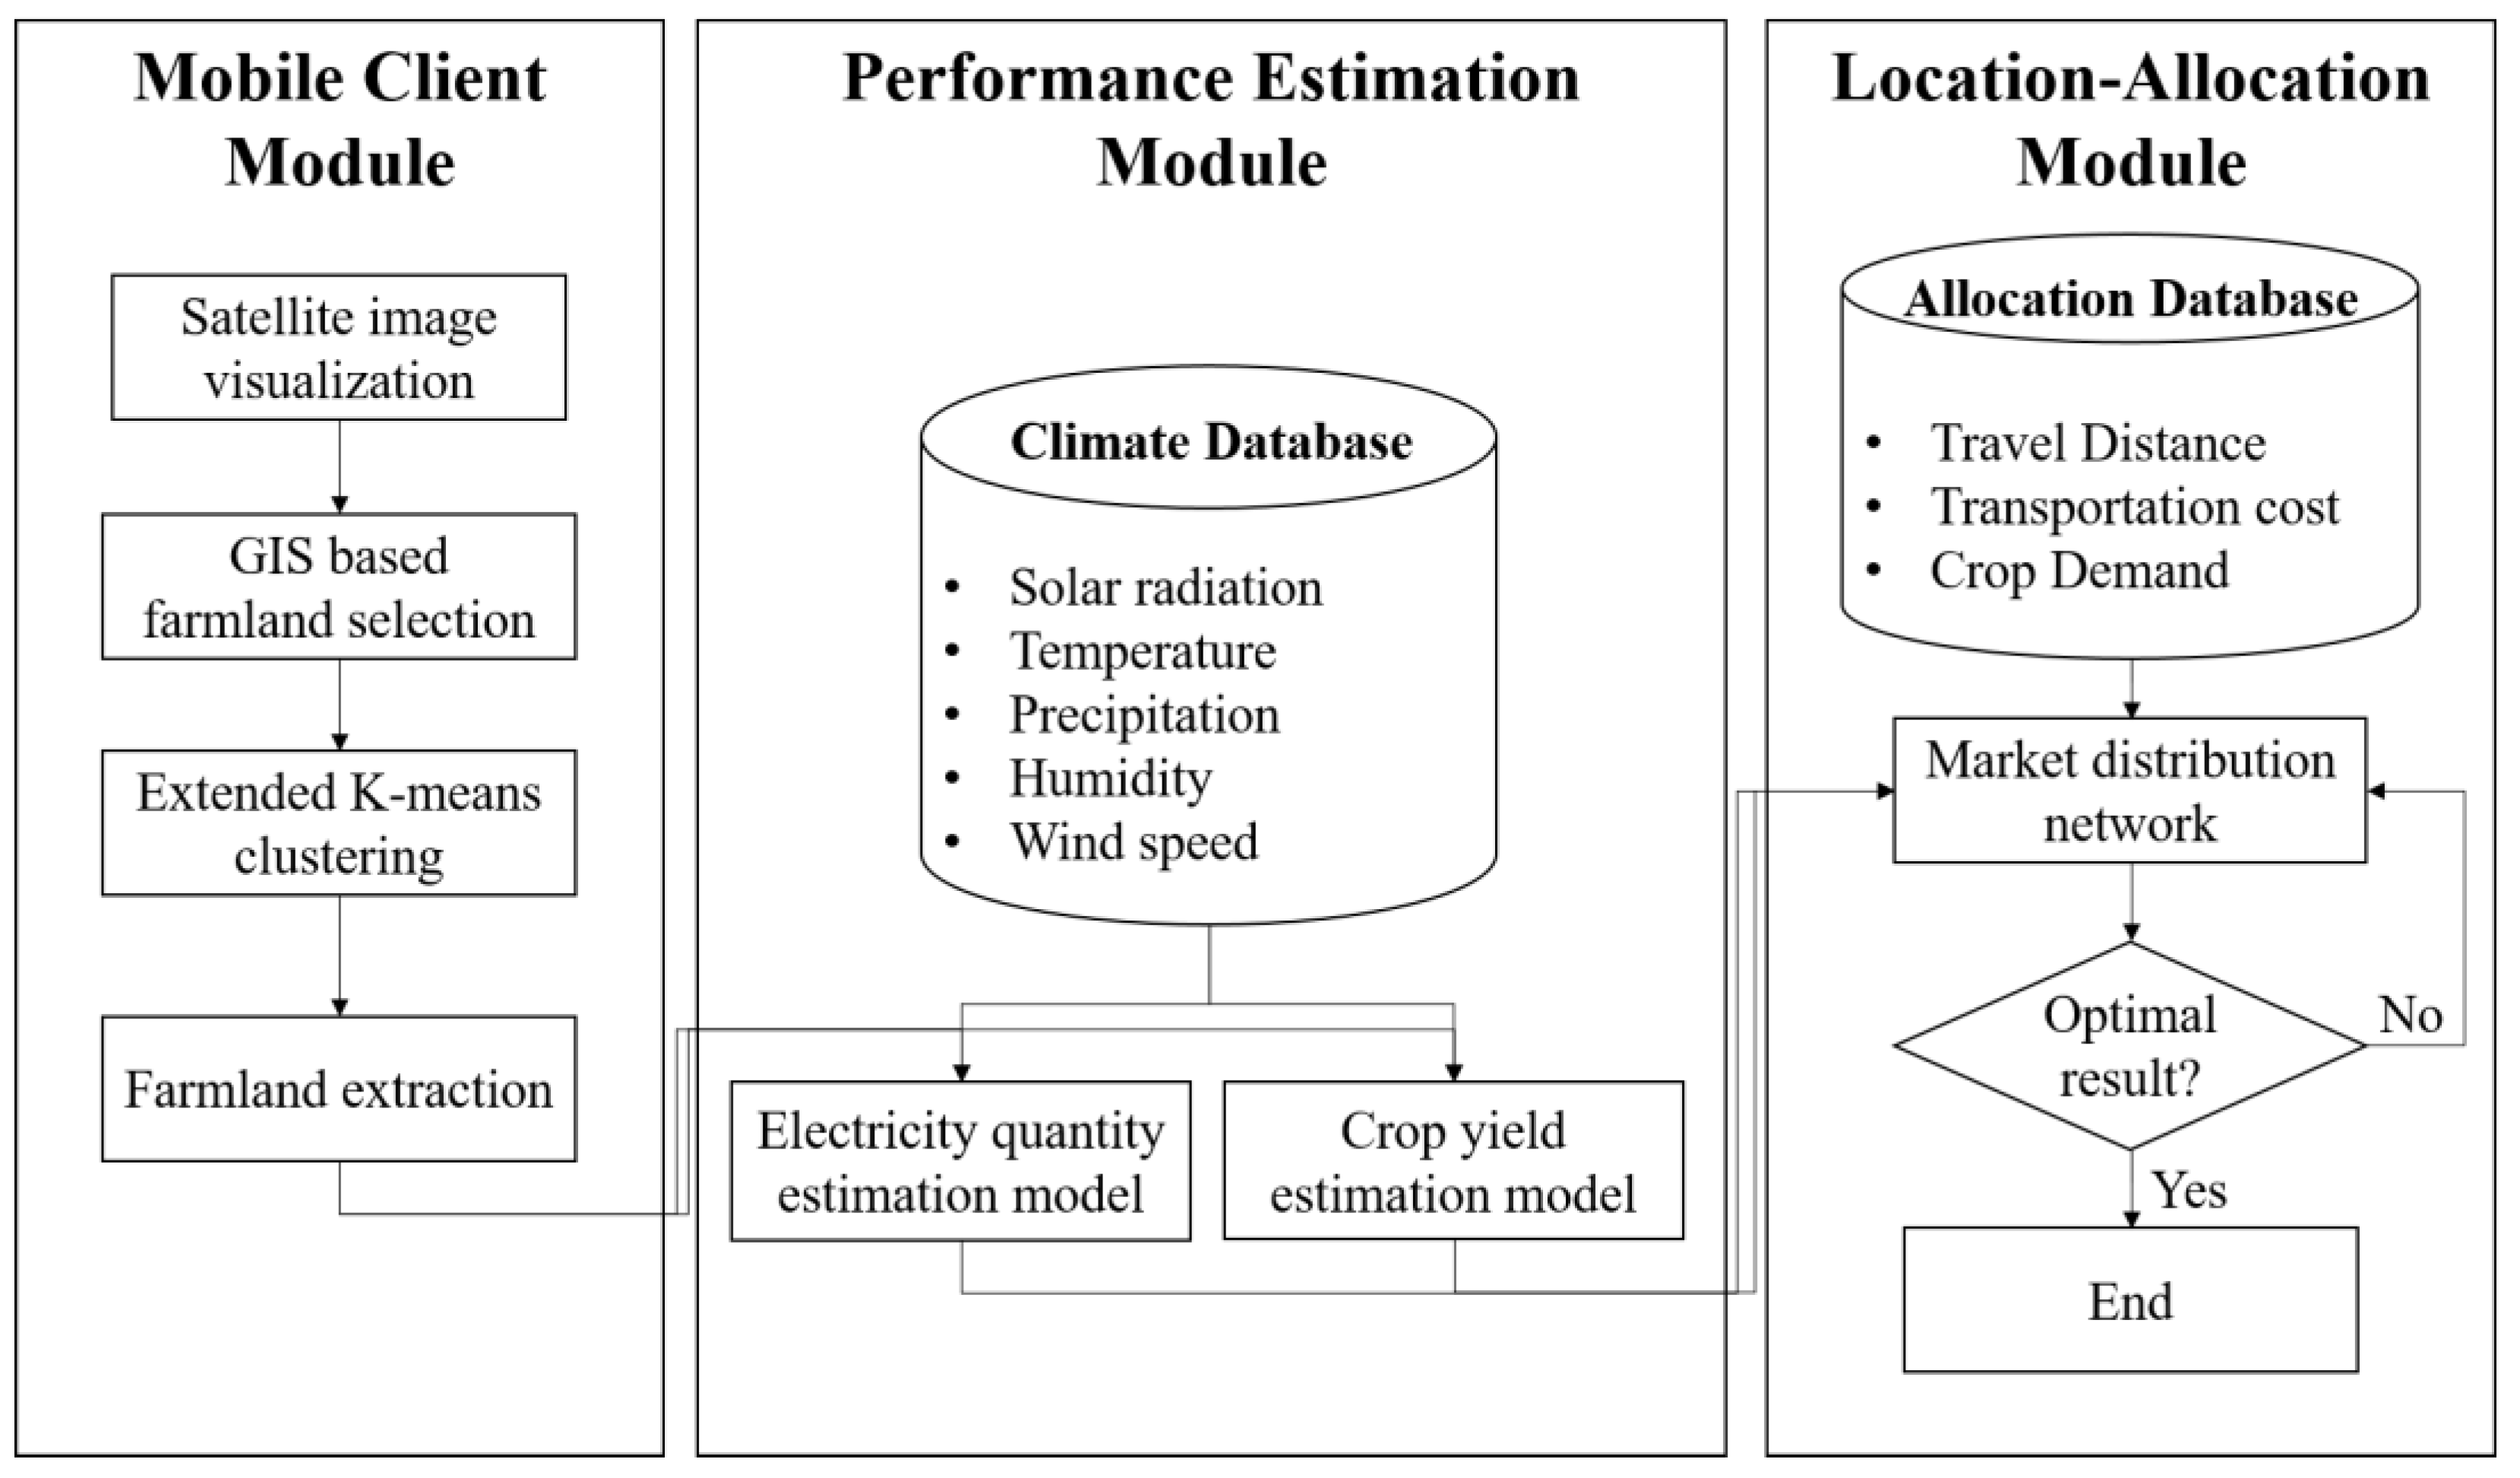
The decision support system (DSS) for designing the APV system consists of three modules, as shown in Figure 2. First, the mobile client module collects and extracts farmland information from the APV system candidate location. Second, the yield estimation module predicts the electricity generation quantities and crop yields of the APV system. The optimal APV system is then designed for each selected candidate site (farmland). Third, the location–allocation module optimizes the supply chain network of APV systems in terms of minimal transport costs.

3.1. Mobile Client Module

The mobile client module helps the DSS user search for farmland for APV construction using the developed smartphone application. The Google Maps Application Programming Interface (API) is used to select a candidate (potential) site. In the mobile application, the potential site of the APV system (farmland) is visualized for the user using a satellite image containing geographic information system (GIS) data. Figure 3 shows an example of a mobile client module for estimating corn yields at a selected location (36.3137° N, 127.0354° E) in Republic of Korea.
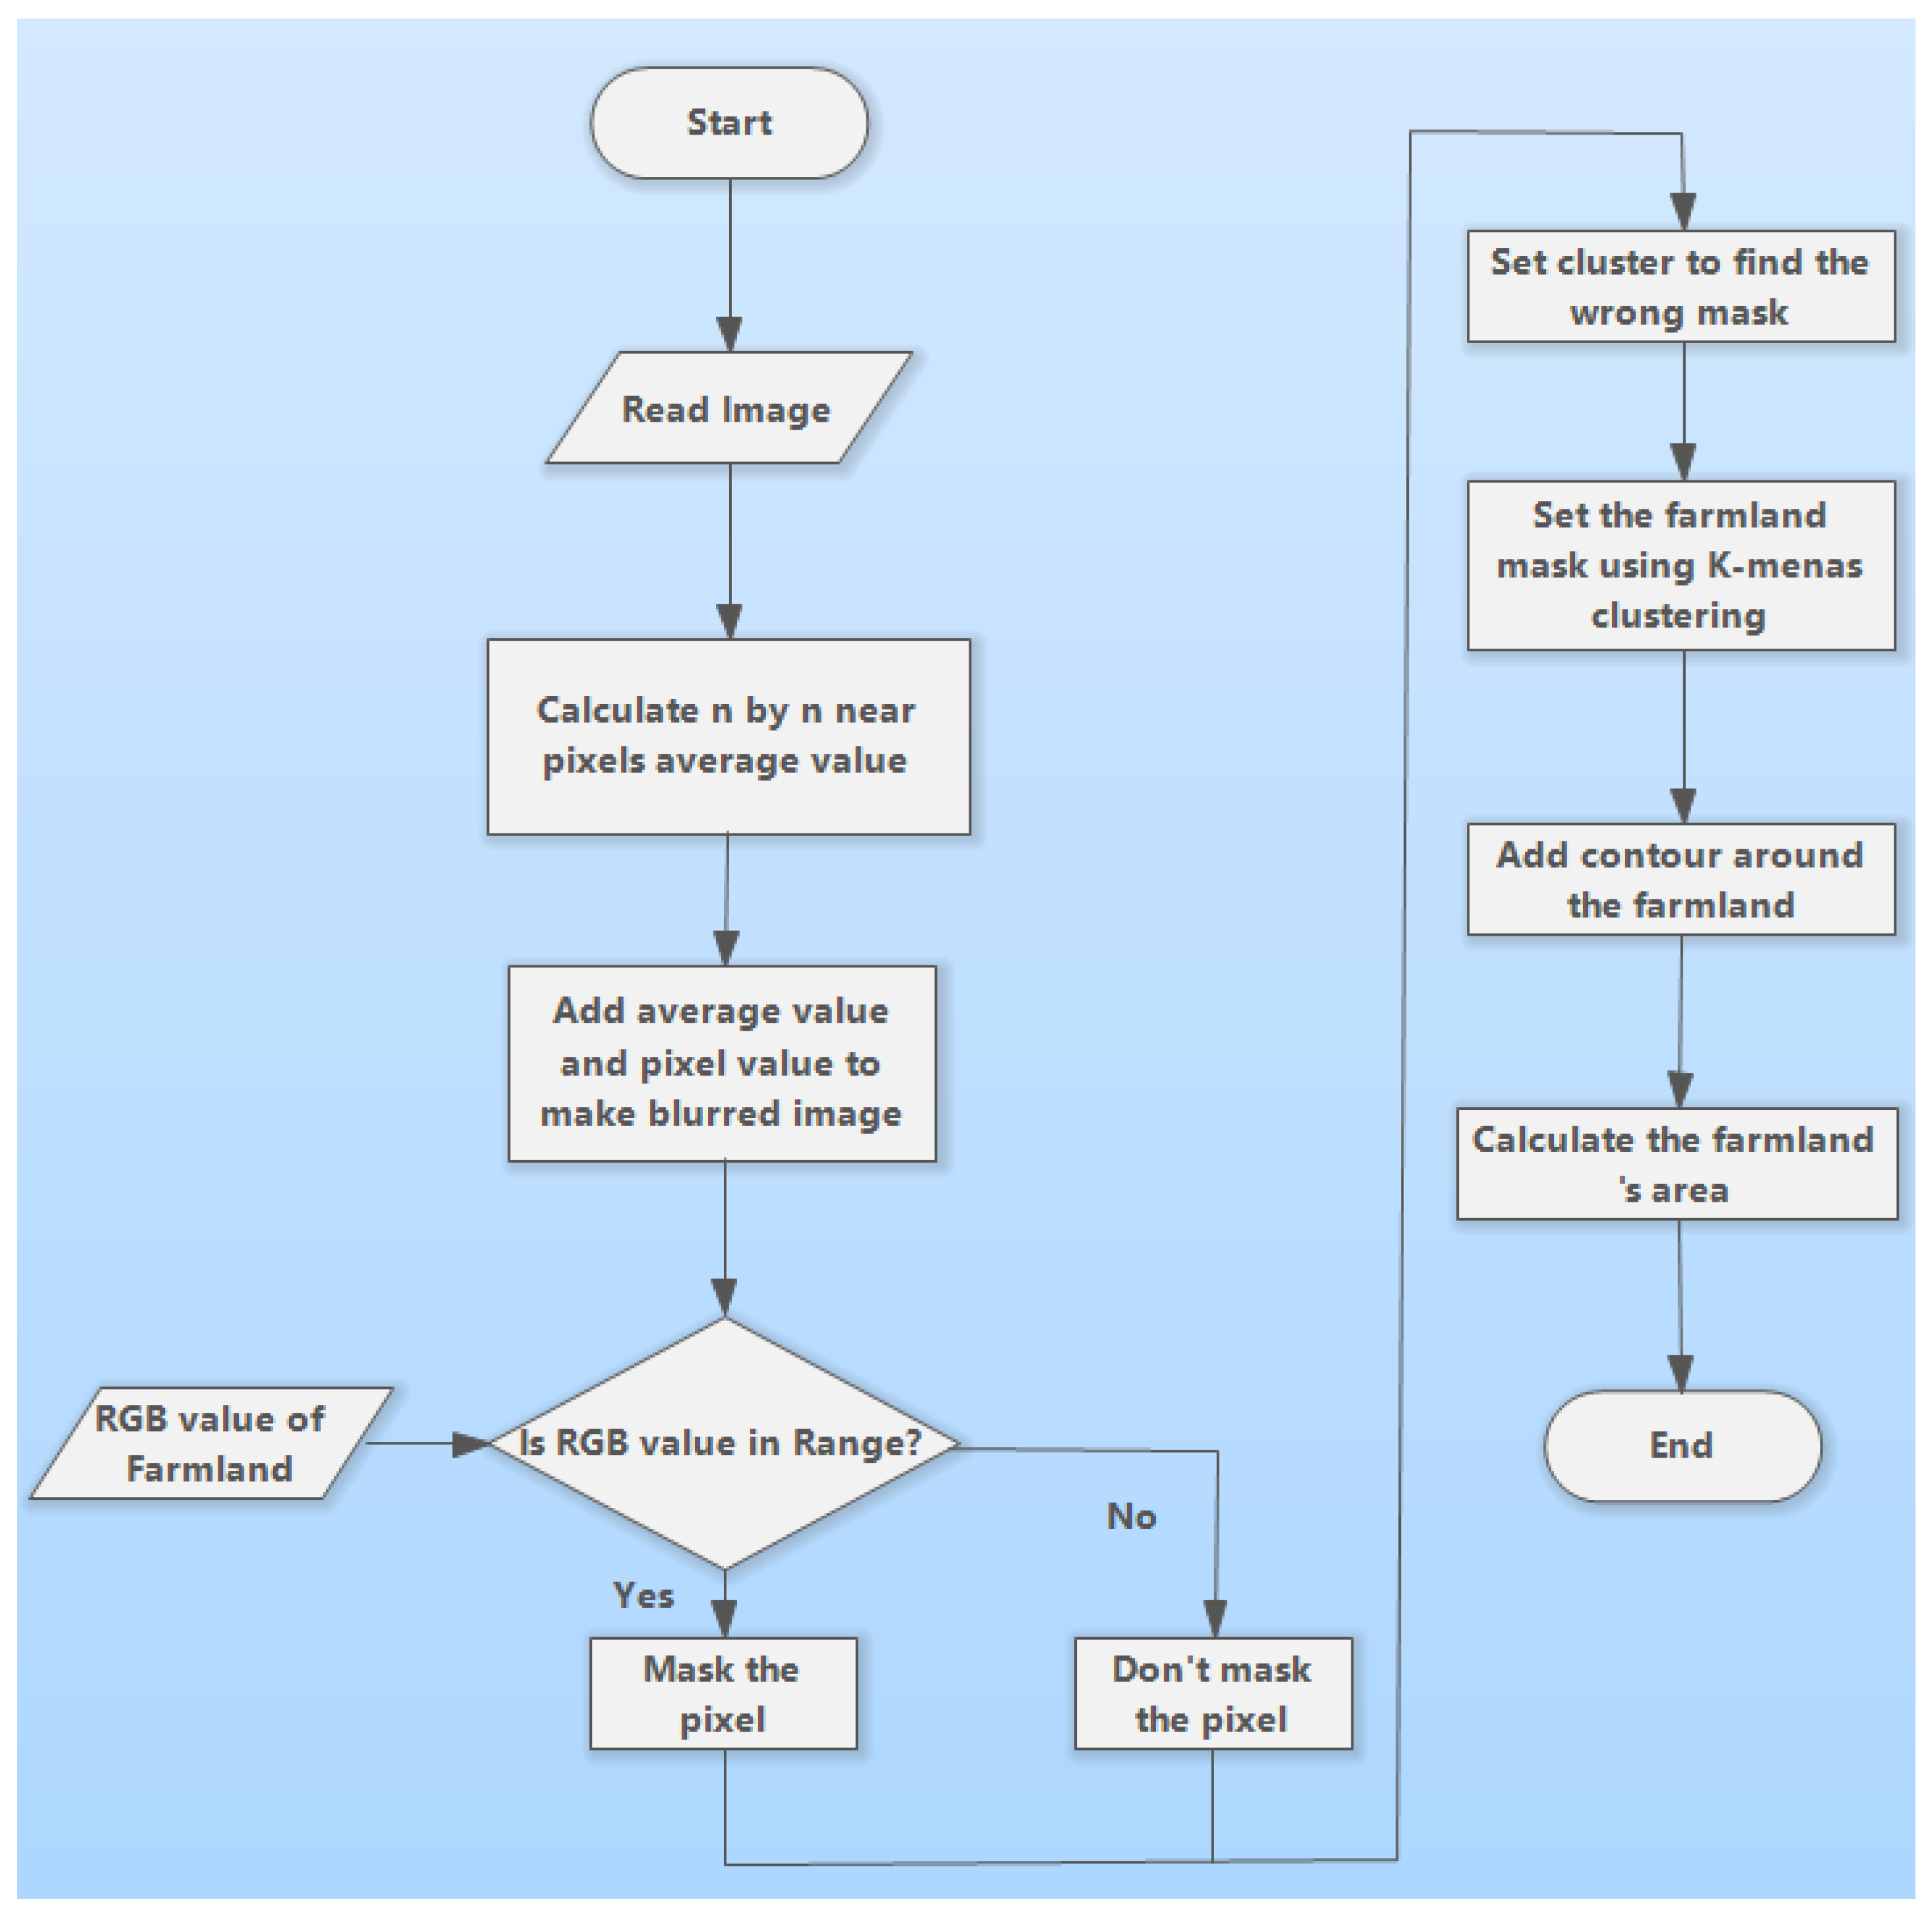
Once a user selects a location, the GIS data of the selected farmland is stored in smartphone applications, making it easy for users to obtain the data necessary to analyze the performance of the APV system at the candidate site. This study considers the portable platform because farmers and engineers in the field of agriculture mainly engage in outdoor activities; however, the devised software can be modified for other platforms (desktop or tablet environments). For this purpose, the farmland extraction algorithm detects the farmland from the selected image via K-Means clustering with low computational power demand [25]. Specifically, compressed satellite imagery using the Image-Blurring function is clustered through the K-Means clustering algorithm [26], and then, the farmland is extracted. Figure 4 reveals the flow chart of farmland detection using satellite imagery.
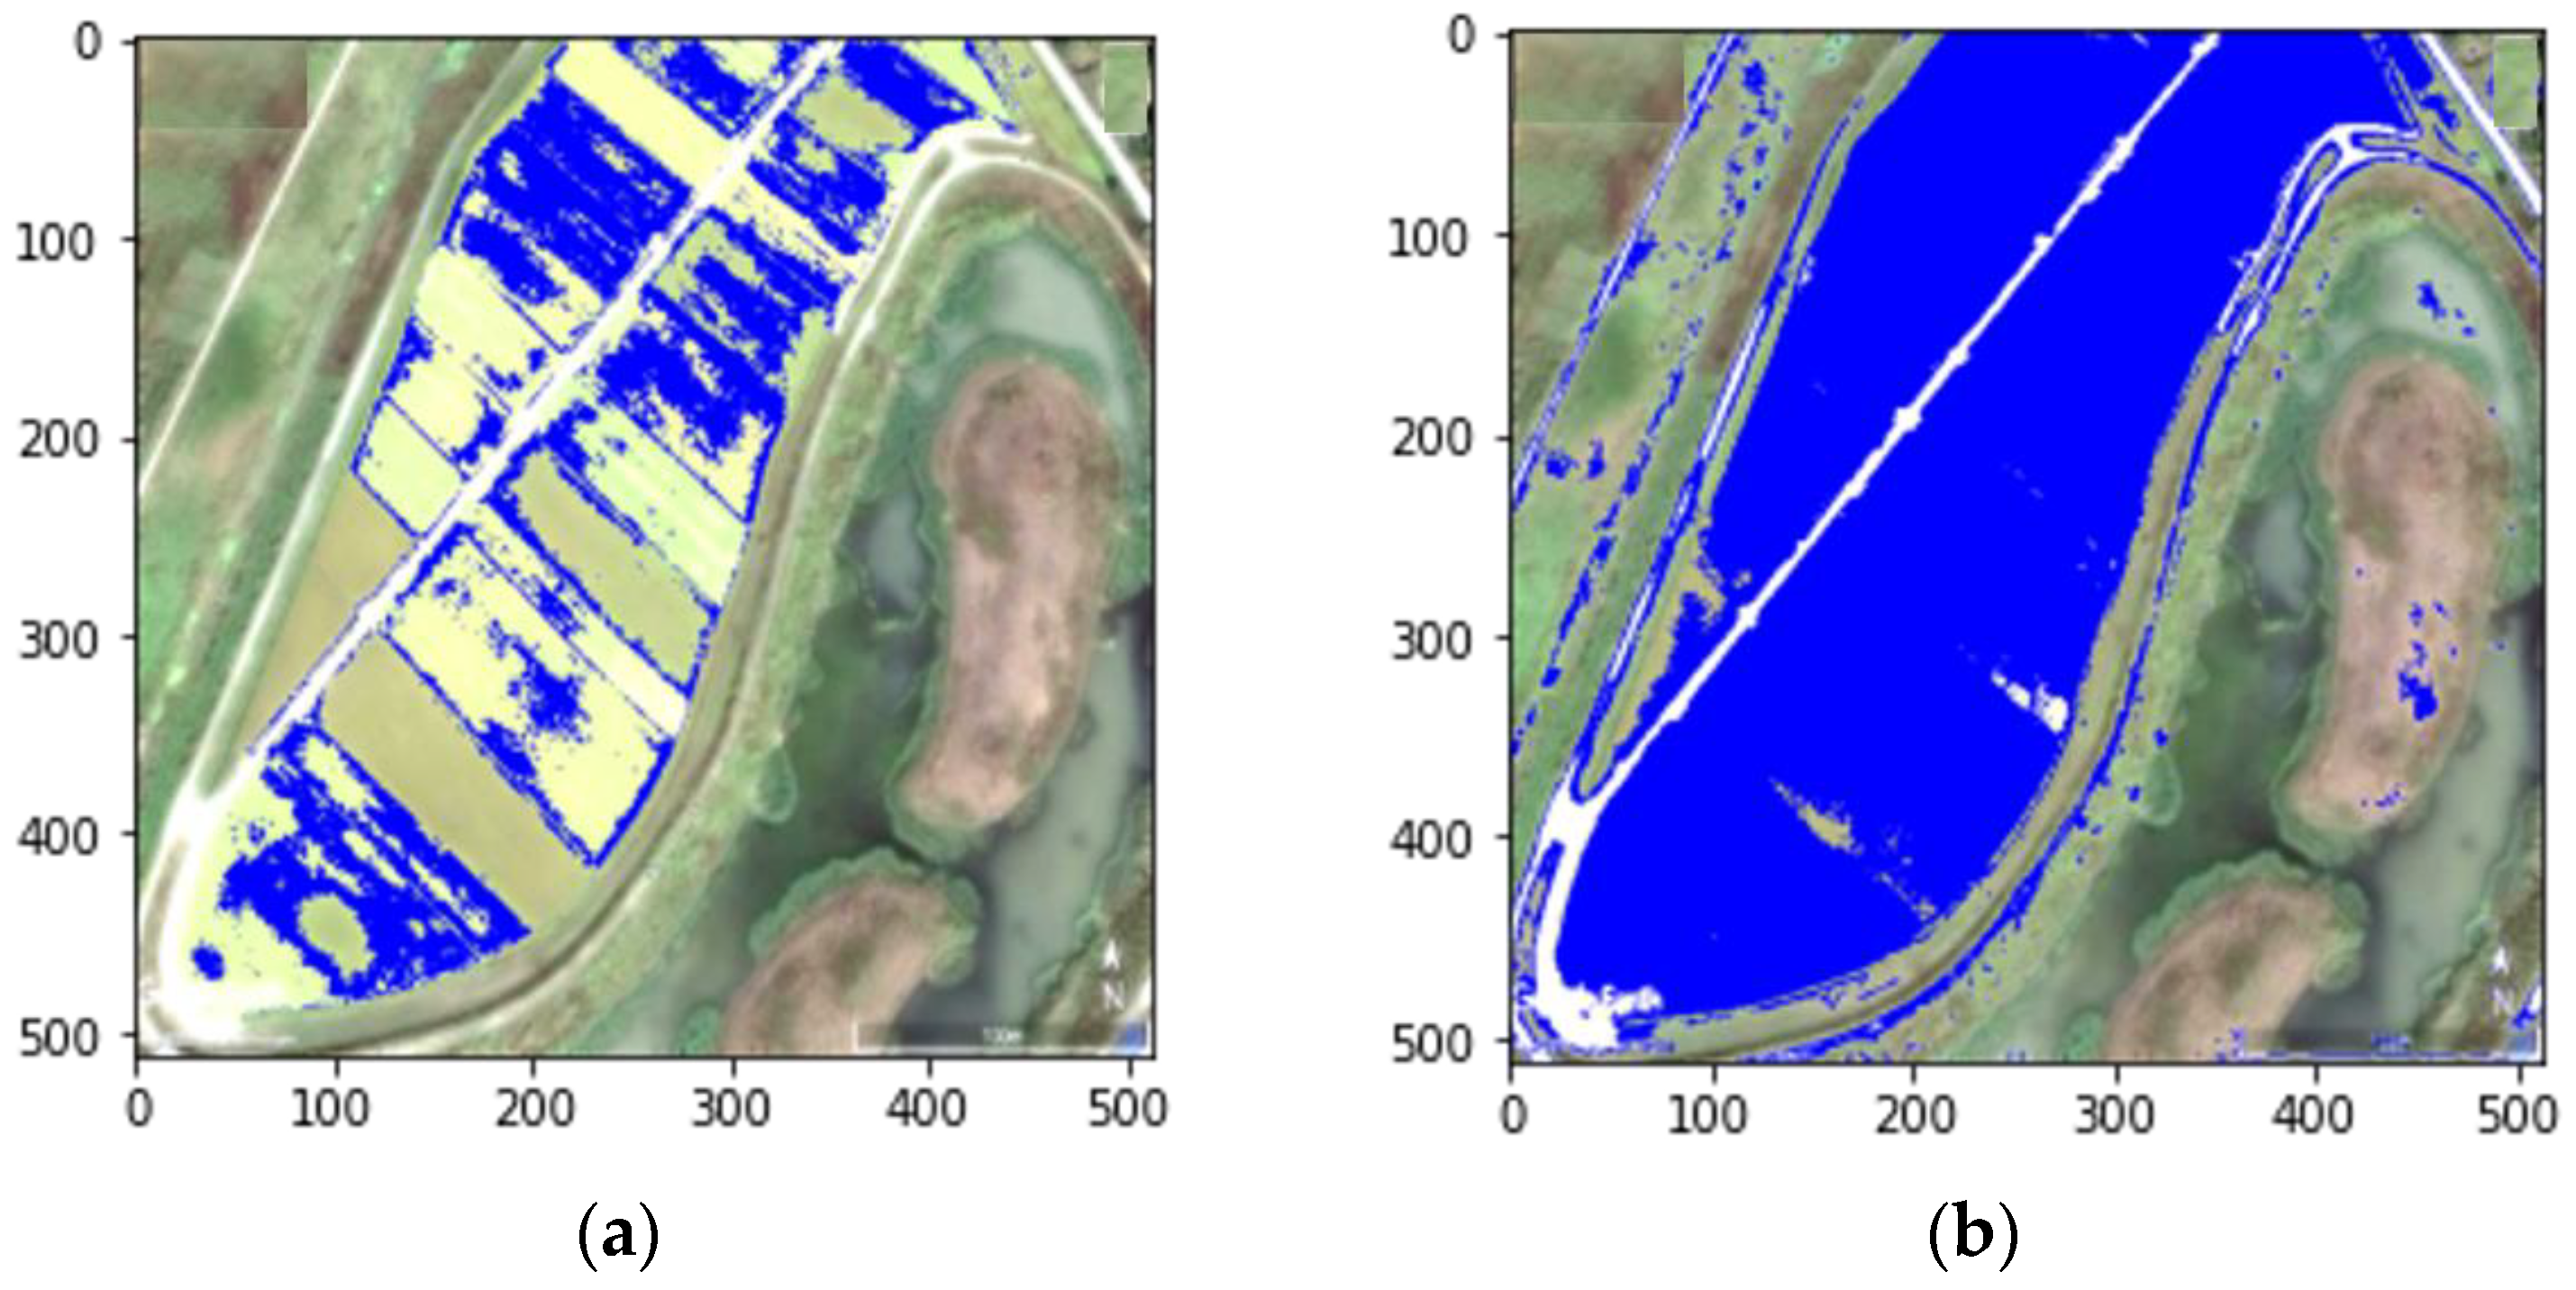
Figure 5 shows masked images of the subject farmland. The ranges of red, green, and blue (RGB) values in Figure 5a are 211–241 in red, 224–254 in green, and 158–188 in blue. Although the masking in Figure 5a only presents farmlands, not all farmlands in the subject area are masked. In Figure 5b, the masked area is identical to the whole farmland in the subject area, but some masks with blue color are presented out of the subject area. These noises are created because of the wide range. The ranges of RGB values in Figure 5b are 181–271 in red, 194–284 in green, and 128–218 in blue. To eliminate these noises, K-Means clustering is used (see Figure 6).
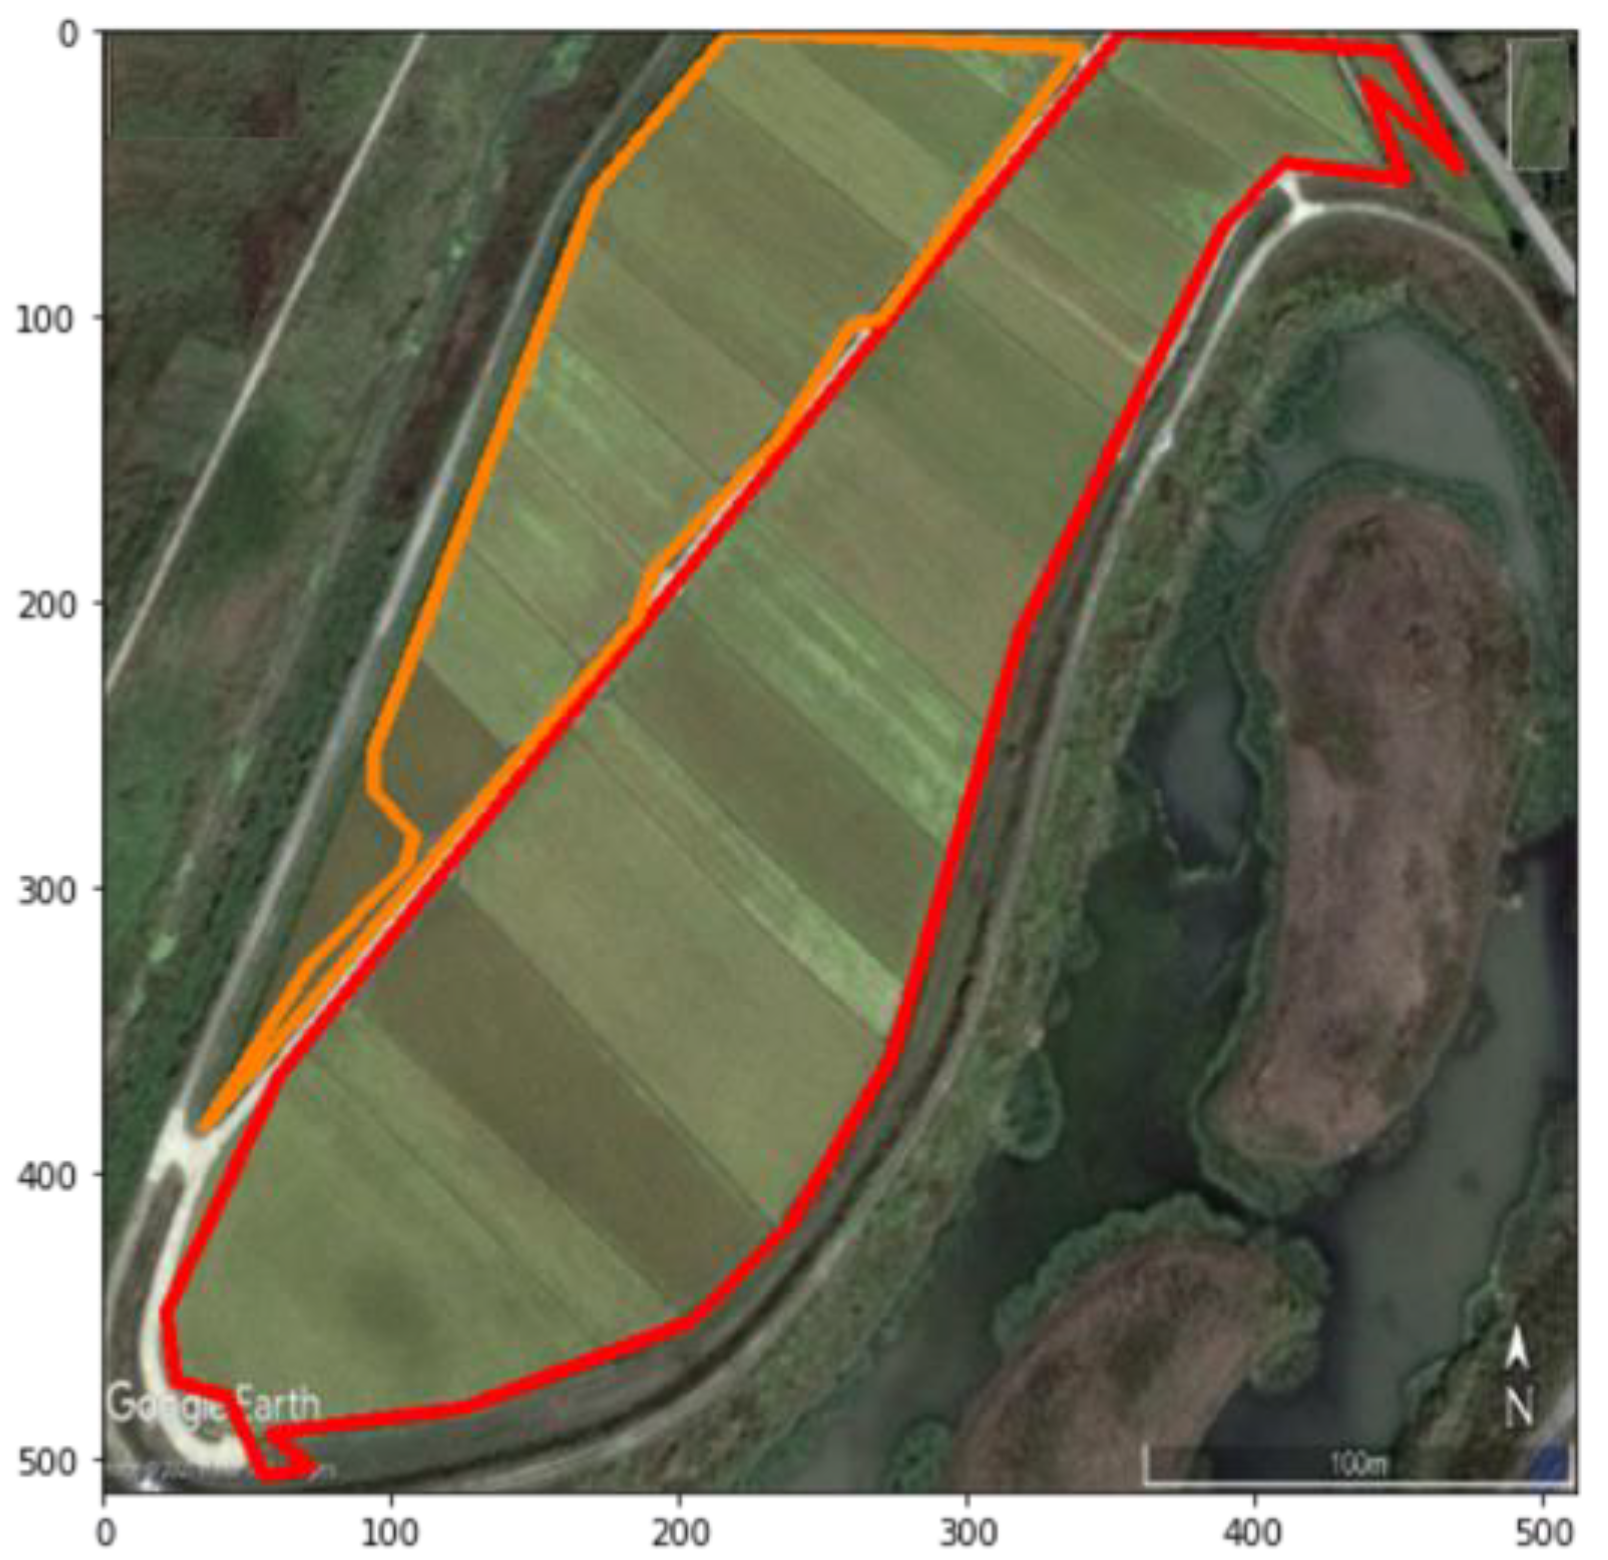
In Figure 6, two large clusters are selected. These clusters involve most of the farmland. The orange cluster’s area is 11,840 m2, and the red cluster’s area is 31,587 m2. The actual farmland area is 44,490 m2. The selected cluster covers 97.6% of the farmland. The farmland area can be utilized to estimate crop yields from the farm and calculate the capacity of the APV system.

3.2. Performance Estimation Module

The performance estimation module estimates the performance of the APV system at a selected candidate site in terms of the electricity generation amount and the crop yield. The estimated performance of each candidate site is utilized to develop the optimal design of the APV system’s supply chain network. To this end, a field experiment with the tested APV system was conducted in the summer period (June–August) [27]. Table 2 describes the data observed in the field study, which used a randomized complete block design (RCBD) with three replicates to plot the graphs. The area of the subplot was 8 × 10 m (80 m2), and the plant density was 9 plants/m2 [1]. The yields of corn at a 0% shading ratio, a 21.3% shading ratio, a 25.6% shading ratio, and 32.0% shading conditions amounted to 8.09 Mg/ha, 8.56 Mg/ha, 6.40 Mg/ha, and 5.63 Mg/ha, respectively [1]. Interestingly, 6% of the corn yield slightly increased under the 21.3% shading ratio. In fact, according to [28], the shadow generated by PV modules in farmland contributes to moisture preservation in the soil so that it can retain organic matter. Thus, this positive impact on soil moisture retention results in an increase in yield. Nevertheless, with shading above 25.6%, the corn yield is significantly reduced because of the low solar radiation affecting the photosynthesis activity of the corn.
Both the electricity generation model and the crop yield model are based on polynomial regression (PR), which enables the capture of the non-linear relationship between the variables [27]. Equations (1) and (2) represent the general PR model [1].
Y = g X 1 , , X n = β 0 + f 1 X 1 + + f n X n + ε ,   ε ~ N 0 , j = 1 n σ j 2
f j X j = β j 1 X j + β j 2 X j 2 + + β j L X j L ,   j = 1   ,   2 ,   ,   n
where f j X j is a polynomial function in X j , β 0 = j = 1 n β j 0 X j 0 , X j 0 = 1 , and j = 1 n β j 0 X j 0 = j = 1 8 β j 0 . β j is a coefficient of X j , and β 0 is a constant. β j represents the influence weight of X j on response variable Y. In this study, six microclimate variables in Table 3 and two decision variables ( X 1 is the shading ratio (0.0%, 21.3%, 25.6%, and 32.0%), and X 2 is the solar panel type (1: mono-facial and 2: bi-facial)) are considered. Equation (3) represents the developed electricity generation model in the APV system. The PR is calibrated with microclimate data (see Table 2) and electricity generation data from Jeollanamdo Agricultural Research and Extension Services in Republic of Korea (35.0161° N, 126.7108° E).
f R X 1 , X 2 = 812.25 + 184.68 A 1 + 9.91 A 2 + 6.01 A 3 0.29 A 3 2 0.65 A 4        + 1.64 × 10 3 A 4 2 2.10 A 5 + 7.14 × 10 5 A 5 3 + 0.10 A 6        + 2172.10 X 1 + 60.96 X 2
In order to verify the electricity generation model, the daily generated electricity data (test set) from 13 June 2020 to 20 October 2020 are compared with the electricity generation values estimated by Equation (3). Pearson’s correlation coefficient of determination (R2) of the electricity generation model is 95.89%. This means that the devised electricity generation model enables the accurate estimation of the electricity generation volume of the tested APV system.
As with the electricity generation model, Equation (4) refers to the crop yield model calibrated with the collected APV data (see Table 2).
g R X 1 = 8.1208 + 15.488 X 1 75.119 X 1 2
To validate Equation (4), the corn yield data (test set) from 13 June 2020 to 20 October 2020 are compared with the corn yield estimated by Equation (7). The R2 of the corn yield model is 86.03%, so we can conclude that the crop yield model accurately explains the variability present in the field study data.
Moreover, Equations (6) and (7) are used to compute the total profits (Equation (5)) from crop production and electricity generation of the APV system.
T o t a l   p r o f i t   P = f X 1 , X 2 + g X 1
f X 1 , X 2 = α f R X 1 , X 2 f C ( X 1 , X 2 )
g X 1 = β g R X 1 g C ( X 1 )
The nomenclature of the total profit model (Equations (5)–(7)) is illustrated in Table 4.
Equation (6) shows the profits from electricity generation, which are calculated by subtracting the solar panel installation costs and the operating costs from the revenue. Equation (7) represents the profit from crop production, which is calculated by subtracting the crop production costs from the revenue from crop production.

3.3. Location-Allocation Module

The location–allocation module evaluates the market distribution network and finds the optimal distribution plan with minimal transportation costs between farms and markets. Equation (8) refers to the optimization model.
M i n Z = i F j M D i j × C × f i j X i 1 , X i 2
subject to
j M f i j X i 1 , X i 2 f R X i 1 , X i 2   for   i F
i F f i j X i 1 , X i 2 γ j for   j M
where Z is the total transportation cost (USD) from selected farms to selected markets; F is a set of farms (candidate sites of APV systems); M is a set of markets; X i 1 is the shading ratio of the farm, i F (21.3%, 25.6%, and 32.0%); X j 1 is a solar panel type, j M (1: mono-facial and 2: bi-facial); D i j is the distance (km) between the farm, i F , and the market, j M ; C is the unit transportation cost (USD); f i j X i 1 , X i 2 is the delivery quantities of corn (Kg) between the farm, i F , and the market, j M ; and γ j is the total market demand, j (Kg). The devised non-linear optimization problem is solved by the generalized reduced gradient (GRG) method [29].

4. Experiments

4.1. Scenario

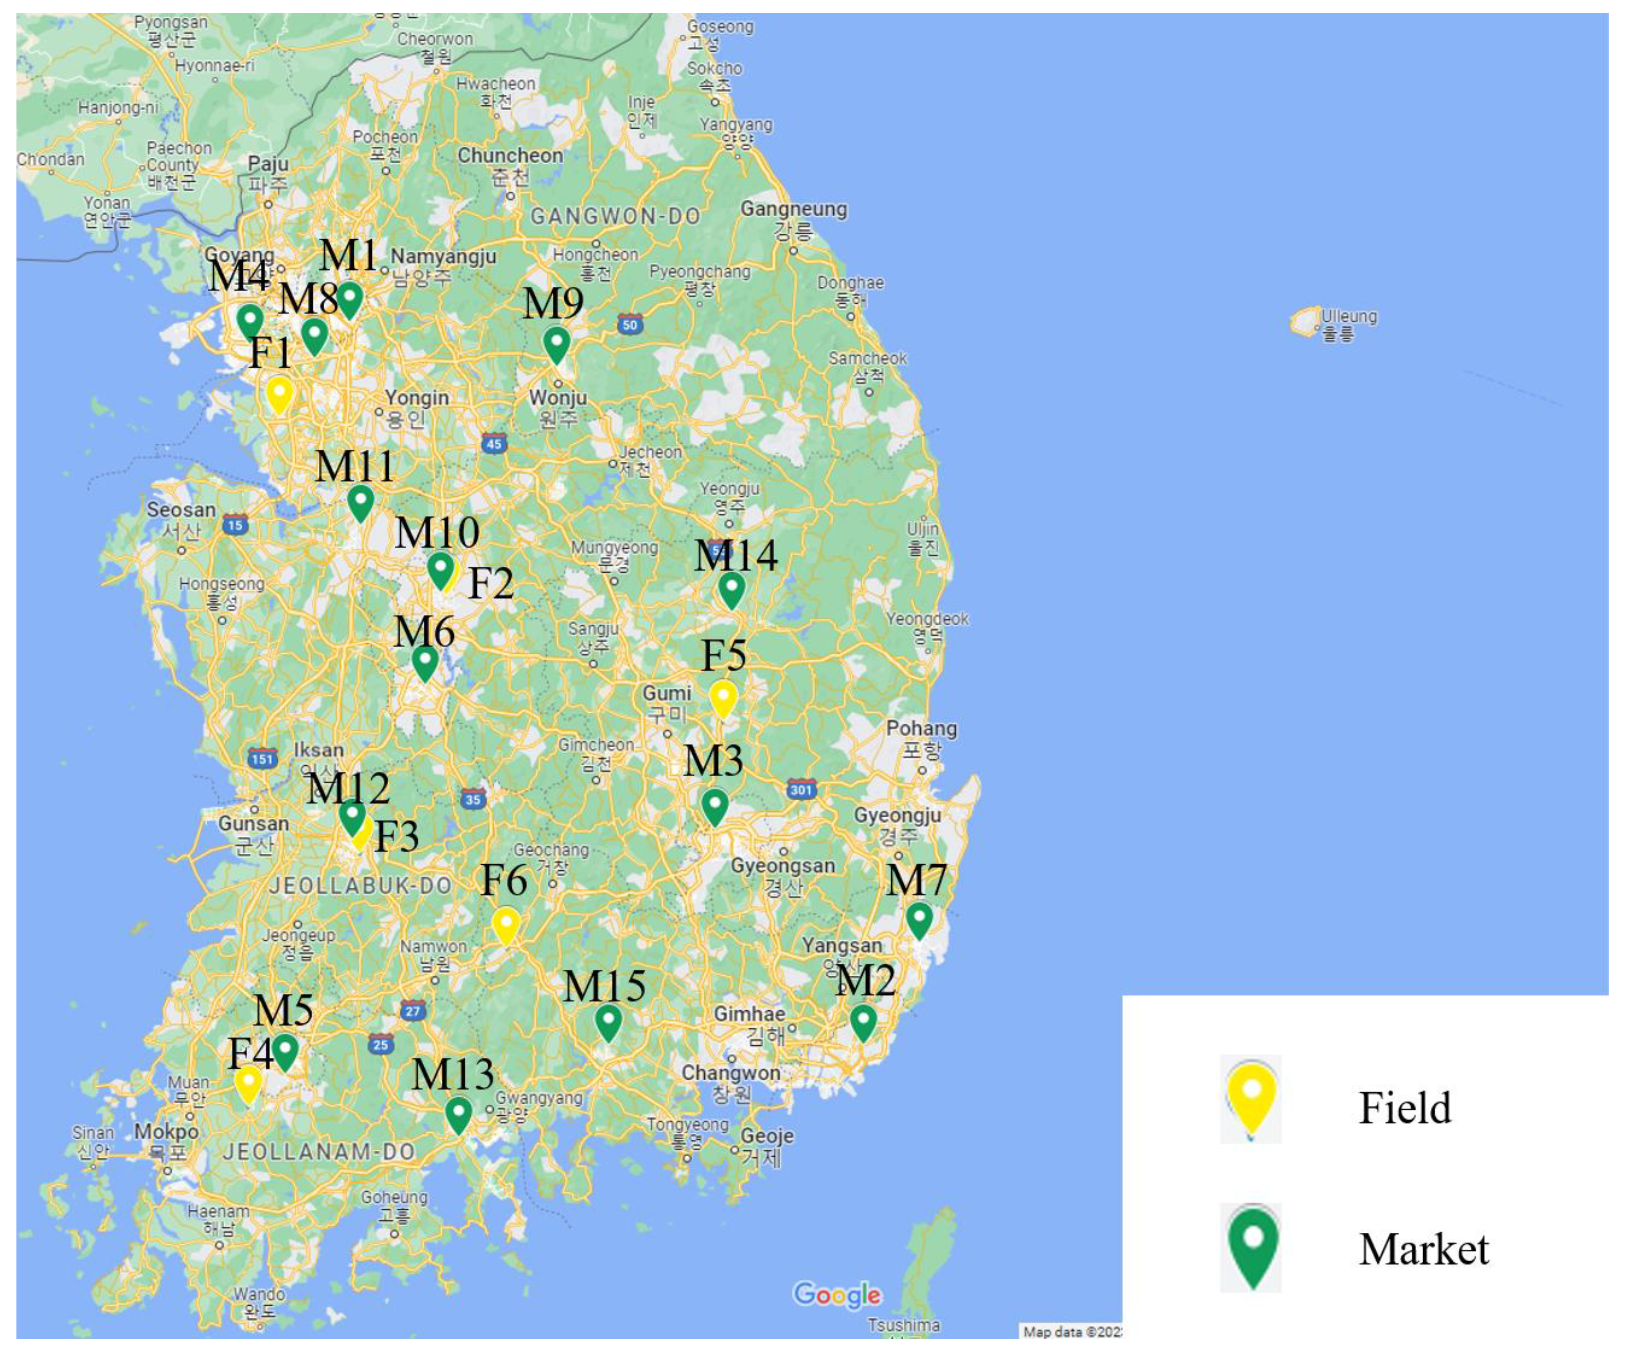
The proposed DSS system was applied to the corn supply chain network scenario shown in Figure 7. Six candidate APV sites and fifteen agricultural markets in Republic of Korea were considered in the scenario.
The selected candidate sites in Figure 7 and Table 5 were chosen because APV systems in Republic of Korea are currently operating at these sites [30]. The total capacity of these systems is 536 kW with an area of 9144 m2. Corn yields were estimated using Equation (4), and corn yields at candidate sites are 0.742 kg/m2 in F1, 0.742 kg/m2 in F2, 0.31 kg/m2 in F3, 0.642 kg/m2 in F4, 0.467 kg/m2 in F5, and 0.747 kg/m2 in F6 [31]. Table 5 summarizes the information about the candidate sites.
The summarized information on the fifteen markets is illustrated in Table 6. These markets are major agricultural markets near major cities in Republic of Korea. Jeju-do and Sejong-si are ignored in this study because the population of these places is less than one million. The corn demand ratio in each market is calculated from annual corn consumption data and population data, dividing each market’s demand by the total market demand [32,33]. As Gyeonggi-do is the largest population in Republic of Korea, it has the highest corn demand.
A distance matrix was configured for the candidate locations and markets that were provided. Table 7 describes the distance between the candidate sites (or APV farms) and markets. The distance between Cheongju market (M10) and Cheongju-si (F2) has the shortest distance at 4 km. On the other hand, the distance between Banyeo market (M2) and Hwaseong-si (F1) has the longest distance at 386 km. This is because Hwaseong-si (F1) is located in the northwestern region, and Banyeo market (M2) is located in the southeastern region of Republic of Korea. This implies that the Banyeo market (M2) tends to purchase corn from farms (Gunwi-gun (F5)) near its location to minimize transportation costs.

4.2. Results

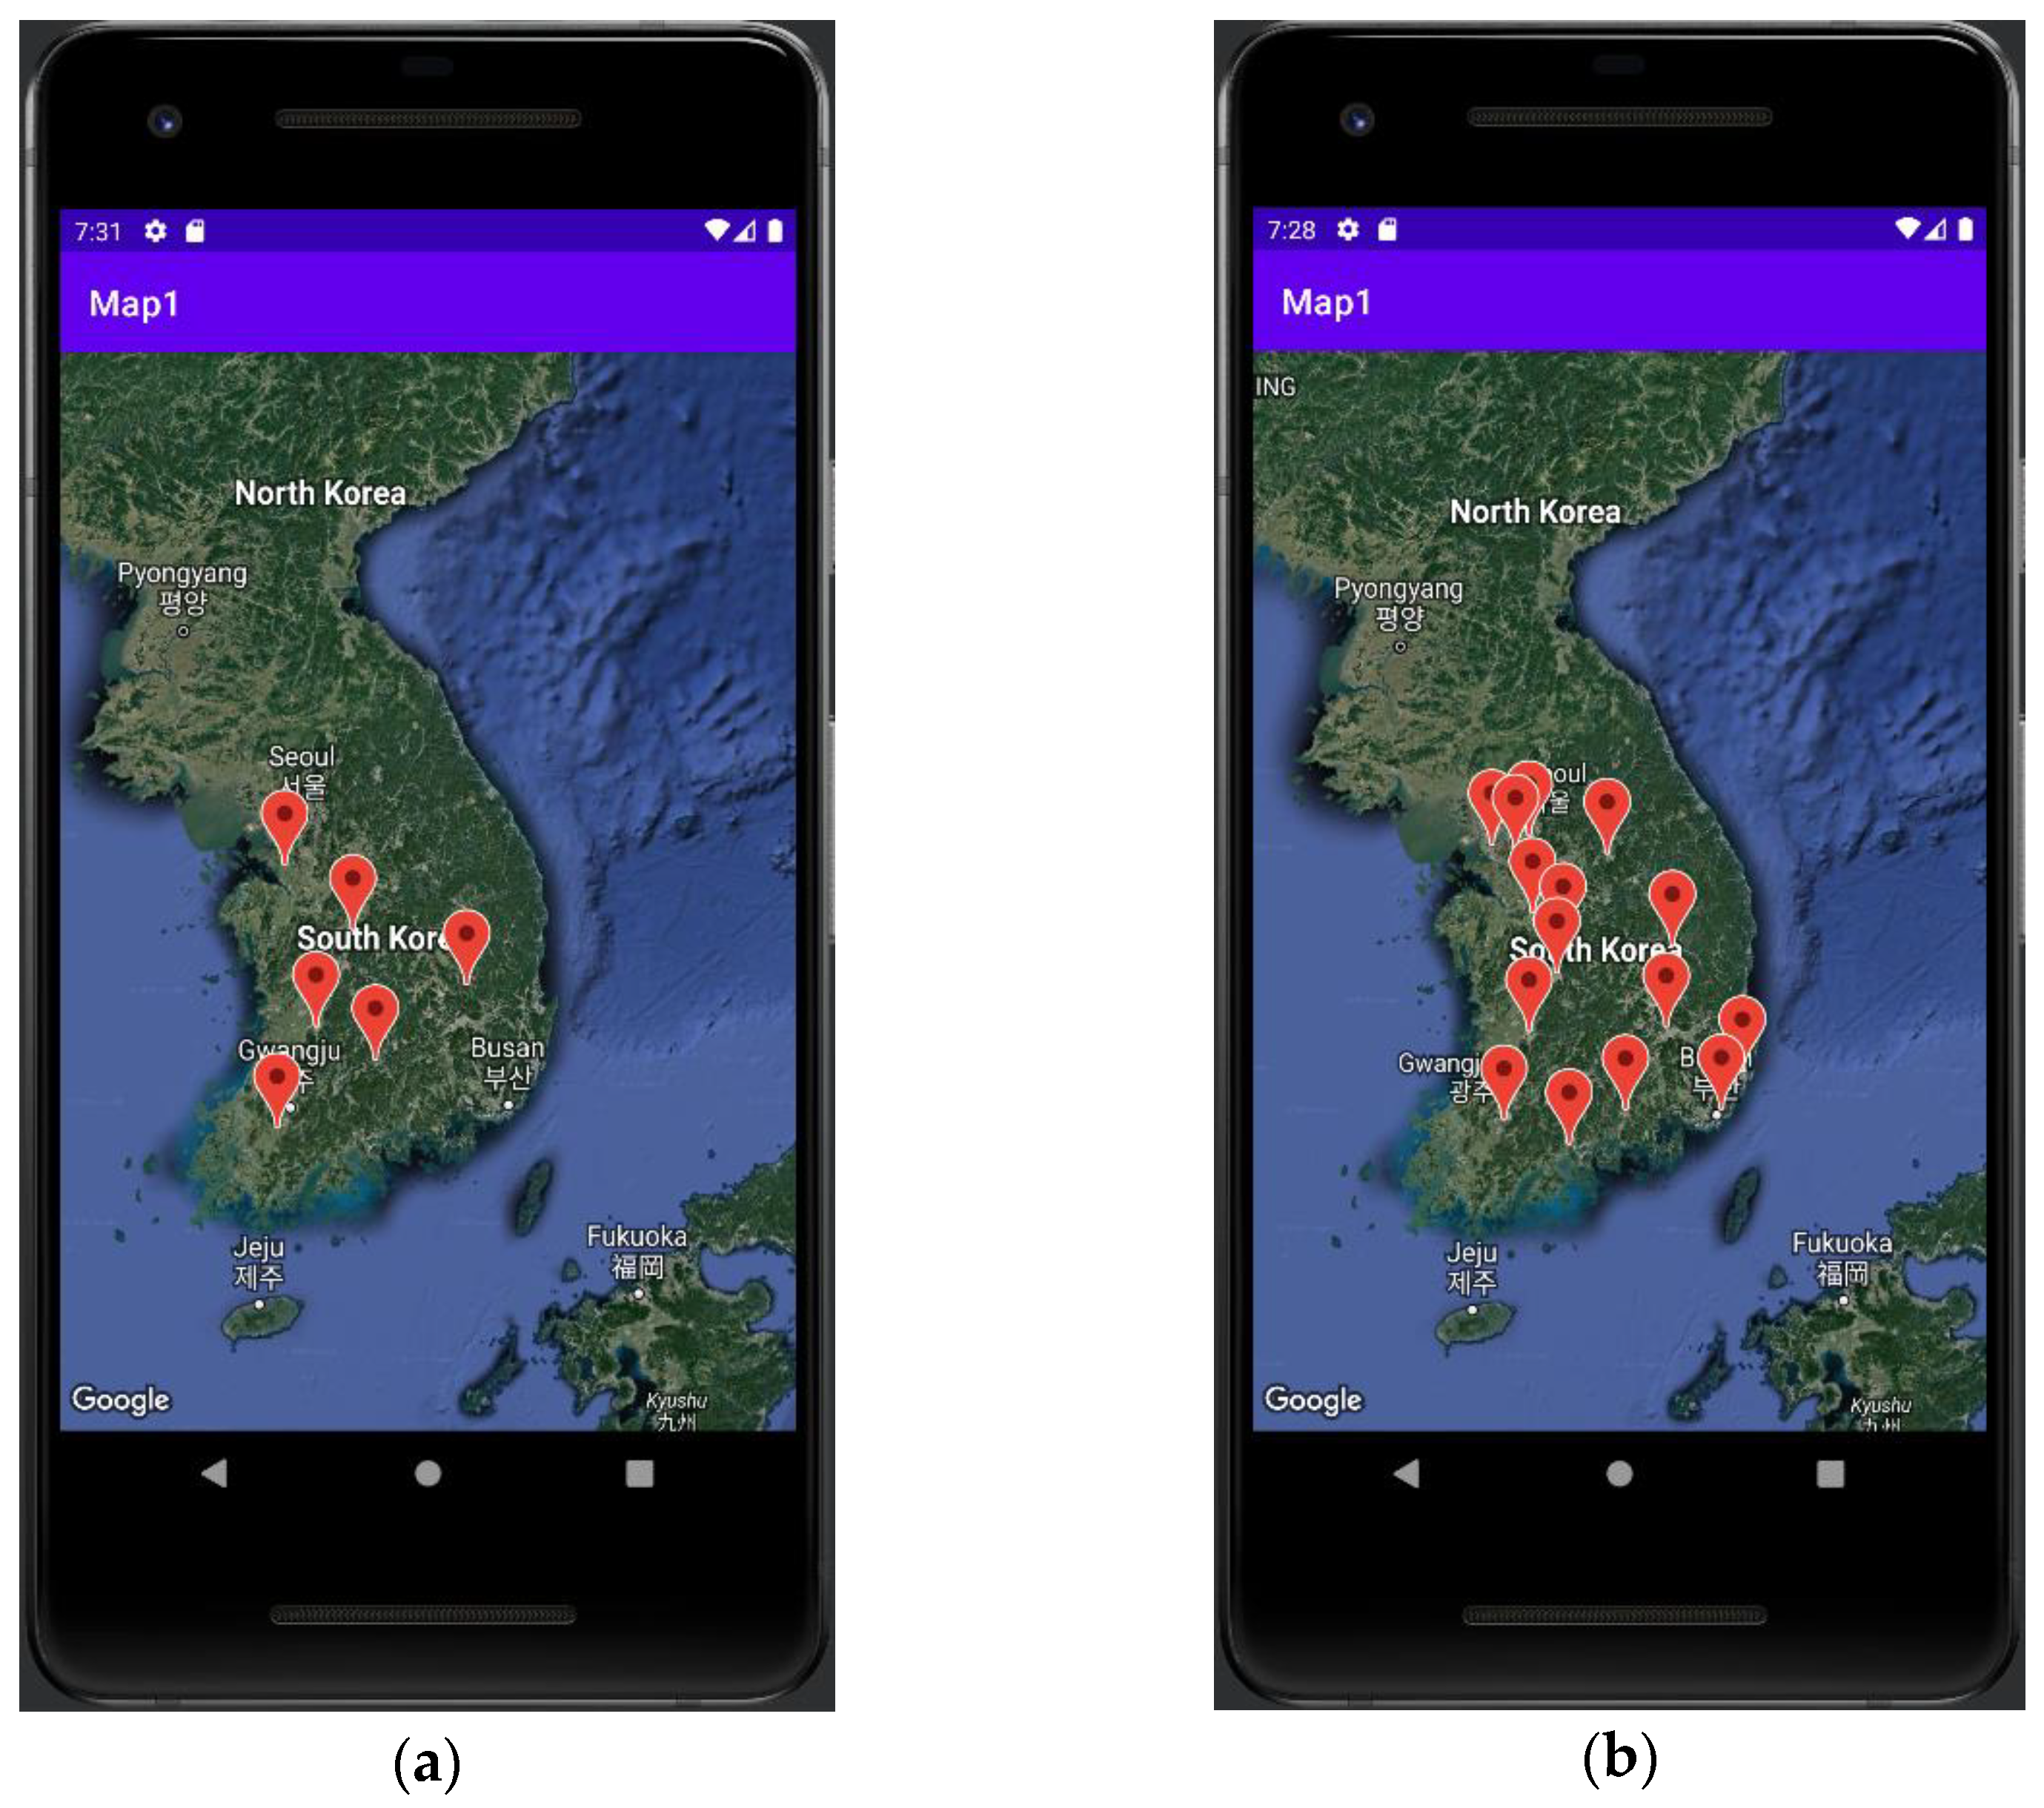
As described in Section 3.2, both PR models are used to determine the PV panel types and shading ratios of the six APV systems to maximize their productivity. Considering the data described in Table 5, Table 6 and Table 7, the performance of the APV systems at the six candidate sites is computed in terms of the electricity generation amount and crop productivity. Particularly, the proposed DSS selected the bi-facial APV option with a shading ratio of 25.6% as the best alternative for all six candidate sites. Figure 8 shows the APV candidate sites and major markets in Republic of Korea using the mobile DSS developed.
The devised non-linear optimization problem is solved with the generalized reduced gradient (GRG) method addressed in Section 3.3. Table 8 illustrates the result of the optimized transportation quantities between the markets and APV candidate sites shown in Figure 8. Particularly, the quantities of corn transported from the APV candidate sites to markets are described. Since the Gyeonggi-do market (M8) has the highest corn demand in Republic of Korea, its total transportation volume has the highest value at 1486.52 kg. On the other hand, Ulsan-si (M7) received the minimum amount of corn (121.99 kg) and only receives corn from Gunwi-gun (F5). In addition, because all fields have to meet the demand for corn in Republic of Korea, some markets cannot receive corn from the nearest fields. For example, Seoul-si (M1) cannot receive corn from Hwaseong-si (F1) because the two nearest markets (Gyeonggi-do and Incheon-si) consume all corn produced from Hwaseong-si (F1). This means that the productivity gains at the APV candidate site in Hwaseong-si (F1) enable lower transportation costs between Seoul-si (M1) and other APV candidate sites (F2, F4, and F6).
Table 9 illustrates revenue from six bi-facial APV systems with a 25.6% shading ratio. Data on the price of electricity sales in 2020 are used to calculate revenues [34]. The renewable energy credit (REC) is USD 0.11/kWh, and the system marginal price (SMP) is USD 0.07/kWh. In addition, the corn-selling price in 2020 was USD 2.74/kg [1]. In Table 9, the REC case tends to have higher revenue in electricity sales because its unit price includes both the SMP and the REC. For the SMP, approximately 81.11% of total revenues depend on corn production. For the REC, approximately 74.50% of the total revenue depends on corn production. In fact, because of the higher unit selling price of electricity, the impact of selling crops on total revenue is smaller than in the SMP case.
The total costs of the six APV candidate sites are illustrated in Table 10. The average electricity production cost of APV systems is 102.87 USD/month; the average corn production cost is 409.76 USD/month; and the average transportation cost is 204.13 USD/month. It should be noted that the unit transportation cost is 1.45 USD/km/ton [25]. Naju-si (F4) has the highest production costs because of its high transportation costs at 362.02 USD/month. In fact, Naju-si (F4) has the greatest average distance to markets (238.6 km) and is 28.76% longer than the average distance (185.31 km) from the candidate sites to the markets (see Table 7). As illustrated in Table 10, the total cost is significantly influenced by the transportation costs.
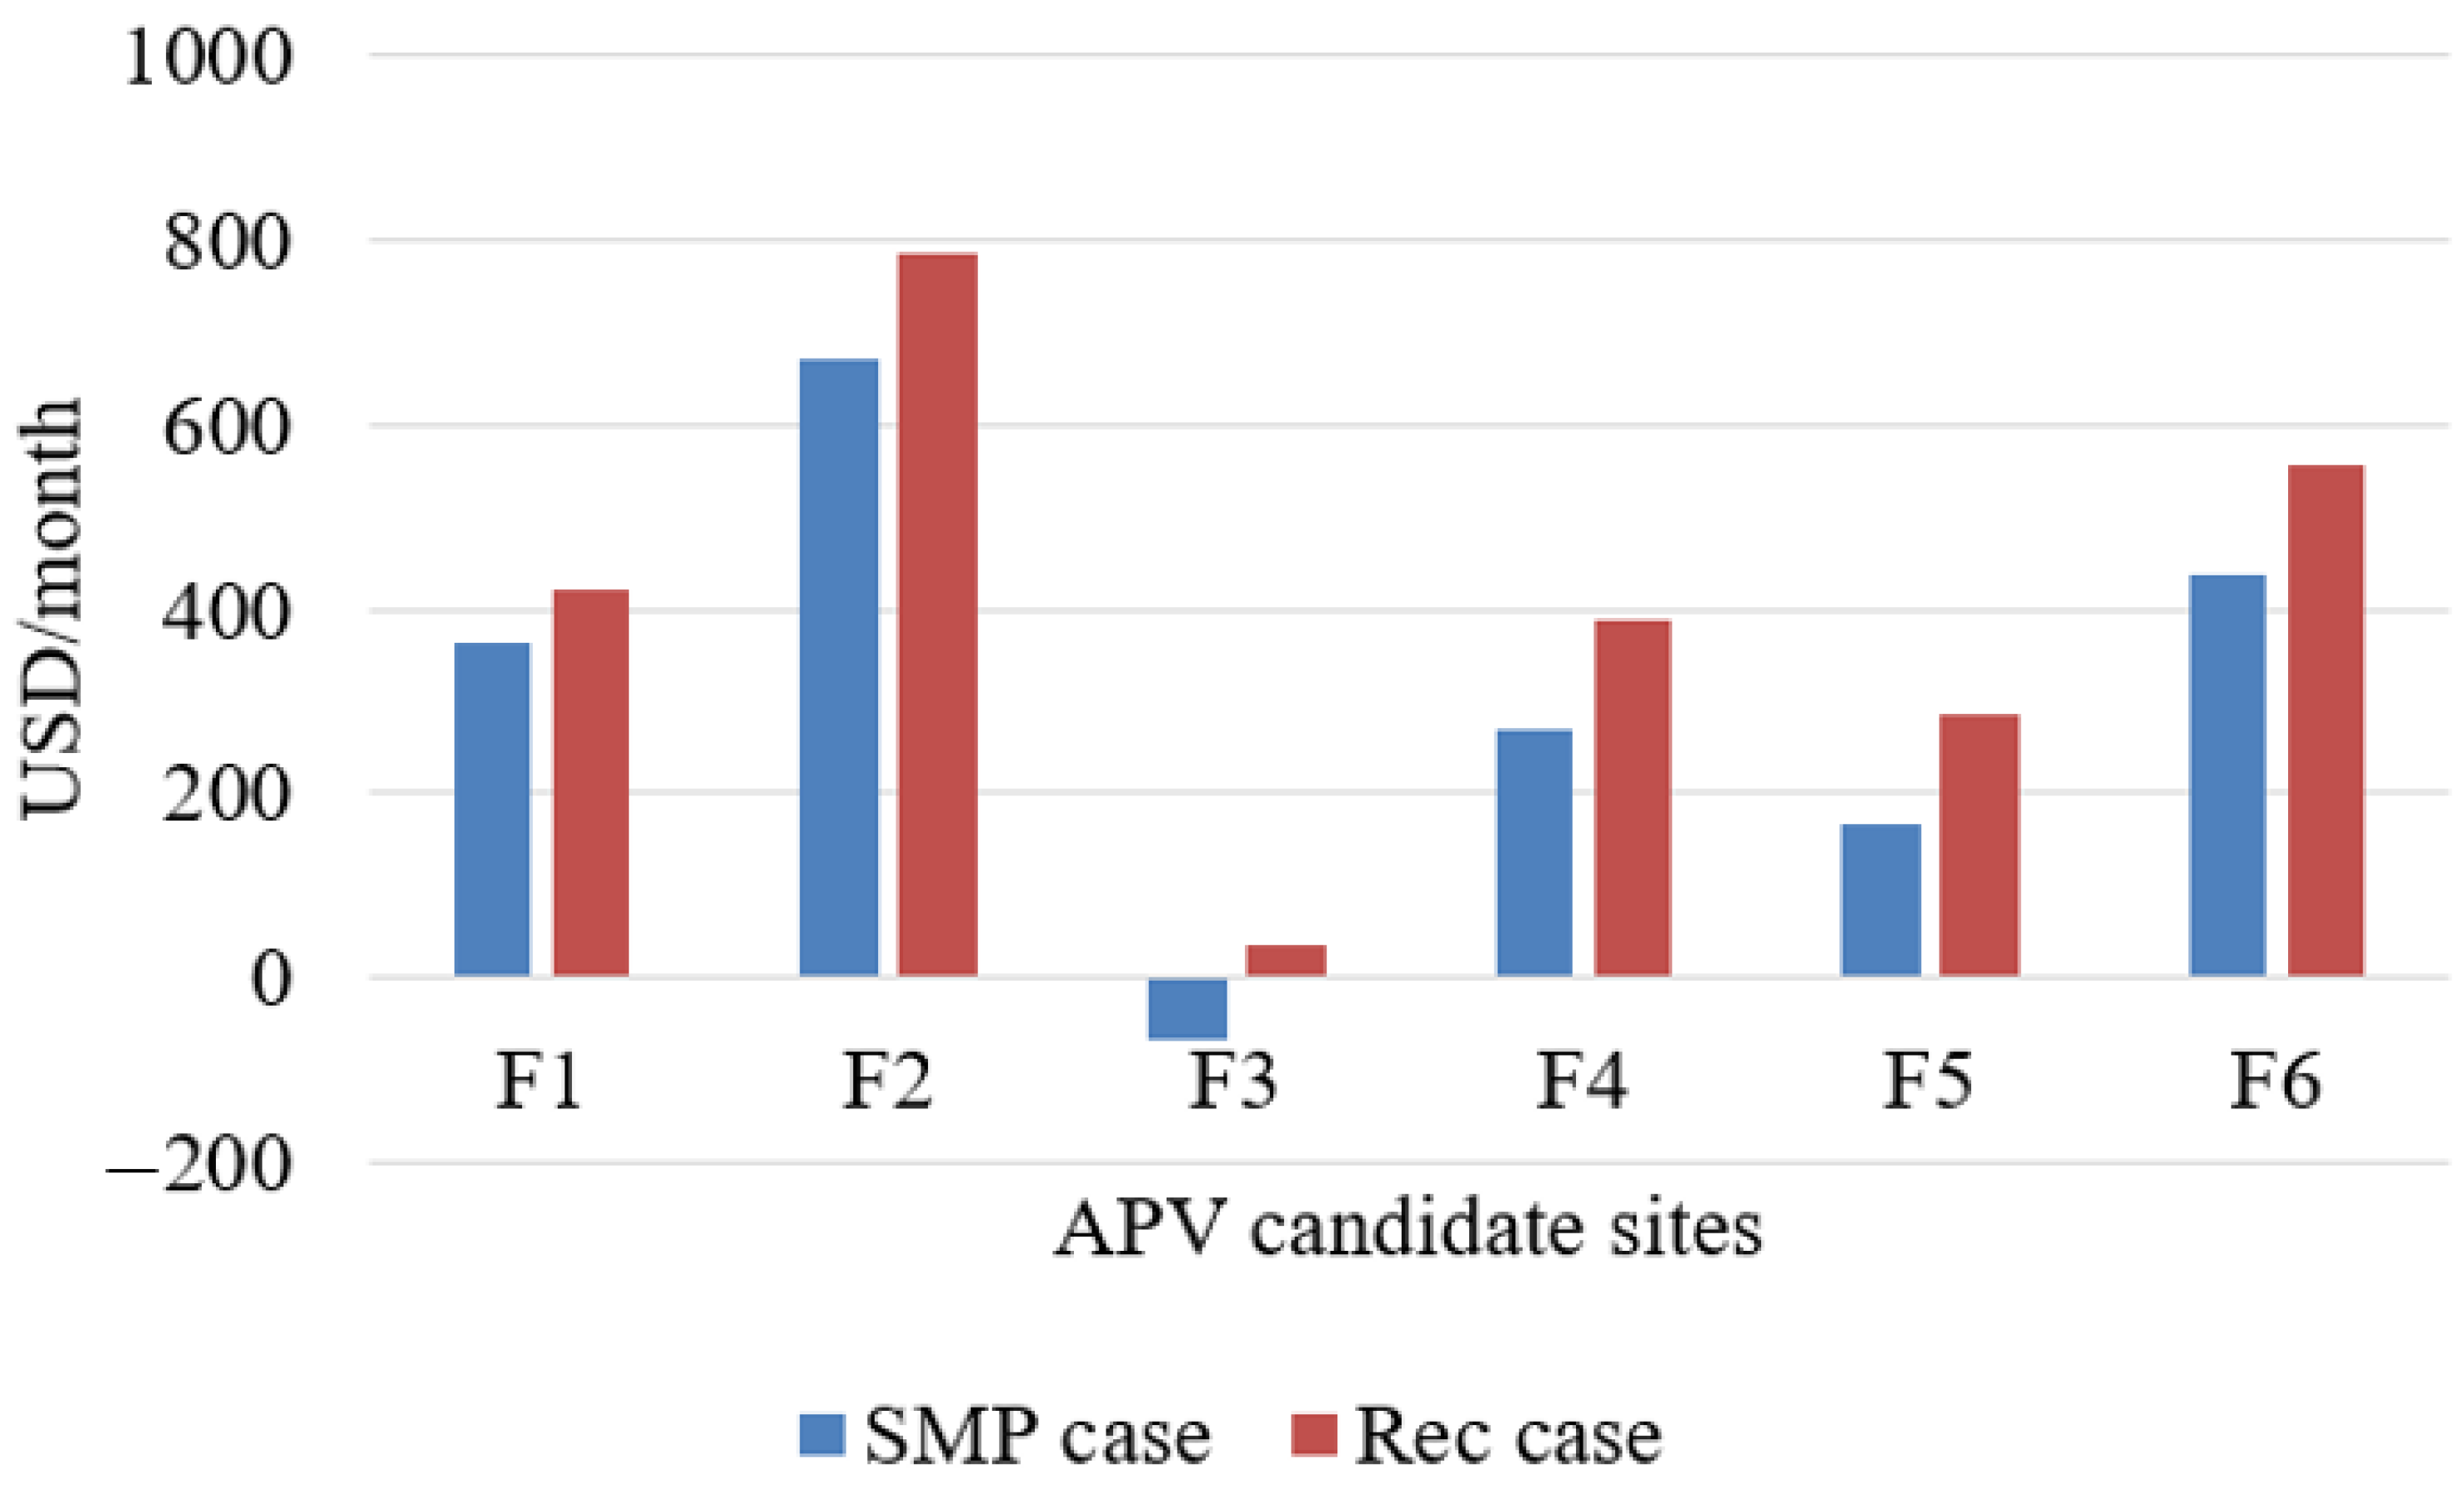
Figure 9 reveals the total profits of the six APV candidate sites estimated from Table 9 and Table 10. In general, the REC case has higher profits than the SMP case because of the higher-unit electricity sales price. The total gain for the REC case is an average of about 34.12% higher than for the SMP case. Cheongju-si (F2) has the highest profits among the candidate sites in terms of size because of its location in Republic of Korea. In fact, it is located in the center of Republic of Korea (see Figure 7), so it can deliver corn to multiple markets with low transportation costs. In both cases, it has higher profits than other candidate sites. On the other hand, Jeonju-si (F3) has negative profits in the SMP case. This is because it has the lowest corn production revenue, and its electricity generation unit price (system marginal price (SMP)) of USD 0.07/kWh is not high enough to make a positive profit. This implies that an appropriate REC policy should be considered in order to maintain a profitable APV system.

4.3. Discussion

The proposed system was utilized to develop a supply chain network for APV systems regarding their profits. Two photovoltaic (PV) module types (mono-facial and bi-facial) and three different shading ratios for APV systems (21.3%, 25.6%, and 32.0%) were considered design factors for APV systems. The experiment results showed that the bi-facial APV option with a shading ratio of 25.6% is the best alternative for all six candidate sites. This is because the electricity generation productivity of a bi-facial PV module is higher than that of a mono-facial PV module. Moreover, although there exists a positive correlation between electricity generation quantities and shading ratios, crop growth decreases as the shading ratio increases. This trend was also observed by other studies [35,36,37]. Particularly, Touil et al. [35] mentioned that a low shading ratio equal to or lower than 25% is recommended for crop harvesting because there is significant harvesting yield reduction with a shading ratio greater than 25%. Thus, those studies supported the experiment result wherein a bi-facial APV option with a shading ratio of 25.6% can produce electricity without significantly sacrificing the crop harvesting yield. Note that this study only considered three different shading ratios for APV systems (21.3%, 25.6%, and 32.0%).
Under the selected best design for an APV system, a supply chain network was developed. Although the candidate site of F6 had the highest yield, it was not selected as the best candidate site in terms of the total profits. Unlike the electricity sales profits, which were heavily dependent on a renewable energy pricing policy (SMP and REC), the crop sales profits were significantly dependent on the transportation cost between the APV systems and the agricultural markets. Regarding the distance to markets and the market demand for corn, the candidate site of F2 had the highest profit from corn sales under both the SMP and REC policies. In addition, the REC policy had a higher electricity sales price than that of the SMP policy [38,39]. Therefore, the F2 candidate site enabled the highest profits under the REC policy.

5. Conclusions

This study proposes a smartphone-based decision support system (DSS) to identify an optimal supply chain network for APV systems in terms of total operating costs. The major advantage of the proposed system is its practicality. Once the location of the APV system is determined, polynomial models integrated into the system estimate its corn (Zea mays) yield as well as the electricity generation amount. The proposed models are calibrated based on data collected from the APV system at Jeollanam-do Agricultural Research and Extension Services in Republic of Korea. The R2 values of the electricity estimation model and corn yield estimation models are 95.89% and 85.03%. This means that the proposed models make it possible to accurately capture variability in the collected data. In the experiments, a supply chain network consisting of 6 candidate APV systems and 15 agricultural markets is considered, and its optimal design in terms of total operating costs is identified using the generalized reduced gradient (GRG) method. The optimization includes decision variables such as two photovoltaic (PV) module types (mono-facial and bi-facial) and three different shading ratios for APV systems (21.3%, 25.6%, and 32.0%). The experiment shows that Cheongju-si (F2) in Republic of Korea is the best location with a profit of USD 786.6/m2/month under the REC policy. In fact, it is located in the center of Republic of Korea (see Figure 7), so it can deliver corn to multiple markets with a low transportation cost of USD 117.45/m2/month. The total profits of the six candidate APV systems are mainly influenced by the transportation cost to markets and the electricity pricing policies (SMP and REC). This implies that a proper decision should be made to make a profitable APV system. As a result, the proposed decision support system can help farmers and system engineers efficiently construct APV systems taking into account their financial benefits by minimizing the total operating cost of the supply chain network.
In future research, the proposed system will be applied to the supply chain design of APV systems with multiple crop types in a climate change environment. Particularly, an APV system with major crop types (rice, bean, barley) should be considered in order to accurately estimate the impact of APV systems on the existing agricultural supply chain network.

Author Contributions

Conceptualization, S.K. (Sojung Kim) and S.K. (Sumin Kim); methodology, S.K. (Sojung Kim), Y.K., Y.O. and J.S.; software, Y.K. and J.S.; validation, S.K. (Sojung Kim) and Y.K.; resources, S.K. (Sumin Kim); writing—original draft preparation, S.K. (Sojung Kim), Y.K., Y.O., J.S. and S.K. (Sumin Kim); writing—review and editing, S.K. (Sojung Kim) and S.K. (Sumin Kim); visualization, S.K. (Sumin Kim) and J.S.; project administration, S.K. (Sojung Kim) and S.K. (Sumin Kim); funding acquisition, S.K. (Sojung Kim). All authors have read and agreed to the published version of the manuscript.

Funding

This work was supported by the National Research Foundation of Korea (NRF) grant funded by the Korean government (MSIT) (No. 2021R1F1A1045855).

Institutional Review Board Statement

Not applicable.

Informed Consent Statement

Not applicable.

Data Availability Statement

Not applicable.

Conflicts of Interest

The authors declare that they have no conflict of interest.

References

  1. Kim, S.; Kim, S.; Yoon, C.Y. An efficient structure of an agrophotovoltaic system in a temperate climate region. Agronomy 2021, 11, 1584. [Google Scholar] [CrossRef]
  2. Kim, S.; Kim, Y.; On, Y.; So, J.; Yoon, C.Y.; Kim, S. Hybrid performance modeling of an agrophotovoltaic system in South Korea. Energies 2022, 15, 6512. [Google Scholar] [CrossRef]
  3. United Nations Climate Change Conference UK 2021. The Glasgow Climate Pact. Available online: https://ukcop26.org/the-glasgow-climate-pact/ (accessed on 26 February 2023).
  4. Ministry of Trade, Industry and Energy. The 3020 Renewable Energy Policy. Available online: https://www.etrans.or.kr/policy/04.php (accessed on 2 March 2023).
  5. Kim, T.H.; Chun, K.S.; Yang, S.R. Analyzing the Impact of Agrophotovoltaic Power Plants on the Amenity Value of Agricultural Landscape: The Case of the Republic of Korea. Sustainability 2021, 13, 11325. [Google Scholar] [CrossRef]
  6. Kuo, C.F.J.; Su, T.L.; Huang, C.Y.; Liu, H.C.; Barman, J.; Kar, I. Design and Development of a Symbiotic Agrivoltaic System for the Coexistence of Sustainable Solar Electricity Generation and Agriculture. Sustainability 2021, 15, 6011. [Google Scholar] [CrossRef]
  7. Korea Power Exchange. Production Cost of Electricity by Source. Available online: https://epsis.kpx.or.kr/epsisnew/selectEkmaUpsBftChart.do?menuId=040701 (accessed on 18 May 2023).
  8. International Renewable Energy Agency. Renewable Power Generation Costs in 2021. Available online: https://www.irena.org/publications/2022/Jul/Renewable-Power-Generation-Costs-in-2021 (accessed on 19 May 2023).
  9. Kim, S.; Kim, S. Optimization of the design of an agrophotovoltaic system in future climate conditions in South Korea. Renew. Energy 2022, 206, 928–938. [Google Scholar] [CrossRef]
  10. Kim, S.; Kim, S.; Kiniry, J.R. Two-phase simulation-based location-allocation optimization of biomass storage distribution. Simul. Model. Pract. Theory 2018, 86, 155–168. [Google Scholar] [CrossRef]
  11. Ahumada, O.; Villalobos, J.R. Application of planning models in the agri-food supply chain: A review. Eur. J. Oper. Res. 2009, 196, 1–20. [Google Scholar] [CrossRef]
  12. An, K.; Ouyang, Y. Robust grain supply chain design considering post-harvest loss and harvest timing equilibrium. Transp. Res. Part E Logist. Transp. Rev. 2016, 88, 110–128. [Google Scholar] [CrossRef]
  13. Canfora, I. Is the short food supply chain an efficient solution for sustainability in food market? Agric. Agric. Sci. Procedia 2016, 8, 402–407. [Google Scholar] [CrossRef]
  14. Kim, S.; Kim, S. Hybrid simulation framework for the production management of an ethanol biorefinery. Renew. Sustain. Energy Rev. 2022, 155, 111911. [Google Scholar] [CrossRef]
  15. Jackson, H.A.; Lessard, J.R. Effects of moisture content on corn silage density and storage losses in a large tower silo. Can. Agric. Eng. 1977, 19, 57–58. [Google Scholar]
  16. Kim, Y.; Kang, I.J.; Shin, D.B.; Roh, J.H.; Heu, S.; Shim, H.K. Survey of Fungal Infection and Fusarium Mycotoxins Contamination of Maize during Storage in Korea in 2015. Res. Plant Dis. 2017, 23, 278–282. [Google Scholar] [CrossRef]
  17. Goetzberger, A.; Zastrow, A. On the coexistence of solar-energy conversion and plant cultivation. Int. J. Sol. Energy 1982, 1, 55–69. [Google Scholar] [CrossRef]
  18. Huang, E.; Zhang, X.; Rodriguez, L.; Khanna, M.; de Jong, S.; Ting, K.C.; Ying, Y.B.; Lin, T. Multi-objective optimization for sustainable renewable jet fuel production: A case study of corn stover based supply chain system in Midwestern US. Renew. Sustain. Energy Rev. 2019, 115, 109403. [Google Scholar] [CrossRef]
  19. Bala, B.K.; Haque, M.A.; Hossain, M.A.; Majumdar, S. Post Harvest Loss and Technical Efficiency of Rice, Wheat and Maize Production System: Assessment and Measures for Strengthening Food Security; Bangladesh Agricultural University: Mymensingh, Bangladesh, 2020; Volume 6. [Google Scholar]
  20. Costa, S.J. Reducing Food Losses in Sub-Saharan Africa (Improving Post-Harvest Management and Storage Technologies of Smallholder Farmers); UN World Food Programme: Kampala, Uganda, 2014. [Google Scholar]
  21. Sharma, R.; Kamble, S.S.; Gunasekaran, A. Big GIS analytics framework for agriculture supply chains: A literature review identifying the current trends and future perspectives. Comput. Electron. Agric. 2018, 155, 103–120. [Google Scholar] [CrossRef]
  22. AbdelRahman, M.A.; Natarajan, A.; Hegde, R. Assessment of land suitability and capability by integrating remote sensing and GIS for agriculture in Chamarajanagar district, Karnataka, India. Egypt. J. Remote Sens. Space Sci. 2016, 19, 125–141. [Google Scholar] [CrossRef]
  23. Li, G.; Messina, J.P.; Peter, B.G.; Snapp, S.S. Mapping land suitability for agriculture in Malawi. Land Degrad. Dev. 2017, 28, 2001–2016. [Google Scholar] [CrossRef]
  24. Schmedtmann, J.; Campagnolo, M.L. Reliable crop identification with satellite imagery in the context of common agriculture policy subsidy control. Remote Sens. 2015, 7, 9325–9346. [Google Scholar] [CrossRef]
  25. An, K.; Kim, S.; Shin, S.; Min, H.; Kim, S. Optimized Supply Chain Management of Rice in South Korea: Location-Allocation Model of Rice Production. Agronomy 2021, 11, 270. [Google Scholar] [CrossRef]
  26. Moghimi, A.; Khazai, S.; Mohammadzadeh, A. An improved fast level set method initialized with a combination of k-means clustering and Otsu thresholding for unsupervised change detection from SAR images. Arab. J. Geosci. 2017, 10, 293. [Google Scholar] [CrossRef]
  27. Kim, S.; Kim, S. Performance Estimation Modeling via Machine Learning of an Agrophotovoltaic System in South Korea. Energies 2021, 14, 6724. [Google Scholar] [CrossRef]
  28. Hassanpour Adeh, E.; Selker, J.S.; Higgins, C.W. Remarkable agrivoltaic influence on soil moisture, micrometeorology and water-use efficiency. PLoS ONE 2018, 13, e0203256. [Google Scholar] [CrossRef] [PubMed]
  29. Lasdon, L.S.; Waren, A.D.; Jain, A.; Ratner, M. Design and testing of a generalized reduced gradient code for nonlinear programming. ACM Trans. Math. Softw. (TOMS) 1978, 4, 34–50. [Google Scholar] [CrossRef]
  30. Shin, D.W.; Lee, C.H.; Jung, Y.M.; Soon, B.M. Promoting Agricultural Photovoltaic: A Review of Applications, Challenges, and Opportunities. Korea Environment Institute. Available online: https://www.kei.re.kr/elibList.es?mid=a10101000000&elibName=researchreport&class_id=&act=view&c_id=736665 (accessed on 6 March 2023).
  31. Statistics Korea. Miscellaneous Grain Production. Available online: https://kosis.kr/statHtml/statHtml.do?orgId=101&tblId=DT_1ET0024&vw_cd=MT_ZTITLE&list_id=K1_19&seqNo=&lang_mode=ko&language=kor&obj_var_id=&itm_id=&conn_path=MT_ZTITLE (accessed on 6 March 2023).
  32. Statistics Korea. Per Capita Food Grain Consumption Per Year. Available online: https://kosis.kr/statHtml/statHtml.do?orgId=101&tblId=DT_1ET0024&vw_cd=MT_ETITLE&list_id=K1_19&scrId=&language=en&seqNo=&lang_mode=en&obj_var_id=&itm_id=&conn_path=MT_ETITLE&path=%252Feng%252FstatisticsList%252FstatisticsListIndex.do (accessed on 6 March 2023).
  33. Statistics Korea. Population, Households and Housing Units. Available online: https://https://kosis.kr/statHtml/statHtml.do?orgId=101&tblId=DT_1JC1501&conn_path=I2&language=en (accessed on 6 March 2023).
  34. Korea Power Exchange. A Price of the Renewable Energy Certificate. Available online: https://onerec.kmos.kr/portal/index.do (accessed on 6 March 2023).
  35. Touil, S.; Richa, A.; Fizir, M.; Bingwa, B. Shading effect of photovoltaic panels on horticulture crops production: A mini review. Rev. Environ. Sci. Bio/Technol. 2021, 20, 281–296. [Google Scholar] [CrossRef]
  36. Gonocruz, R.A.; Nakamura, R.; Yoshino, K.; Homma, M.; Doi, T.; Yoshida, Y.; Tani, A. Analysis of the rice yield under an Agrivoltaic system: A case study in Japan. Environments 2021, 8, 65. [Google Scholar] [CrossRef]
  37. Marrou, H.; Guilioni, L.; Dufour, L.; Dupraz, C.; Wery, J. Microclimate under agrivoltaic systems: Is crop growth rate affected in the partial shade of solar panels? Agric. For. Meteorol. 2013, 177, 117–132. [Google Scholar] [CrossRef]
  38. Kwon, T.H. Policy mix of renewable portfolio standards, feed-in tariffs, and auctions in South Korea: Are three better than one? Util. Policy 2020, 64, 101056. [Google Scholar] [CrossRef]
  39. An, J.; Kim, D.K.; Lee, J.; Joo, S.K. Least Squares Monte Carlo Simulation-Based Decision-Making Method for Photovoltaic Investment in Korea. Sustainability 2021, 13, 10613. [Google Scholar] [CrossRef]
Figure 1. Tested agrophotovoltaic system: (a) overview; (b) APV with different module types (bi- and mono-facial) and shading ratios (21.3%, 25.6%, and 32%).
Sustainability 15 08830 g001
Figure 2. The structure of the decision support system for the APV system.
Sustainability 15 08830 g002
Figure 3. An example of a mobile client module.
Sustainability 15 08830 g003
Figure 4. Flow chart of farmland detection using satellite imagery.
Sustainability 15 08830 g004
Figure 5. Farmland masked satellite imagery: (a) small range; (b) large range.
Sustainability 15 08830 g005
Figure 6. Clustered farmland satellite imagery.
Sustainability 15 08830 g006
Figure 7. Map image of the corn distribution network in Republic of Korea.
Sustainability 15 08830 g007
Figure 8. Mobile client: (a) APV candidate sites; (b) major markets in Republic of Korea.
Sustainability 15 08830 g008
Figure 9. Total profits of bi-facial APV systems with a 25.6% shading ratio.
Sustainability 15 08830 g009
Table 1. Investment costs of the tested APV system [2].
Data Type21.3%25.6%32%
Solar module cost (USD/m2)4.384.466.30
Structure cost (USD/m2)7.247.7210.43
Electric distribution system cost (USD/m2)3.453.684.97
Other costs (USD/m2) 10.250.270.36
Total cost (USD/m2)15.3216.3422.06
Number of PV modules per unit area (units/m2)0.0620.0660.089
1 The costs include the building permit fee and the fee for connection to the existing electric distribution system.
Table 2. Observed data (edited from Kim et al. [27]).
MonthSolar
Radiation (MJ/m2)
Ambient
Temperature
High (°C) 1
Ambient
Temperature
Low (°C) 2
Precipitation (mm)Humidity (%)Wind Speed (m/s)Electricity Generation (kWh/m2/day)
June3.7029.4019.4312.7276.932.0199.83
July2.7727.7120.9214.8084.671.9474.95
August3.6234.0524.2517.8373.362.4597.81
September3.0327.7416.747.1774.111.6781.73
October3.2724.688.730.3056.941.6788.37
1 The highest air temperature; 2 the lowest air temperature.
Table 3. Microclimate variables.
Variable SymbolVariable NameUnit
A 1 Daily solar radiationMJ/m2
A 2 Daily maximum temperature°C
A 3 Daily minimum temperature°C
A 4 Daily precipitationmm
A 5 Daily humidity%
A 6 Daily wind speedm/s
Table 4. Nomenclature of the total profit model.
SymbolVariable NameUnit
α Unit electricity priceUSD/kWh
β Unit crop priceUSD/kg
f R · Electricity generation quantitykWh
f C · Electricity generation costUSD
g R · Crop yieldkg
g C · Crop production costUSD
Table 5. Information about the selected candidate sites.
Selected APV Candidate SitesLocationCapacity (kW)Size (m2)Yield (kg)
F1Hwaseong-si50853633
F2Cheongju-si10017061266
F3Jeonju-si861467455
F4Naju-si10017061095
F5Gunwi-gun1001706797
F6Hamyang-gun10017061274
Table 6. Information on major agricultural markets.
MarketsLocationMarket NameCorn Demand Ratio (%)
M1Seoul-siGarak18.68
M2Busan-siBanyeo6.56
M3Daegu-siDaegu4.71
M4Incheon-siNamchon5.83
M5Gwangju-siSeobu2.91
M6Daejeon-siOhjung2.92
M7Ulsan-siUlsan2.21
M8Gyeonggi-doAnyang26.93
M9Gangwon-doWonju3.00
M10Chungcheongbuk-doCheongju3.20
M11Chungcheongnam-doCheonan4.29
M12Jeollabuk-doJeonju3.53
M13Jeollanam-doSuncheon3.51
M14Gyeongsangbuk-doAndong5.20
M15Gyeongsangnam-doJinju6.52
Table 7. Distance matrix between APV candidate sites and markets.
MarketsAPV Candidate Sites (km)
F1F2F3F4F5F6
M151126205308250267
M2386288261302161181
M327116318222942101
M433142217335272292
M528921510524251117
M61433689192162124
M7364266299336139214
M835113203306251267
M9122121238341168273
M101194124228148159
M116652130233181193
M12185122612222796
M13311240120111237114
M1423414424732247187
M1532022215619014766
Table 8. Transportation quantities from APV candidate sites to markets.
MarketsAPV Candidate Sites (kg)Total (kg)
F1F2F3F4F5F6
M10.0089.220.00588.600.00353.301031.12
M20.000.000.000.000.00362.10362.10
M30.000.000.000.00222.0837.90259.98
M4321.810.000.000.000.000.00321.81
M50.000.000.00160.630.000.00160.63
M60.000.000.000.000.00161.18161.18
M70.000.000.000.00121.990.00121.99
M8311.121000.0023.12152.280.000.001486.52
M90.000.000.000.00165.600.00165.60
M100.00176.640.000.000.000.00176.64
M110.000.00236.800.000.000.00236.80
M120.000.00194.850.000.000.00194.85
M130.000.000.00193.750.000.00193.75
M140.000.000.000.00287.030.00287.03
M150.000.000.000.000.00359.90359.90
Total632.931265.86454.771095.26796.701274.385519.90
Table 9. Revenue from bi-facial APV systems with a shading ratio of 25.6%.
APV Candidate SitesLocationSMP CaseREC Case 1
Total Revenue (USD/Month)Revenue from Electricity Generation (USD/Month)Revenue from Corn Production (USD/Month)Total Revenue (USD/Month)Revenue from Electricity Generation (USD/Month)Revenue from Corn Production (USD/Month)
F1Hwaseong-si680.52102.45578.07739.06160.99578.07
F2Cheongju-si1361.04204.901156.141478.12321.981156.14
F3Jeonju-si591.55176.19415.36692.23276.87415.36
F4Naju-si1205.23204.901000.331322.31321.981000.33
F5Gunwi-gun932.55204.90727.651049.63321.98727.65
F6Hamyang-gun1368.84204.901163.941485.92321.981163.94
1 This includes the renewable energy credit (REC) and the system marginal price (SMP).
Table 10. Total costs of bi-facial APV systems with a shading ratio of 25.6%.
APV Candidate SitesLocationElectricity Production Cost (USD/Month)Corn Production Cost (USD/Month)Transportation Cost (USD/Month)Total Cost (USD/Month)
F1Hwaseong-si57.58228.3932.87318.83
F2Cheongju-si115.16458.91117.45691.52
F3Jeonju-si99.02394.62163.85657.50
F4Naju-si115.16458.91362.02936.09
F5Gunwi-gun115.16458.91191.40765.47
F6Hamyang-gun115.16458.91357.18931.25
Disclaimer/Publisher’s Note: The statements, opinions and data contained in all publications are solely those of the individual author(s) and contributor(s) and not of MDPI and/or the editor(s). MDPI and/or the editor(s) disclaim responsibility for any injury to people or property resulting from any ideas, methods, instructions or products referred to in the content.