Economic and Technological Efficiency of Renewable Energy Technologies Implementation
Abstract
1. Introduction
2. Literature Review
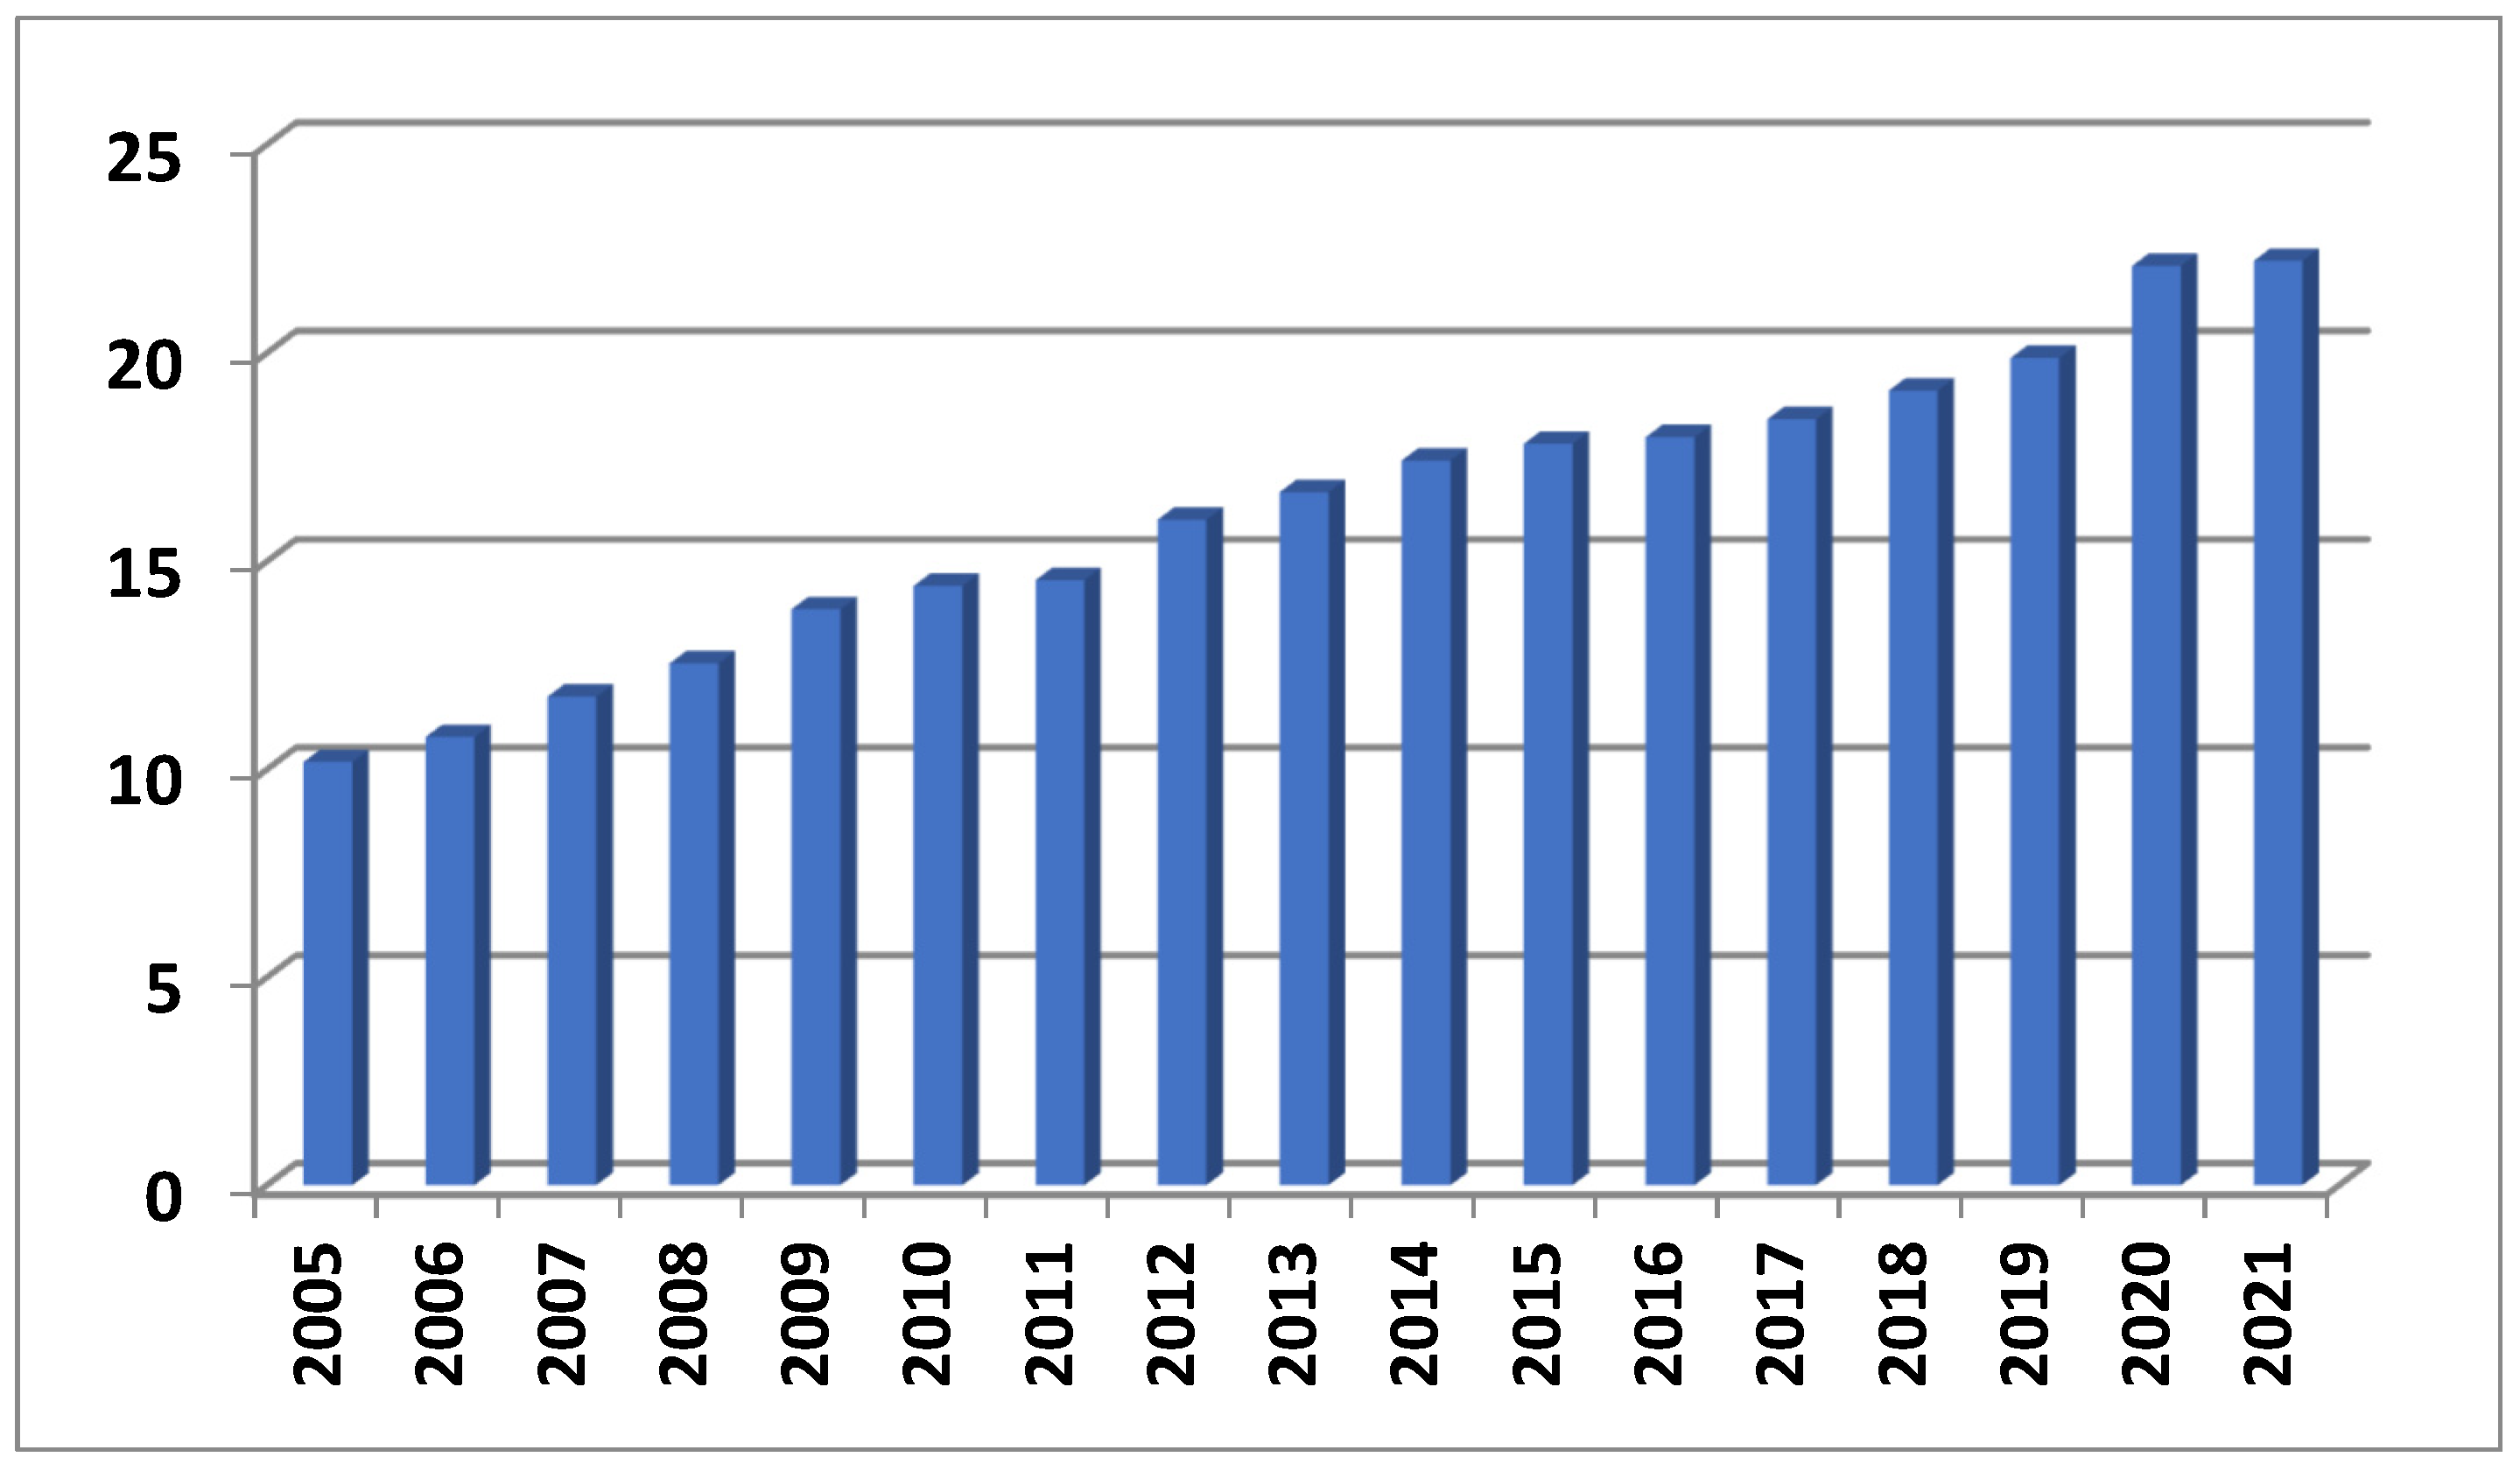
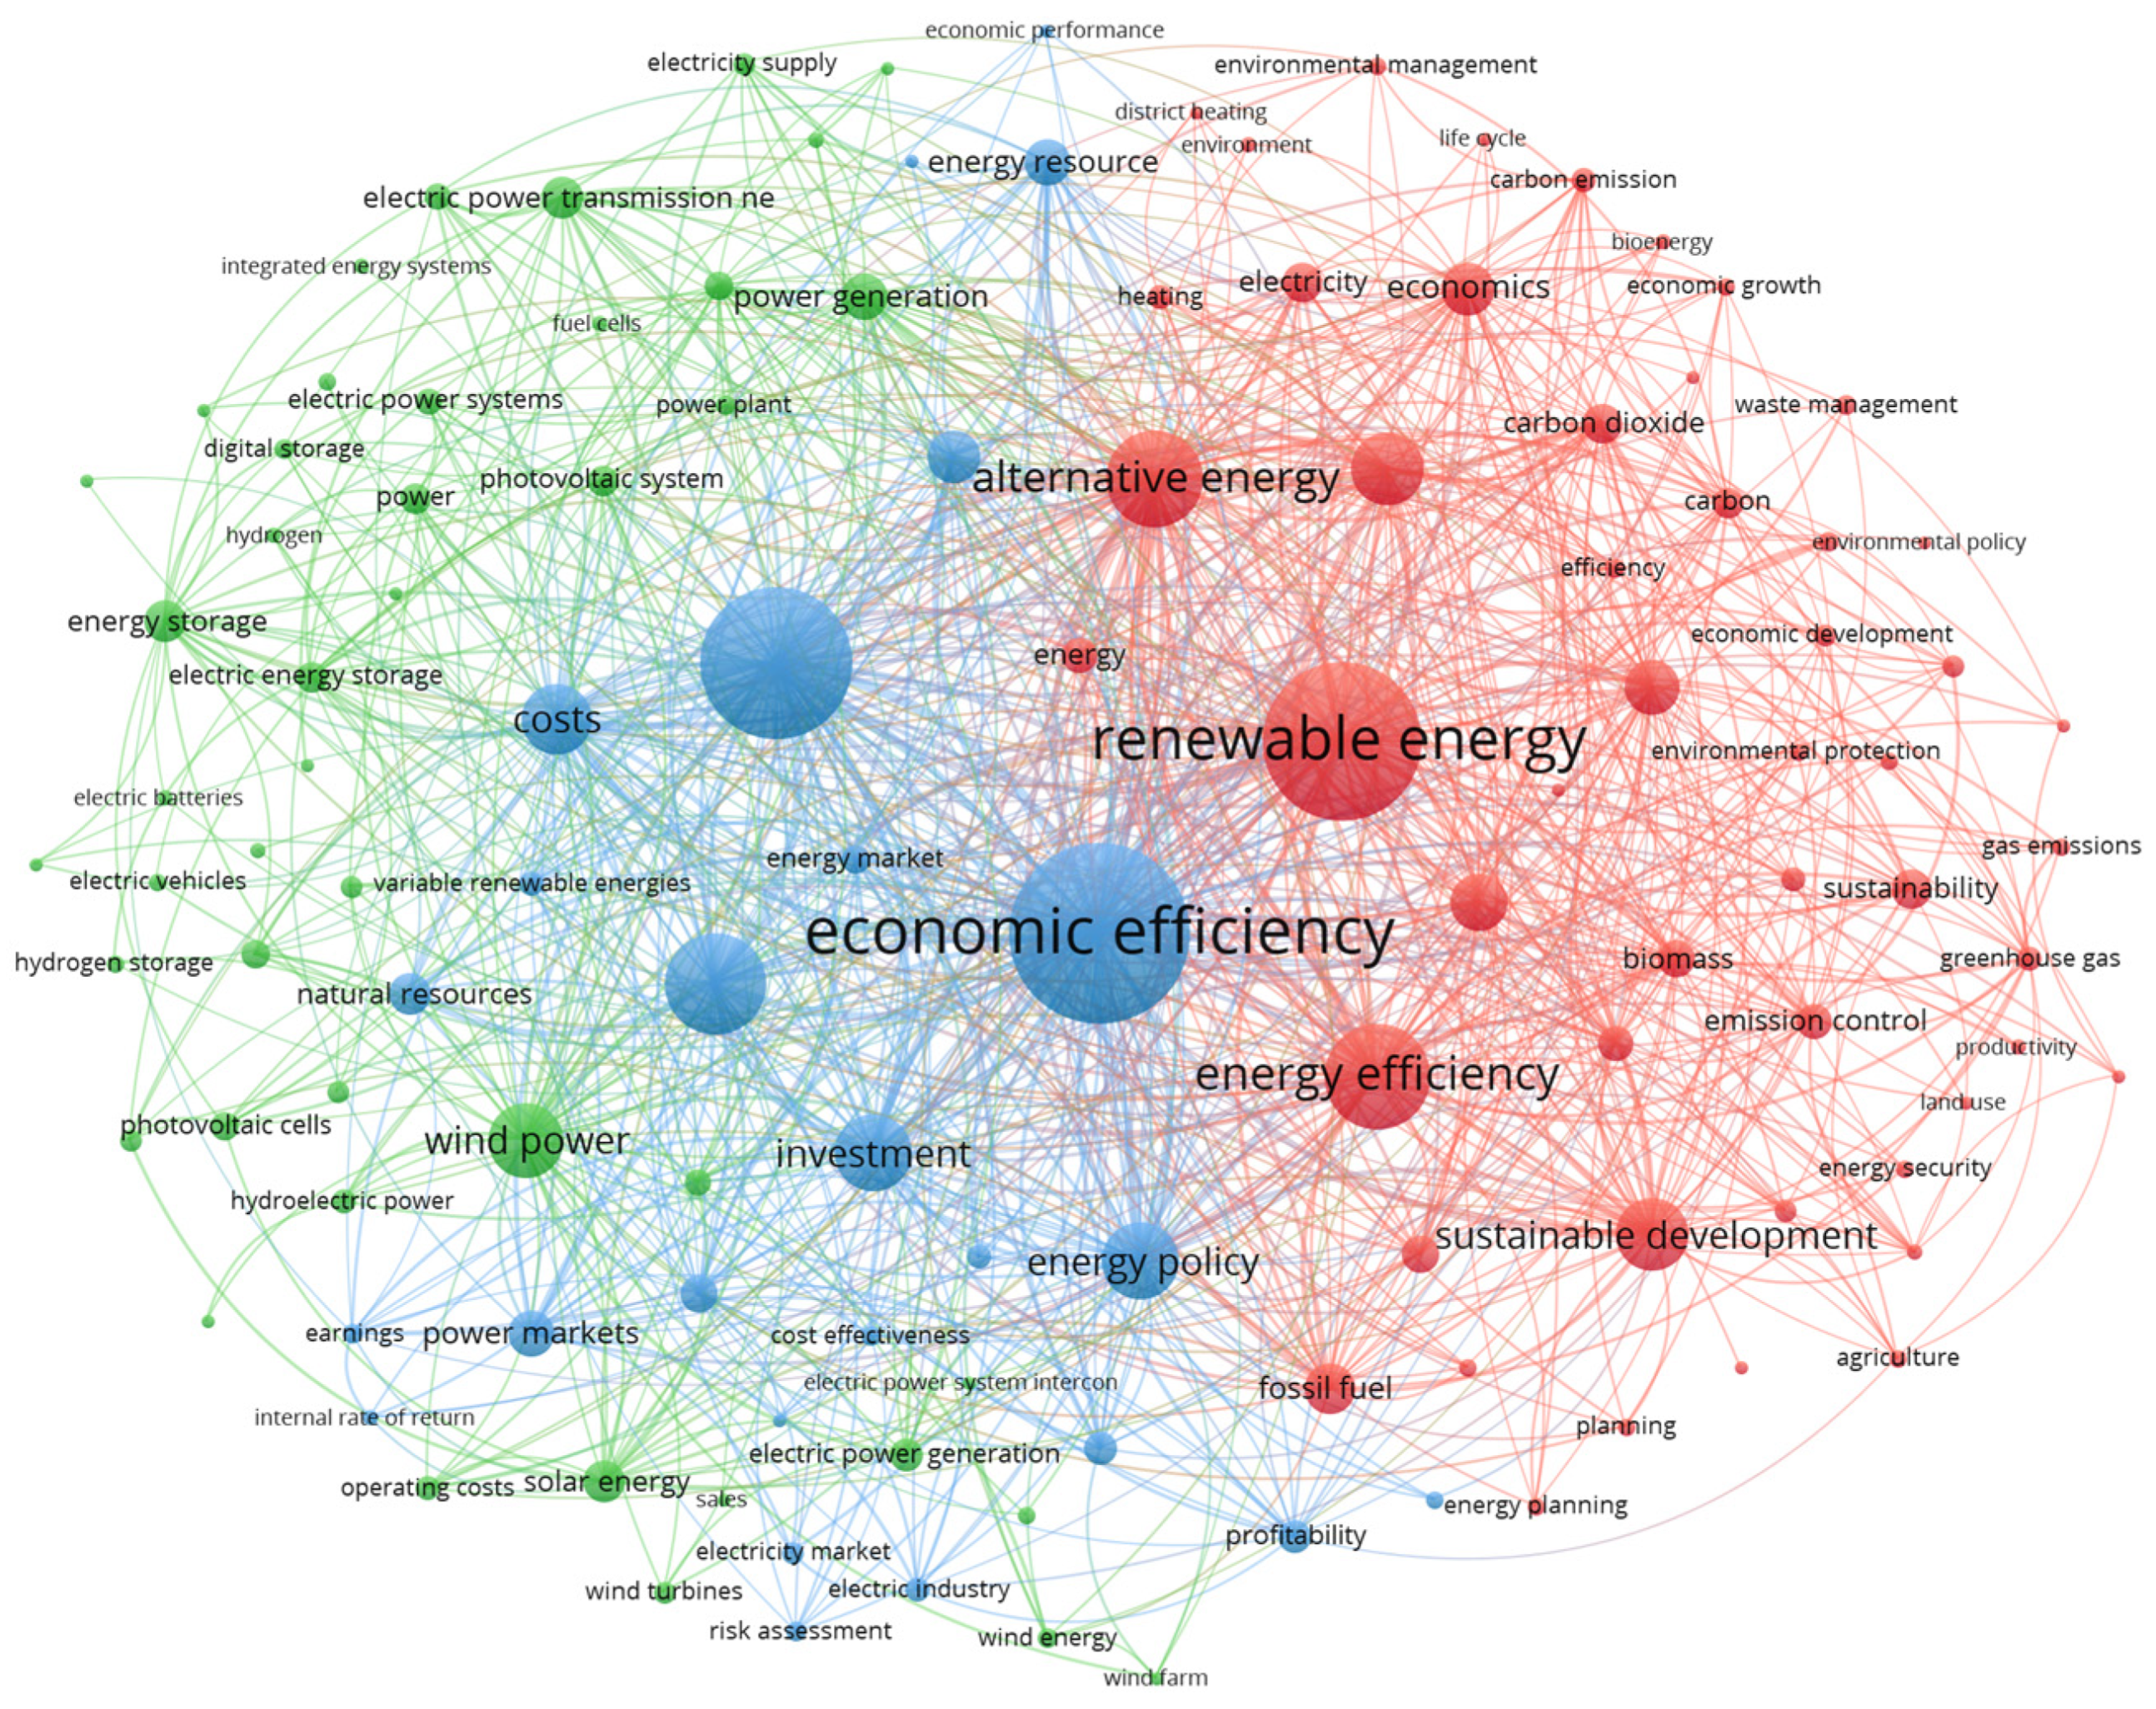
2.1. Bibliographical Analysis and Theoretical Background
2.2. The Technological Transformations and Splash of Digital Human Activity
- The number of personal computer users;
- The number of mobile phone users;
- The number of internet users;
- The share of energy produced by renewable sources;
- Energy storage (accumulation) capacity;
- The number of 3D printers used;
- The number of devices connected to the internet of things;
- The number of industrial and household robots;
- The number of remote workers;
- The amount of information produced;
- The number of payments made over the internet.
3. Methods and Data
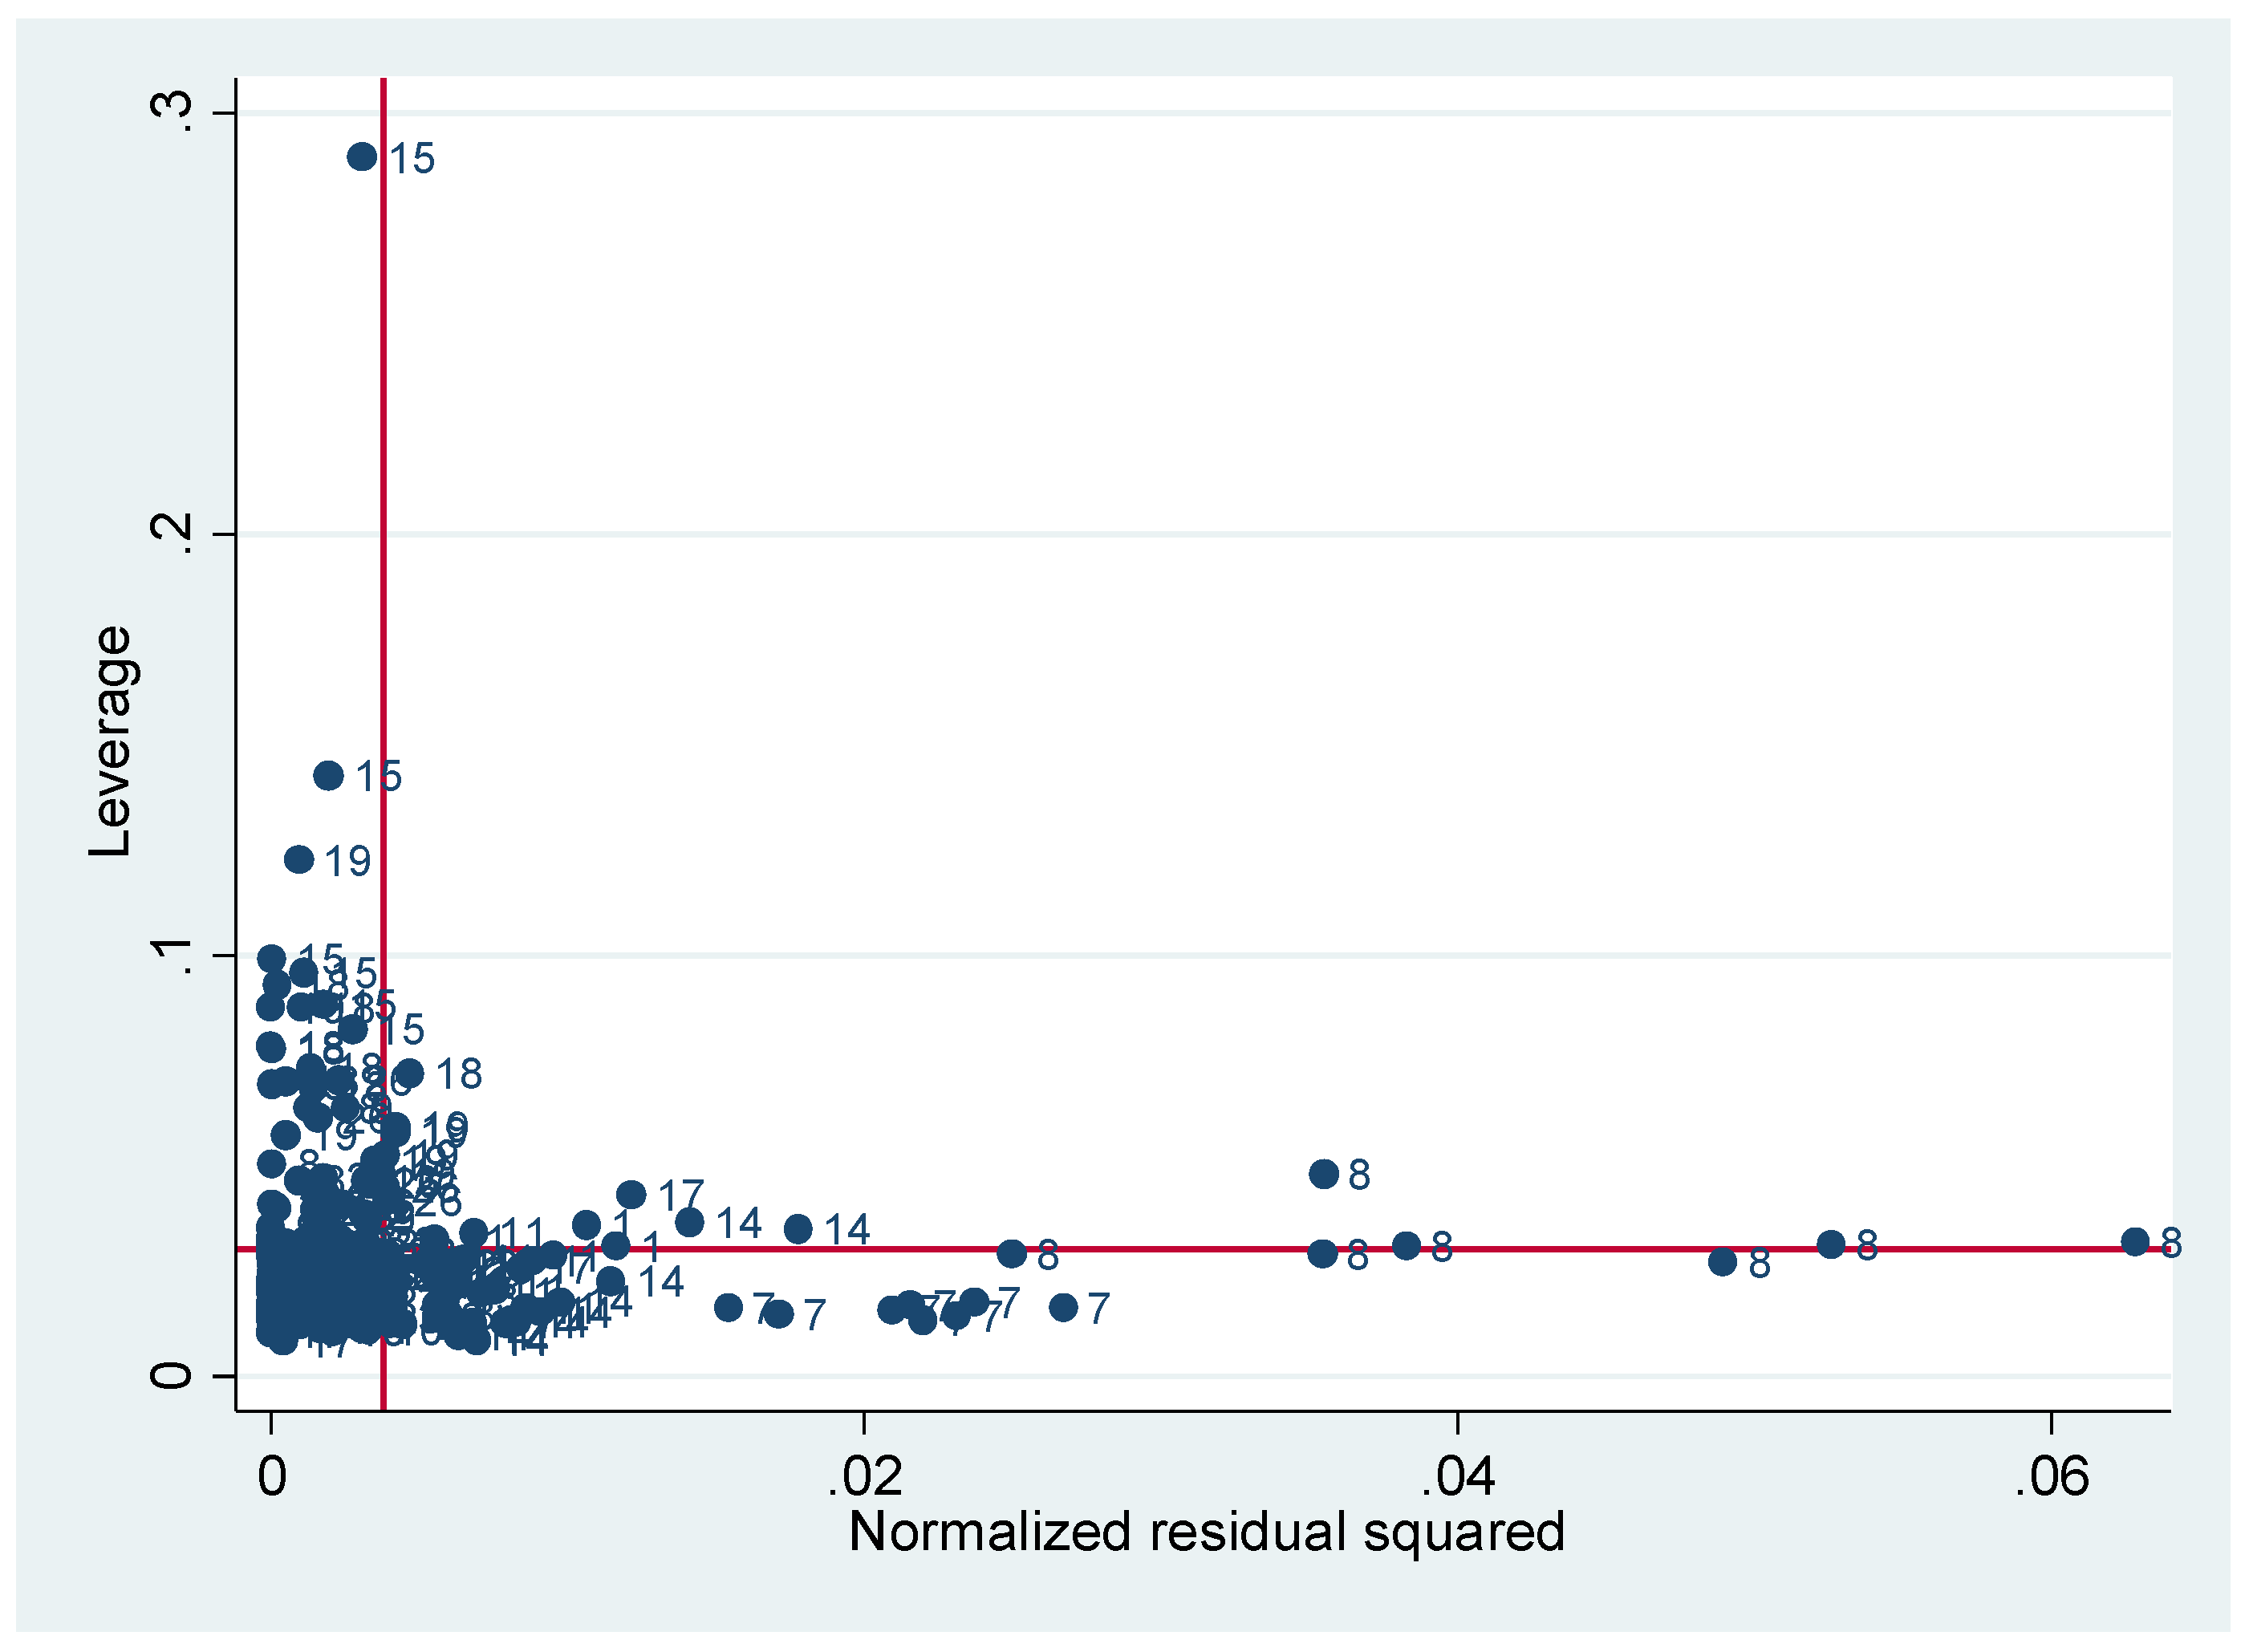
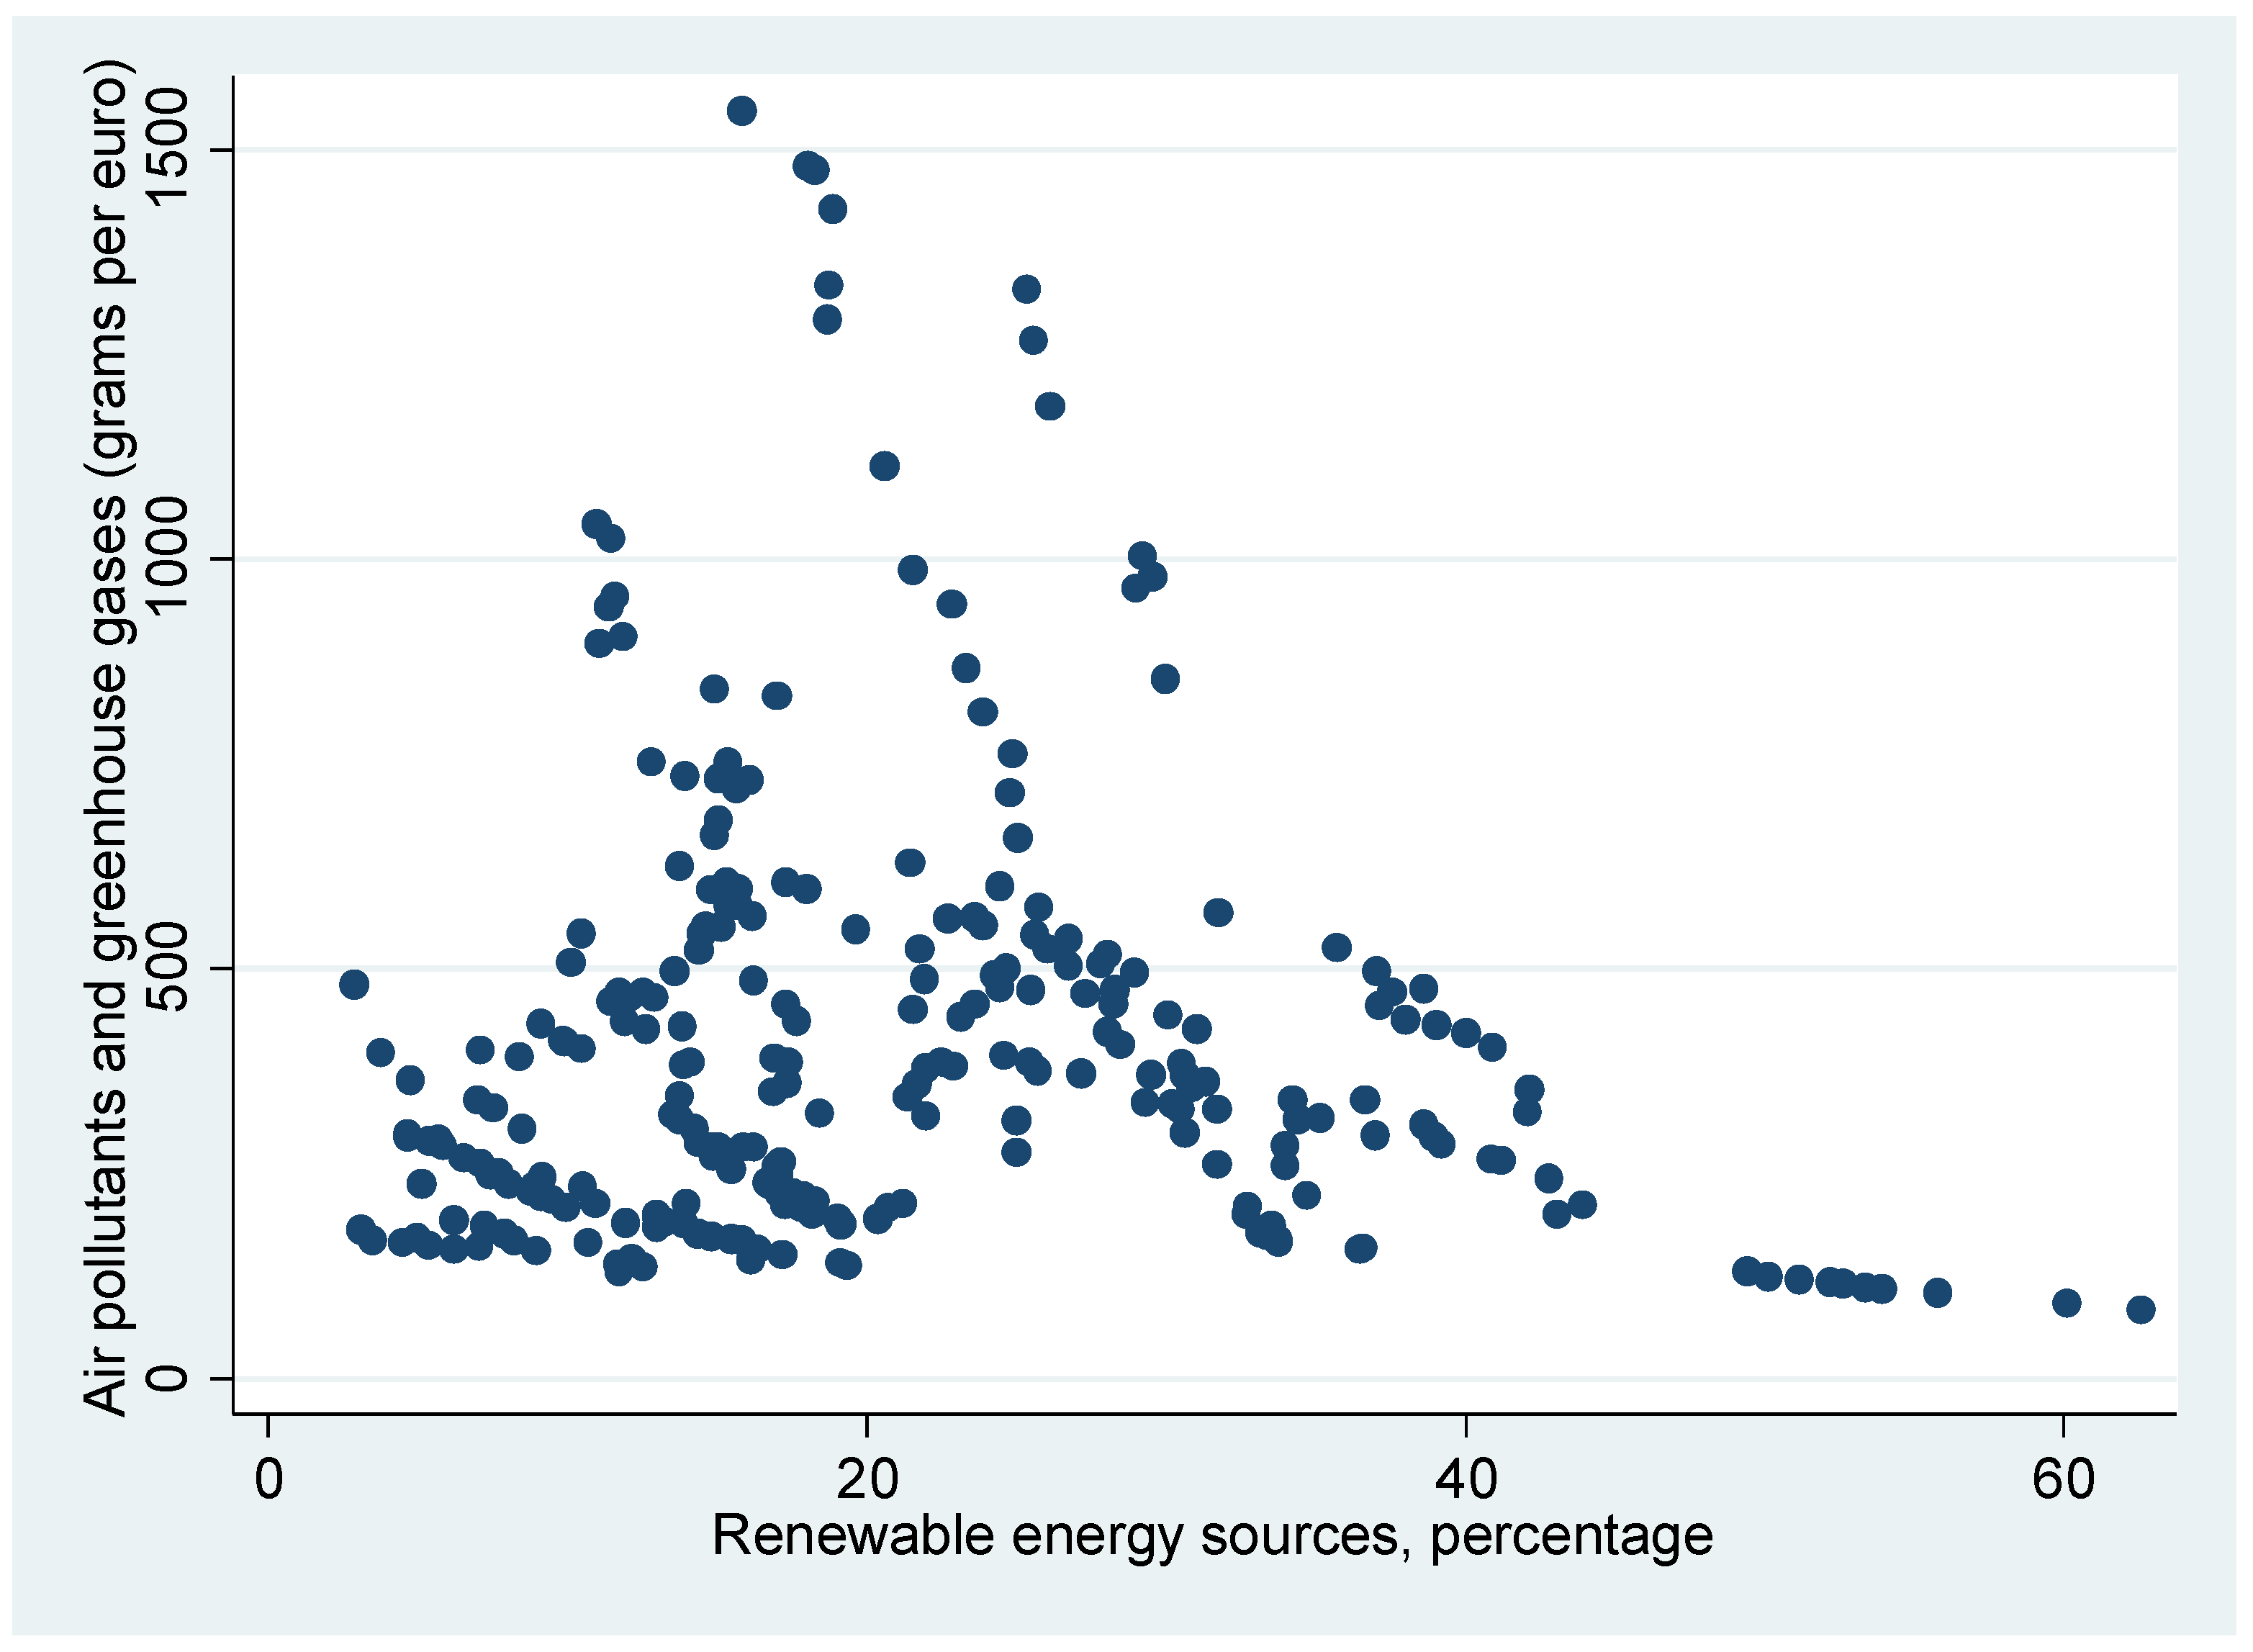
4. Results and Discussion
- -
- for the minimum value:
- -
- for the maximum value:
- -
- for the minimum value:
- -
- for the maximum value:
5. Conclusions
Author Contributions
Funding
Institutional Review Board Statement
Informed Consent Statement
Data Availability Statement
Acknowledgments
Conflicts of Interest
Appendix A
| Variables | Adjusted t | p-Value | Decision |
|---|---|---|---|
| CO2 emissions (metric tons per capita) | −6.4875 | 0.0000 | Stationary |
| Air pollutants and greenhouse gases (grams per EUR) | −8.7965 | 0.0000 | Stationary |
| Greenhouse gases (index 1990 = 100) | −7.8719 | 0.0000 | Stationary |
| Renewable energy sources(%) | −4.8915 | 0.0000 | Stationary |
| Energy consumption HH (kg of oil equivalent, pc) | −15.9059 | 0.0000 | Stationary |
| GDP pc current (USD) | −5.9962 | 0.0000 | Stationary |
| Industry share (%) | −10.5190 | 0.0000 | Stationary |
| Gross capital formation (% of GDP) | −5.6406 | 0.0000 | Stationary |
| Mobile cellular subscriptions | −5.1013 | 0.0000 | Stationary |
| High technology exports (%) | −10.7444 | 0.0000 | Stationary |
Appendix B
Appendix C
| Variables | Model 1 CO2 Emissions (Metric Tons Per Capita) | Model 2 Air Pollutants And Greenhouse Gases (Grams Per EUR) | Model 3 Greenhouse Gases (Index 1990 = 100) |
|---|---|---|---|
| Renewable energy sources (%) | −0.138 *** | −16.58 *** | −1.797 *** |
| (0.0418) | (4.556) | (0.472) | |
| Renewable energy sources (%)_SQUARED | 4.29 × 10⁻⁵ | 0.0681 | 0.0152 * |
| (0.00103) | (0.0977) | (0.00867) | |
| Energy consumption HH (kg pc) | 0.00330 *** | −0.0558 | 0.00510 |
| (0.00112) | (0.109) | (0.0168) | |
| GDP pc current (USD) | 8.45 × 10⁻⁶ | −0.00717 *** | 0.000170 |
| (1.56 × 10⁻⁵) | (0.00227) | (0.000162) | |
| Industry share (%) | 0.109 * | 25.40 ** | 0.382 |
| (0.0559) | (10.53) | (0.336) | |
| Gross capital formation (% of GDP) | −0.0399 | −6.054 | −0.0700 |
| (0.0321) | (4.084) | (0.294) | |
| Mobile cellular subscriptions | −0.00473 | 1.889 * | −0.175 * |
| (0.00713) | (1.018) | (0.0947) | |
| High technology exports (%) | 0.0568 *** | −2.763 | 0.516 |
| (0.0212) | (4.045) | (0.432) | |
| Constant | 5.056 *** | 373.8 ** | 107.0 *** |
| (1.254) | (162.0) | (18.27) | |
| Observations | 265 | 265 | 265 |
| Number of IDs | 27 | 27 | 27 |
Appendix D
| Variables | Model 1 CO2 Emissions (Metric Tons Per Capita) | Model 2 Air Pollutants And Greenhouse Gases (Grams Per EUR) | Model 3 Greenhouse Gases (Index 1990 = 100) |
|---|---|---|---|
| Renewable energy sources (%) | −0.154 *** | −18.66 *** | −1.774 *** |
| (0.0459) | (5.870) | (0.550) | |
| Renewable energy sources (%)_SQUARED | 4.62 × 10⁻⁵ | 0.0404 | 0.0163 |
| (0.000955) | (0.127) | (0.0111) | |
| Constant | 9.351 *** | 787.3 *** | 107.4 *** |
| (0.934) | (132.8) | (8.005) | |
| Observations | 270 | 270 | 270 |
| Number of IDs | 27 | 27 | 27 |
References
- European Commission. European Green Deal. 2023. Available online: https://climate.ec.europa.eu/eu-action/european-green-deal_en (accessed on 7 May 2023).
- Xu, Q.; Khan, S. How Do R&D and Renewable Energy Consumption Lead to Carbon Neutrality? Evidence from G-7 Economies. Int. J. Environ. Res. Public Health 2023, 20, 4604. [Google Scholar] [CrossRef]
- Tsimisaraka, R.S.M.; Xiang, L.; Andrianarivo, A.R.N.A.; Josoa, E.Z.; Khan, N.; Hanif, M.S.; Khurshid, A.; Limongi, R. Impact of Financial Inclusion, Globalization, Renewable Energy, ICT, and Economic Growth on CO2 Emission in OBOR Countries. Sustainability 2023, 15, 6534. [Google Scholar] [CrossRef]
- Zhang, X.; Shi, X.; Khan, Y.; Khan, M.; Naz, S.; Hassan, T.; Wu, C.; Rahman, T. The Impact of Energy Intensity, Energy Productivity and Natural Resource Rents on Carbon Emissions in Morocco. Sustainability 2023, 15, 6720. [Google Scholar] [CrossRef]
- Wolniak, R.; Saniuk, S.; Grabowska, S.; Gajdzik, B. Identification of Energy Efficiency Trends in the Context of the Development of Industry 4.0 Using the Polish Steel Sector as an Example. Energies 2020, 13, 2867. [Google Scholar] [CrossRef]
- Gajdzik, B.; Sroka, W.; Vveinhardt, J. Energy Intensity of Steel Manufactured Utilising EAF Technology as a Function of Investments Made: The Case of the Steel Industry in Poland. Energies 2021, 14, 5152. [Google Scholar] [CrossRef]
- Surya, B.; Muhibuddin, A.; Suriani, S.; Rasyidi, E.S.; Baharuddin, B.; Fitriyah, A.T.; Abubakar, H. Economic Evaluation, Use of Renewable Energy, and Sustainable Urban Development Mamminasata Metropolitan, Indonesia. Sustainability 2021, 13, 1165. [Google Scholar] [CrossRef]
- Myszczyszyn, J.; Suproń, B. Relationship among Economic Growth, Energy Consumption, CO2 Emission, and Urbanization: An Econometric Perspective Analysis. Energies 2022, 15, 9647. [Google Scholar] [CrossRef]
- Odugbesan, J.A.; Rjoub, H. Relationship Among Economic Growth, Energy Consumption, CO2 Emission, and Urbanization: Evidence From MINT Countries. SAGE Open 2020, 10, 2158244020914648. [Google Scholar] [CrossRef][Green Version]
- Patiño, L.I.; Padilla, E.; Alcántara, V.; Raymond, J.L. The Relationship of Energy and CO2 Emissions with GDP per Capita in Colombia. Atmosphere 2020, 11, 778. [Google Scholar] [CrossRef]
- Ameyaw, B.; Yao, L. Analyzing the Impact of GDP on CO2 Emissions and Forecasting Africa’s Total CO2 Emissions with Non-Assumption Driven Bidirectional Long Short-Term Memory. Sustainability 2018, 10, 3110. [Google Scholar] [CrossRef][Green Version]
- Leal, P.H.; Marques, A.C. Rediscovering the EKC hypothesis for the 20 highest CO2 emitters among OECD countries by level of globalization. Int. Econ. 2020, 164, 36–47. [Google Scholar] [CrossRef]
- Mentel, U.; Wolanin, E.; Eshov, M.; Salahodjaev, R. Industrialization and CO2 Emissions in Sub-Saharan Africa: The Mitigating Role of Renewable Electricity. Energies 2022, 15, 946. [Google Scholar] [CrossRef]
- Qingquan, J.; Khattak, S.I.; Ahmad, M.; Ping, L. A new approach to environmental sustainability: Assessing the impact of monetary policy on CO2 emissions in Asian economies. Sustain. Dev. 2020, 28, 1331–1346. [Google Scholar] [CrossRef]
- Yuelan, P.; Akbar, M.W.; Hafeez, M.; Ahmad, M.; Zia, Z.; Ullah, S. The nexus of fiscal policy instruments and environmental degradation in China. Environ. Sci. Pollut. Res. 2019, 26, 28919–28932. [Google Scholar] [CrossRef] [PubMed]
- Halkos, G.E.; Paizanos, E.A. The effects of fiscal policy on CO2 emissions: Evidence from the U.S.A. Energy Policy 2016, 88, 317–328. [Google Scholar] [CrossRef]
- Bletsas, K.; Oikonomou, G.; Panagiotidis, M.; Spyromitros, E. Carbon Dioxide and Greenhouse Gas Emissions: The Role of Monetary Policy, Fiscal Policy, and Institutional Quality. Energies 2022, 15, 4733. [Google Scholar] [CrossRef]
- Dokas, I.; Panagiotidis, M.; Papadamou, S.; Spyromitros, E. The Determinants of Energy and Electricity Consumption in Developed and Developing Countries: International Evidence. Energies 2022, 15, 2558. [Google Scholar] [CrossRef]
- Nasreen, S.; Anwar, S. Causal relationship between trade openness, economic growth and energy consumption: A panel data analysis of Asian countries. Energy Policy 2014, 69, 82–91. [Google Scholar] [CrossRef]
- Ugursal, V.I. Energy consumption, associated questions and some answers. Appl. Energy 2014, 130, 783–792. [Google Scholar] [CrossRef]
- Fredriksson, P.G.; Vollebergh, H.R.J.; Dijkgraaf, E. Corruption and energy efficiency in OECD countries: Theory and evidence. J. Environ. Econ. Manag. 2004, 47, 207–231. [Google Scholar] [CrossRef]
- Sotnyk, I.M.; Volk, O.M.; Chortok, Y.V. Increasing ecological & economic efficiency of ICT introduction as an innovative direction in resource saving. Actual Probl. Econ. 2013, 147, 229–235. [Google Scholar]
- Wood, L. Worldwide Personal Computers Industry to 3030. CISION, 23 June 2021. Available online: https://www.prnewswire.com/news-releases/worldwide-personal-computers-industry-to-2030---major-players-include-dell-lenovo-group-and-acer-among-others-301318261.html (accessed on 7 May 2023).
- O’Dea, S. Global unique Mobile Subscribers from 2010 to 2025, by Region (in Millions). Statista. Available online: https://www.statista.com/statistics/740154/worldwide-unique-mobile-subscribers-by-region/ (accessed on 7 May 2023).
- Johnson, J. Worldwide Digital Population as of April 2022. Statista. 2022. Available online: https://www.statista.com/statistics/617136/digital-population-worldwide/ (accessed on 7 May 2023).
- Singleton, M. Mark Zuckerberg wants Facebook to have 5 billion users by 2030. USA Today, 4 February 2016. [Google Scholar]
- Hill, J. Renewable Energy Now Accounts for 30% of Global Power Generation Capacity. CleanTechnica. 2016. Available online: https://cleantechnica.com/2016/09/20/renewable-energy-now-accounts-30-global-power-generation-capacity (accessed on 7 May 2023).
- IEA. Modern Renewable—sdg7: Data and Projections—Analysis—IEA. October 2020. Available online: https://www.iea.org/reports/sdg7-data-and-projections/modern-renewables (accessed on 7 May 2023).
- Tu, Y.-X.; Kubatko, O.; Piven, V.; Sotnyk, I.; Kurbatova, T. Determinants of Renewable Energy Development: Evidence from the EU Countries. Energies 2022, 15, 7093. [Google Scholar] [CrossRef]
- IRENA. Renewable Power Generation Costs in 2018; International Renewable Energy Agency: Abu Dhabi, United Arab Emirates, 2019; ISBN 978-92-9260-126-3. [Google Scholar]
- Solar Energy Technologies Office. 2030 Solar Cost Targets. Solar Energy Technologies Office, 13 August 2021. Available online: https://www.energy.gov/eere/solar/articles/2030-solar-cost-targets (accessed on 7 May 2023).
- Bansal, N.; Jaiswal, P.; Singh, G. Long term operational performance and experimental on-field degradation measurement of 10 MW PV plant in remote location in India. Energy Sustain. Dev. 2022, 67, 135–150. [Google Scholar] [CrossRef]
- Mccarthy, R.; Xu, L. Global Energy Storage Capacity to Hit 741 GWh by 2030. A Wood Mackenzie Business, 30 September 2020. Available online: https://www.greentechmedia.com/articles/read/woodmac-global-storage-to-reach-741-gigawatt-hours-by-2030 (accessed on 7 May 2023).
- Proctor, D. Group Forecasts Massive Increase in Energy Storage by 2030. POWER. Available online: https://www.powermag.com/ (accessed on 7 May 2023).
- Carlier, M. Number of Electric Vehicles in Use by Country 2020. Statista. Available online: https://www.statista.com/statistics/244292/number-of-electric-vehicles-by-country/ (accessed on 20 December 2021).
- Ambrose, J. Electric vehicles on the world’s roads expected to increase to 145 m by 2030. The Guardian, 29 August 2021. Available online: https://www.theguardian.com/environment/2021/apr/29/electric-vehicles-on-worlds-roads-expected-to-increase-to-145m-by-2030 (accessed on 7 May 2023).
- Mörée, G.; Leijon, M. Overview of Hybrid Excitation in Electrical Machines. Energies 2022, 15, 7254. [Google Scholar] [CrossRef]
- Holst, A. 3D Printing & Additive Manufacturing Devices Worldwide 2020–2030. Statista. Available online: https://www.statista.com/statistics/1259618/3d-printing-and-additive-manufacturing-devices-worldwide/ (accessed on 7 May 2023).
- Amelia, H. Wohlers Report 2021: Weakened growth for additive manufacturing. 3D Natives, 18 March 2021. Available online: https://www.3dnatives.com/en/wohlers-report-2021-180320214/ (accessed on 7 May 2023).
- Marković, M.-P.; Cingesar, I.K.; Keran, L.; Prlić, D.; Grčić, I.; Vrsaljko, D. Thermal and Mechanical Characterization of the New Functional Composites Used for 3D Printing of Static Mixers. Materials 2022, 15, 6713. [Google Scholar] [CrossRef]
- Tenorio, E.M. History of robotics. ROBOTICS. 4 September 2021. Available online: https://www.bbva.ch/en/news/history-of-robotics/ (accessed on 7 May 2023).
- Cellan-Jones, R. Robots’ to replace up to 20 million factory jobs’ by 2030. Oxford Economics. Available online: https://www.bbc.com/news/business-48760799 (accessed on 7 May 2023).
- Krot, K.; Iskierka, G.; Poskart, B.; Gola, A. Predictive Monitoring System for Autonomous Mobile Robots Battery Management Using the Industrial Internet of Things Technology. Materials 2022, 15, 6561. [Google Scholar] [CrossRef]
- Hilbert, M.; López, P. The World’s Technological Capacity to Store, Communicate, and Compute Information. Science 2011, 332, 60–65. [Google Scholar] [CrossRef][Green Version]
- Klein, A. Hard Drive Cost per Gigabyte. BACKBLAZE. Available online: https://www.backblaze.com/blog/hard-drive-cost-per-gigabyte/#:~:text=From%20January%202015%20to%20January,the%20cost%20of%20providing%%2020storage (accessed on 7 May 2023).
- Andrișan, G.; Modreanu, A. An Overview of The Fourth Industrial Revolution through the Business Lens. Bus. Ethics Leadersh. 2022, 6, 39–46. [Google Scholar] [CrossRef]
- Niftiyev, I.; Yagublu, N.; Akbarli, N. Exploring The Innovativeness of The South Caucasus Economies: Main Trends and Factors. SocioEconomic Chall. 2021, 5, 122–148. [Google Scholar] [CrossRef]
- Detka, K.; Górecki, K. Wireless Power Transfer—A Review. Energies 2022, 15, 7236. [Google Scholar] [CrossRef]
- Bardy, R.; Rubens, A. Weighing Externalities of Economic Recovery Projects: An Alternative to Green Taxonomies that is Fairer and more Realistic. Bus. Ethics Leadersh. 2022, 6, 23–34. [Google Scholar] [CrossRef]
- Keliuotytė-Staniulėnienė, G.; Daunaravičiūtė, K. The Global Green Bond Market in the Face of the COVID-19 Pandemic. Financ. Mark. Inst. Risks 2021, 5, 50–60. [Google Scholar] [CrossRef]
- Burlakova, I.; Kovalov, B.; Šauer, P.; Dvořák, A. Transformation mechanisms of transition to the model of “green” economy in Ukraine. J. Environ. Manag. Tour. 2017, 8, 1029–1040. [Google Scholar]
- Bublyk, M.; Kowalska-Styczen, A.; Lytvyn, V.; Vysotska, V. The Ukrainian Economy Transformation into the Circular Based on Fuzzy-Logic Cluster Analysis. Energies 2021, 14, 5951. [Google Scholar] [CrossRef]
- Robust Regression. Stata Data Analysis Examples. UCLA: Statistical Consulting Group. Available online: https://stats.oarc.ucla.edu/sas/modules/introduction-to-the-features-of-sas/ (accessed on 7 May 2023).
- Levin, A.; Lin, C.F.; Chu, C.S.J. Unit root tests in panel data: Asymptotic and finite-sample properties. J. Econom. 2002, 108, 1–24. [Google Scholar] [CrossRef]
- Guo, X.; Huang, K.; Li, L.; Wang, X. Renewable Energy for Balancing Carbon Emissions and Reducing Carbon Transfer under Global Value Chains: A Way Forward. Sustainability 2023, 15, 234. [Google Scholar] [CrossRef]
- Voumik, L.C.; Islam, M.A.; Ray, S.; Mohamed Yusop, N.Y.; Ridzuan, A.R. CO2 Emissions from Renewable and Non-Renewable Electricity Generation Sources in the G7 Countries: Static and Dynamic Panel Assessment. Energies 2023, 16, 1044. [Google Scholar] [CrossRef]
- Candra, O.; Chammam, A.; Alvarez, J.R.N.; Muda, I.; Aybar, H.Ş. The Impact of Renewable Energy Sources on the Sustainable Development of the Economy and Greenhouse Gas Emissions. Sustainability 2023, 15, 2104. [Google Scholar] [CrossRef]
- Chomać-Pierzecka, E.; Sobczak, A.; Soboń, D. Wind Energy Market in Poland in the Background of the Baltic Sea Bordering Countries in the Era of the COVID-19 Pandemic. Energies 2022, 15, 2470. [Google Scholar] [CrossRef]
- Methods of Environmental Losses Assessment; Melnyk, L.H., Karintseva, O.I., Eds.; University Book: Sumy, Ukraine, 2004; 288p. (In Ukrainian) [Google Scholar]
- Bekirov, E.; Fursenko, N. Environmental performance of solar and wind power plants. MOTROL 2013, 15, 145–150. [Google Scholar]
- Akella, A.K.; Saini, R.P.; Sharma, M.P. Social, economic and environmental impacts of renewable energy systems. Renew. Energy 2009, 34, 390–396. [Google Scholar] [CrossRef]
- Electricity Generation and Related CO2 Emissions. Planete Energies, 12 February 2016. Available online: https://www.planete-energies.com/en/media/article/electricity-generation-and-related-co2-emissions (accessed on 7 May 2023).
- Huseynov, A.G. Impact of environmental innovation on country socio-economic development. Mark. Manag. Innov. 2021, 2, 293–302. [Google Scholar] [CrossRef]
- Miśkiewicz, R. Implementing the Industry 4.0 Concept into the Economy on the Example of the Realloys Company. Scientific Papers of Silesian University of Technology. Organ. Manag. Ser. 2019, 141, 249–260. [Google Scholar] [CrossRef]
- Agbo, E.P.; Edet, C.O.; Magu, T.O.; Njok, A.O.; Ekpo, C.M.; Hitler, L. Solar energy: A panacea for the electricity generation crisis in Nigeria. Heliyon 2021, 7, e07016. [Google Scholar] [CrossRef]
- Trypolska, G.; Kurbatova, T.; Prokopenko, O.; Howaniec, H.; Klapkiv, Y. Wind and Solar Power Plant End-of-Life Equipment: Prospects for Management in Ukraine. Energies 2022, 15, 1662. [Google Scholar] [CrossRef]
- Brych, V.; Zatonatska, T.; Dluhopolskyi, O.; Borysiak, O.; Vakun, O. Estimating the Efficiency of the Green Energy Services’ Marketing Management Based on Segmentation. Mark. Manag. Innov. 2021, 3, 188–198. [Google Scholar] [CrossRef]
- Thadani, H.L.; Go, Y.I. Integration of solar energy into low-cost housing for sustainable development: Case study in developing countries. Heliyon 2021, 7, e08513. [Google Scholar] [CrossRef] [PubMed]
- Verity, T.; Dias, P.R.; Chang, N.; Deng, R. Estimating the Lifetime of Solar Photovoltaic Modules in Australia. Sustainability 2022, 14, 5336. [Google Scholar] [CrossRef]
- Holechek, J.L.; Geli, H.; Sawalhah, M.N.; Valdez, R. A Global Assessment: Can Renewable Energy Replace Fossil Fuels by 2050? Sustainability 2022, 14, 4792. [Google Scholar] [CrossRef]
- Do, T.N.; Burke, P.J.; Nguyen, H.N.; Overland, I.; Suryadi, B.; Swandaru, A.; Yurnaidi, Z. Vietnam’s solar and wind power success: Policy implications for the other ASEAN countries. Energy Sustain. Dev. 2021, 65, 1–11. [Google Scholar] [CrossRef]
- Kurbatova, T.; Sidortsov, R. Trash to Hryvnias: The economics of electricity generation from landfill gas in Ukraine. Int. J. Sustain. Energy Plan. Manag. 2022, 33, 53–64. [Google Scholar] [CrossRef]
- Sotnyk, I.; Kurbatova, T.; Romaniyk, Y.; Prokopenko, O.; Gonchar, V.; Sayenko, Y.; Prause, G.; Sapiński, A. Determining the optimal directions of investment in regional renewable energy development. Energies 2022, 15, 3646. [Google Scholar] [CrossRef]
- Kurbatova, T.; Sotnyk, I.; Kubatko, O.; Baranchenko, Y.; Arakpogun, E.O.; Roubik, H. State support policy for renewable energy development in emerging economies: The case of Ukraine. Int. J. Glob. Environ. Issues 2020, 19, 26–52. [Google Scholar] [CrossRef]
- Electricity Data Explorer. Ember. 2022. Available online: https://ember-climate.org/data/data-tools/data-explorer/ (accessed on 7 May 2023).


| No. | Indicator | Year/Value | |||
|---|---|---|---|---|---|
| 2000 | 2010 | 2020 | 2030 (Projected) | ||
| 1 | PC users (millions) [23] | 140 | 1300 | 5200 | 7900 |
| 2 | Unique mobile phone users (millions) [24] | 110 | 3250 | 5170 | 8200 |
| 3 | Internet users (millions) [25] | 415 | 2023 | 4930 | 7500 |
| 4 | Social media users (millions) [26] | <1 | 970 | 4000 | 7000 |
| 5 | Share of renewable energy, excluding hydropower (%) [27,28,29] | 1 | 5 | 15 | 23 |
| 6 | LCOE of PV energy (USD/MWh) [30,31,32] | 900 | 300 | 48–52 | 20 |
| 7 | Global energy storage capacity (GW/GWh) [30,33,34] | <1/<1 | 2/4 | 12/21 | 360/741 |
| 8 | The global number of electric cars (103 units) [35,36,37] | 0.5 | 17 | 10,500 | 145,000–230,000 |
| 9 | 3D printers (103 units) [38,39,40] | 0.5 | 3 | 700 | 2700–5000 |
| 10 | Global IoT-connected devices (units) | 6 | 12.5 × 10⁶ | 30 × 106 | 75 × 106–100 × 106 |
| 11 | Industrial robots (103 units) [41,42,43] | 742 | 1200 | 3000 | 20,000 |
| 12 | Share of digital information (%) [44] | <50 | 94 | 99 | 99 |
| 13 | Cost of information storage (USD/TB) [45] | 12,000 | 70 | 4 | 0.3 |
| Variables | Model 1 CO2 Emissions (Metric Tons Per Capita) | Model 2 Air Pollutants and Greenhouse Gases (Grams Per EUR) | Model 3 Greenhouse Gases (Index 1990 = 100) |
|---|---|---|---|
| Renewable energy sources (%) | −0.137 *** | −13.05 *** | −1.028 *** |
| (0.0271) | (3.546) | (0.239) | |
| Energy consumption by household (kg of oil equivalent) | 0.00327 *** | −0.0491 | 0.00572 |
| (0.00109) | (0.103) | (0.0175) | |
| GDP pc current (USD) | 7.99 × 10⁻⁶ | −0.00719 *** | 0.000162 |
| (1.54 × 10⁻⁵) | (0.00227) | (0.000161) | |
| Industry share (%) | 0.109 * | 25.22 ** | 0.362 |
| (0.0563) | (10.49) | (0.340) | |
| Gross capital formation (% of GDP) | −0.0396 | −6.271 | −0.117 |
| (0.0314) | (4.104) | (0.308) | |
| Mobile cellular subscriptions | −0.00494 | 1.802 * | −0.197 ** |
| (0.00700) | (0.987) | (0.0987) | |
| High technology exports (%) | 0.0570 *** | −2.838 | 0.494 |
| (0.0213) | (4.156) | (0.467) | |
| Constant | 5.088 *** | 356.7 ** | 104.1 *** |
| (1.237) | (162.2) | (17.63) | |
| Observations | 265 | 265 | 265 |
| Number of IDs | 27 | 27 | 27 |
| Energy Source | Air Emissions (m3/MWh) | Freshwater Input (m3/MWh) | Wastewater Discharge (m3/MWh) | Solid Wastes (g/MWh) | Environmental Protection Costs (% of General Costs) |
|---|---|---|---|---|---|
| Solar | - | - | 0.02 | - | - |
| Wind | - | - | 0.01 | - | 1 |
| Biogas | 2–10 | 20 | 0.2 | 0.2 | - |
| Coal | 20–35 | 40–60 | 0.5 | 200–500 | 30 |
| Gas | 2–15 | 2–5 | 0.2 | 0.2 | 10 |
Disclaimer/Publisher’s Note: The statements, opinions and data contained in all publications are solely those of the individual author(s) and contributor(s) and not of MDPI and/or the editor(s). MDPI and/or the editor(s) disclaim responsibility for any injury to people or property resulting from any ideas, methods, instructions or products referred to in the content. |
© 2023 by the authors. Licensee MDPI, Basel, Switzerland. This article is an open access article distributed under the terms and conditions of the Creative Commons Attribution (CC BY) license (https://creativecommons.org/licenses/by/4.0/).
Share and Cite
Wang, W.; Melnyk, L.; Kubatko, O.; Kovalov, B.; Hens, L. Economic and Technological Efficiency of Renewable Energy Technologies Implementation. Sustainability 2023, 15, 8802. https://doi.org/10.3390/su15118802
Wang W, Melnyk L, Kubatko O, Kovalov B, Hens L. Economic and Technological Efficiency of Renewable Energy Technologies Implementation. Sustainability. 2023; 15(11):8802. https://doi.org/10.3390/su15118802
Chicago/Turabian StyleWang, Wei, Leonid Melnyk, Oleksandra Kubatko, Bohdan Kovalov, and Luc Hens. 2023. "Economic and Technological Efficiency of Renewable Energy Technologies Implementation" Sustainability 15, no. 11: 8802. https://doi.org/10.3390/su15118802
APA StyleWang, W., Melnyk, L., Kubatko, O., Kovalov, B., & Hens, L. (2023). Economic and Technological Efficiency of Renewable Energy Technologies Implementation. Sustainability, 15(11), 8802. https://doi.org/10.3390/su15118802


