1. Introduction
The implementation of food development in Indonesia so far has shown a level of success, as shown by the increase in the production of food commodities, the improvement in the quality of public consumption, and the reduction in people experiencing poverty. However, this success has yet to address food insecurity fully. The number of food-insecure and malnourished people is still significant, and therefore this issue needs continuous attention. Food insecurity is a complex problem; the adequacy of food supply at a broader scale does not automatically alleviate food insecurity nor enhance the overall nutritional well-being of the population. In addition to supply, food insecurity and the quality of public consumption are also influenced by food distribution, people’s purchasing power, community nutrition knowledge, and the occurrence of food wastage [
1].
Based on data published by the Global Food Security Index 2022, Indonesia’s food security index in 2022 increased from a score of 59.2 in 2021 to 60.2 that still below the global average of 62.2 and has not met the target expectations for around 62.6 in 2020 next to 62.5 in 2021 [
2]. Food security refers to the state in which individuals possess the ability to obtain and consume adequate quantities of food to fulfill their requirements and sustain their daily endeavors. Food security is achieved when individuals, irrespective of their circumstances, possess consistent physical, social, and economic means to acquire sufficient, safe, and nourishing food that caters to their dietary requirements and preferences, facilitating an active and healthy lifestyle [
3]. Referring to the definition provided by [
4], food security encompasses four key dimensions: the availability of food, economic and physical access to food, effective utilization of food, and the sustainable stability of these dimensions. For a recent report, Indonesia’s food supply availability is considered unfavorable, with a score of 50.9, and the quality of nutrition gets a score of 56.2 [
5]. Meanwhile, within the publication titled The State of Food Security and Nutrition in the World, Indonesia’s average number of malnourished people reached 17.7 million, the highest in Southeast Asia [
3].
As a developing country, food insecurity in Indonesia occurs mainly in poor areas. Gunungkidul District, characterized by its arid terrain within the Karst Mountain region, stands as one of the poverty-stricken areas. Economic progress in the Karst Mountains of Gunungkidul, particularly in the realms of agriculture and animal husbandry, faces significant hindrances primarily due to the scarcity of surface water [
6]. The unsuitability of agro-climate and geographical conditions, coupled with natural vulnerabilities, further compounds the challenges for engaging in agricultural economic activities. The meager income levels within the agricultural communities residing in the Karst Mountain area contribute significantly to the elevated levels of poverty experienced in the region [
7,
8]. Indonesian per capita income in 2022 is around IDR71 million per year or around IDR5.9 million per month [
9], while per capita income in Gunungkidul in 2022 is IDR19.45 million per year or IDR1.6 million per month [
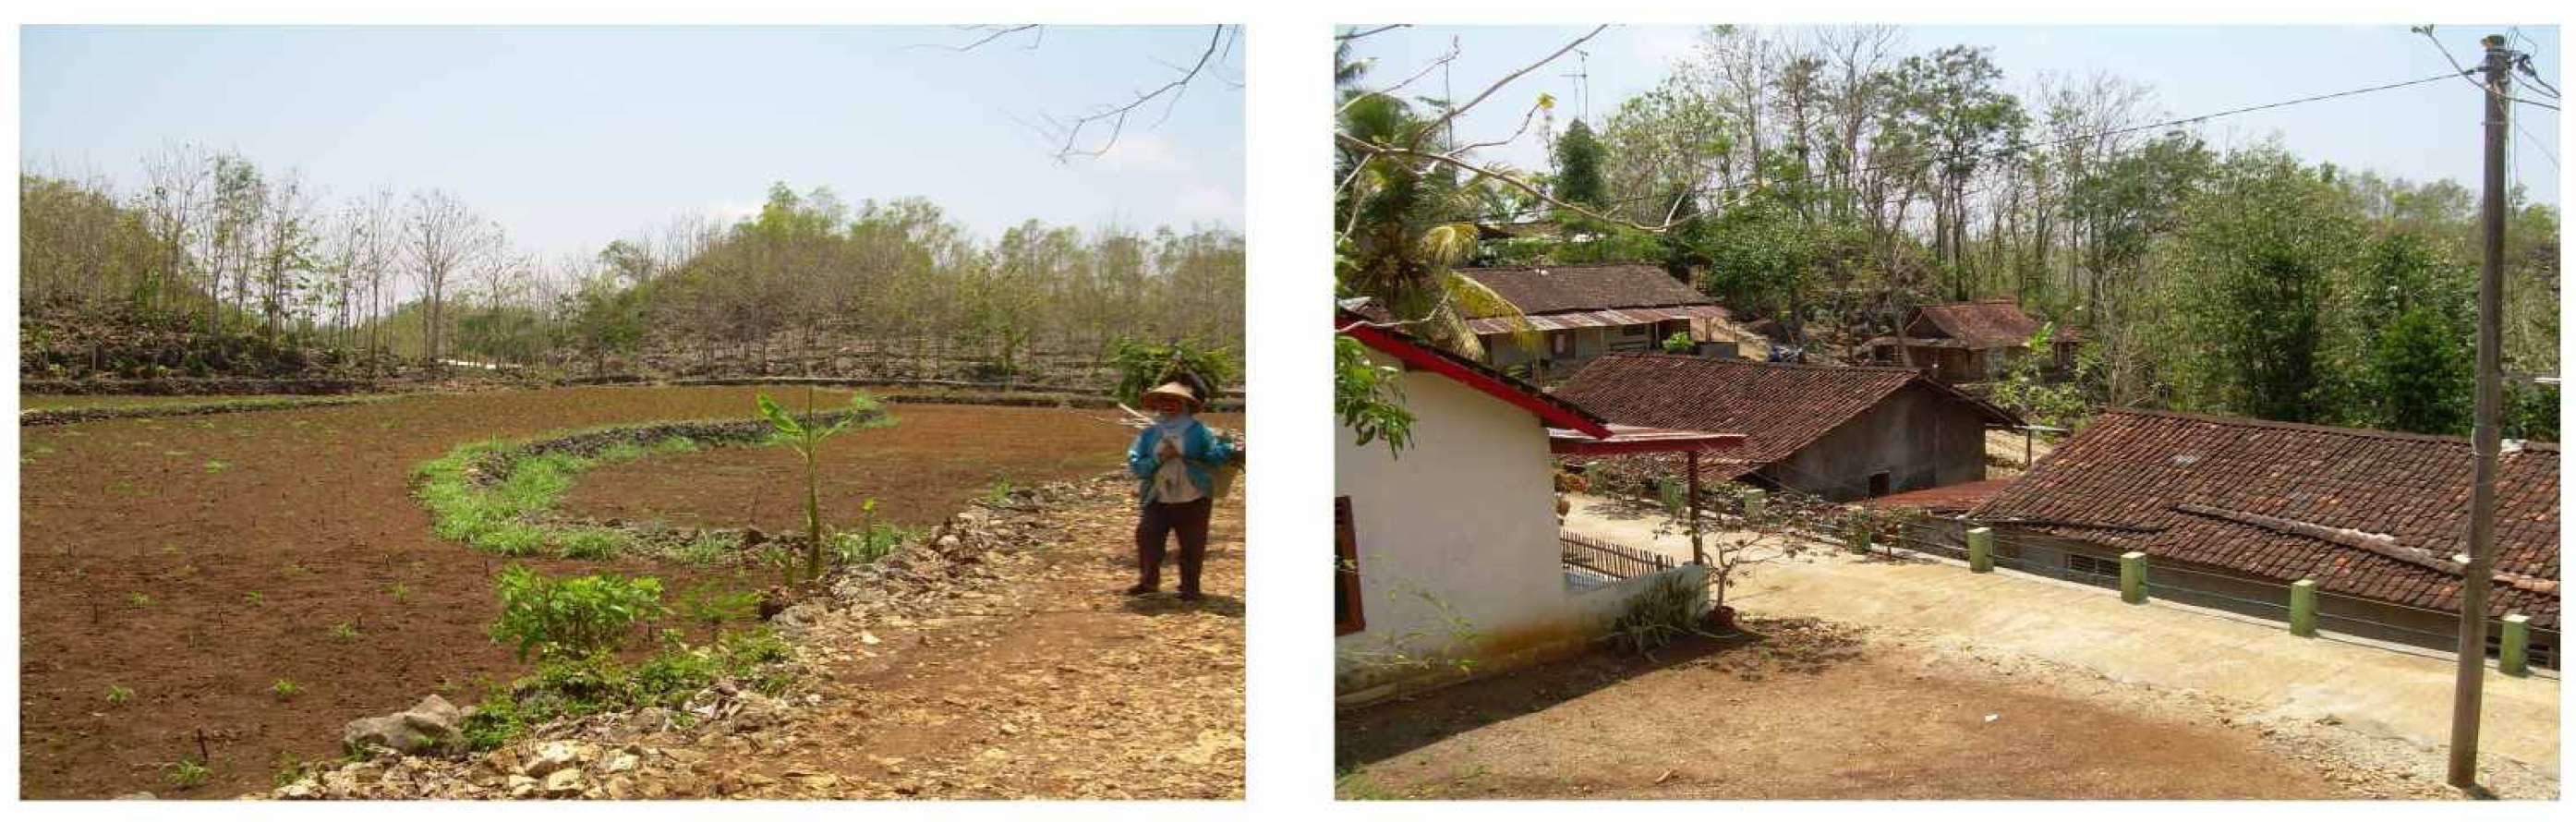
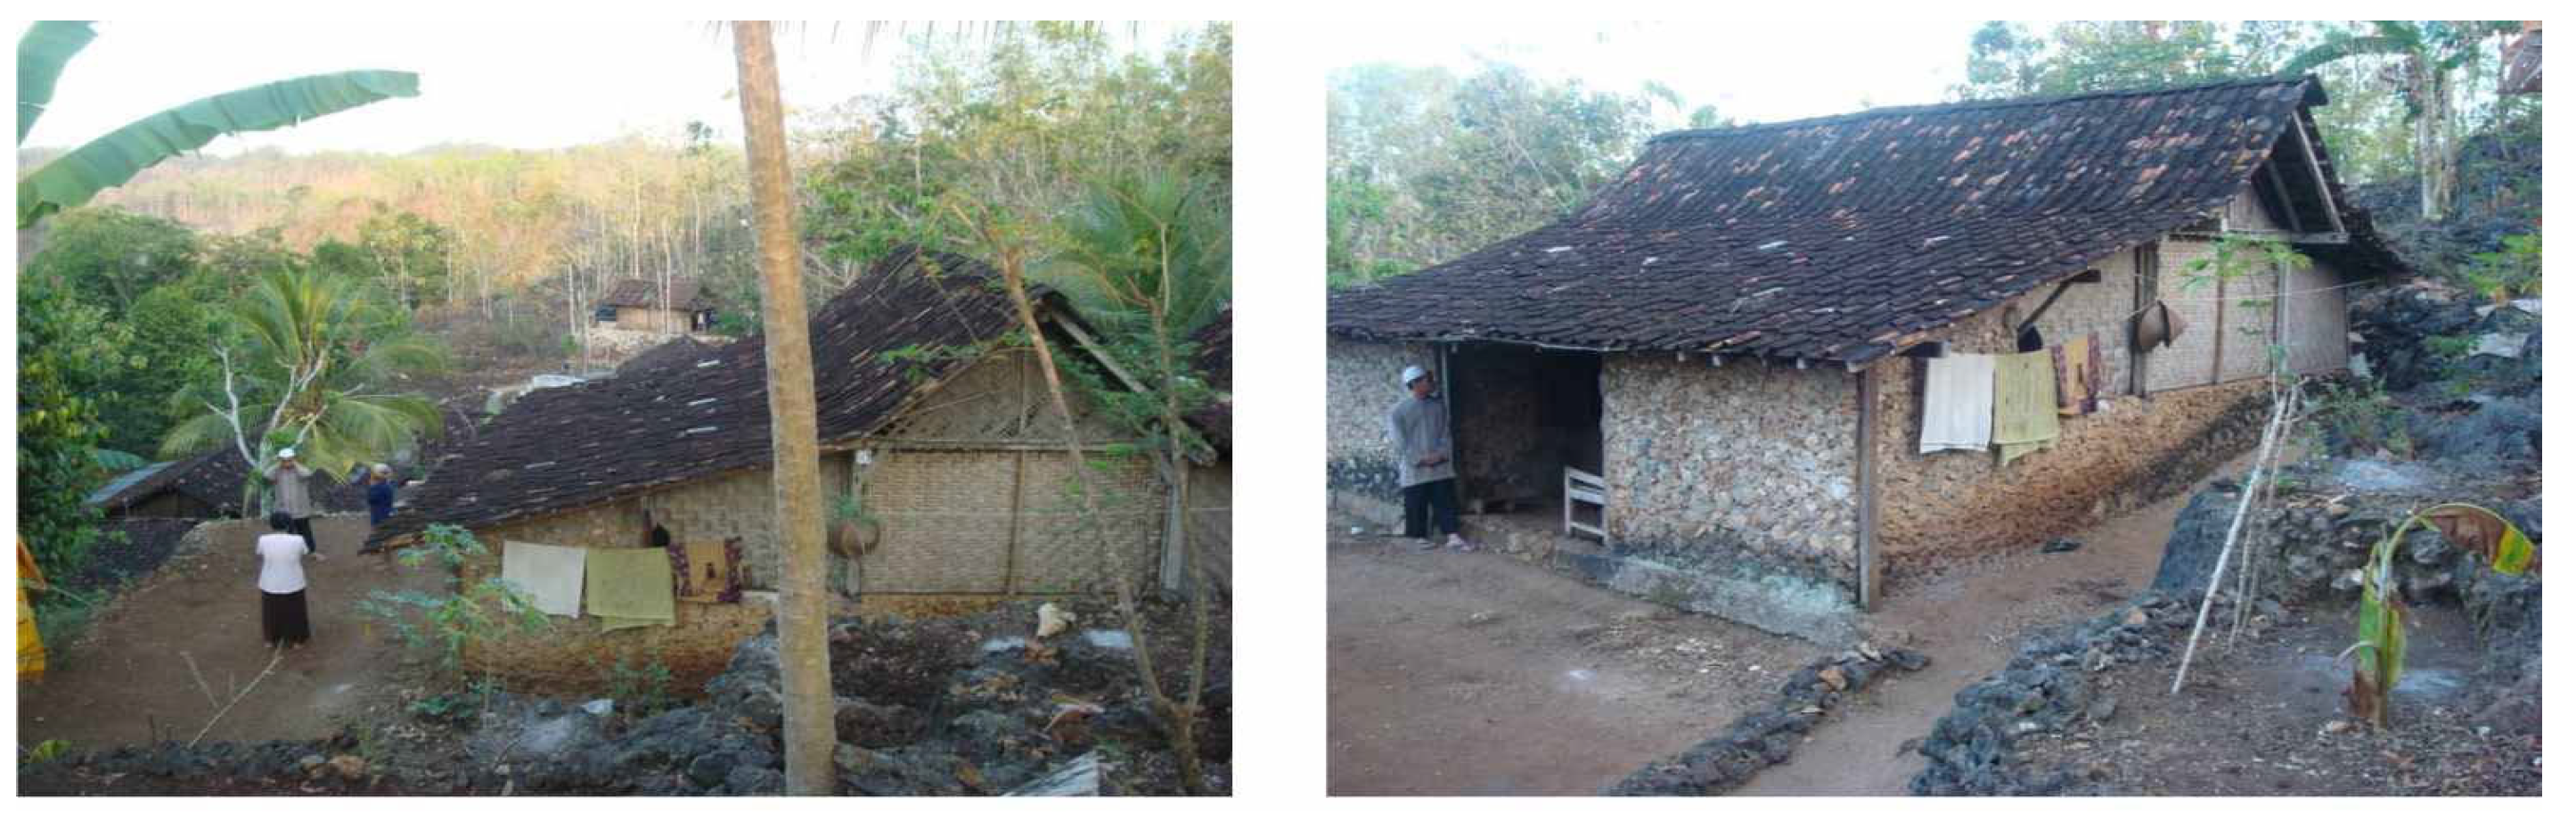
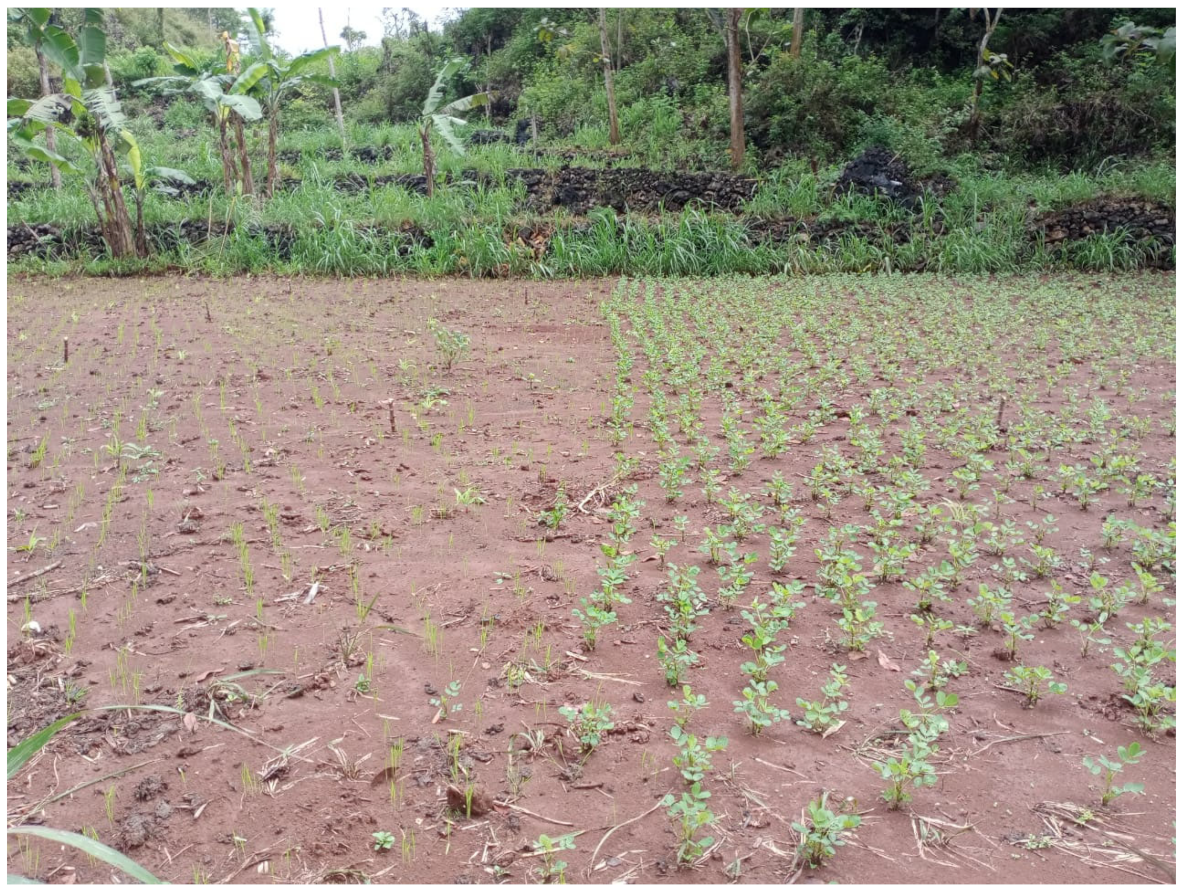
10]. The precarious situation is amplified by the region’s unpredictable and erratic rainfall patterns, which are further exacerbated by the detrimental effects of extreme climate change. Consequently, Gunungkidul experiences a high prevalence of poverty, primarily attributed to the dominance of dryland and Karst Mountains in its geographical landscape that depicted in
Figure 1 and
Figure 2.
The underlying cause of poverty primarily stems from the significant influence of food commodities, which hold greater prominence compared to non-food commodities such as housing, clothing, education, and healthcare [
11]. A study by [
12] further supports this notion, confirming that the prices of rice and alternative commodities directly impact the actual income of agricultural households. This can be attributed to the dual role played by farm households as both producers and net consumers. Food is often identified with rice since it is the leading staple food in Indonesia with strategic value. Increasing rice prices can trigger social insecurity that affects economic and national stability [
13]. Likewise, it was stated by [
14] that rice prices influenced farm household income. Ref. [
15] emphasized that rice will remain a strategic and more important commodity in the Indonesian economy. Therefore, dry land farmers in the Karst Mountains are very vulnerable to food insecurity. Narrow rice production results in low farmer household incomes, and farmers need production stocks for their family consumption.
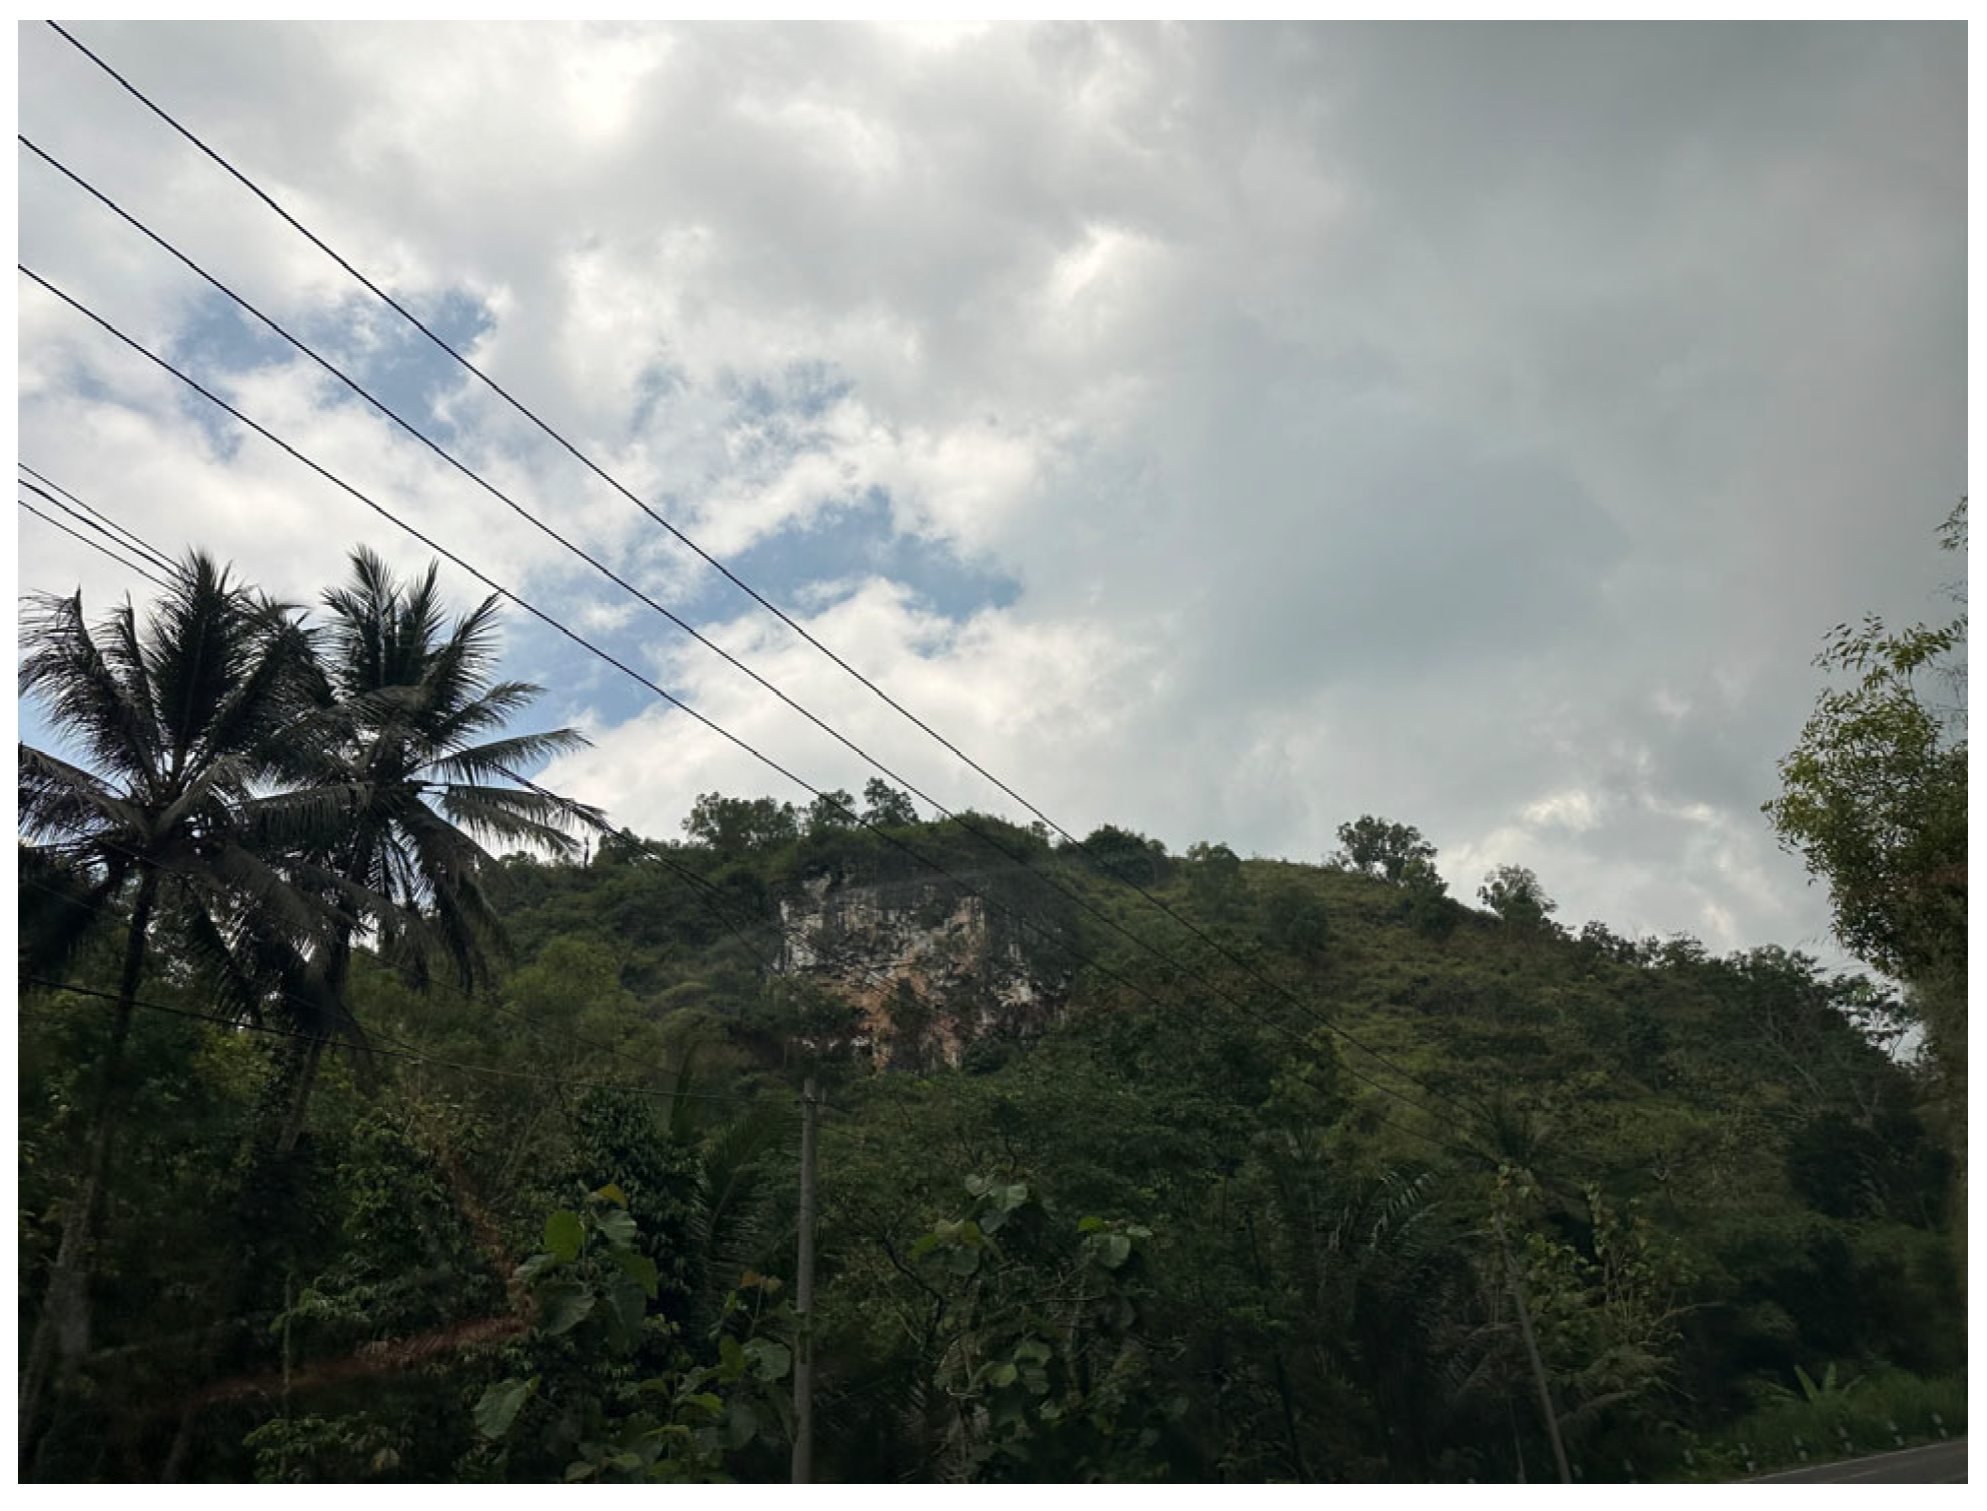
The Karst Mountains in
Figure 3 refers to a distinct geological formation on the Earth’s surface distinguished by enclosed depressions, surface drainage, and cave systems. The landscape in this region primarily emerges from the dissolution of rock, predominantly limestone or dolomite. Consequently, it is highly likely that agricultural land within the Karst Mountains of Gunungkidul consists of arid terrain, relying on rainfed rice cultivation. Gunungkidul’s Karst region is an integral part of the larger Gunung Sewu karst area. The rural impoverished population residing in the Karst Mountains, engaged in dry land farming, presents a formidable challenge. This farming community possesses a distinct dual role as both producers and consumers of food. The issue of poverty intertwines with household food insecurity, with several factors playing a substantial role in determining the level of food security. These factors include household income, the prevailing economic and socio-cultural conditions, the availability of food, household assets, and the level of knowledge among household members [
16,
17,
18].
As stated in Law No. 18/2012, the term “food” encompasses all products derived from biological sources such as agricultural produce, plantations, forestry, fisheries, livestock, waters, and water. This includes both processed and unprocessed forms intended for human consumption, including food additives, raw materials for food production, and other substances utilized in the preparation, processing, and creation of food and beverages. Food sources encouraged to be developed non-rice and non-wheat carbohydrate sources. Based on the Decree of the Minister of Agriculture No. 64/2017, developing local staples is an effort to accelerate food diversification to strengthen community food security. Dry land has great potential for agricultural development, including food crops, horticulture, plantations, and livestock [
19]. BPS data in 2019 shows that the national dryland area reached 63.4 million hectares (33.7% of Indonesia’s land area). Land used for dryland agriculture is 8.8 million ha [
20]. Dryland areas experience climate impacts such as extreme heat, severe drought, and dependence on rainfed agriculture that can trigger food insecurity [
21,
22].
Vulnerability due to climate extremes impacts food security and nutrition, such as in dryland areas. Studies on poverty and vulnerability that can lead to extreme hunger are addressed by future policies that do not conflict with equity, sustainability, and good nutrition [
23]. Various correlation associate food security. Prior research conducted on food security in Indonesia employed the binary logit model approach, revealing that certain variables, namely land area, rice production, corn production, soybean production, chicken meat production, population density, health consumer price index (CPI), CPI transportation, and financial services, exhibited a positive correlation with food security. The Jonsson and Toole criteria were used to determine food security as the dependent variable [
24]. Then, a study by the authors of [
25] included food and non-food factors as indicators affecting household consumption using the cross-data regression method. The study’s results showed that expenditure level, mother’s age, and mother’s education affected household food security intake in Indonesia. In addition, in a previous study by the authors of [
26] the factors influencing household food security in Indonesia amid the COVID-19 pandemic were examined through the implementation of the binary logit regression method. The findings indicated a positive correlation between food security and variables such as gender, age, education, occupation, income, and food expenditure. The analysis of food security in Ethiopia’s dryland regions incorporated the frameworks of the Global Dryland Ecosystem Program (G-DEP) and dryland social-ecological systems (SESs). A strong commitment and guidance from the government in policy formulation, sustainable food production investments, and scientific assistance are crucial for advancing food security research in Ethiopia. This will enable the country to effectively address the challenges within its agricultural sector and ensure improved food security outcomes [
27].
The key to household food security is agriculture, which can be connected to households, and has local added value to increase income capacity [
28]. According to FAO in CAPSA 2015 on [
25], the evolution of the concept of food security has progressed alongside the development of the concept of nutrition; by identifying the food security condition of farmer households by calculating the proportion of food expenditure, the level of energy intake, the level of protein intake, and the classification of food security (which is something different from previous studies).
Research on the food security of dryland farm households in Java still needs to be expanded, especially in the Karst Mountain area. The existing studies focus more on dryland areas in Eastern Indonesia [
29] and the upland area outside Java Island [
30,
31]. Studying consumption patterns and food insecurity levels in Gunungkidul was conducted in one village rather than in the Karst Mountain area. As indicated by [
32], dryland farmers continue to play a crucial role in bolstering food security despite facing inherent challenges. The majority of these farmers belong to the small-scale category, characterized by limited capacities to produce food. Efforts are needed to increase the capacity of dryland farmers to support food security. It is imperative to prioritize and strive for the sustainability of food security among dryland farm households in the Karst Mountain region. Previous research was conducted by [
33] explored the relationship between dietary diversity, nutritional security, and household gender. The study utilized indicators such as dietary diversity, calorie consumption, and essential nutrient intake. However, it is important to note that the previous study focused on individual gender dynamics rather than specifically examining the context of the Karst area. Therefore, this study attempts to investigate the food security of dryland farm households in the Karst Mountain region and examine the correlation of food insecurity. The novelty of this research is that the research was conducted on Karst land, an area of dryland, and areas with high poverty rates. Measuring food security requires the calculation of food expenditure, energy intake, and protein intake at the household level.
2. Materials and Methods
Concerning the research objectives, this research design is descriptive and quantitative. The method describes, explains, predicts, or controls the phenomena studied in this study related to statistical or numerical data [
34]. In this study, the main focus is dryland farmers in the Karst Mountain area in Gunungkidul district, with the primary consideration that it has the most significant Karst area compared to other districts. Besides that, Gunungkidul District is the largest poverty area in Yogyakarta Province [
35].
2.1. Data Collection and Sampling Methods
The sampling method was purposive sampling in Girisubo sub-district, Gunungkidul District, Yogyakarta Special Region Province, considering that according to [
36], the Karst Mountains of Gunung Sewu occupy most of the southern region of the Gunungkidul area. The distinctive physical attributes of the Karst region in Gunungkidul District, particularly in its southern part, are closely associated with both water scarcity and poverty [
7]. The southern area in Gunungkidul district includes the Girisubo sub-district. Data collection was conducted in February–March 2022. Girisubo sub-district has 11 villages. The data collection method is carried out by in-depth interviews with research respondents using a questionnaire. The data collected includes the identity of the respondent, off-farm and on-farm income, farming, food, and non-food expenditure. In order to determine the sample size of farm households in this study, the Slovin formula [
37] was employed, with a confidence level of 95% and a margin of error of 0.05. This formula provides a methodology for sampling in this particular approach:
where:
A total of 110 samples were selected, and questionnaires that were deemed usable were collected and utilized for data analysis. About 107 valid questionnaires were obtained, with an effectiveness rate of 97.27%.
2.2. Data Analysis Method
Farm households’ food security condition is analyzed by calculating food expenditure proportion, energy intake levels, protein intake levels, and food security classification. Food security classification is explicitly considered by two indicators: food expenditure proportion and energy intake levels. Food expenditure in this study is the amount of money spent and goods valued at money for food consumption of all family members, measured in rupiah per year (IDR/year). Food expenditure encompasses a wide range of items, including grains, tubers, fish, meat, eggs, dairy products, vegetables, nuts, fruits, oils, fats, ingredients for beverages, seasonings, other consumables, processed food and beverages, as well as expenditures on cigarettes and tobacco [
35]. Researchers obtained food prices from family members who often shop for daily food needs.
The calculation of food expenditure (
SEF) on the total expenditure of farm households can be calculated by using the Equation (2) [
21]:
where
SEF = Share of household expenditure on food (%)
EF = Expenditure on food (IDR)
TE = Total expenditure (IDR).
Furthermore, ref. [
38] households that allocate more than 75% of their income towards food expenses are categorized as highly vulnerable and, consequently, face significant food insecurity. Similarly, individuals who spend between 65% and 75% of their income on food are classified as experiencing high levels of food insecurity. Those with food expenditures ranging from 50% to 65% are considered to have moderate food insecurity, while those who spend less than 50% of their income on food are deemed to have relatively lower levels of food insecurity. To estimate things that relate to the food insecurity level, this study used the empirical model defined in Equation (3).
where:
SEF: Share of household expenditure on food (%)
FL: Number of family laborer (people)
Educ: Number of successive years in school of household head (year)
FExp: Farming experience (year)
Sex: Sex of household head. If male = 1, female = 0
I: Total household income (IDR/month)
FS: Farm size (ha)
Q: Production of rice (kg/year)
e: Error term.
This analysis did not arrange econometric model that contained other several variables which may be included in another previous literature, such as the variable of the land slope of the sample area, cropping pattern, and livestock ownership. In addition, this study did not use household income breakdown variables (agricultural income, non-agricultural income, and remittances). Instead, it used the sum of household income breakdown variables to make the results more visible significant.
Analysis of the energy and protein intake levels calculated by the formula:
Energy/Protein Intake Levels are classified, namely (1) Good: ECL/PCL ≥ 80%; (2) Deficit: ECL/PCL < 80%.
In addition to energy or protein intake analysis, there are seven independent factors which sorted into factors correlating number of levels. Hence, the regression linear model is formed:
where:
Y: Energy or protein intake levels per adult equivalent (%)
X1: Income rate (IDR/month)
X2: Number of household members (people)
X3: Rice prices rate (IDR/month)
X4: Chicken prices rate (IDR/month)
X5: Egg prices rate (IDR/month)
X6: Seafood prices rate (IDR/month)
X7: Cooking oil prices rate (IDR/month)
e: Error term.
Due to some limitations on the response obtained from the field survey, such as time constraints, the location of respondents who have a considerable distance from one another, a fairly steep terrain, and limitations on the level of understanding of farmers when extracting deeper data due to the relatively low average education of respondents. Therefore, this study was limited to the factors in the econometric model and did not include several variables, such as the variable of the land slope of the sample area, cropping pattern, and livestock ownership, since these variables needed to be considered. In addition, this study did not use household income breakdown variables (agricultural income, non-agricultural income, and remittances). Instead, it used the sum of household income breakdown variables to make the results more visible and significant.
Food security levels can be analyzed by cross-indicator calculation of both energy intake and food expenditure proportion [
30]. Household food security can be classified as in
Table 1.
3. Results and Discussion
3.1. Physical and Geographical Condition
The study area is Girisubo sub-district, Gunungkidul district, Yogyakarta Province. The total area of Gunungkidul district is 1485.36 km2, including 18 sub-districts and 144 villages. Girisubo sub-district is located in the easternmost and southernmost part of the Gunungkidul district. Over 50% of the Girisubo area is dry land, while about 30% is community forest. The boundaries of the Girisubo sub-district include the north bordering the Rongkop sub-district, the south bordering the Indian Ocean, the west bordering the Tepus sub-district, in the east bordering the Wonogiri district. Girisubo sub-district is, on average, at an altitude of 185 m above sea level. Areas located on the coast of the sea have a lower altitude.
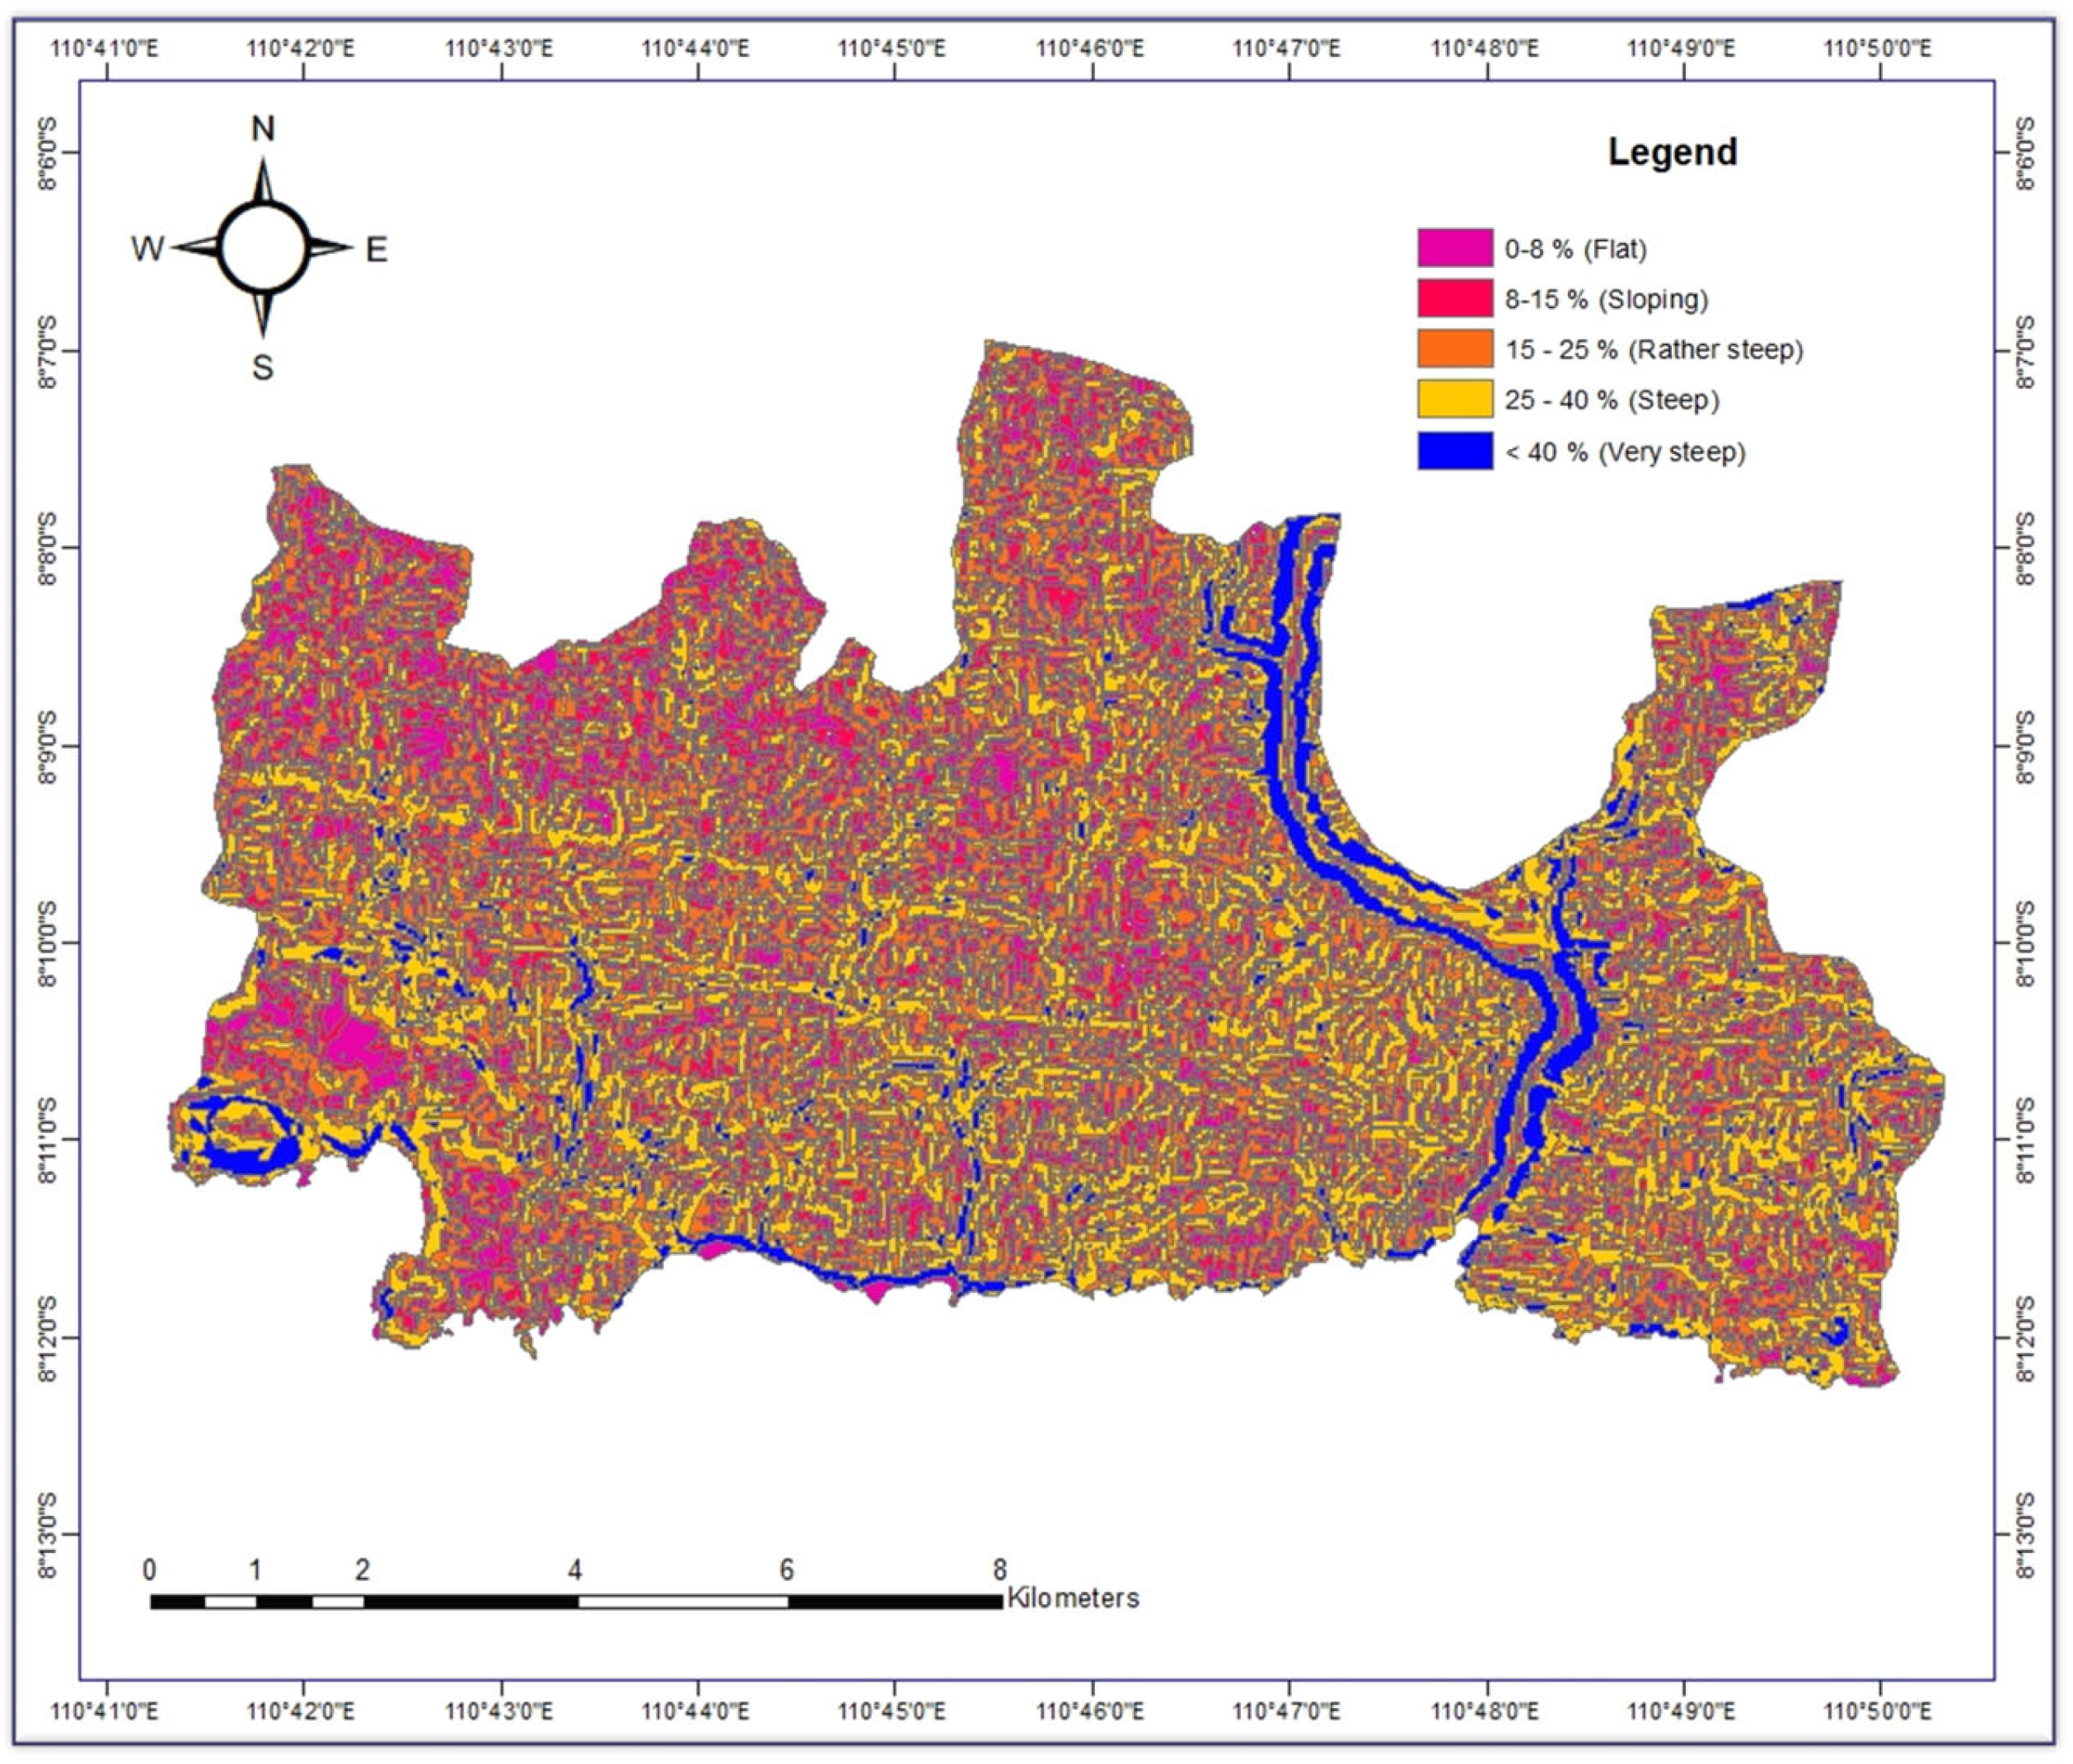
Based on the slope of the land, Girisubo District is divided into three groups: steep, moderate, and sloping. Areas classified as steep have a land slope greater than 25° and are classified as moderate with a land slope of 15–20°. In contrast, areas classified as sloping have a slope of less than 15°. The
Figure 4 shows the slope of the land in Girisubo.
3.2. Agriculture Condition
Places close to the beach have a relatively high average air temperature. The average rainfall is 2498.91 mm annually, with 103.67 rainy days recorded. The rainy season is when the best conditions for growth are monthly rainfall of 202 mm per month. The Karst Mountains are dry areas that lack water. The rainy season marks the start of planting rice, since the rice cultivated in the upland relies on rainwater. In one year, only one-time rice is planted. Agriculture is a sector that contributes significantly to employment in the study area. This condition is a result of the fact that the large dryland in Girisubo is used for farming.
Table 2 illustrates the presence of eight distinct crop rotation patterns. The initial pattern entails the rotation from paddy to corn, peanut, and cassava, followed by the continuation of cassava cultivation or the absence of any crops ‘no crop’. This means farmers in Girisubo plant paddy one time in one year. The following season, farmers plant corn, peanut, and cassava intercropping. Then, in the second dry season, they plant only cassava or ‘no crops’. Four plots implement this pattern. Dryland farmers grow paddy on their farmland once per year. One possible reason for farmers not planting their paddy fields is an insufficient water supply during that season. Farmers also prefer to plant paddy with the intercropping system with cassava and corn. There are only 18 plots applying monoculture paddy in the rainy season. Farmers who grow rice in monoculture are located in Jepitu village, where the water is more accessible than in other villages.
Meanwhile, farmers in other villages choose to intercrop when planting paddy due to the lack of water in the land. The dominant pattern in Girisubo is paddy, cassava, peanut, and corn to peanut and cassava to cassava or ‘no crop’ (
Figure 5). The amount of plots applying this pattern is 136 plots or around 82% of the total plots in Girisubo. Farmers grow corn and cassava for intercropping with paddy since these crops are more resistant to growing on dry land. After the paddy harvest, farmers immediately replace it with peanut plants.
3.3. Farm Household Characteristic
This study uses 107 sample households from 11 villages: Balong, Jepitu, Jeruk Wudel, Ngelindur, Ngrombo, Pucung, Songbanyu, Tileng, Gangsalan Kidul, Karang Tengah, and Karangawen.
Table 3 shows the characteristics of sample households, including age, education, number of family members, number of family laborers, farm size, yield, and income.
The agricultural land and farms involved in this research are large compared to the lowland farm size in Java. However, rice production per hectare per year is small since the Karst Mountains are unsuitable for rice cultivation; paddy plants need a lot of water, but the Karst areas have frequent droughts and water shortages. In addition, dryland farmers can only grow rice once a year during the rainy season. Farms that are suitable for cultivation are secondary crops such as corn, peanuts, and cassava [
8]. Therefore, dryland farmers work in the off-farm labor market to maintain their living standards, such as traders, drivers, laborers, housemaids, tailors, public servants, teachers, masseuses, and art workers.
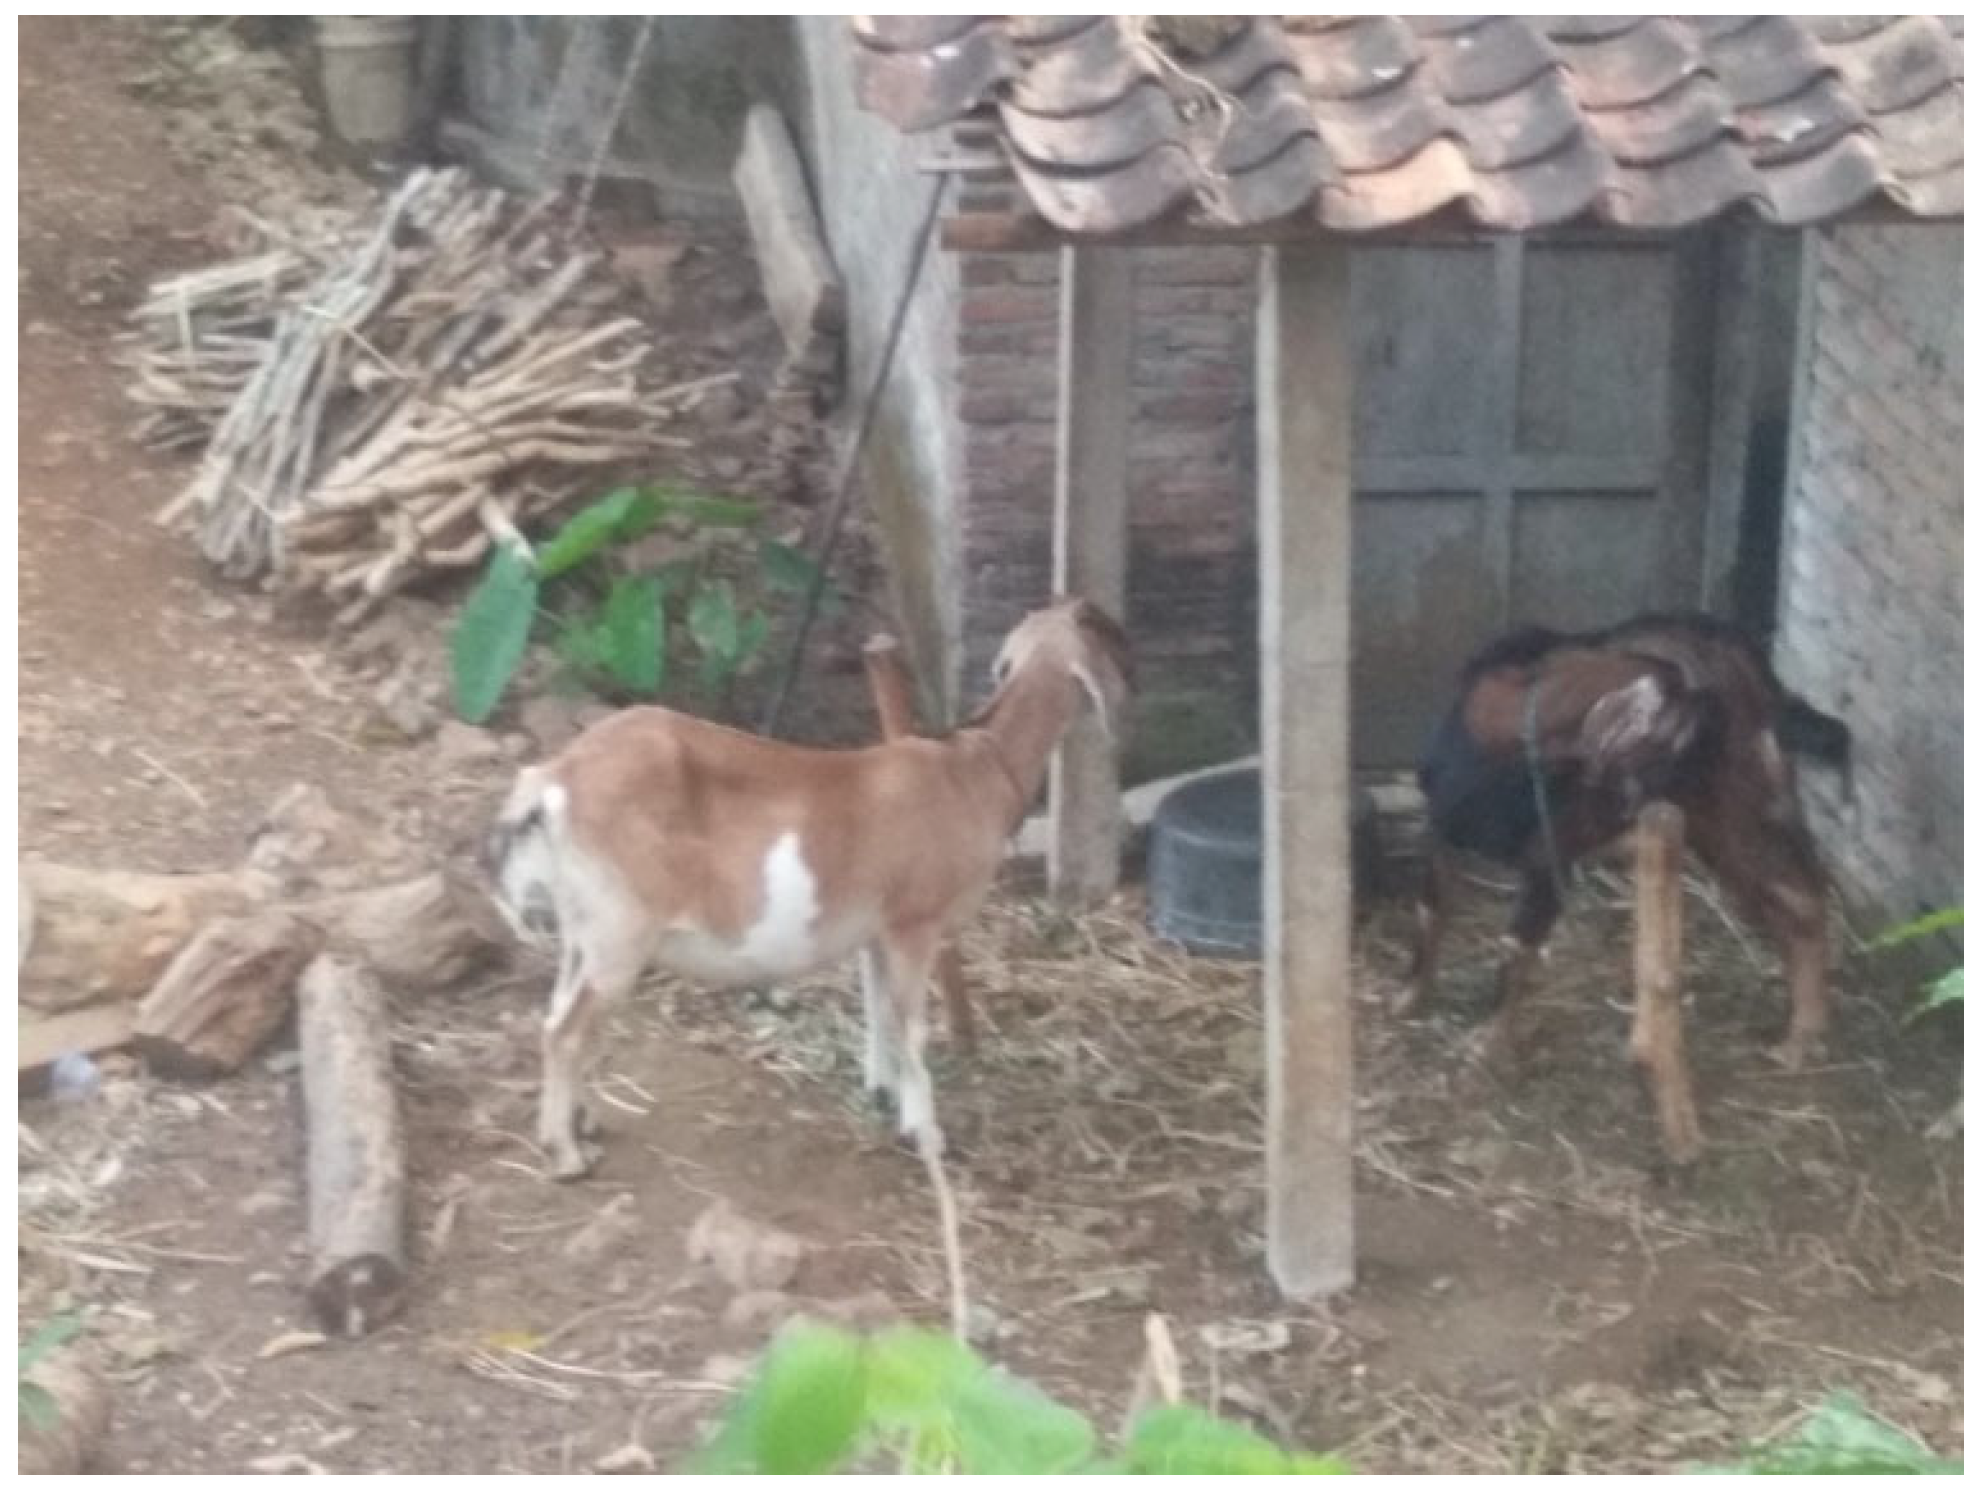
Agricultural and off-farm income account for 15.39% and 80.72% of total household income. Per capita income is IDR6,265,337 per year. The fact that off-farm income account for the larger share suggests that farmers cannot obtain sufficient income only from agriculture due to dryland in the Karst Mountains, which is unsuitable for agricultural activities and a relatively more developed labor market. The amount of remittance received by the farm household is trivial. Farm households usually receive remittance during big holidays such as Eid and New Year’s, also in July when the new school starts. Some households own livestock, which is an asset and a complement to meet the community’s needs in Girisubo. Dryland farmers raise livestock such as cows, goats, and chickens. In raising livestock in
Figure 6, farmers also need help getting forage for feed and providing water.
Household expenditure is the money a resident or a person spends to meet their food needs, expressed in a monthly rupiah.
Table 4 shows the average monthly food expenditure of the respondent’s household. The average food expenditure of respondents is IDR1,373,226. In food expenditure, the food source of carbohydrates, namely rice, is the most significant expenditure compared to other types of food, IDR230,533 or 16.8%. Expenditure on food sources of carbohydrates is significant since it is a staple food for each respondent’s household. This also affects people’s food patterns to meet the need for rice as the primary need, so rice ranks the largest among other types of food groups.
The second order is vegetables, with a monthly expenditure of IDR128,411 (9.35%). Vegetable groups include spinach, kale, cabbage, long beans, beans, chilies, tomatoes, mustard greens, etc. People usually buy vegetables at the market, or if they have a small garden, they usually try to grow vegetables to meet their daily needs. Then, the third most significant type of food expenditure is spices, with a percentage of IDR117,200 (8.53%). Rising prices for onion and garlic spices assist this expenditure. Meanwhile, the respondents’ most significant animal food expenditure in Girisubo was eggs and milk, IDR105,145 (7.65%). The price of eggs and milk tends to be cheaper and easier to obtain than other animal food sources such as beef or fish.
Table 5 shows that the average household expenditure of respondents is IDR1,260,381 per month for non-food expenditures. The most significant non-food expenditure is for water. Water is an essential need for the Girisubo community; when the dry season strikes, people often experience drought, so people have to buy water for cooking, drinking, and bathing.
The second most significant non-food expenditure is education. Most of the respondent households consider education for children to be necessary. The average expenditure on education is IDR147,979 or 11.74% of the average total non-food expenditure. These education costs include tuition fees, stationery, pocket money, transportation, etc. Tuition fees are only valid for high school students or the equivalent, while elementary and junior high schools are free. Generally, the respondents’ children have completed the government program, nine years of compulsory education up to junior high school level. Furthermore, the third largest non-food expenditure is electricity, one of the needs that are no less important, with an IDR147,873 or 11.73%.
3.4. Income Distribution, Rice and Food Consumption
According to the study in
Table 6, when considering the monthly household income per adult equivalent, approximately 63.55% of respondents engaged in dryland farming within the study area have an income below IDR500,000. Out of this group, 52.14% of their income is allocated towards food consumption. These findings indicate that households residing in the Karst Mountains of Girisubo sub-district, Gunungkidul, exhibit a low income level and fall within the medium food insecurity category, as classified by [
38,
39] as 50–65% of their income is spent on food.
Household income plays a crucial role in determining the accessibility of food within a household, thereby influencing consumption patterns and nutritional outcomes. The size of a household directly influences the distribution of income, which in turn impacts the allocation of resources towards food consumption, non-food consumption, and potential savings. Distinctions can be observed in the food consumption patterns between households with upper and lower-middle incomes. Lower-middle income households tend to prioritize consumption of inexpensive calorie sources, often relying predominantly on staple foods, which can have repercussions on their overall nutritional intake. Consequently, unmet food requirements across various food groups can adversely affect health outcomes [
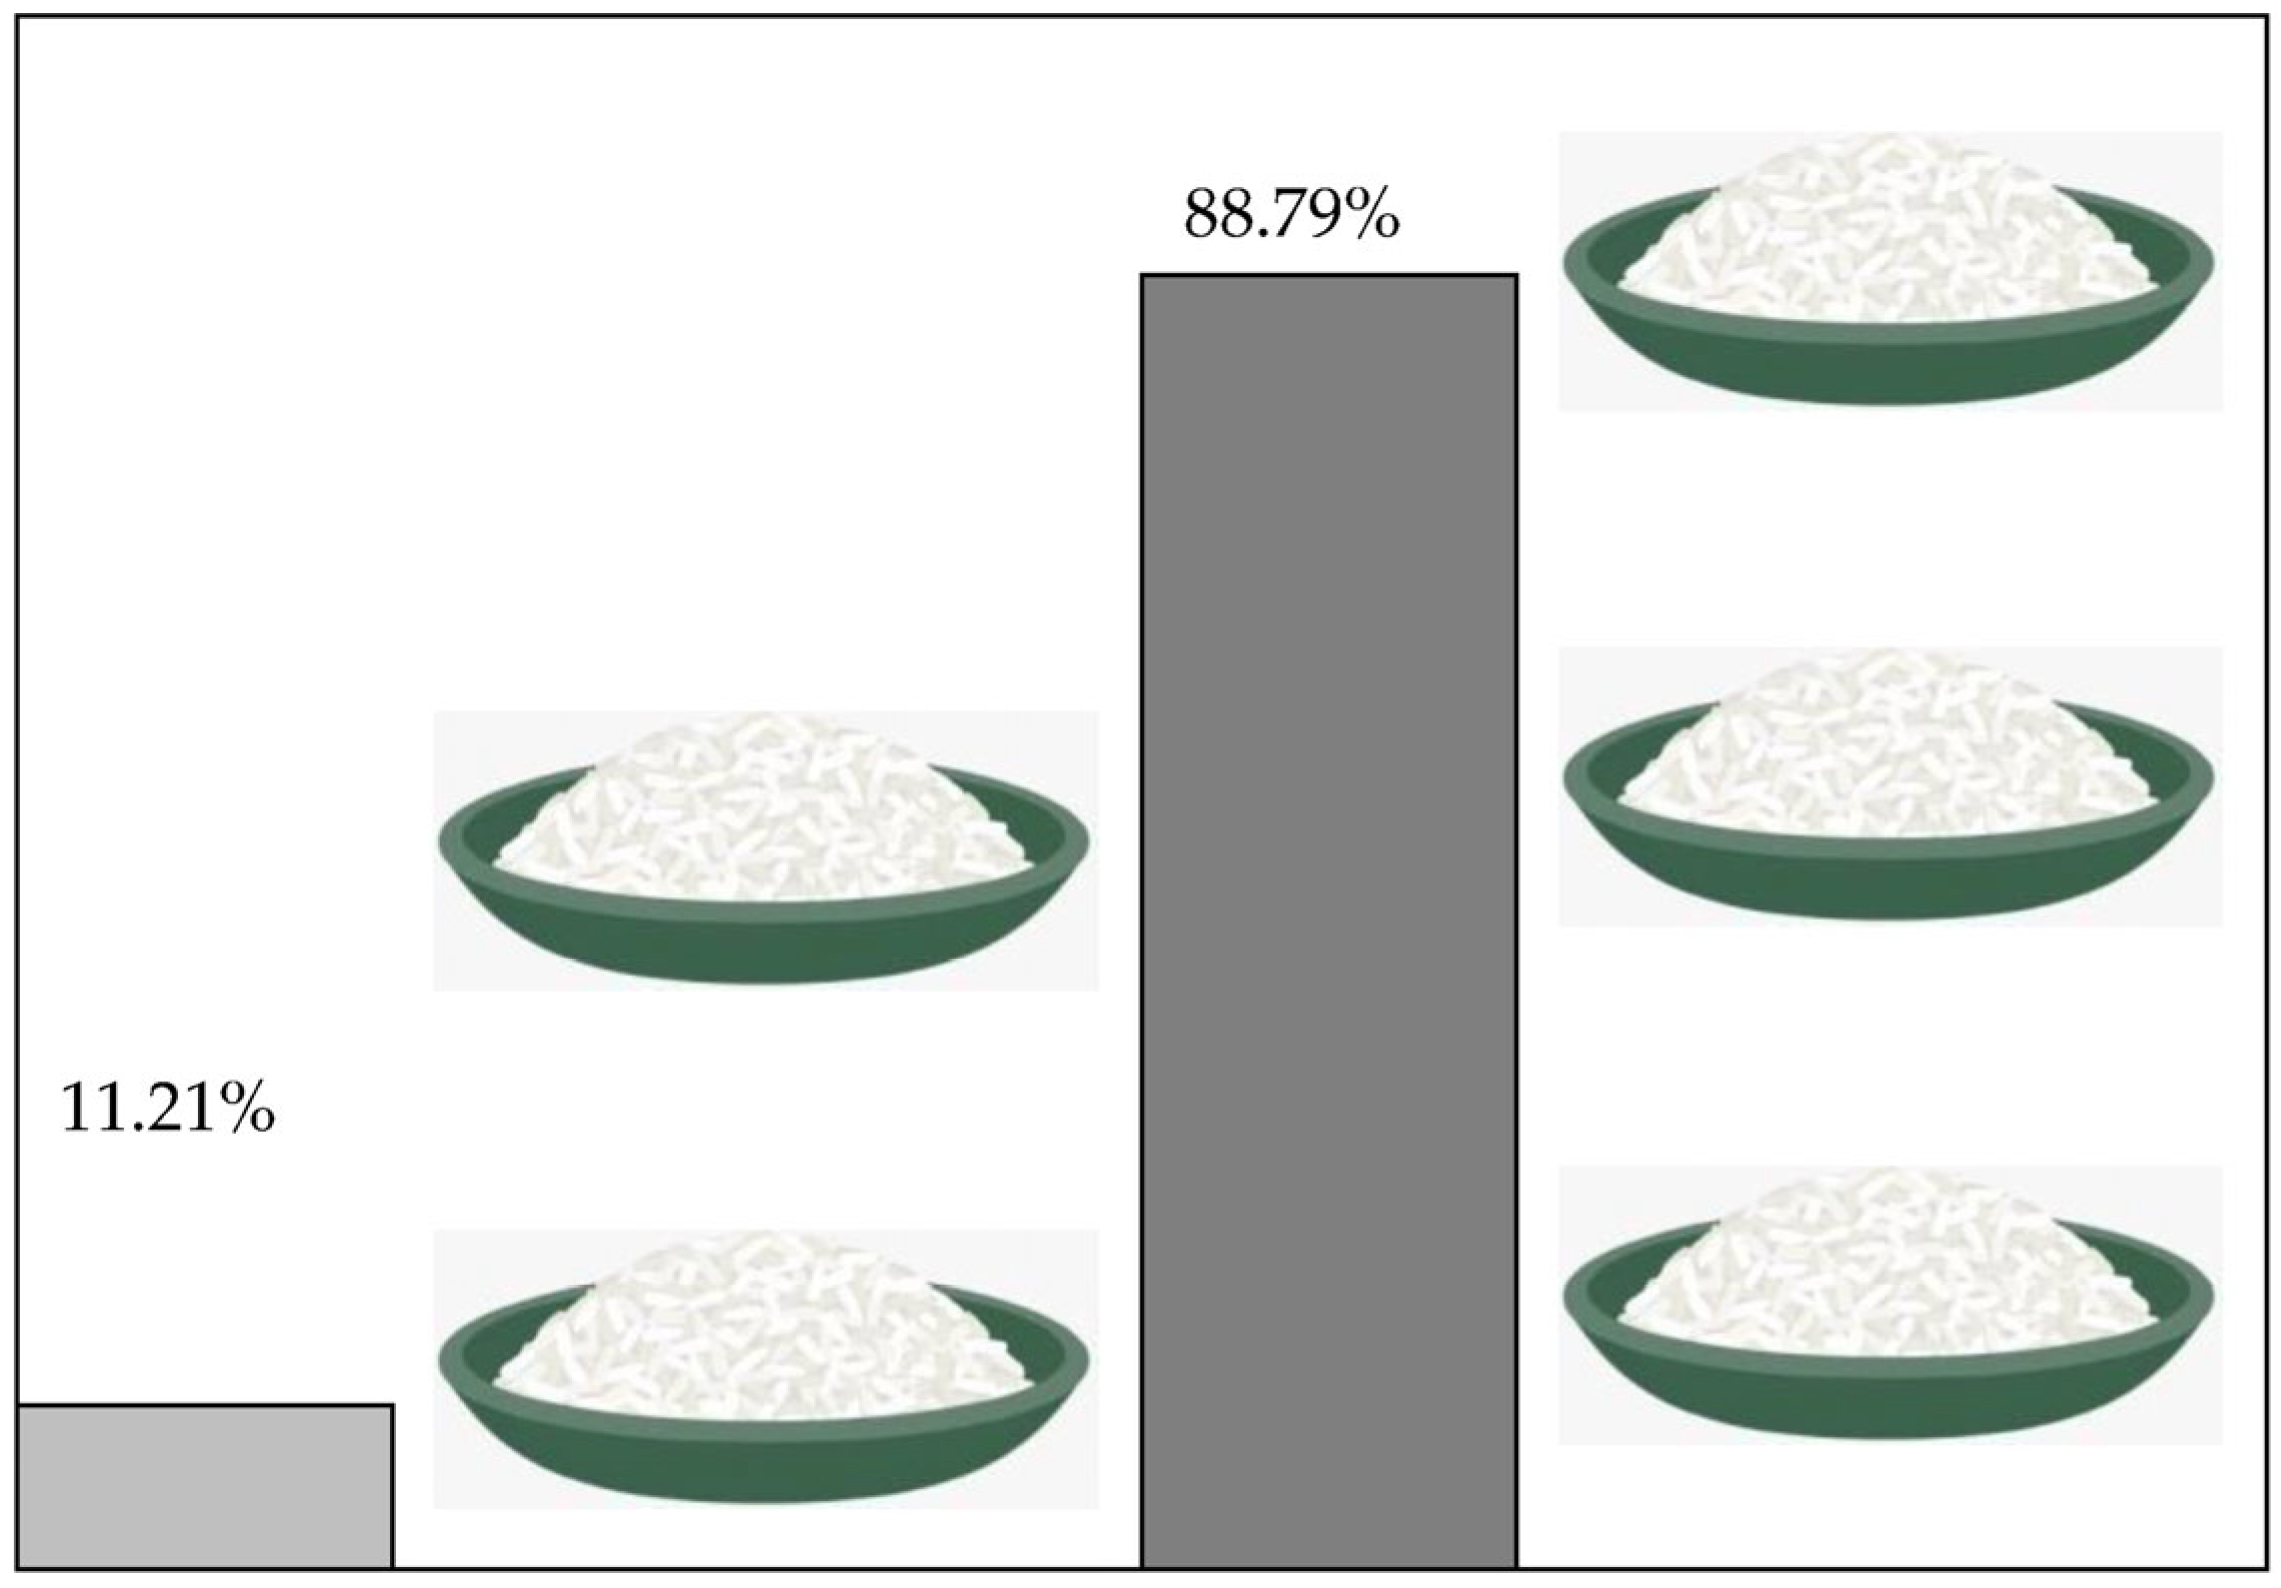
40]. Regarding the dietary habits observed in the study area, the majority of households (88.79%) follow a three-meal-a-day pattern, with rice serving as the staple food. The remaining 11.21% of households consume two meals per day.
Figure 7 provides a visual representation of the frequency of daily meals among the surveyed households.
3.5. The Correlation for Share of Household Expenditure on Food
The Ordinary Least Square (OLS) regression analysis was employed to estimate the correlation pertaining to the share of household expenditure allocated to food. The findings derived from estimating Equation (3) are succinctly presented and summarized in
Table 7.
The variables of household income and production exhibit a negative correlation with the share of household expenditure allocated to food, as indicated by the respective significance levels of
α = 10%. These parameters demonstrate an inverse relationship with the share of household expenditure on food. By increasing household income and production, dryland farming households can reduce the portion of household expenditure for food. This can reduce the level of food insecurity. Increasing the income of dryland farming households is the key to ensuring food security. Household income can be increased by increasing agricultural and non-agricultural income. In previous studies [
6,
25] considering that rice is a normal good, an increase in household income will increase the demand for and ability to buy rice if the production is insufficient for self-consumption; so that households can achieve and maintain food security. However, this research study found that income negatively correlated food expenditure since farmers in this area tend to use the income to increase the productivity of their agricultural land so that production can increase and can be used to fulfill food reserves for farming families. The study by [
41] found that support from the government through policies can open up opportunities for farmers to increase land productivity and contribute to sustainable development.
Farming experience also has a negative correlation with the share of household spending on food. This shows that dryland farmers with extensive farming experience can also know how to deal with water shortages, so the success of their farming business will be higher. As a result, agricultural production is also higher, so farmers can use agricultural production for personal consumption so that spending decreases. The size of agricultural land also negatively correlates with the share of household expenditure on food. Land size has an essential role in agricultural production. The larger the agricultural land area, the higher the dryland farmers’ economic scale, production, and household income. This is by [
42]. Suppose farmers have a larger size of land. In that case, they can increase their income since they can get more opportunities for higher production and reduce household food expenditures since they already have their food reserves.
3.6. Energy Intake and the Associated Factors
Total energy intake rate of farm household members in Girisubo sub-district experience 2728 kcal per capita per day, as can be seen in
Table 8. The higher total energy intake (TEI) from their food consumption is determine by the average needs of energy or daily energy requirements (DER), and hence is also in good condition.
Not just greater energy intake by farm household members, but variation conditions shown by people’s habit of food consumption varies. Therefore, farm households in Girisubo sub-district show that the energy intake value is mainly in good condition (equivalent to about 71.96% of members). The others classifications (good and deficit) in the
Table 9 are consequently 71.96% and 28.04%. Those variations are related to the different food selections and different amounts of these foods [
43].
Despite the average rate of energy intake showing good condition, several farming households do not achieve their energy needs in terms of daily food consumption. Lack of energy fulfillment on food consumption suggests the difficulty of food diversity accessibility and differences in willingness to pay for certain goods. Therefore, several price rates have been included in multiple regression analyses as associated factors.
Based on the results in
Table 10, the number of correlation percentage by all independent variables to the farm household’s energy intake levels per adult equivalent experience is 91% whereas the other 9% is assisted by another variable (which is not analyzed in this study). Most variables mentioned in this study show a significant correlation between the energy intake levels of farm households per adult equivalent (except for seafood prices rate). Additionally, the number of household members shows a negative trend while the other significant variables contribute to a higher energy intake rate. The increased family number suggests not only a higher energy needs rate in a farm household, but that dryland farmers should pay higher food consumption costs to fulfill everyone’s daily energy needs yet. Therefore, additional family members in dryland farmer households show a negative trend. On the other hand, the higher income rate gotten will lead people to fulfill their needs either via food consumption or other means [
44]. Farmers dryland area seems to be the most constant consumption pattern, showing a positive slope of rice, chicken, egg, and cooking oil prices with respect to energy intake rates. Those prices are generally inelastic [
45,
46,
47,
48].
3.7. Protein Intake and the Associated Factors
Protein intake calculation is practically the same as energy calculation except the dietary requirement intake expect 57 kcal and 2100 kcal per day for energy requirement intake otherwise.
Table 11 shows the protein intake average of the farm households in Girisubo dryland. The average of total protein intake by farm households is 204.5 kcal per day. For the protein intake average in household members, it experiences 65.51 kcal per day. Overall, total protein intake (TPI) of farm households does not pass the daily protein requirement (DPR) and only obtains 99.21% of protein average needs.
The detailed information may be explained in the classification of protein intake levels. This data suggests the number of households in every stage condition from members’ consumption. In
Table 12 illustrated farm households in Girisubo dryland determine the same condition which is mostly distributed on good classification for about 63.55% and farm household which experience in deficit protein is 36.45%. Farm households in good condition of energy intake rate are not surely taking care their poor diet quality off so there are several household which could not fulfill the protein need during food consumption habits [
49].
Protein food intake appears to partially structure behavior food patterns and has strong elements of dietary intake with the nutrient profile.
Similar to the energy intake levels in the
Table 13, most variables in this study determine significant correlation for protein intake rate of farm household in Girisubo dryland area but except cooking oil prices variable. The income rate significantly contributes the positive trend to the total protein intake at
α = 10% while the number of household members has a significant negative correlation on the protein intake of farm households in the Girisubo dryland area at
α = 1%. Those all suggest that a higher protein needs rate could be achieved with a higher income rate.
3.8. Household Food Security
The food security status of a household is determined by its ability to meet both the quantity and quality requirements of food consumption, as influenced by food consumption patterns. To assess the quantity and quality aspects, two indicators are utilized: food expenditure consumption and energy intake rate. The distribution of food security conditions among farm households in the Girisubo drylands, classified according to the system proposed by Johnsson and Toole [
30] is presented in
Table 14.
Table 14 describes that household food security in the Girisubo sub-district is still low since most households (70.09%) fall into the undernourished, food vulnerable, and food insecure categories. Farm households with intermediate to high total energy intake have taken higher percentages than intermediate to deficit energy conditions (about 69.16%). However, most of the sufficient households which could fulfill their food or energy needs (around 42 households) spend more of their income on food expenditures. This indicates that households do not have savings since their ability to fulfill daily needs has yet to pass non-food expenditure. Accordingly, the income average will define their ability to fulfill both daily and non-food needs.
Table 14 shows that people or households at the food security level have the highest income rate. Therefore, all of their needs can be achieved. Meanwhile, the worse condition of food security rate, food insecurity, has the lowest income rate, so food consumption in terms of daily needs has yet to be fulfilled.
As dryland farmers, farm households in Girisubo District have to manage their expenditures more since their daily food needs, especially their staple food, have been fulfilled through their crops. They do not need only expenditure management for gaining welfare, but also need to grasp daily food nutrition information for their household members.
4. Conclusions
Due to their low income, households in the Girisubo sub-district, which is characterized by the presence of the Karst Mountains in Gunungkidul, experience a low level of food insecurity. One-third of the dryland farm households sampled in this study have an income of less than or equal to IDR500,000. The number of family laborers, farming experience, household income, farm size, and production negatively impact the share of household expenditure on food. This study suggested that to ensure food security, dryland farm households need to improve those factors.
Farm households in the Girisubo sub-district show that energy intake is mainly in good condition (about 71.96%) and that the deficit classification is around 28.04%. Overall, the income rate, rice price, chicken price, and egg price significantly contribute to a positive trend in the energy or protein intake per adult, while the number of household members has a significant negative correlation for both factors. The other variables have different results for energy and protein intake, and cooking oil price has a significant correlation to energy intake rate whereas seafood price assigns protein intake rate Although the energy intake of farm household members in the Girisubo dryland area exceeds the daily energy requirement (DER), the protein intake does not pass the daily protein requirement (DPR) (it only obtains 99.21% of average protein needs). Whereas the household food security in Girisubo sub-district is still low since most of the households (70.09%) fall into the categories of being undernourished, food vulnerable, and food insecure. Households at the food security level have the highest income rate. Therefore, all of their needs could be achieved.
For future research, strategies are needed to increase energy and protein intake in light of the influential factors in this study, such as income, number of family members, and rice prices rate. In order to increase agricultural production, the government needs to stimulate local farmers in dryland areas to increase on-farm and off-farm productivity to improve household food security. Besides, dryland farmer households need to get assistance from the local government or the private sector to grasp information about good expenditure management and food nutrition fulfillment in improving food security.


