Abstract
As an economically developed region, the Yangtze River Delta region has undergone earth-shaking changes in its rural settlements due to rapid urbanization. For the optimization and adjustment of rural settlements, it is crucial to disclose their distinguishing spatial features and impelling factors. Taking 307 county-level administrative regions in the Yangtze River Delta region as the research object, this study comprehensively uses the landscape index, nearest neighbor index, Moran index, and spatial hot spot detection system to analyze the spatial differentiation characteristics of rural residential location-scale morphology and reveals its driving factors using the optimal parameters-based geographical detector model. According to the findings, rural settlements in the Yangtze River Delta region exhibit an average nearest neighbor index of 0.7417, a Moran’s I of 1.2993 for the number of patches (NP), and a maximum patch density (PD) of 17.25 villages per square kilometer. It has significant characteristics of large-scale village cluster distribution, and the morphology of rural settlements in the southern and northern regions shows apparent differences. The natural environment and social economies, such as elevation, slope, precipitation, and population density, mainly drive the location-scale morphological spatial distribution of rural settlements. At the same time, the interaction between the natural environment, social economy, and location condition factors has a synergistic enhancement effect on the spatial distribution of location-scale morphology of rural settlements.
1. Introduction
Rural population distribution occurs in residential areas, which serve as a comprehensive reflection of the relationship between humans and land [1]. This relationship is influenced by natural, social, and economic factors, both pulling and restricting it [2,3]. In different time frames, the spatial arrangement of rustic settlements has diverse reactions. Its rate of urbanization has surged from 17.92% in 1978 to 63.89% in 2020. China has also changed from a rural society to an urban and rural society [4], which is significantly reflected in the distribution and form of rural settlements. The developed areas along the southeast coast of China are the most typical urbanized areas in China [5,6]. Urban sprawl and rural recession pose intricate and serious challenges as a significant multitude of rural workers relocates to cities [7,8]. Rural settlements need to be effectively regulated and optimized to promote sustainable urban and rural development. Clarifying rural settlements’ spatial differentiation characteristics and driving mechanisms is an important prerequisite to achieving this goal [9,10].
As a basic element of urban and rural development, rural residential areas are key in the urban and rural regional system [11]. European and Asian countries have developed measures such as ‘multifunctional agriculture’ and a series of policies such as the ‘rural industrial revolution’ and ‘new village movement’ to boost rural development momentum [12,13,14]. By guiding the transition of rural areas from farmers’ residences to urban and rural residents’ common residence, rural residential land will be promoted from scattered to centralized layout [15] to strengthen urban–rural relations, bridge the gap between urban and rural areas, and achieve balanced urban and rural development. Scholars at home and abroad have carried out extensive theoretical and practical exploration of the spatial development of rural settlements. Development has progressed from the initial emphasis on qualitatively describing the connection between human settlements and the natural environment [16] to the gradual exploration of the spatial distribution, evolution, and interaction of other elements of rural settlements with the help of 3S technology [17,18,19], and more attention to the impact of social, economic, and political systems on the development of settlements, such as land system, traffic accessibility, economic development, and farmers’ income [20,21,22,23]. In China, many studies start from the space–time view and comprehensive view of geography, from multiple scales such as the whole country, counties, and administrative villages [24,25,26], covering a variety of terrains such as mountains, valleys, basins, and plains [27,28,29,30], using GIS spatial analysis, landscape ecological index analysis, geographically weighted regression, and geographical detector and alternative techniques [31,32,33,34] to analyze the spatial distribution characteristics, spatial evolution process, and driving factors of rural settlements. At present, most of the research on rural residential areas focuses on the spatial units of natural geographical areas, lacks the research results of spatial units of economic geographical areas, and ignores the special impact of the economy on the spatial layout of rural residential areas.
The Yangtze River Delta region represents a typical area in China where urban–rural integration is rapidly taking place [35]. It has a unique geographical environment of plains and mountain areas and presents the characteristics of high economic and ecological value [36]. Exploring the spatial differentiation characteristics and driving factors of rural settlements in this special economic unit is helpful to accurately define the spatial development of rural settlements and guide the spatial optimization decision of rural settlements [37,38,39], which is crucial for the sustainable development of rural settlements in economically developed regions.
To understand the spatial characteristics of rural residential areas in economically developed regions and address the shortcomings of previous studies, this paper focuses on (1) the spatial differentiation characteristics of location, scale, and morphology of rural residential areas in economically developed regions; and (2) using a geographical detector based on optimal parameters to explain the impact of different factors on the spatial variation of rural settlements. This study aims to conduct comprehensive and systematic empirical research on the spatial features of rural settlements in economically developed regions and offer valuable guidance for effectively optimizing and regulating rural settlements.
2. Materials and Methods
2.1. Study Site
Shanghai, Jiangsu Province, Zhejiang Province, and Anhui Province are encompassed within the Yangtze River Delta region (Figure 1). It covers an area of 358,000 square kilometers. Additionally, it is a significant agricultural product-producing area in China and is one of the country’s most dynamic, accessible, and innovative regions for economic development. Positioned at the confluence of the river and the sea, this region is located downstream of the Yangtze River and borders both the Yellow Sea and the East China Sea. The area is home to several ports along the river and the sea. The area is a flat plain created by the Yangtze River’s sedimentation, located prior to its discharge into the sea. It has a low altitude that rarely exceeds 10 m and contains some low hills, such as Huishan, Tianpingshan, Yushan, and Langshan.
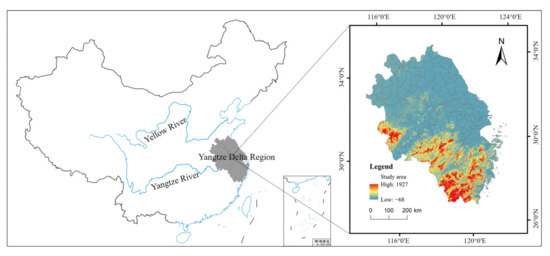
Figure 1.
Location and topographic map of the study area.
The Yangtze River Delta region not only boasts a superior geographical and natural environment but also serves as a typical representative area with frequent interactions between rural development and the urban economy in continuous development. The region’s GDP of CNY 24.5 trillion, accounting for almost a quarter of China’s economic aggregate, is accompanied by an urbanization rate of 75.01% among its resident population and a total population of 235 million as of the end of 2020. Analyzing the characteristics of spatial differentiation and the driving factors in rural settlements can help formulate accurate spatial development strategies and promote the coordinated development of the rural population’s living conditions and social and economic development needs in the Yangtze River Delta region. The research object in this study is all rural settlements in the Yangtze River Delta region, and the statistical unit is the ‘county.’
2.2. Data Source
The primary research data comprise the following: (1) Land use data (Figure 2) and meteorological data from 2020 with a spatial resolution of 30 m, obtained from the Resource and Environmental Science and Data Center of the Chinese Academy of Sciences (http://www.resdc.cn (accessed on 17 April 2022)). The land use data are primarily based on Landsat remote sensing image data from the United States and interpreted through visual analysis. (2) DEM data from the geospatial data cloud platform (http://www.gscloud.cn (accessed on 5 February 2022)), from which elevation and slope data were derived through ArcGIS processing of DEM data. (3) River data sourced from the 1:250,000 national basic geographic database available in the national geographic information resource directory service system (https://www.webmap.cn (accessed on 7 February 2022)). (4) The 2020 study area zoning and road data obtained from the Gaode Map Open Platform. (5) Socioeconomic data such as urbanization rate, non-agriculturalization rate, per capita GDP, and population density from the statistical yearbooks of provinces and municipalities in 2020. All spatial data underwent processing using the ArcGIS 10.7 platform, were uniformly projected with the coordinate system GCS_Krasovsky_1940, and achieved an accuracy of 30 m.
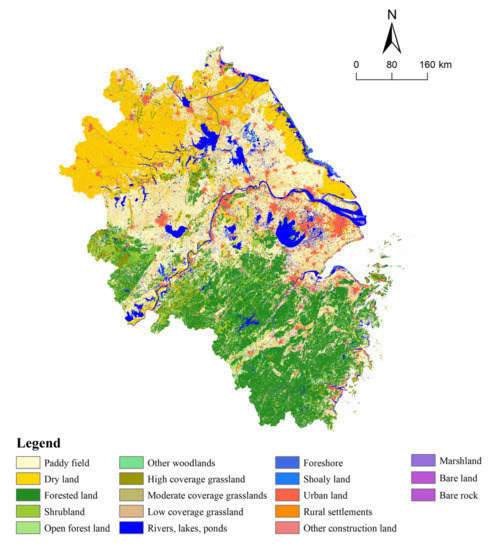
Figure 2.
Spatial distribution map of land use types in the Yangtze River Delta in 2020.
2.3. Study Methods
2.3.1. Landscape Pattern Indexes
Applying the landscape pattern index enabled a quantitative analysis of the location, scale, and shape of rural settlements, thereby revealing their landscape pattern in the Yangtze River Delta region. To conduct this analysis, Fragstats 4.2 was used to calculate patch number (NP), patch density (PD), patch area (CA), mean patch area (MPS), and landscape shape index (LSI), which were selected based on previous research [5,6]. Table 1 presents the significance and features of each landscape index.

Table 1.
Description table of landscape pattern index.
2.3.2. Average Nearest Neighbor Index Measures
The Average Nearest Neighbor (ANN) Index is a commonly used method for determining the spatial distribution pattern of rural settlements, obtained by calculating the average distance between each rural settlement patch’s centroid and its closest neighboring patch. The average nearest neighbor index value is typically distributed within the range of −1 to 1. A value closer to 1 indicates a more clustered distribution, while a value closer to −1 suggests a more dispersed pattern [40]. The calculation formula is as follows.
where represents the average value between each rural settlement point and its nearest point; represents the expected average distance of rural settlement points under the assumption of random mode; refers to the total number of settlements; refers to the distance between settlement points; and refers to the study area.
2.3.3. Moran’s Index Measures
Moran’s index is a statistical measure utilized to assess whether the arrangement of components within the research region follows a clustering, discrete, or random pattern. The calculation of Moran’s I index, Z score, and p-value is necessary to ascertain the index’s significance [41], where the calculation formula is as follows:
where is the deviation between the attribute of i and its average value, is the spatial weight between and , is the total number of elements, and is the aggregation of all spatial weights.
2.3.4. Spatial Hot Spot Detection Analysis
The Getis–Ord Gi* is employed to examine if there are significant variations in high and low values within localized regions, and it has the capability of identifying ‘hot spots’ and ‘cold spots’ using regional visualization techniques [42]. The calculation formula is as follows:
where , , and are the same as above. For the purpose of simplifying understanding and making comparisons easier, is normalized to = , where and are the mathematical expectation and variance of , respectively. If is positive and statistically significant, it indicates that location is a hot spot of high-value agglomeration.
2.3.5. Geographical Detector Analysis
- 1.
- Optimal parameter selection
Geodetector methodology is used to detect spatial heterogeneity and uncover the driving forces responsible for it [43]. The greater the q value of the geodetector, the better the spatial data discretization effect and the better the scale of detecting spatial stratification heterogeneity. With the help of the GD package [44] in R language, based on selecting the optimal parameter, that is, the spatial scale with the largest q value, the driving force of the spatial distribution characteristics of rural residential areas can be detected by using the factor detector and the interactive detector in the geographical detector. Analyzing the impact of each driving factor can be judged more objectively to avoid deviation in the detection results caused by the subjective identification of the optimal scale parameter.
- 2.
- Geodetector method
Based on selecting the optimal parameters, the factor detection in the geographic detector is used to reveal the driving force of a single index on the spatial differentiation characteristics of rural settlements, which is measured by the q value. The calculation formula is as follows:
where represents the degree of the explanatory power of a given factor, and the range of the parameter is between 0 and 1, with 0 indicating no explanatory power and 1 indicating the highest possible level of explanatory power; represents either the stratification of explanatory variables or explained variables; and denote the number of units in layer and the entire region, respectively; and and denote the variance in layer and the Y value of the entire region, respectively. and represent the sum of intra-layer variance and the total variance of the entire region, respectively. The range of is [0, 1], where a higher value indicates a more pronounced spatial differentiation of Y. If the stratification is based on the independent variable X, a greater q value implies a stronger explanatory power of X on the attribute Y, and vice versa.
The interaction detector utilizes the q(Xi ∩ Xj) value obtained from the detection results to determine whether two factors are independent of each other or increase/decrease the explanatory power of the dependent variable in explaining variance (Table 2).
Table 2.
Judgment of interaction type. Adapted from reference [43].
- 3.
- Selection and treatment of driving factors
This study selected ten driving factors (Figure 3) from the three aspects of natural environmental conditions, socioeconomic conditions, and location conditions to investigate the impact of each index on the spatial distribution characteristics of rural settlements at the county level. The selection of these factors was based on existing research [38,45,46] and the principle of data availability while considering the actual situation of the Yangtze River Delta region. Among them, elevation, slope, and precipitation are natural environment factors; urbanization rate, non-agriculturalization rate, per capita GDP, and population density are social and economic condition factors; and distance from the road, distance from town, and distance from water area are location condition factors. It should be noted that the no-data areas are a county unit that has undergone major administrative regional adjustments in 2020. Therefore, they are eliminated in the data statistics stage to avoid the research errors caused by this situation.
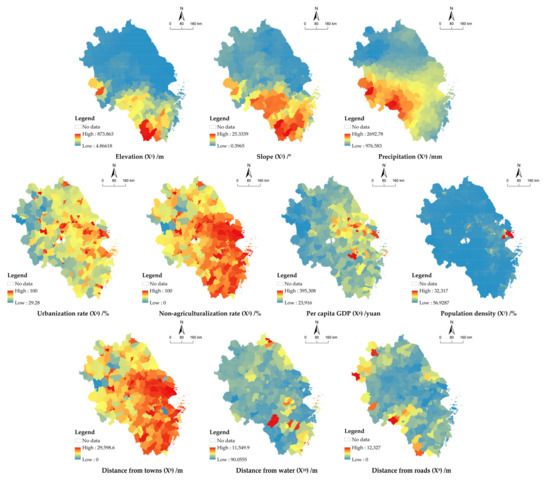
Figure 3.
Driving factors of the spatial differentiation of rural settlements.
3. Results
3.1. Distribution Characteristics of Rural Settlements
3.1.1. Distribution Characteristics of the Location of Rural Settlements
Table 3 presents the comprehensive evaluation results of the distribution pattern of rural settlements within the study area using both the average nearest neighbor index (ANN) and Moran’s I of the number of patches (NP). In the Yangtze River Delta, the ANN of rural settlements was calculated to be 0.741707, with a corresponding Z value of −193.149880 and a p-value much lower than 0.01. This suggests that the probability of randomly generating this agglomeration model is less than 1%. The Moran’s I of the patch area is 1.299310, and the corresponding p-value is far less than 0.01. The spatial distribution pattern of rural settlements in the Yangtze River Delta is highly unlikely to result from random occurrence, as evidenced by the Z score’s absolute value being much greater than its standard deviation and indicating a probability of less than 1%. These results suggest that the spatial distribution of rural settlements in the study area is highly concentrated.
Table 3.
Indicators of spatial distribution pattern of rural settlements in the Yangtze River Delta region.
Further, the patch density (PD) of rural settlements is reflected in space. Thus, the density distribution of rural settlements in the Yangtze River Delta shows apparent spatial heterogeneity (Figure 4). The maximum patch density of rural settlements is 17.25 villages per square kilometer, with an average of 6.61 villages per square kilometer, a typical high-density settlement.
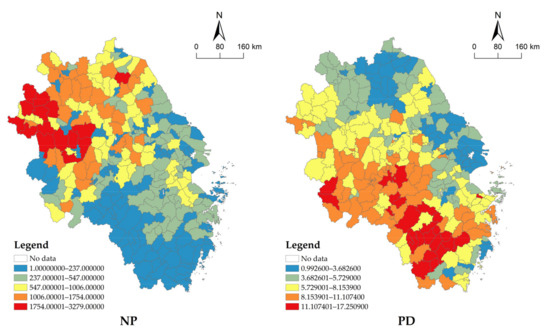
Figure 4.
Spatial distribution of rural settlements NP and PD in the Yangtze River Delta region.
The regional distribution of different settlement densities is different. The rural settlements with the highest density are mainly concentrated in southern Anhui and western Zhejiang, and most of them are located in areas with higher altitudes. The rural settlements with the lowest density are primarily concentrated in northern Jiangsu, southern Jiangsu, and Shanghai. Southern Jiangsu and Shanghai have many industrial enterprises, and urbanization and industrialization are incredibly high. The distribution of high-density rural settlements in the Yangtze River Delta region is primarily concentrated in non-plain areas, whereas low-density areas are primarily distributed in regions with better economic development. In addition, the growth of population size promotes the expansion of some rural settlements and further promotes the formation of low-density rural settlements.
3.1.2. Distribution Characteristics of the Scale of Rural Settlements
This paper uses the global spatial clustering check (Getis–Ord General G) to analyze the rural settlements’ patch area (CA) and judge the spatial distribution pattern of the settlements in the Yangtze River Delta region. The results of the global spatial clustering verification (Table 4) revealed a Z value of 401.337705, significantly higher than 2.28, with a p-value of less than 0.01 and a probability of less than 1% for randomly generating this highly clustering model. The results reveal that the spatial distribution of rural settlements in the region shows significant agglomeration characteristics, with rural settlements highly concentrated in large clusters.
Table 4.
General G estimated value of rural settlement scale in the Yangtze River Delta region.
The patch area (CA) of rural settlements was analyzed for ‘hot spot’ detection (Figure 5), with a greater number of hot spots indicating larger rural settlement scales. Overall, the hot spots of rural settlements were concentrated in the northern half of the Yangtze River Delta, primarily in the northern and central parts of Anhui, the northern and southwestern parts of Jiangsu, and the northeastern part of Zhejiang, where large-scale rural settlements are present. The mean patch area (MPS) generally increased gradually from west to east, indicating a more pronounced expansion of rural settlements in the eastern part of the Yangtze River Delta region.
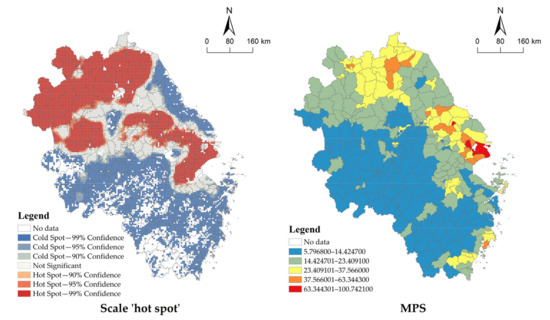
Figure 5.
Spatial distribution of rural settlements scale ‘hot spot’ and MPS in the Yangtze River Delta region.
3.1.3. Distribution Characteristics of Morphology of Rural Settlements
Using the landscape shape index, which measures the complexity of the spatial form of rural settlements, an analysis was conducted to assess the spatial differentiation characteristics of rural settlements in the Yangtze River Delta region, and the LSI was classified into five levels using the natural breakpoint method, as shown in Figure 6. Using LSI analysis at the county level, it was observed that rural settlements exhibit a more complex patch shape in the northern region of the Yangtze River Delta, whereas those in the southern region display a relatively more regular shape. In general, due to the flat terrain, the northern region has a wider range of human activities, and the rural settlements are more fragmented and complex, which requires layout and spatial optimization. The form of rural settlements in the south is greatly restricted by the terrain, the natural foundation of human transformation is lesser in quantity, the land use is tenser, the texture of rural settlements is inherited, and ecological protection and construction control are needed more. The county differences revealed by SHAPE_MN indicate that the patch morphology of rural settlements in the Yangtze River Delta region becomes increasingly complex from inland to coastal areas. In less-developed regions, rural settlements have limited ability to expand outward, resulting in a relatively regular form. The more developed the economy, the more opportunities for settlements to develop outward, the wider the scope of human activities, and the more complex the form of rural settlements.
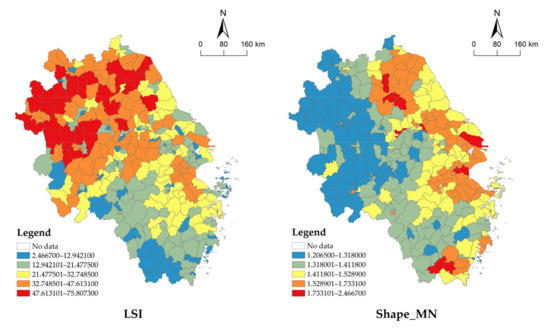
Figure 6.
Spatial distribution of rural settlements LSI and SHAPE_MN in the Yangtze River Delta region.
3.2. Driving Factors of Rural Settlements’ Distribution
3.2.1. Optimal Discretization for Geographical Detectors
To identify the driving factors behind the different characteristics of rural settlements, the geographical detector was employed. Patch density (PD), patch area (CA), and the landscape shape index (LSI) were selected to characterize the location, scale, and morphological spatial distribution of rural settlements, respectively. Taking the optimal parameter selection of the driving factors of PD as an example (Figure 7), when the urbanization rate (X4) is divided into seven categories via the quantile classification method, the q value is the largest, so the urbanization rate (X4) is classified as seven categories by standard deviation as the optimal parameter selection. Similarly, per capita GDP (X6) is classified into six categories by the natural breakpoint method as the optimal parameter selection. Different driving factors use the spatial discretization method with the largest q value as the optimal parameter of the geodetector. The optimal classification of CA and LSI is shown in Figure A1 and Figure A2.
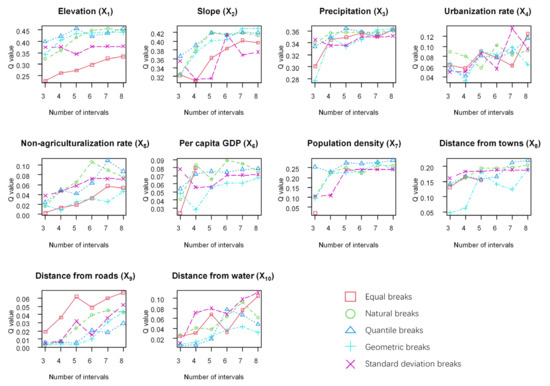
Figure 7.
Statistical chart of different classification methods and q values of the number of partitions in terms of PD.
3.2.2. Single-Factor Detection
The analysis using a geographic detector identified X1 (elevation), X2 (slope), and X3 (precipitation) as the primary determinants of the spatial distribution of rural settlements, with corresponding q values of 0.4457, 0.4292, and 0.3646, respectively (Table 5). The second is X7 (population density) and X8 (distance from road); q values are 0.2877 and 0.2195, respectively. This shows that rural settlements are often distributed in plain areas with abundant water and grass. The spatial arrangement of rural settlements within the Yangtze River Delta region is mainly determined by the advantages and disadvantages of agricultural production conditions, which are shaped by various factors, including topography and precipitation. The agglomeration effect introduced by the increase in population continues to promote economic development, followed by the improvement in transportation infrastructure, accelerating the flow of material and information and the distribution of rural settlements along the road.
Table 5.
Results of driving factors of rural settlements from the perspectives of location-scale morphology in the Yangtze River Delta region.
X2 (slope), X1 (elevation), and X3 (precipitation) have the strongest influence on the scale distribution of rural settlements, with q values of 0.5171, 0.4866, and 0.3823, respectively. This is followed by X7 (population density), X5 (non-agricultural rate), and X9 (distance from town), with q values of 0.2949, 0.2937, and 0.2383, respectively. This further indicates that the traditional plain area has sufficient water resources, low altitude, and a suitable living environment, which is more conducive to the agglomeration and expansion of rural settlements. Labor-intensive industrial restructuring and urban–rural road connectivity have introduced opportunities for the development of rural settlements. Rural settlements need more land to carry out new production functions.
X2 (slope), X1 (elevation), and X7 (population density) were the main driving factors of the spatial distribution of rural settlements, and the q values were 0.5018, 0.5198, and 0.3583, respectively. Followed by X5 (non-agricultural rate) and X9 (distance from town), q values were 0.2980, 0.2886. This indicates that topography and elevation remain fundamental factors in influencing the spatial structure of rural settlements. The more densely the areas are populated, the faster the urbanization process. In order to give full play to the potential of production, rural settlements actively adapt to economic development. However, the industrial structure and infrastructure level of rural settlements differ, so the development direction is different, and the morphological diversity is gradual.
In summary, the distribution pattern of rural settlements in the studied region’s space is influenced by various factors, including the natural environment, socioeconomic factors, and regional accessibility. Among them, the natural environment, such as elevation and slope, plays a basic supporting role. The social and economic factors, such as population density and non-agricultural rate, as well as the location conditions, such as the distance from the road and the distance from the town, play a role in promoting the development of rural settlements in different directions.
3.2.3. Double-Factor Detection
The interaction of location-scale morphological factors of rural settlements in the Yangtze River Delta was detected (Figure 8), and it was found that each interaction driving effect showed a nonlinear enhancement or two-factor enhancement effect. This suggests that the combined effect of factors has a more significant impact on the spatial distribution characteristics of rural settlements in the Yangtze River Delta region than the individual effects of each factor.
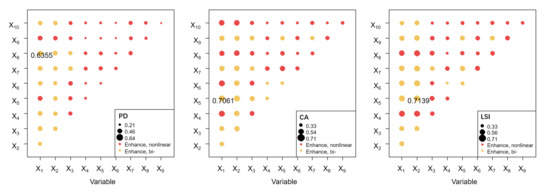
Figure 8.
Interaction detection results of spatial distribution characteristics of rural settlements from the perspectives of location-scale morphology in the Yangtze River Delta region.
The influence of X1 (elevation) ∩ X8 (distance from town) on the location distribution of rural settlements is the strongest, and the highest q value is 0.6355, indicating that the dual-factor enhancement in elevation and distance from town in the Yangtze River Delta region has the most positive effect on the location distribution of rural settlements. At the same time, the interaction between all socioeconomic factors and location accessibility factors is nonlinearly enhanced; that is, the progress of socioeconomic development and the improvement in regional accessibility have the most significant impact on the construction and development of rural settlements.
X1 (elevation) ∩ X5 (non-agricultural rate) is the primary motivating factor for the distribution pattern of rural settlements in space, and the q value is 0.7061. Among them, the interaction between X8 (distance from town) and X10 (distance from water area) and other factors are nonlinear enhancement. This shows that the combined effect of elevation and the non-agriculturalization rate is the primary motivating factor for the progress of the rural settlement scale. The scale of rural settlements is primarily influenced by natural environmental factors, both in terms of limitations and support. Enhancing regional accessibility, based on the progress of socioeconomic factors, can effectively boost the scale of rural settlements.
The driving effect of X2 (slope) ∩ X5 (non-agriculturalization rate) on the spatial distribution of rural residential morphology is the largest, with the highest q value of 0.7139, and the interaction between X8 (distance from town) and other factors is nonlinear. This shows that the combined effect of slope and non-agriculturalization rate in the Yangtze River Delta region has a major influence on the morphology of rural settlements, but the location conditions have a more obvious effect on the scale and morphology of rural settlements.
4. Discussion
4.1. Regional Differences in Rural Settlements Distribution in the Yangtze River Delta
The Yangtze River Delta region is considered one of the most prosperous regions in China. The spatial distribution of rural settlements is mixed with both traditional and modern characteristics. The driving factors of the spatial distribution of rural settlements also reflect their uniqueness and complexity. In the Yangtze River Delta area, rural settlements are predominantly clustered densely in the north of Anhui, the northeast of Zhejiang, and the central region of Jiangsu, along the Yangtze River. These areas have flat terrain, abundant water and soil resources, good agricultural and industrial economic development, and a certain scale, which are attractive to the surrounding rural settlements. The outward extension of the city drives the development of the surrounding rural settlements. The rural settlements gradually urbanize after forming a certain population size and land use scale. The northern part of the Yangtze River Delta has a developed agricultural economy and a low degree of spatial intensification. The rise in township enterprises spawned by rural industrialization has led to the rapid transformation of the rural population, industry, and land in central Jiangsu and southeastern Zhejiang. The transformation of the production mode has led to the rapid expansion of land and the formation of high-value agglomeration patches of rural settlements in the Yangtze River Delta. The spatial intensification and layout of rural settlements in the Yangtze River Delta region are higher and more reasonable in areas with rapid economic development. The patches are more compact and regular, and the infrastructure and public service facilities are more convenient.
4.2. Influence Mechanism of Rural Settlements Distribution in the Yangtze River Delta
The analysis results of the geographical detector model show that the natural environment determines the ecological background and resource endowment of rural settlements in the Yangtze River Delta region. In areas with abundant precipitation, water resources are often extremely rich. The water system network composed of ponds, rivers, and lakes has become the basic condition for breeding rural settlements, followed by a large number of construction projects of farmland water conservancy facilities, as well as continuous improvement in the canal system. The developed water system network connects a series of settlements and gradually grows into an urban and rural system with a watershed as a unit. Simultaneously, as a typical economically developed area, the Yangtze River Delta region has accelerated the flow and reallocation of factors such as population, capital, and technology. As rural settlements draw closer to the urban center, the flow of production factors becomes more convenient, leading to an acceleration in the level of urbanization. The continuous improvement in transportation facilities and the increase in demand for production and housing land have promoted the outward expansion of rural settlements with a good economic foundation [35,36] and absorbed other small rural settlements. Both expansion and contraction coexist, exerting a significant impact on the scale and shape of rural settlements in the Yangtze River Delta area.
4.3. Spatial Optimization of Rural Settlements and Rural Revitalization in the Yangtze River Delta Region
Clarifying the spatial distribution characteristics and driving mechanism of rural settlements is the key to optimizing the layout of rural development, which contains the interaction law of the rural human–land relationship. Only by correctly understanding the natural social and economic operation logic under the spatial representation of rural settlements can we scientifically formulate the layout of industrial development, optimize the living environment of rural settlements, promote the harmonious development of man and nature, and promote the rural revitalization strategy’s implementation. Based on the analysis, when optimizing the space of rural settlements in the Yangtze River Delta in the future, on the one hand, it is necessary to strengthen the leading role of central towns, strengthen the allocation of regional public service facilities, and promote the circulation of resource factors. According to the development advantages of rural settlements, the development strategy should be formulated according to the classification; the broken land resources should be integrated; the expansion and contraction of rural settlements should be flexibly regulated; and the production, life, and ecological space should be rationally planned to improve people’s living standards. On the other hand, we should also pay attention to the ecological background of this region, strengthen the characteristics of the integration of urban and rural spatial patterns, and give priority to the development of a green, low-carbon economy from the principle of ecological environment protection, create beautiful villages, and promote the sustainable development of water village civilizations.
5. Conclusions
Using the Yangtze River Delta as a case study, this study examines the spatial patterns of rural settlements using the nearest neighbor index, Moran’s index, spatial hot spot analysis, and spatial prosody measurement. The geographical detector model, utilizing optimal parameters, was applied to uncover the driving factors of spatial differentiation among rural settlements in the economic region. The results show that the rural settlements in the Yangtze River Delta show significant agglomeration characteristics. The rural settlements in the Yangtze River Delta region exhibit a significant agglomeration distribution, with an average nearest neighbor index of 0.7417 and a Moran’s I of the NP of 1.2993. The spatial pattern of settlement densities varies significantly across different regions. The maximum density is 17.25 villages per square kilometer, with an average of 6.61 villages per square kilometer. The non-plain areas of southern Anhui and western Zhejiang predominantly have high-density settlements, whereas the regions primarily consisting of Jiangsu and Shanghai, which have a relatively more developed economy, exhibit low-density settlements. The large-scale rural settlements are mainly concentrated in the northern and central regions of the Yangtze River Delta, as well as in the eastern region. MPS is gradually increasing from west to east and is greatly affected by the economy. In terms of morphology, rural settlements in the northern part of the Yangtze River Delta exhibit a more complex patch shape, while those in the southern part have a more regular patch shape. Using the geographic detector model based on the optimal parameters can avoid the deviation of the detection results caused by the subjective identification of the optimal scale parameters so as to judge the contribution of a driving factor more objectively. The natural environment, social economy, and location conditions all influence the location, scale, and form of rural settlements in the Yangtze River Delta region. Its spatial distribution is mainly driven by the natural environment, such as elevation; slope; precipitation; and the social economy, such as population density. Factors interact synergistically, resulting in an amplified effect. The interaction between the natural environment and location accessibility has the most prominent influence on location distribution. The interaction between the natural environment and social economy has the most prominent influence on scale and form.
Author Contributions
Conceptualization, T.Y.; methodology, T.Y. and S.Y.; software, T.Y.; validation, T.Y. and S.Y.; formal analysis, T.Y. and S.Y.; investigation, T.Y. and S.Y.; resources, T.Y. and S.Y.; data curation, T.Y. and S.Y.; writing—original draft preparation, T.Y.; writing—review and editing, T.Y. and S.Y.; visualization, T.Y. and S.Y.; supervision, T.Y. and S.Y.; project administration, T.Y.; funding acquisition, T.Y. and S.Y. All authors have read and agreed to the published version of the manuscript.
Funding
This work was supported by the 13th Five-Year Key Special Project of the Ministry of Science and Technology of the Ministry of Science and Technology, ‘Green and Livable Villages and Towns Technology Innovation’, No. 2018YFD1100304.
Institutional Review Board Statement
Not applicable.
Informed Consent Statement
Not applicable.
Data Availability Statement
The datasets generated during and/or analyzed during the current study are available from the corresponding author upon reasonable request.
Conflicts of Interest
The authors declare no conflict of interest.
Appendix A
In the process of using geographic detectors, different spatial data dispersion methods and different interval number combinations have a significant impact on the q value. Figure A1 and Figure A2 show the q values of each factor in different classification methods and the number of partitions when detecting the spatial distribution of CA and LSI in rural settlements. The classification and zoning method with the largest q value is used as the optimal parameter of the geographic detector in this study.

Figure A1.
Statistical chart of different classification methods and q values of the number of partitions in terms of CA.

Figure A2.
Statistical chart of different classification methods and q values of the number of partitions in terms of LSI.
References
- Li, N.; Jiang, S. Study on Spatial Pattern of Rural Settlements in Wuling Mountainous Area Based on GIS. Wirel. Pers. Commun. 2018, 102, 2745–2757. [Google Scholar] [CrossRef]
- Zhou, L.; Wang, J. Review of Research on Layout Optimization of Rural Settlements in China. China Popul. Resour. Environ. 2015, 25, 59–68. [Google Scholar]
- Li, X.; Yang, H. The change of rural settlements and their future development patterns. Econ. Geogr. 2017, 37, 1–8. [Google Scholar] [CrossRef]
- Liu, S.; Wang, Y. From native rural China to urban-rural China: The rural transition perspective of China transformation. Manag. World 2018, 34, 128. [Google Scholar]
- Tan, Z.; Guan, Q.; Lin, J.; Yang, L.; Luo, H.; Ma, Y.; Tian, J.; Wang, Q.; Wang, N. The response and simulation of ecosystem services value to land use/land cover in an oasis, Northwest China. Ecol. Indic. 2020, 118, 106711. [Google Scholar] [CrossRef]
- Liang, X.; Guan, Q.; Clarke, K.C.; Chen, G.; Guo, S.; Yao, Y. Mixed-cell cellular automata: A new approach for simulating the spatio-temporal dynamics of mixed land use structures. Landsc. Urban Plan. 2021, 205, 103960. [Google Scholar] [CrossRef]
- Zhang, T.; Zhang, F.; Xie, Z.; Huang, J. Spatial pattern evolution of rural settlements in mountainous areas of ethnic minorities in Yunnan Province under background of precise poverty alleviation. Trans. Chin. Soc. Agric. Eng. 2019, 35, 246–254. [Google Scholar]
- Feng, Y.; Yang, Q. Research on evolution and its effects of rural residential land’ spatial pattern. Hum. Geogr. 2015, 30, 7–11. [Google Scholar] [CrossRef]
- Li, C.; Wu, Y.; Gao, B.; Wu, Y.; Zhen, K.; Li, C. Spatial differentiation and driving factors of rural settlement in plateau lake: A case study of the area around the erhai. Econ. Geogr. 2022, 42, 220–229. [Google Scholar] [CrossRef]
- Yang, K.; Song, Y.; Xue, D. Spatiotemporal change of rural settlement land in the Loess Plateau and influencing factors. Resour. Sci. 2020, 42, 1311–1324. [Google Scholar] [CrossRef]
- Liu, Y. The basic theory and methodology of rural revitalization planning in China. Acta Geogr. Sin. 2020, 75, 1120–1133. [Google Scholar]
- Long, H.; Ma, L.; Zhang, Y.; Qu, L. Multifunctional rural development in China: Pattern, process and mechanism. Habitat Int. 2022, 121, 102530. [Google Scholar] [CrossRef]
- Barrett, B.F. Environmentalism in periods of rapid societal transformation: The legacy of the Industrial Revolution in the United Kingdom and the Meiji Restoration in Japan. Sustain. Dev. 1999, 7, 178–190. [Google Scholar] [CrossRef]
- Sonn, J.W.; Gimm, D.-W. South Korea’s Saemaul (New Village) movement: An organisational technology for the production of developmentalist subjects. Can. J. Dev. Stud. 2013, 34, 22–36. [Google Scholar] [CrossRef]
- Chen, X.; Zhang, X.; Liang, D. The Practice of Rural Development and Build in Foreign Countries’ Urbanization and its Enlightenments to China. World Reg. Stud. 2005, 3, 13–18. [Google Scholar]
- Trewartha, G.T. Types of rural settlement in colonial America. Geogr. Rev. 1946, 36, 568–596. [Google Scholar] [CrossRef]
- Clark, J.K.; McChesney, R.; Munroe, D.K.; Irwin, E.G. Spatial characteristics of exurban settlement pattern in the United States. Landsc. Urban Plan. 2009, 90, 178–188. [Google Scholar] [CrossRef]
- Ristić, D.; Vukoičić, D.; Milinčić, M. Tourism and sustainable development of rural settlements in protected areas-Example NP Kopaonik (Serbia). Land Use Policy 2019, 89, 104231. [Google Scholar] [CrossRef]
- Zhang, Y.; Dong, C.; Liu, J.; Ye, J. Analysis on distribution characteristics of residential areas—A case study of Qiangtang natural reserve. Sci. Surv. Mapp. 2014, 39, 76–78. [Google Scholar] [CrossRef]
- Long, H.; Liu, Y.; Wu, X.; Dong, G. Spatio-temporal dynamic patterns of farmland and rural settlements in Su–Xi–Chang region: Implications for building a new countryside in coastal China. Land Use Policy 2009, 26, 322–333. [Google Scholar] [CrossRef]
- Oldfield, P. Rural settlement and economic development in Southern Italy: Troia and its contado, c. 1020–c. 1230. J. Mediev. Hist. 2005, 31, 327–345. [Google Scholar] [CrossRef]
- Holmes, J. Policy issues concerning rural settlement in Australia’s pastoral zone. Aust. Geogr. Stud. 1985, 23, 3–27. [Google Scholar] [CrossRef]
- Antrop, M. Landscape change and the urbanization process in Europe. Landsc. Urban Plan. 2004, 67, 9–26. [Google Scholar] [CrossRef]
- Li, T.; Long, H.; Liu, Y.; Tu, S. Multi-scale analysis of rural housing land transition under China’s rapid urbanization: The case of Bohai Rim. Habitat Int. 2015, 48, 227–238. [Google Scholar] [CrossRef]
- Tu, S.; Long, H.; Zhang, Y.; Ge, D.; Qu, Y. Rural restructuring at village level under rapid urbanization in metropolitan suburbs of China and its implications for innovations in land use policy. Habitat Int. 2018, 77, 143–152. [Google Scholar] [CrossRef]
- Yanbo, Q.; Guanghui, J.; Yuting, Y.; Qiuyue, Z.; Yuling, L.; Wenqiu, M. Multi-scale analysis on spatial morphology differentiation and formation mechanism of rural residential land: A case study in Shandong Province, China. Habitat Int. 2018, 71, 135–146. [Google Scholar] [CrossRef]
- Su, S.; Zhang, Q.; Zhang, Z.; Zhi, J.; Wu, J. Rural settlement expansion and paddy soil loss across an ex-urbanizing watershed in eastern coastal China during market transition. Reg. Environ. Change 2011, 11, 651–662. [Google Scholar] [CrossRef]
- Li, H.; Song, W. Expansion of rural settlements on high-quality arable land in Tongzhou District in Beijing, China. Sustainability 2019, 11, 5153. [Google Scholar] [CrossRef]
- Jiang, W.; Deng, Y.; Tang, Z.; Cao, R.; Chen, Z.; Jia, K. Adaptive capacity of mountainous rural communities under restructuring to geological disasters: The case of Yunnan Province. J. Rural. Stud. 2016, 47, 622–629. [Google Scholar] [CrossRef]
- Wang, C.; Liu, Y.; Kong, X.; Li, J. Spatiotemporal decoupling between population and construction land in urban and rural Hubei province. Sustainability 2017, 9, 1258. [Google Scholar] [CrossRef]
- Conrad, C.; Rudloff, M.; Abdullaev, I.; Thiel, M.; Löw, F.; Lamers, J. Measuring rural settlement expansion in Uzbekistan using remote sensing to support spatial planning. Appl. Geogr. 2015, 62, 29–43. [Google Scholar] [CrossRef]
- Ma, X.; Zha, X. Spatial structure evolvement and impact factors of rural settlements in the Qinba Mountain area: A case study of Ningqiang county in Shaanxi province, China. Mt. Res. 2020, 38, 726–739. [Google Scholar] [CrossRef]
- Chen, Y.; Xie, B.; Li, X.; Deng, C. Study of settlement spatial evolution and its space relationship with arable land in Chang-Zhu-Tan region. Hum. Geogr. 2015, 30, 106–112. [Google Scholar] [CrossRef]
- Liu, Y.; Yang, R.; Li, Y. Potential of land consolidation of hollowed villages under different urbanization scenarios in China. J. Geogr. Sci. 2013, 23, 503–512. [Google Scholar] [CrossRef]
- Ma, Z.; Song, W.; Wang, J.; Chen, Y.; Xiong, Y. The development level, evolution and influencing factor of urban-rural integration in the Yangtze River Delta. J. Nat. Resour. 2022, 37, 1467–1480. [Google Scholar] [CrossRef]
- Fang, L.; Cai, J.; Liu, Y.; Yuan, H.; Li, C. Dynamic evolution of ecosystem service value in Yangtze River Delta and analysis on the driving factors. J. Ecol. Rural. Environ. 2022, 38, 556–565. [Google Scholar] [CrossRef]
- Li, H.; Song, W. Pattern of spatial evolution of rural settlements in the Jizhou District of China during 1962–2030. Appl. Geogr. 2020, 122, 102247. [Google Scholar] [CrossRef]
- Zhu, B.; Li, H.; Hu, Z.; Wen, Y.; Che, J. An Evaluation and Optimization of the Spatial Pattern of County Rural Settlements: A Case Study of Changshu City in the Yangtze River Delta, China. Land 2022, 11, 1412. [Google Scholar] [CrossRef]
- Zhao, W.; Jiang, C. Analysis of the Spatial and Temporal Characteristics and Dynamic Effects of Urban-Rural Integration Development in the Yangtze River Delta Region. Land 2022, 11, 1054. [Google Scholar] [CrossRef]
- Zhao, H.; Wei, J.; Miao, C.; Wu, P. Spatial differentiation of historical and cultural cities, towns and villages in Yellow River basin. J. Arid. Land Resour. Environ. 2021, 35, 70–77. [Google Scholar] [CrossRef]
- Lalor, G.C.; Zhang, C. Multivariate outlier detection and remediation in geochemical databases. Sci. Total Environ. 2001, 281, 99–109. [Google Scholar] [CrossRef] [PubMed]
- Bian, Z.; Ma, X.; Gong, L.; Zhao, J.; Zeng, C.; Wang, L. Land use prediction based on CLUE-S model under different non-spatial simulation methods: A case study of the Qinhuai River Watershed. Sci. Geogr. Sin. 2017, 37, 252–258. [Google Scholar]
- Wang, J.; Xu, C. Geodetector: Principle and prospective. Acta Geogr. Sin. 2017, 72, 116–134. [Google Scholar] [CrossRef]
- Song, Y.; Wang, J.; Ge, Y.; Xu, C. An optimal parameters-based geographical detector model enhances geographic characteristics of explanatory variables for spatial heterogeneity analysis: Cases with different types of spatial data. GIScience Remote Sens. 2020, 57, 593–610. [Google Scholar] [CrossRef]
- Lin, J.; Lei, J.; Wu, S.; Yang, Z.; Li, J. Spatial pattern and influencing factors of oasis rural settlements in Xinjiang China. Geogr. Res. 2020, 39, 1182–1199. [Google Scholar]
- Jian, Y.; Gong, J.; Luo, Y.; Li, B. Analysis on the land evolution of rural settlement and its main control factors in Guangdong Province. J. Ecol. Rural. Environ. 2021, 37, 155–163. [Google Scholar] [CrossRef]
Disclaimer/Publisher’s Note: The statements, opinions and data contained in all publications are solely those of the individual author(s) and contributor(s) and not of MDPI and/or the editor(s). MDPI and/or the editor(s) disclaim responsibility for any injury to people or property resulting from any ideas, methods, instructions or products referred to in the content. |
© 2023 by the authors. Licensee MDPI, Basel, Switzerland. This article is an open access article distributed under the terms and conditions of the Creative Commons Attribution (CC BY) license (https://creativecommons.org/licenses/by/4.0/).