Article

Cashew Nut Shell Liquid as an Anticorrosive Agent in Ceramic Materials

by
Kelson de Sousa Leite
1,2,
Antônio Alves de Carvalho, Jr.
1,2,
Paulo Ronaldo Sousa Teixeira
1 and
José Milton Elias de Matos
2,3,*
1
Ceramic Materials Laboratory, Federal Institute of Education, Science, and Technology of Piauí—IFPI, Av. Pedro Freitas, 1020-São Pedro, Teresina 64019-368, PI, Brazil
2
Technology Center—UFPI, Materials Science and Engineering, Federal University of Piauí—UFPI, Teresina 64064-260, PI, Brazil
3
Chemistry Department, Federal University of Piaui—UFPI, Teresina 64049-550, PI, Brazil
*
Author to whom correspondence should be addressed.
Sustainability 2023, 15(11), 8743; https://doi.org/10.3390/su15118743
Submission received: 15 April 2023 / Revised: 7 May 2023 / Accepted: 13 May 2023 / Published: 29 May 2023
(This article belongs to the Topic Sustainable Built Environment)

Abstract

:
One of the significant challenges of the ceramics industry is to increase the corrosion resistance of ceramic materials, and the study of this corrosion requires a detailed investigation using several characterization methods, such as the knowledge of technological properties including the absorption, apparent porosity, and mechanical resistance of these ceramic materials. This corrosion resistance can be further improved by using a protective coating on the surface of ceramic materials, such as cashew nut shell liquid (CNSL), which has been used as a green, environmentally friendly corrosion inhibitor. This work investigated the inhibitory action of CNSL on the corrosion of ceramic materials. Clay from the Brazilian Northeast was used in a simulated seawater environment at room temperature for the immersion corrosion test. Sets of prismatic specimens bathed in CNSL were immersed in a corrosive solution and compared with other samples without CNSL immersed in a corrosive environment. At the end of 70 days in corrosive solution, the ceramic specimens without CNSL showed signs of wear on the surface, associated with an average mass loss of 20 mg and an average corrosive rate of 0.017 mm/year. On the other hand, the bodies bathed in CNSL showed no mass loss, reinforcing the potential of CNSL as a protective agent against corrosion.

1. Introduction

Science and technology constantly develop, leading to increasingly demanding and intelligent technology. These requirements include higher mechanical strength for material-saving construction, lightweight energy-saving components, and better quality for excellent safety and longer service life. After all, cost-effectiveness plays a crucial role [1].
In the past, ceramic materials contributed to this innovation process [2], mainly due to the characteristics and properties of ceramics. According to Bauer [3], “Ceramics is the artificial stone obtained by processes that start with extracting and preparing the raw material, moulding, drying and firing of clays. This designation comprises all inorganic, non-metallic materials, generally obtained after thermal treatment at elevated temperatures”. The requirements for a successful application of ceramic materials include the proper choice of raw materials and care in manufacturing processes.
Ceramics have been subjected to various applications and are being considered for others where high hardness, corrosion resistance, and high-temperature stability combined with low specific gravity are required [4].
The ceramics industry is one of the oldest due to the ease of manufacture and abundant raw material—clay. Clays are natural, earthy materials with high plasticity when mixed with water. A clay can be composed of a clay mineral or a mixture of clay minerals, which are hydrated Al, Fe, and Mg silicates, with layered crystalline structures consisting of continuous sheets of SiO4 tetrahedra, hexagonally arranged, condensed with sheets octahedral formations of tri and divalent metal hydroxides [5].
Ceramic materials have spread to several fields, such as electronic components, dentistry, and power plants [6]. In many cases, ceramic materials are exposed to highly aggressive service environments, such as those found in industrial chemical manufacturing and processing, where traditional metallic materials tend to be unusable due to highly rapid corrosion. Under such extreme conditions, ceramic materials are more efficient than metals [7]. Deterioration in ceramic materials corresponds to failures in their structural components due to the chemical reactions of ceramics with substances in the environment. One must consider the responses between ceramic materials and solutions or gases at the interface [7].
The actual study of corrosion—its causes, effects, and means of minimization—is not as common in the field of ceramics as it is in the field of metallurgy [8]. Increasing ceramic materials’ corrosion resistance is one of the industry’s greater challenges [9]. This resistance depends on the properties of the aggressive medium, the conditions of the corrosion process, and the chemical composition and structure of the ceramic [10]. Corrosion can occur by gases, acid solutions, bases, salts, molten salts, glass, slag, metals, fresh- or seawater, etc. [10].
A recent IMPACT (International Measures of Prevention, Application, and Economics of Corrosion Technologies) study initiated by NACE International, now the AMPP (Association for Materials Protection and Performance), found that worldwide, the cost of corrosion is USD 2.5 trillion and that replacing more than one million miles (1.6 million km) of corroded water and sewer pipes would cost USD 2.1 trillion [11]. For ceramic materials, the cost of corrosion can be minimized based on the properties of the raw material (clay) [8]. Baboian [12] estimated that with proper clay selection and knowledge of its chemical composition, the cost of corrosion could be reduced by 15% to 25%. Chipera [13] states that this choice can be made by quantifying clay minerals. Thus, the success of this selection is obtained by understanding the complexities of ceramic materials and the effect that the environment has on them [14]. These complexities involve the thermodynamics and kinetics of chemical reactions, which, if well understood, solve most corrosion problems in any field of study [8].
Determining the general corrosion mechanism requires a detailed investigation using various characterization methods [8]. The knowledge of ceramic materials’ technological properties (absorption, apparent porosity, and resistance) allows this investigation [3].
A corrosion inhibitor is a substance that, when added to a corrosive environment, significantly decreases the corrosion rate caused by the environment by retarding anodic or cathodic electrochemical processes [15]. Studies [16] show that synthetic inhibitors or inorganic substances such as cadmium, dichromates, and borates help prevent corrosion but are highly unsafe for the environment due to their toxicity [17].
Green corrosion inhibitors have potent corrosion-attenuating properties and are environmentally safe and non-toxic [18]. Tran et al. [19] used 2%wt of L-arginine with different amounts of trisodium phosphate dodecahydrate as an ecological corrosion inhibitor in the simulated concrete pore (SCP) in solution with 3.5%wt of NaCl to mitigate the corrosion of steel rebar. Li Huang et al. [20] explored the potential of procyanidin C1 (PCC1), isolated from the abandoned culture of Uncaria laevigata, as a green corrosion inhibitor in industry, investigating the corrosion inhibition performance of PCC1 in an HCl medium through electrochemical tests and theoretical calculations. According to the authors, the electrochemical test confirmed that 160 mg/L of PCC1 showed a high corrosion inhibition efficiency (97.70%) for Q235 steel exposed to 1 M HCl for 120 h, proving to be an excellent and sustainable corrosion inhibition performance. In Ienascu et al. [21], extracts rich in glucosinolates from some Brassicaceae, such as broccoli, cabbage, and cauliflower, were obtained by an ecologically sound extraction method and evaluated to establish their in vitro antioxidant activities and anticorrosive effects on steel. According to the results, the electrochemical measurements in 0.5 M H2SO4 showed that the extracts acted as mixed-type inhibitors, proving their ability to inhibit corrosion in a concentration-dependent manner, with a remarkable inhibition efficiency (92.05–98.33%) achieved for concentrated extracts of broccoli, cauliflower, and black radish.
Cashew nut shell liquid (CNSL) is a dark, almost black, caustic, and flammable liquid obtained from the cashew nut, an achene of variable length and width, smooth leathery shell and honeycombed mesocarp [22]. Based on the chemical composition and the use of different extraction methods, CNSL was classified into two types: natural CNSL and technical CNSL. For natural CNSL, solvent extraction techniques such as supercritical carbon dioxide or subcritical water, commonly called Soxhlet extraction, are used so that the original composition of CNSL can be obtained without disturbance. Natural CNSL is mainly composed of anacardic and cardol acids. The technical CNSL, usually produced on an industrial scale, is obtained through the thermal–mechanical process (hot oil process). The hot CNSL is used to heat the raw nuts to approximately 190 °C, mainly consisting of cardanol, cardol, and polymeric material. CNSL has enormous applicability potential in various fields, including pharmaceuticals, resins, coating materials, laminates, adhesives, biofuel derivatives, and insecticides [23]. In Furtado [24], the cashew nut shell liquid and the residue of its distillation were evaluated as corrosion inhibitors for API P110 carbon steel in 15% HCl. Nunes et al. [25] evaluated the anticorrosive protection of 316L steel in a saline environment, promoted by an electro-synthesized polymer obtained from CNSL. Its corrosion inhibitory characteristics were also studied in carbon steel in a hydrochloric acid environment.
Given the potential anticorrosive activity of CNSL and its low cost (around USD 0.50 or EUR 0.46 per kilogram), in this work, the inhibitory action of CNSL on the corrosion of ceramic materials was investigated. The specimens were made using clay from Northeastern Brazil. After being sintered at 800 °C, they were immersed in an aqueous solution, simulating an environment of seawater at room temperature, and subjected to a corrosion test by immersion. Our results confirmed CNSL as an efficient green corrosion inhibitor on the surface of ceramic materials subjected to saline environments.

2. Materials and Methods

2.1. Clay Extraction, Preparation, and Characterization

The clay characterized in this work was extracted from Santa Alice Farm, in the Jenipapo River Basin, located in Piauí (Northeastern Brazil), 135 km from the capital Teresina with the following geographic coordinates: 42°00′58.3″ W and 04°56′20.8″ S. The matter was collected at a depth of around 3 m, as the owner excavated the site with a hydraulic excavator (Figure 1a). The sample was prepared (Figure 1b) with previous drying for the characterization tests following the Brazilian Association of Technical Standards (ABNT) NBR 6457: 2016 [26].
The granulometry and plasticity tests followed the ABNT NBR 7180: 2016 [27] and ABNT NBR 7181: 2018 [28] standards. For the granulometric study, 100 g of the clay sample was passed through the ABNT No. 325 sieve (0.045 mm mesh), and the retained residue was dried in an oven at 70 °C and sieved through a set of sieves according to the NBR NM standard ISO 565: 1997 [29].
For the plasticity study, a portion of the clay sample was passed through the ABNT No. 80 sieve [29], mixing distilled water until it turned into a plastic mass. Then, the resulting mass was placed in a plastic bag so as not to lose moisture and left to rest for 24 h to be analyzed in the Casagrande apparatus [30]. A 60 g portion of the sample of this material was used to determine the moisture content, while 10 g was used to determine the plasticity limit according to ABNT NBR 7180:2016 [27].
The chemical composition of clay was determined by X-Ray Fluorescence (XRF) using the Shimadzu EDX-720 equipment, with a detection limit for Na (11) to U (92) greater than 0.1%. The sample was dried in an oven for 24 h at 110 °C and then heated to 1000 °C for 60 min to evaluate loss on ignition. The mineralogy was studied by X-ray diffraction (XRD) using a Shimadzu diffractometer, XRD 6000 model with CuKα (λ = 0.15406 nm), collecting diffraction data in 2θ from 5° to 80°, and a power of 1.5 kW with a step size of 2°/min−1. The identification of the crystalline phases was carried out through a search of the database with the X’Pert system, HighScore Plus.
The thermograms of the clay used in this work were obtained via simultaneous module TGA/DTG-DTA, SDT Q600 model from TA Instrument in a Nitrogen atmosphere to investigate the variation of sample weight as a function of temperature, as well as the endothermic and exothermic processes during the heating step. The analysis was conducted in the ambient temperature range up to 1000 °C, under a heating rate of 10 °C/min using a platinum crucible for a sample amount of approximately 10 mg.

2.2. CNSL Infrared

The cashew nut shell liquid was obtained from Euroalimentos Ltd.a (km 28, BR-343, Altos 64290-000, PI, Brazil) through the thermal–mechanical process [22]. A small portion of technical CNSL was submitted to analysis of absorption spectroscopy in the infrared region with Fourier transform (FTIR) to highlight the prominent absorbance bands obtained for this material. The test was carried out using a Perkin Elmer spectrum 100, from 400 to 4000 with resolution 4, on a KBr wafer. The analysis was carried out in the ATR module using zinc selenide crystal.

2.3. Specimens—Preparation, Firing, and Immersion in CNSL

The prismatic specimens were prepared according to the ABNT NBR 10611:2011 [31], using clay in a hydraulic press at 35 MPa (Figure 2a), in which, after the confirmation process, its wet masses were obtained. After this process, the specimens were taken to the oven for 24 h for drying (Figure 2b). After drying in an oven, the specimens’ dimensions and the dry mass were measured. Then, the samples were sintered in a muffle furnace, from room temperature (25 °C) to a maximum temperature of 800 °C, with a step of 5 °C/min (Figure 2c). After obtaining the sintered specimens, each specimen’s dimensions and burning mass were measured again (Figure 2d). The bodies were cleaned according to ASTM G1:03(2017)e1 [32] standard; that is, they were first washed with water containing a non-bleaching cleaning detergent, using an abrasive softer than ceramics, followed by a process of degreasing with a non-chlorinated volatile solvent such as acetone and air drying. Finally, they were taken to a drying oven to ensure the bodies were dehydrated. After this process, the bodies were packed with laminated paper and stored in a dry place.
The volume of 400 mL of CNSL was poured into a beaker (sufficient for complete immersion of the specimens) and heated at 180 ± 2 °C (Figure 3a,b). This temperature was chosen based on the approximate temperature (180 °C) of the conversion of natural CNSL into technical CNSL. Then, the specimens were removed from the drying oven at 110 °C and immersed in the CNSL for 10 min (Figure 3c). The CNSL and the samples were previously heated to accelerate the chemical reactions of the parts curing and reduce the humidity of the specimens [33]. After immersion in LCCC, the specimens were dried, wrapped in paper towels to remove excess oil, and packed again with laminated paper in a dry place (Figure 3d).

2.4. Corrosion Testing—Standards, Test Preparation, and Execution

As ABNT does not have standards for immersion testing of ceramic materials, tests in Brazil are based on international standards such as those of the American Society for Testing and Materials (ASTM) and the National Association of Corrosion Engineers (NACE). The immersion corrosion tests used in this work mainly obeyed the international standard NACE TM0499-2009 [34], which deals with the immersion corrosion test of ceramic materials. According to this standard, many test methods for exposing metallic specimens to corrosive environments can also be used successfully for specimens manufactured from ceramic materials. These test methods are provided in several existing standards for laboratory and field evaluation, as follows: ASTM G1 [32], ASTM G4 [35], and NACE TM0169/G31-21 [36].
The solution choice was based on the ASTM D1141:98 standard (2021) [37], which addresses standard practice for surrogate ocean water preparation. Blue Treasure® Reef Sea Salt for marine aquariums was used as it meets the requirements of the standard mentioned above (Table 1). The volume of approximately 1 liter of test solution was based on the estimate of the minimum preferred ratio between the test solution volume and the average surface area of our test specimens, which, according to ASTM G31-21 [36], is 0.20 mL/mm2.
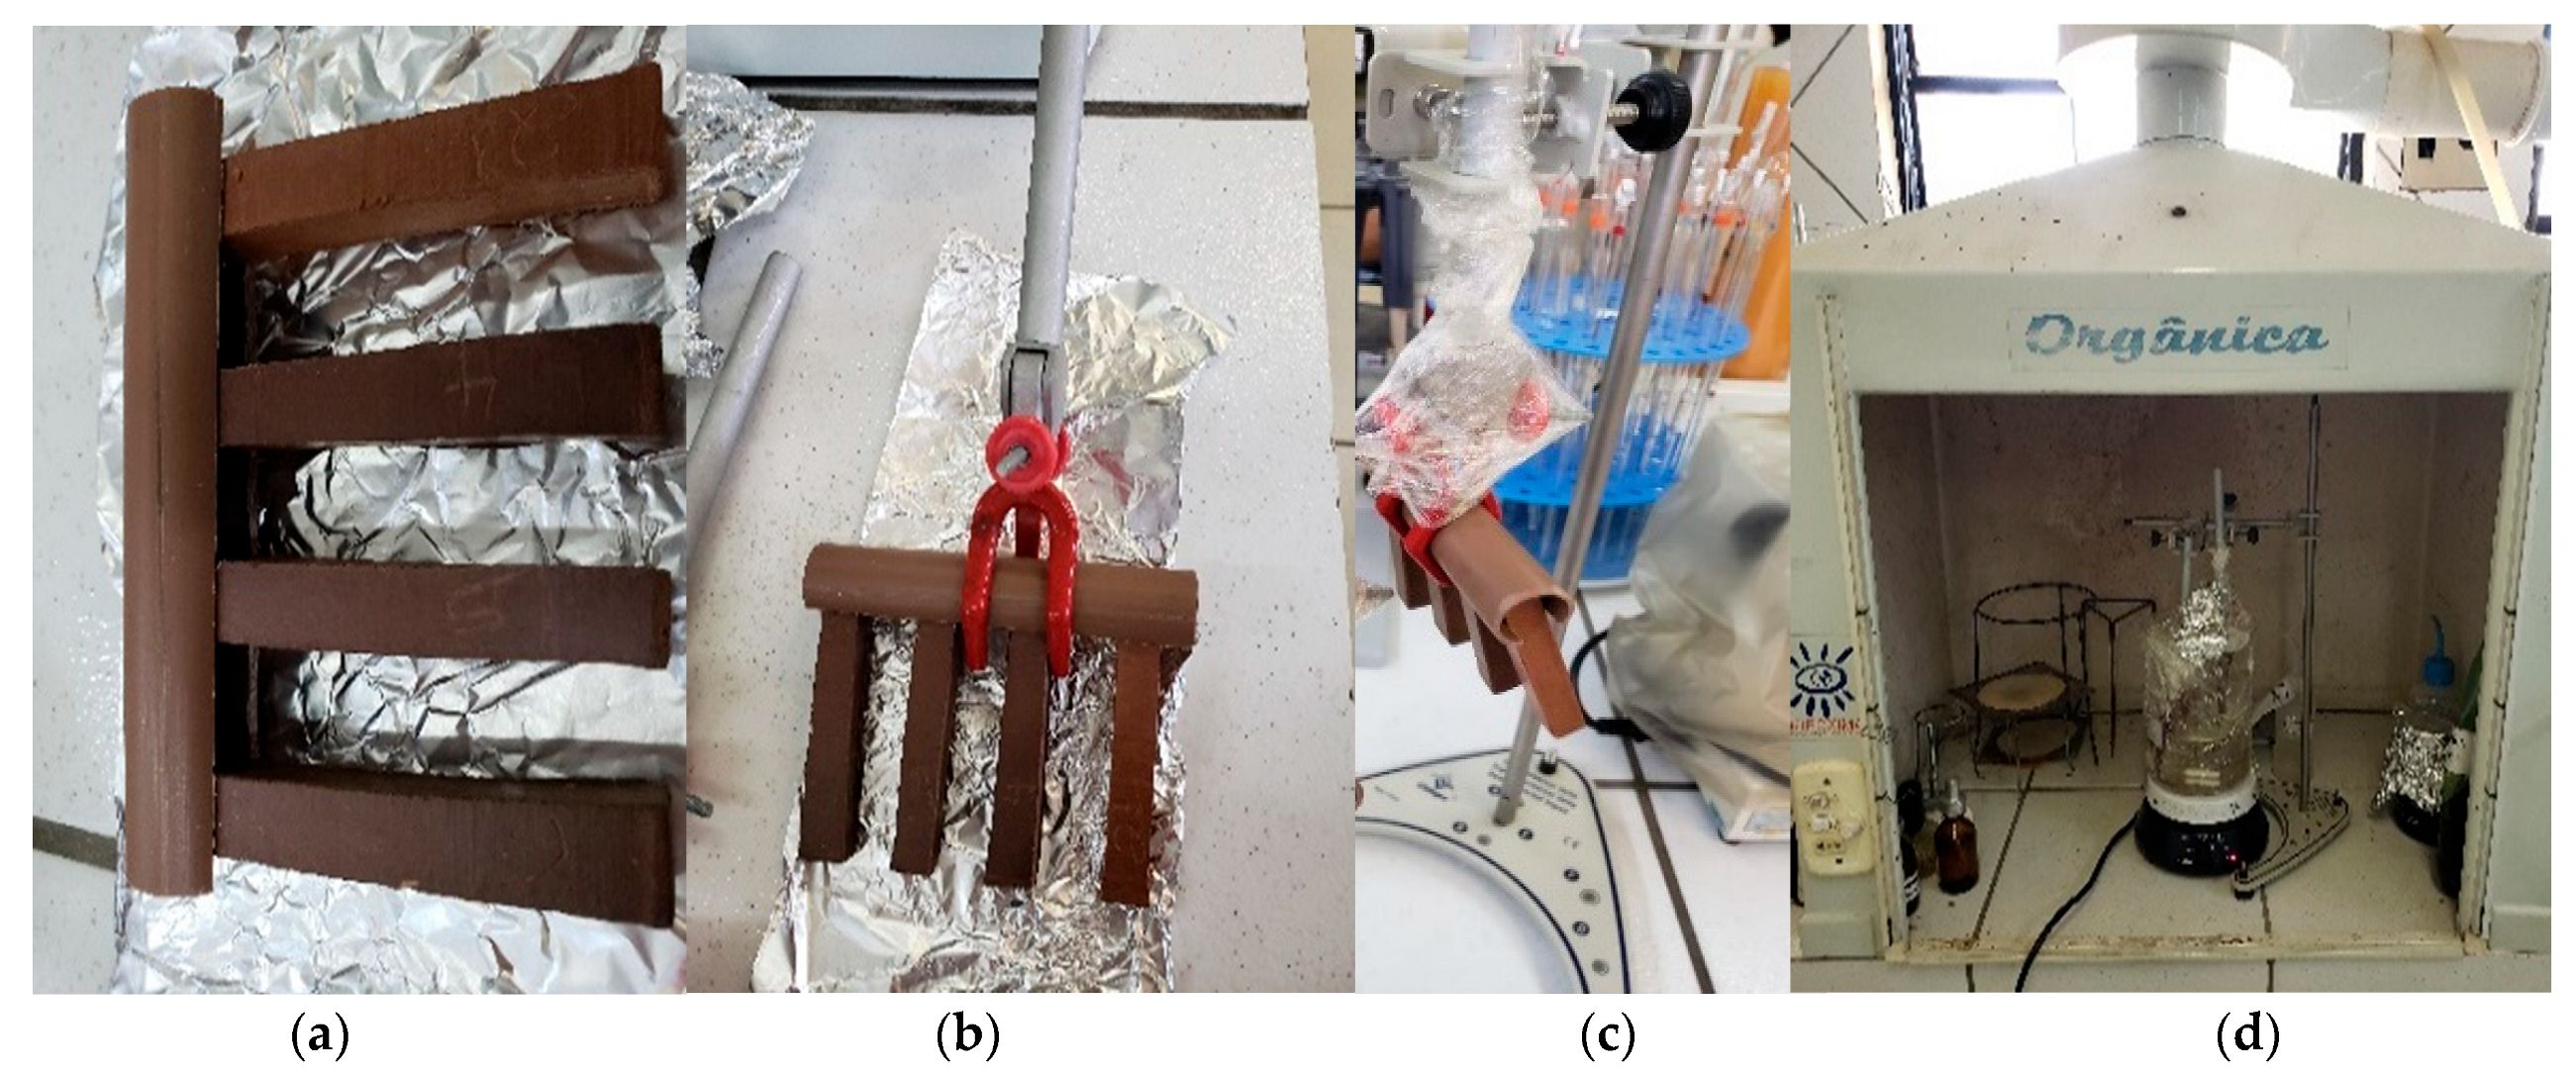
Many types of vessels can be used to perform exposure tests on ceramic specimens. Most of the time, they are the same ones used for metals. Guidelines for such equipment are provided by NACE standard TM0169/G31-21 [36]. Based on the requirements of the relevant standards, a simple apparatus was created with a glass beaker on a magnetic stirrer, supported by claws for the specimens, for immersion at room temperature (25 °C) (Figure 4a–c). As the time of exposure to the corrosive environment was long term, the beaker was isolated with a transparent plastic film to avoid evaporation and contamination of the solution (Figure 4d).
The exposure period must be long enough to accurately determine general and localized corrosion effects. As per NACE standard TM0169 [36], as the corrosion loss rate is generally not linear with time, the test samples must be exposed for at least three periods of increasing time to estimate the kinetics of the corrosion process, and based on this, periods of 18, 32, and 70 days were chosen.
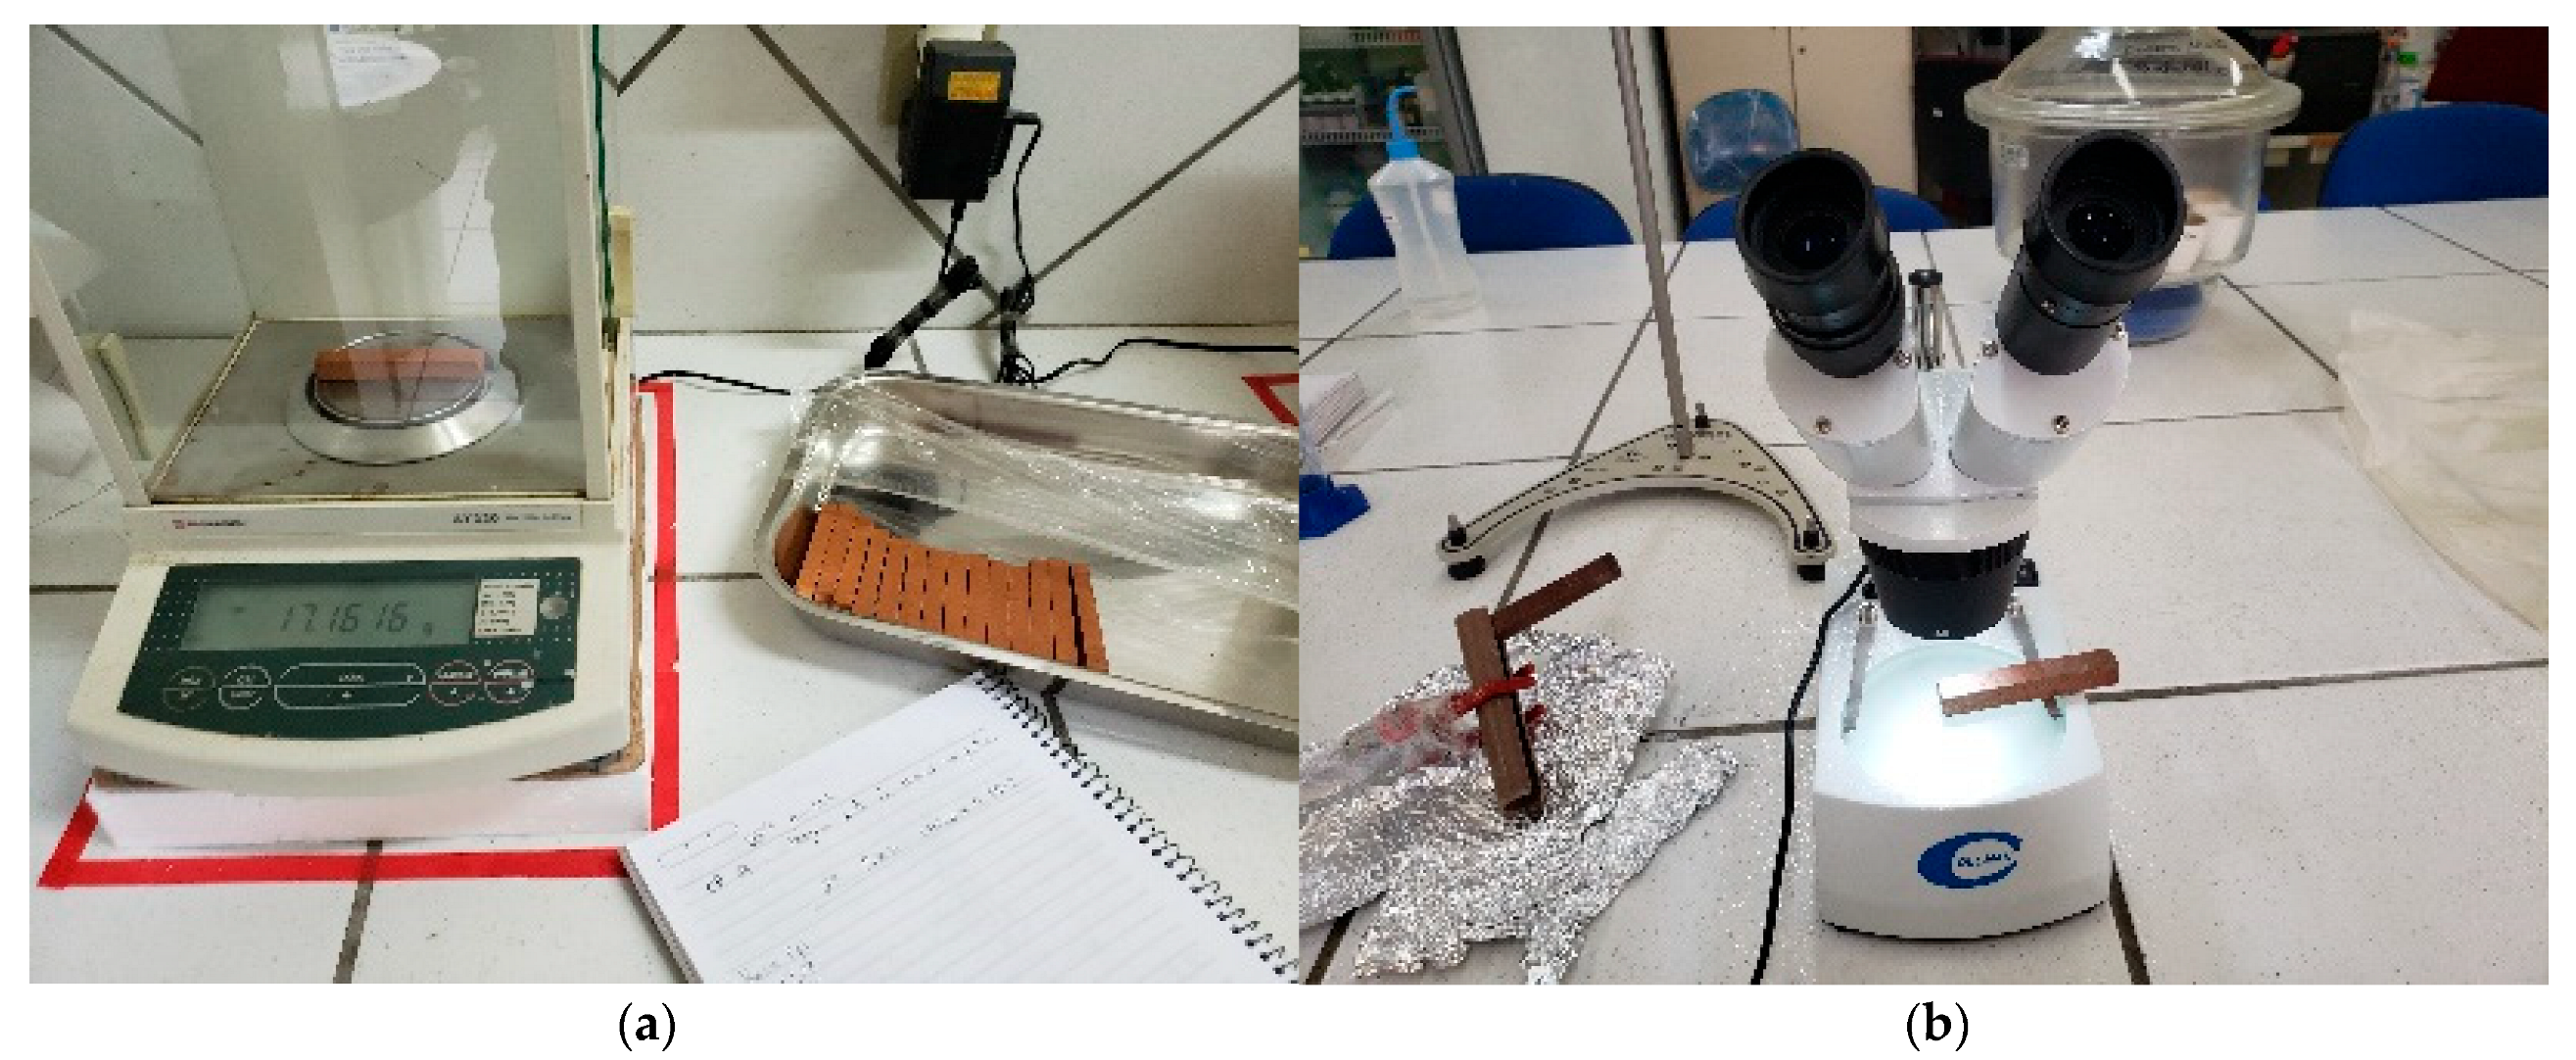
Four prismatic specimens were initially chosen (CPL18, CPL32, CPL70, and CPWL70). Each set contains four specimens, complying with the NACE-TM0499-2009 [34] standard, which determines a minimum of three replicates per period. Only the three sets, CPL18, CPL32, and CPL70, were immersed in CNSL. The photographic documentation of the specimens was performed with a binocular stereoscopic microscope (10× magnification) before and after the tests (Figure 5b).
After periods of exposure to the corrosive environment, the specimens were carefully removed from the solution and then washed in distilled water to remove the corrosive from the surface. The cleaning procedure complied with ASTM G1:03(2017) e1 [32].
The calculation of the mass loss or general corrosion rate, together with the encrusted mass of the corrosion product, was determined following the NACE standard TM0499-2009 [34]. According to the standard, various observations and calculations can help evaluate the results of a corrosion test exposure. The most common is the corrosion rate (CR), expressed in mm/year, which reflects the loss of dimension over time. Obtaining this rate is essential for engineering applications where the service life of the corroded object needs to be estimated. The mathematical expression of CR in mm/year, based on the mass loss of the specimen, is given by:
C R = K · W A · t · ρ
where:
K = constant for unit conversion (8.76 × 10⁴ for TC in mm/year);
W = W1 − W3: mass loss of the specimen in grams;
W1 = initial mass of the specimen before exposure to the corrosive solution;
W3 = mass of the corroded specimen after cleaning;
A = surface area of the specimen in cm2;
t = exposure time in hours;
ρ = density (apparent) in g/cm 3 (determined according to ABNT NBR ISO 10545-3:2020) [38].
The encrusted mass resulting from corrosion on the surface of the specimen is a valuable parameter, particularly when comparing the behavior of two or more ceramic materials in the same test environment. The encrusted mass of the corrosion product WSC (corrosion scale) is determined by the expression:
WSC = W2 − W3
where:
W2 = mass of the corroded specimen before cleaning;
W3 = mass of the corroded specimen after cleaning.

2.5. Absorption, Apparent Porosity, and Flexural Strength of Specimens

After exposure to a corrosive solution, the specimens’ water absorption, apparent porosity, and apparent density were determined according to ABNT NBR ISO10545-3:2020 [38]. Then, the bodies were submitted to a three-point bending test to determine the breaking load and bending resistance modulus, according to ABNT NBR ISO10545-4:2020 [39], ASTM C1161-18 (2023) [40], and ASTM C674:13(2023) [41]. According to NACE TM0499-2009 [34], the flexural strength of a corroded ceramic piece can be compared to that of a test sample not exposed to a corrosive solution. The result must be given in terms of a ratio (Q) between the flexural strength of the corroded part (Rc) and that of the unexposed part (Ru):
Q = R c R u
where:
Q values approaching 1.0 indicate high strength, while values well below 1.0 indicate a substantial reduction in flexural strength (NACE TM0499-2009) [34].
A set of specimens (CPNC) not exposed to corrosion was used to determine this Q ratio. These bodies (immersed in CNSL) were made according to the same norms and characteristics of the test bodies exposed to the corrosive solution and submitted to water absorption, apparent porosity, and three-point flexural strength tests.

3. Results

3.1. Clay Granulometry and Plasticity

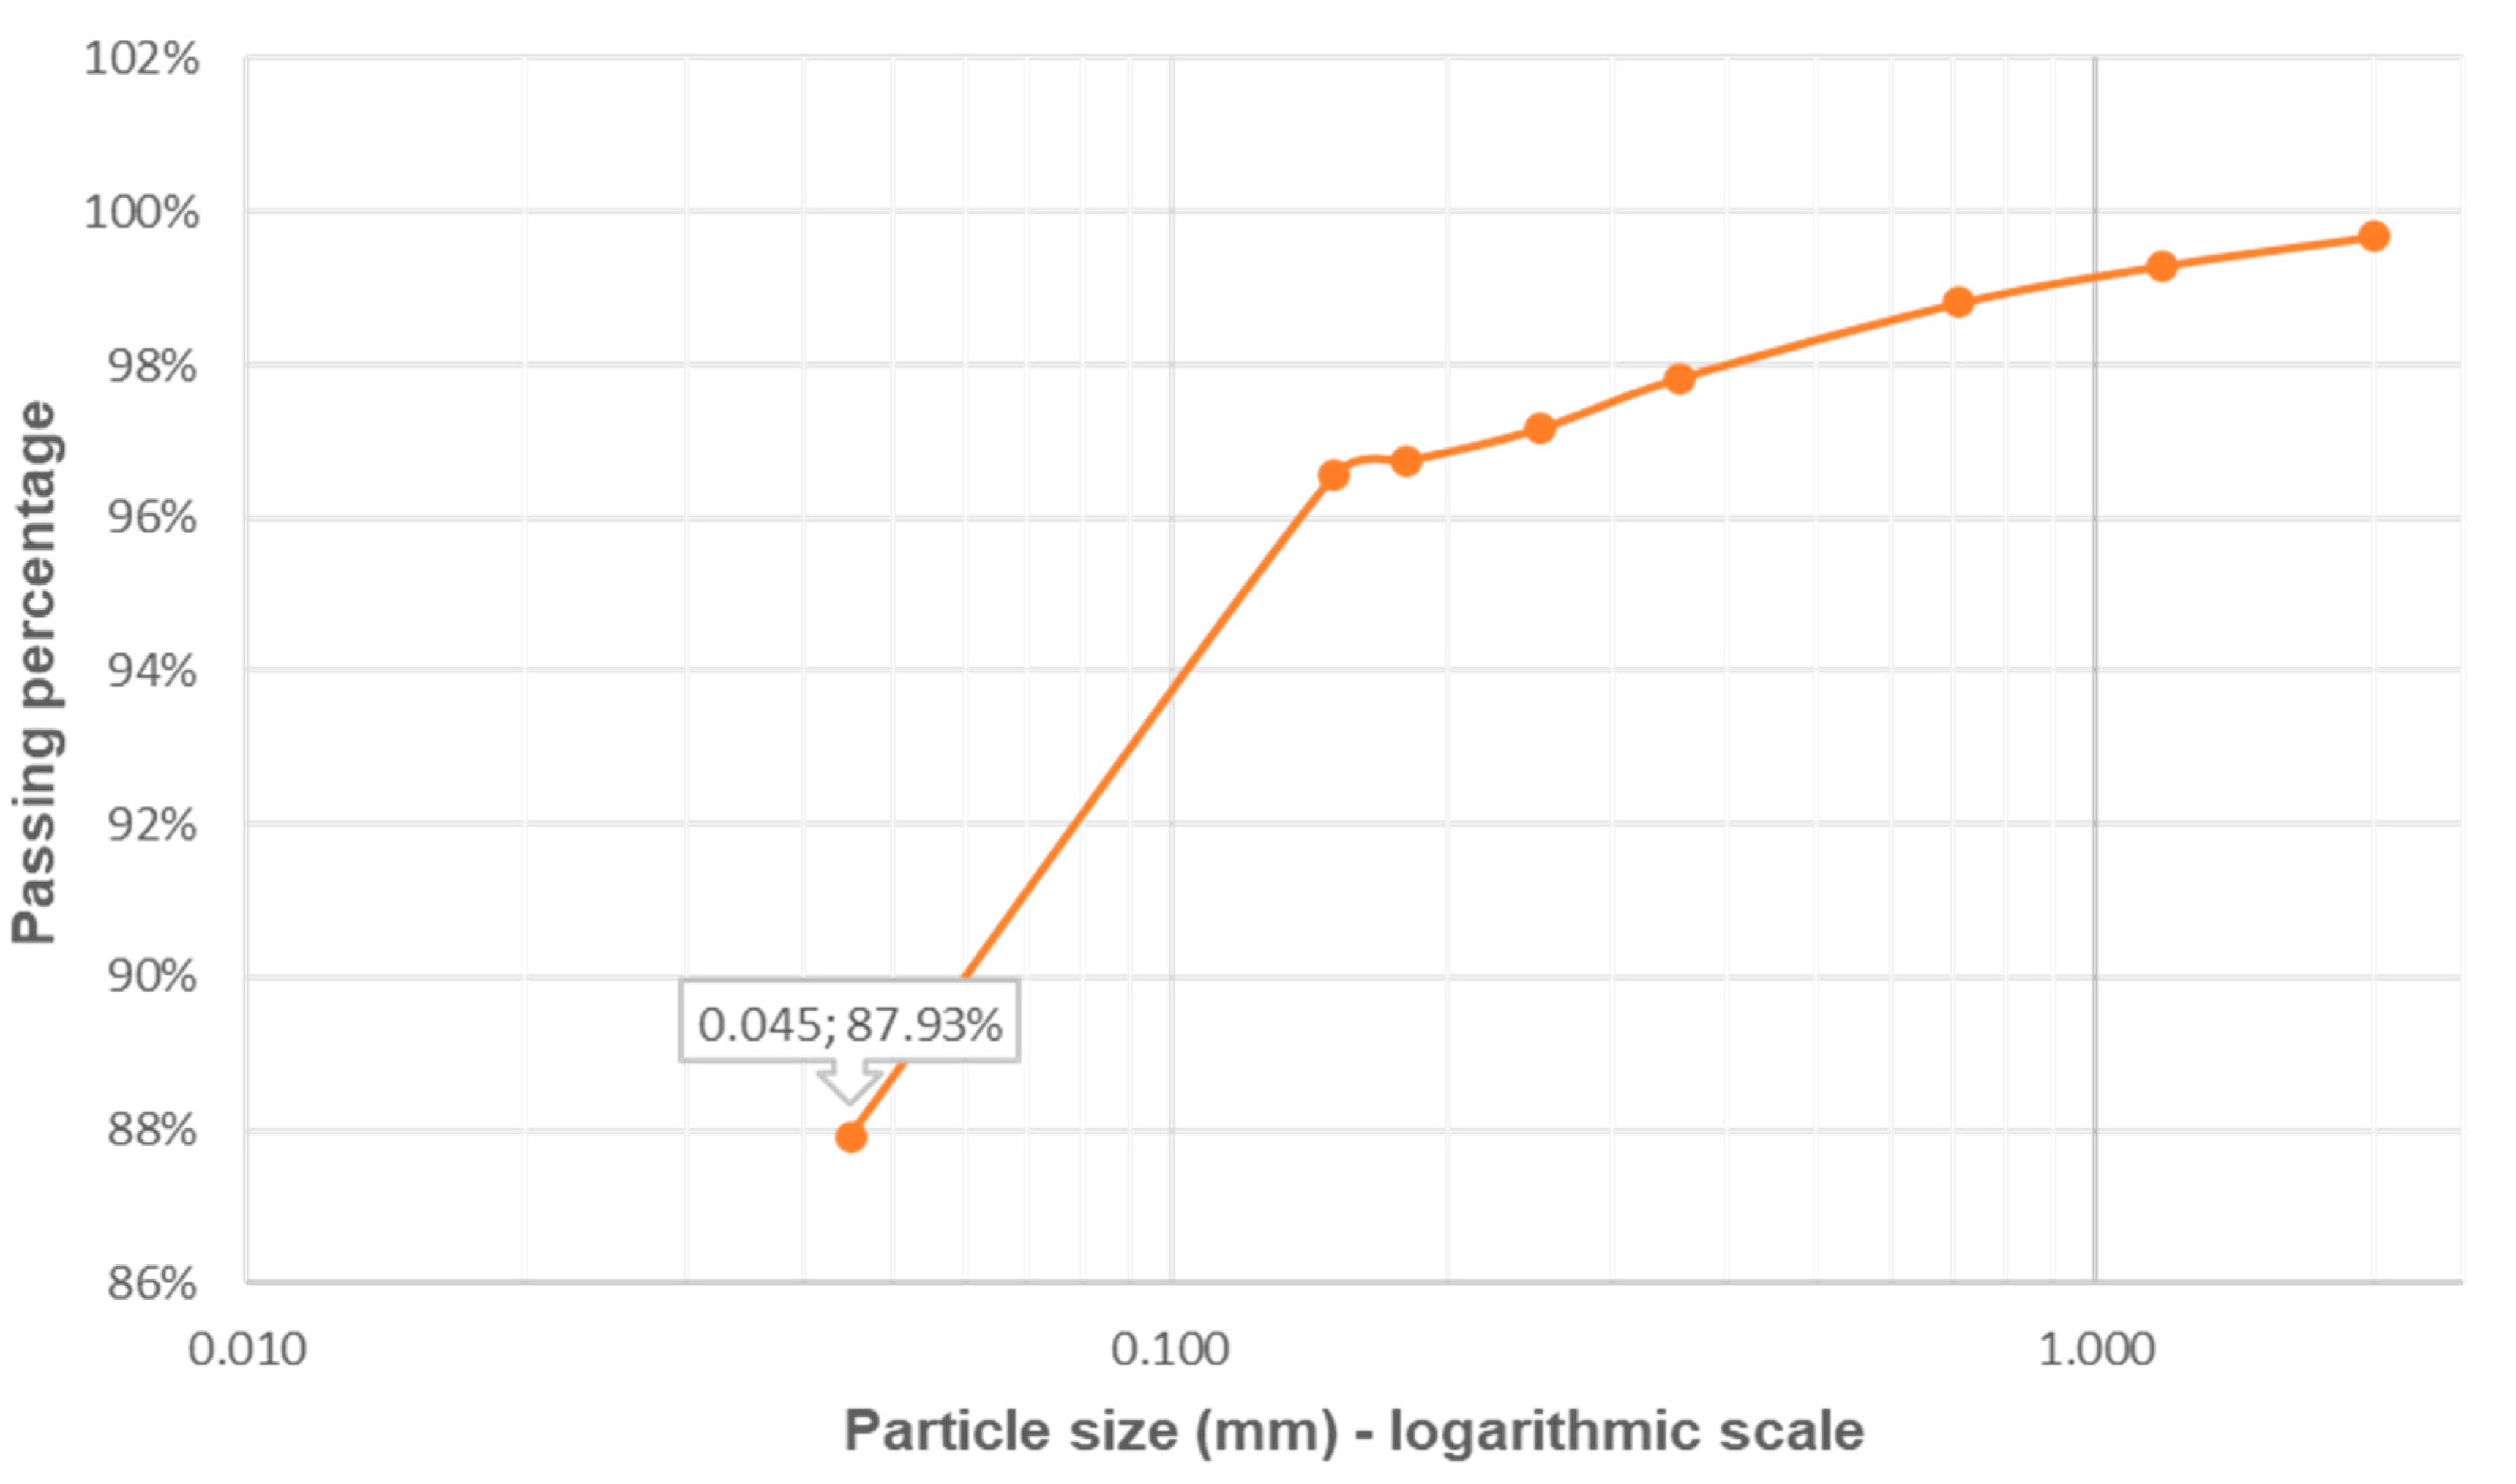
The graph in Figure 6 presents the passing percentage for a 100 g clay sample as a function of its particle size. The clay presented a percentage passing through sieve No. 325 of approximately 88%, with grain dimensions smaller than 0.045 mm.
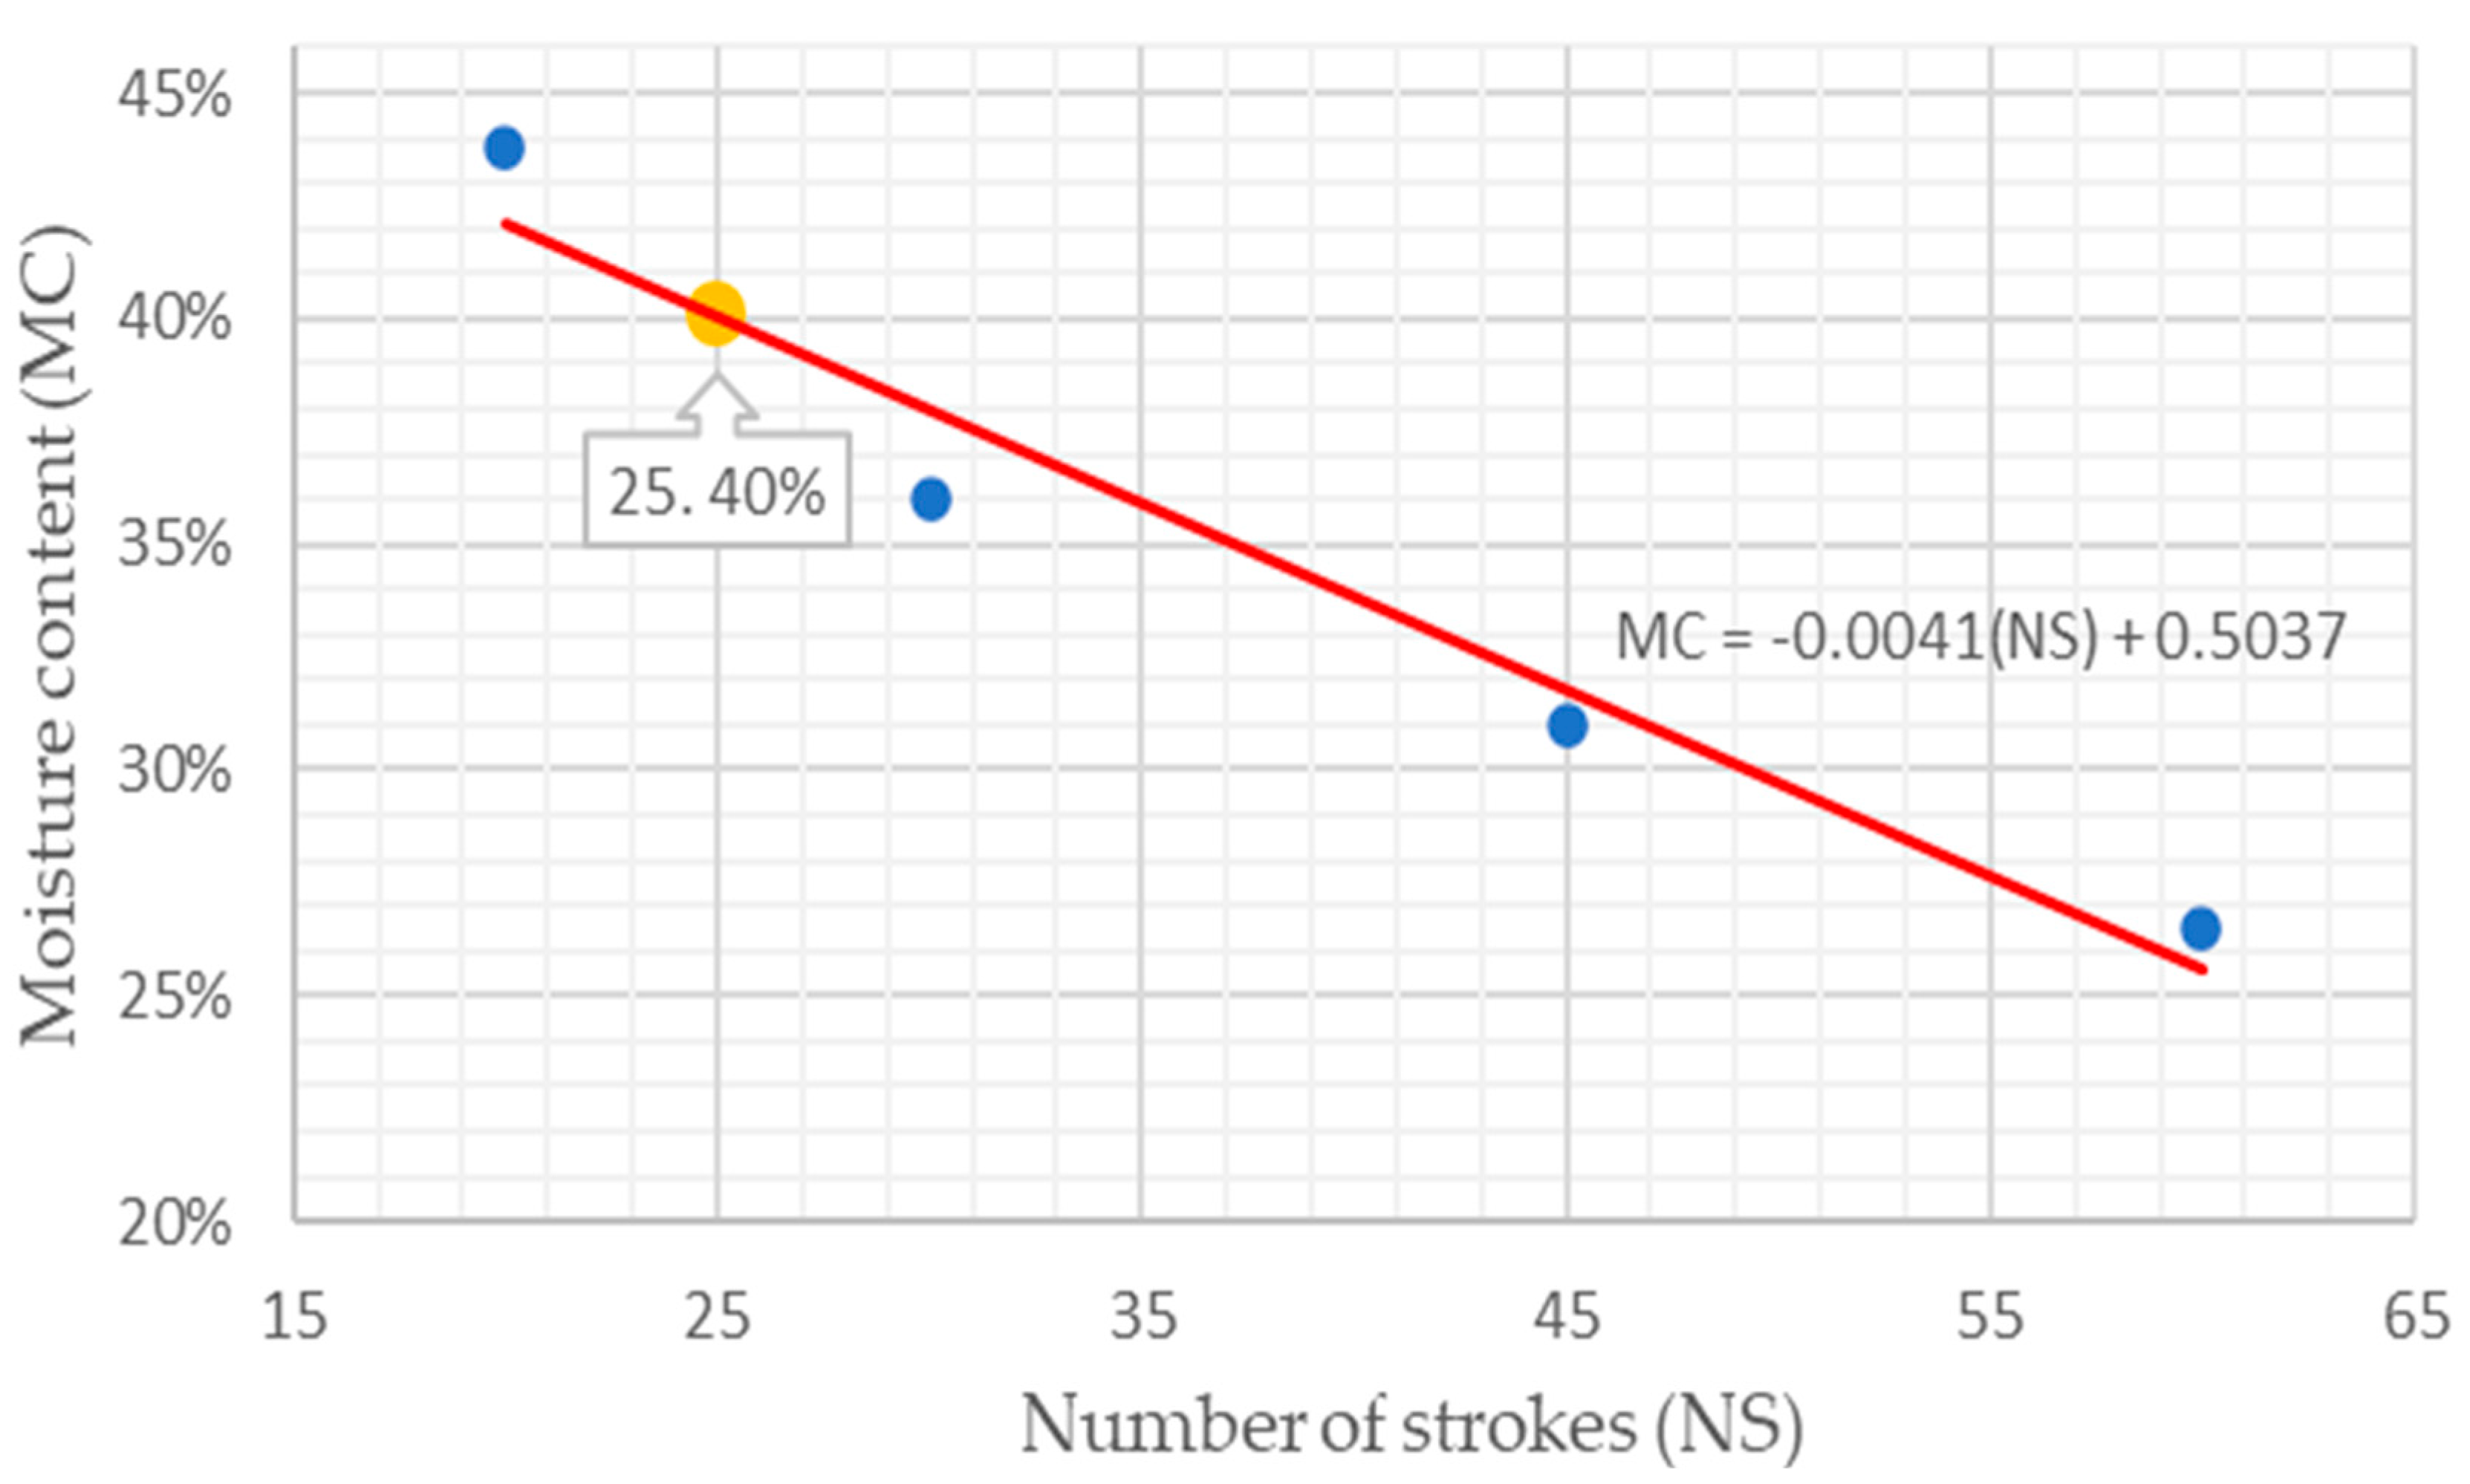
The graph in Figure 7 was obtained from the moisture content found as a function of the number of strokes counted in the Casagrande apparatus.
It is important to highlight that the finer the soil, the higher the liquidity limit (LL). Table 2 also highlights the Atterberg limits, which, according to the calculated values, as the clay has a plasticity index (PI) greater than 15%, is classified as medium-plasticity clay [42]. Still, on the Atterberg limits, as this clay’s consistency index (CI) is greater than unity, it is classified as hard clay [43].
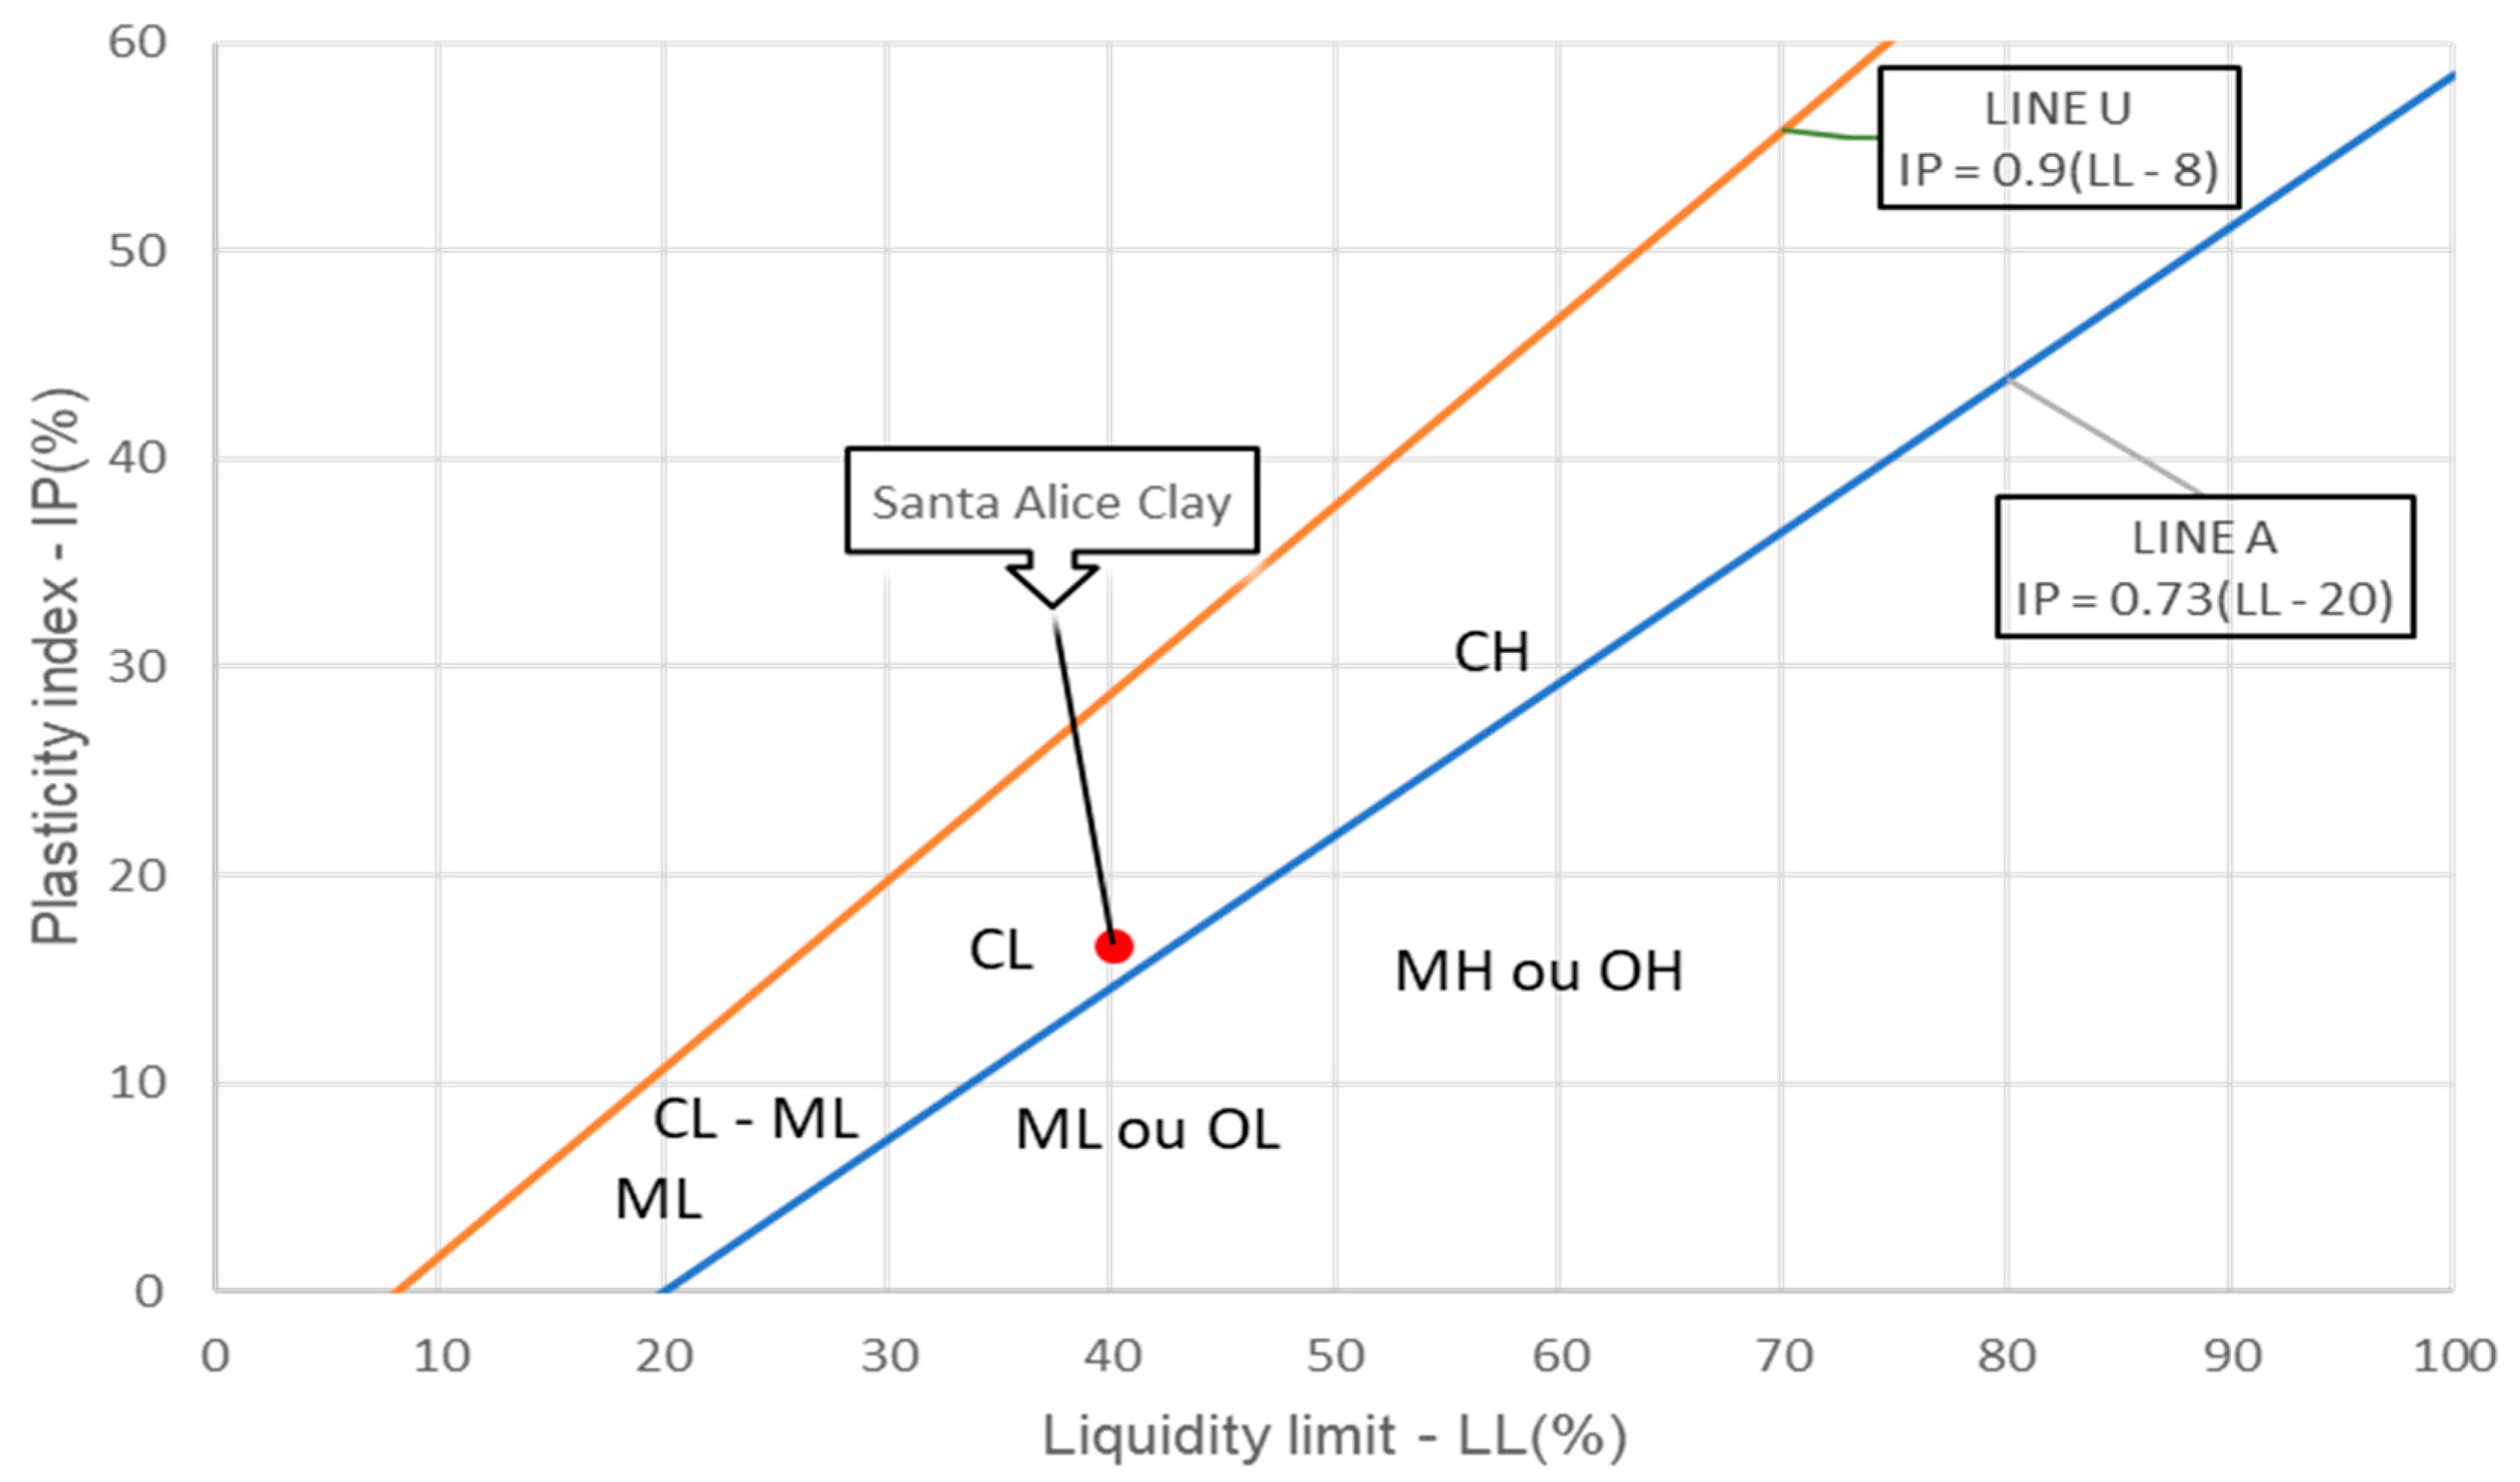
Figure 8 shows the plasticity chart to classify clay according to the Unified Soil Classification System (SUCS) [42]. The plasticity chart lists the clay sample’s plasticity index (PI) and liquid limit (LL). According to the data, the clay can be classified as low-compressibility clay (CL).
The granulometry and plasticity are part of the fabrication history of a ceramic material, as they affect its performance. These characterizations are fundamental for understanding the corrosion that may affect this material in the future. Permeability is important when studying corrosion for a given ceramic material. According to the results, Santa Alice clay, classified as fine-grained soil, has low permeability drainage characteristics [44].

3.2. Clay XRF and XRD

The results of chemical analyses by XRF show that silicon dioxide (SiO2), aluminum oxide (Al2O3), and iron oxide (Fe3O4) are the main components of the analyzed sample (Table 3). These oxides represent approximately 84% of its total mass. The predominance of silica and alumina chemical compositions stands out, with 52.75% and 21.96%, respectively. These values are within the ranges cited by Santos (1989) [45] as results of chemical analyses of Brazilian clays for red ceramics. Iron oxide, with a content of 9.72%, normally found in clays, gives it a reddish color after firing. The sample showed a mass loss of 8.69%, related to the loss of adsorbed water and hydroxyls of clay minerals and the burning of organic matter [46]. This percentage ranges from 6% to 15.7%, specifically for clayey raw materials for structural ceramics [47].
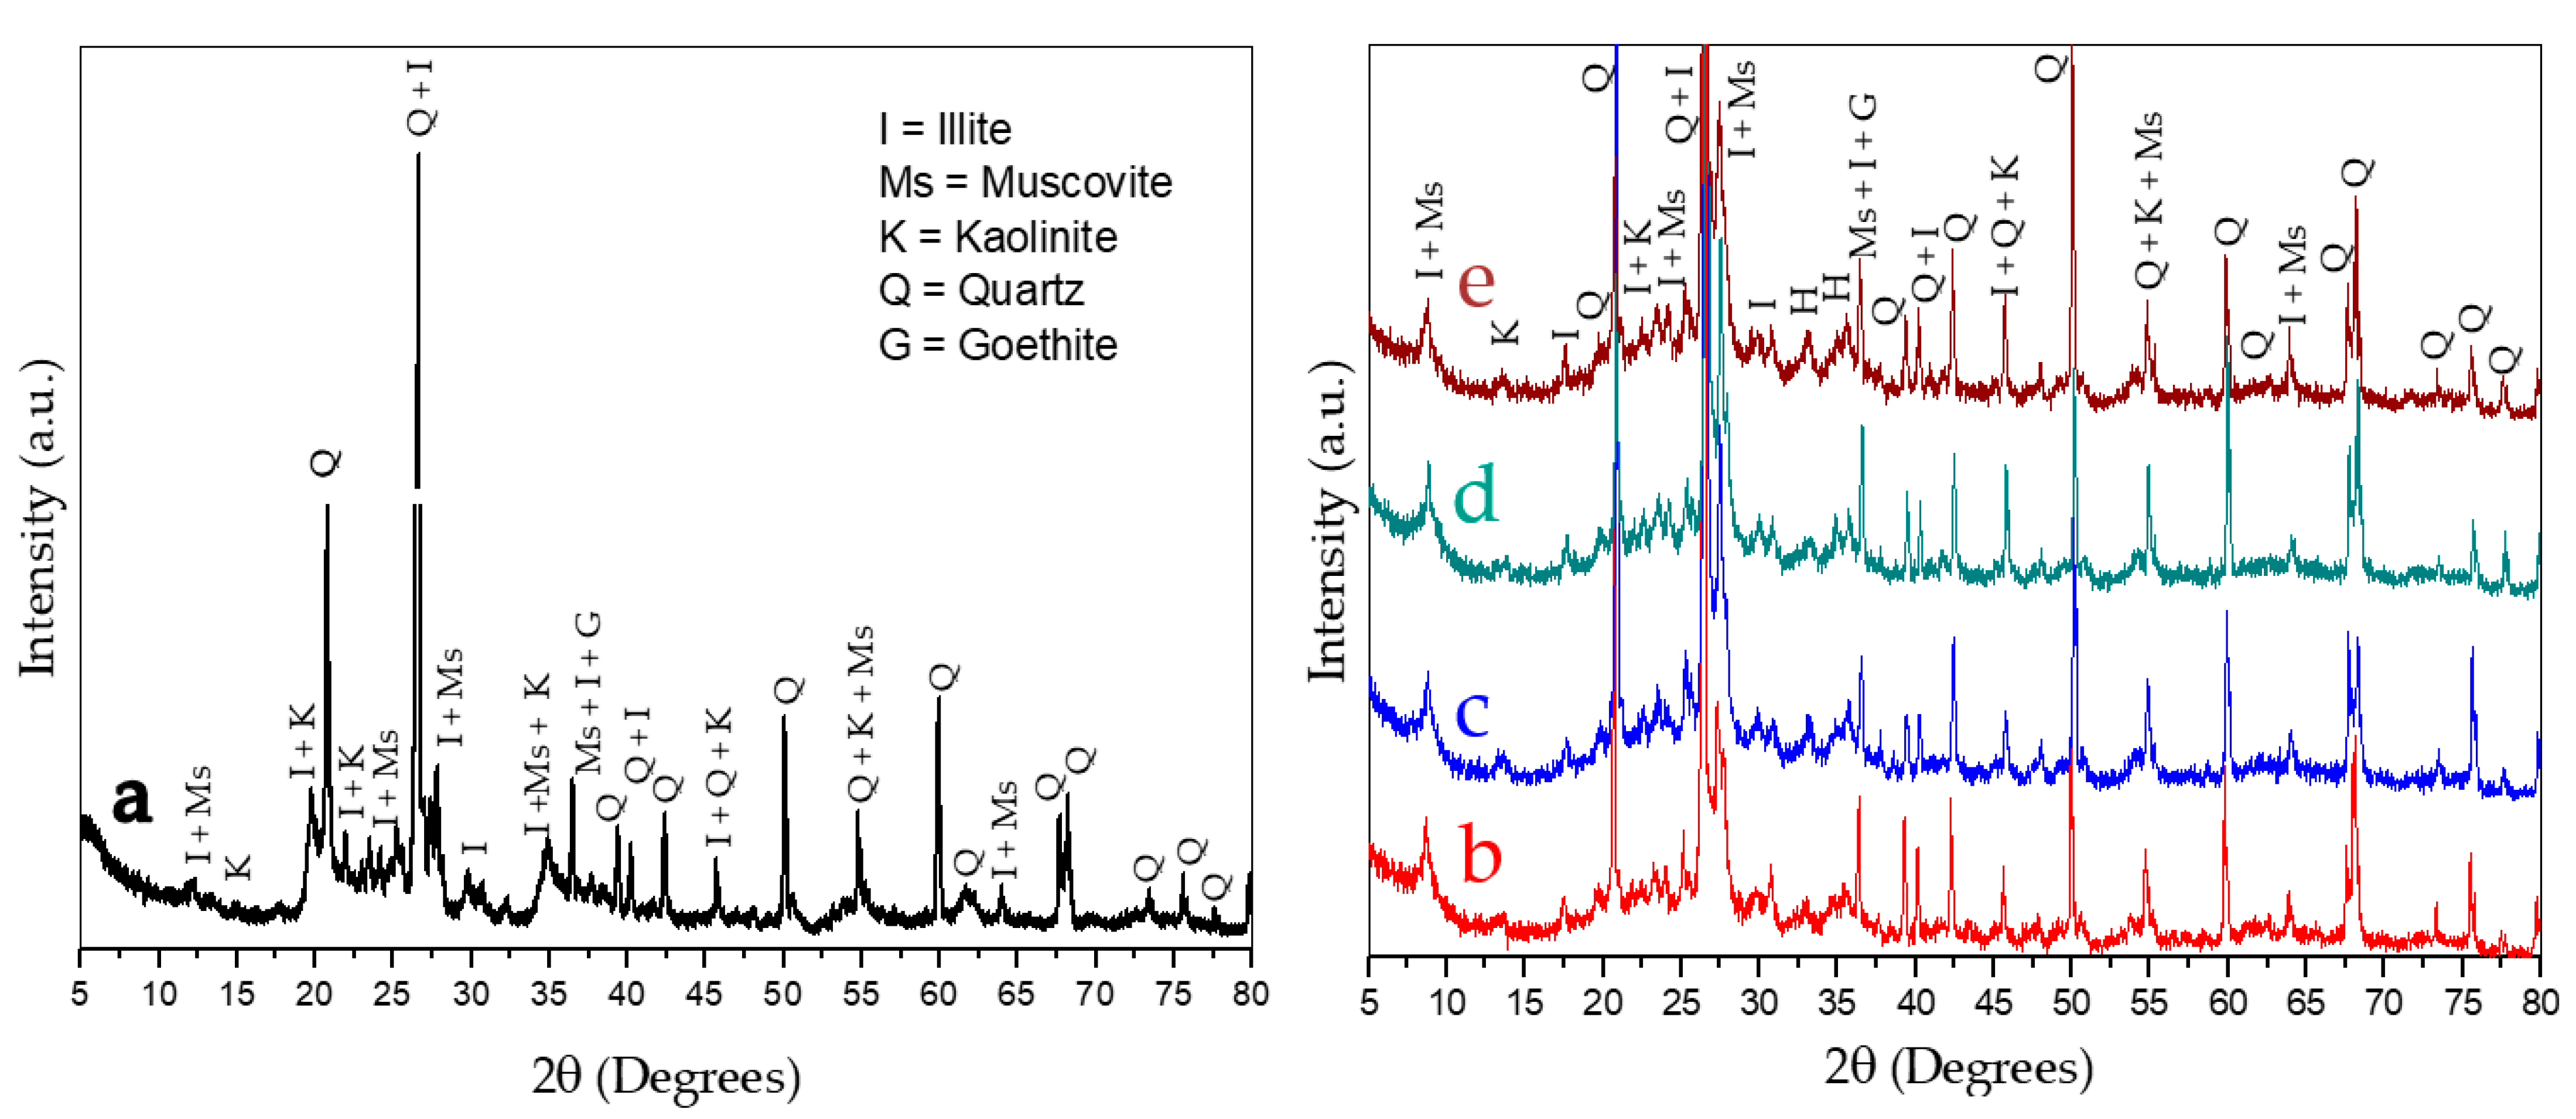
The mineralogical analysis results are presented in the clay X-ray diffractogram (Figure 9a). A comparison of the diffractogram peaks with the diffraction pattern base identified compatibility with the following phases: illite ((K,H3O)(Al,Mg,Fe)2(Si,Al)4O10[(OH)2(H2O)]), muscovite (KAl2(AlSi3O10)(OH)2), quartz (SiO2), goethite (FeO(OH)), and kaolinite (Al2Si2O5(OH)4) [48].
The mineralogical content of fired brick clay determined from XRD is shown in Figure 9b–e. The XRD pattern indicates quartz as the main component. The crystalline mineralogical contents are illite, muscovite, quartz, hematite (Fe2O3), kaolinite, and mullite (Al6Si2O13). The hematite and mullite were formed from the dehydration of goethite and kaolinite.
According to Ural (2015) [49], studies of the effects of clay mineralogy on soil microstructure exist in the literature, where many researchers have emphasized the importance of the Atterberg limits for the determination of many properties of fine-grained soils, reinforcing that the limits of Atterberg affect the grain size distribution and mineral composition of this soil. Mitchell [50], for example, provided evidence that the Atterberg limits and the grain size distribution are indicators of soil mineralogy. Therefore, the clay in this study presented a liquidity limit (LL) of 40.08%, a plasticity limit of 23.45%, and a granulometry of less than 0.45 µm. According to the references above, the clay mineral kaolinite is the predominant constituent, justifying the higher percentages of SiO2 (52.75%) and Al2O3 (21.96%) in the XRF (Table 3) and the quartz (Q) and aluminum silicate (A) peaks in the diffractogram of Figure 9, since the SiO3 can be free in the form of quartz or combined in the form of micas (K2O·2Al2O3·4SiO2·H2O), feldspars, kaolinites, and various other silicates. Still, according to Mitchell’s classification [50], clay presents aluminum silicates (kaolinites) as common constituents, justifying the median percentages of iron oxides (9.72%) and potassium (3.16%) in the XRF (Table 3) and peaks of iron and potassium silicate (Illite) in the XRD (Figure 9), and finally, the aluminum and magnesium silicate (clay mineral montmorillonite) being the rare constituents of this clay, justifying the low percentage of MgO, as well as the absence of calcium and carbonates in the tested clay.

3.3. Clay’s Thermal Analysis

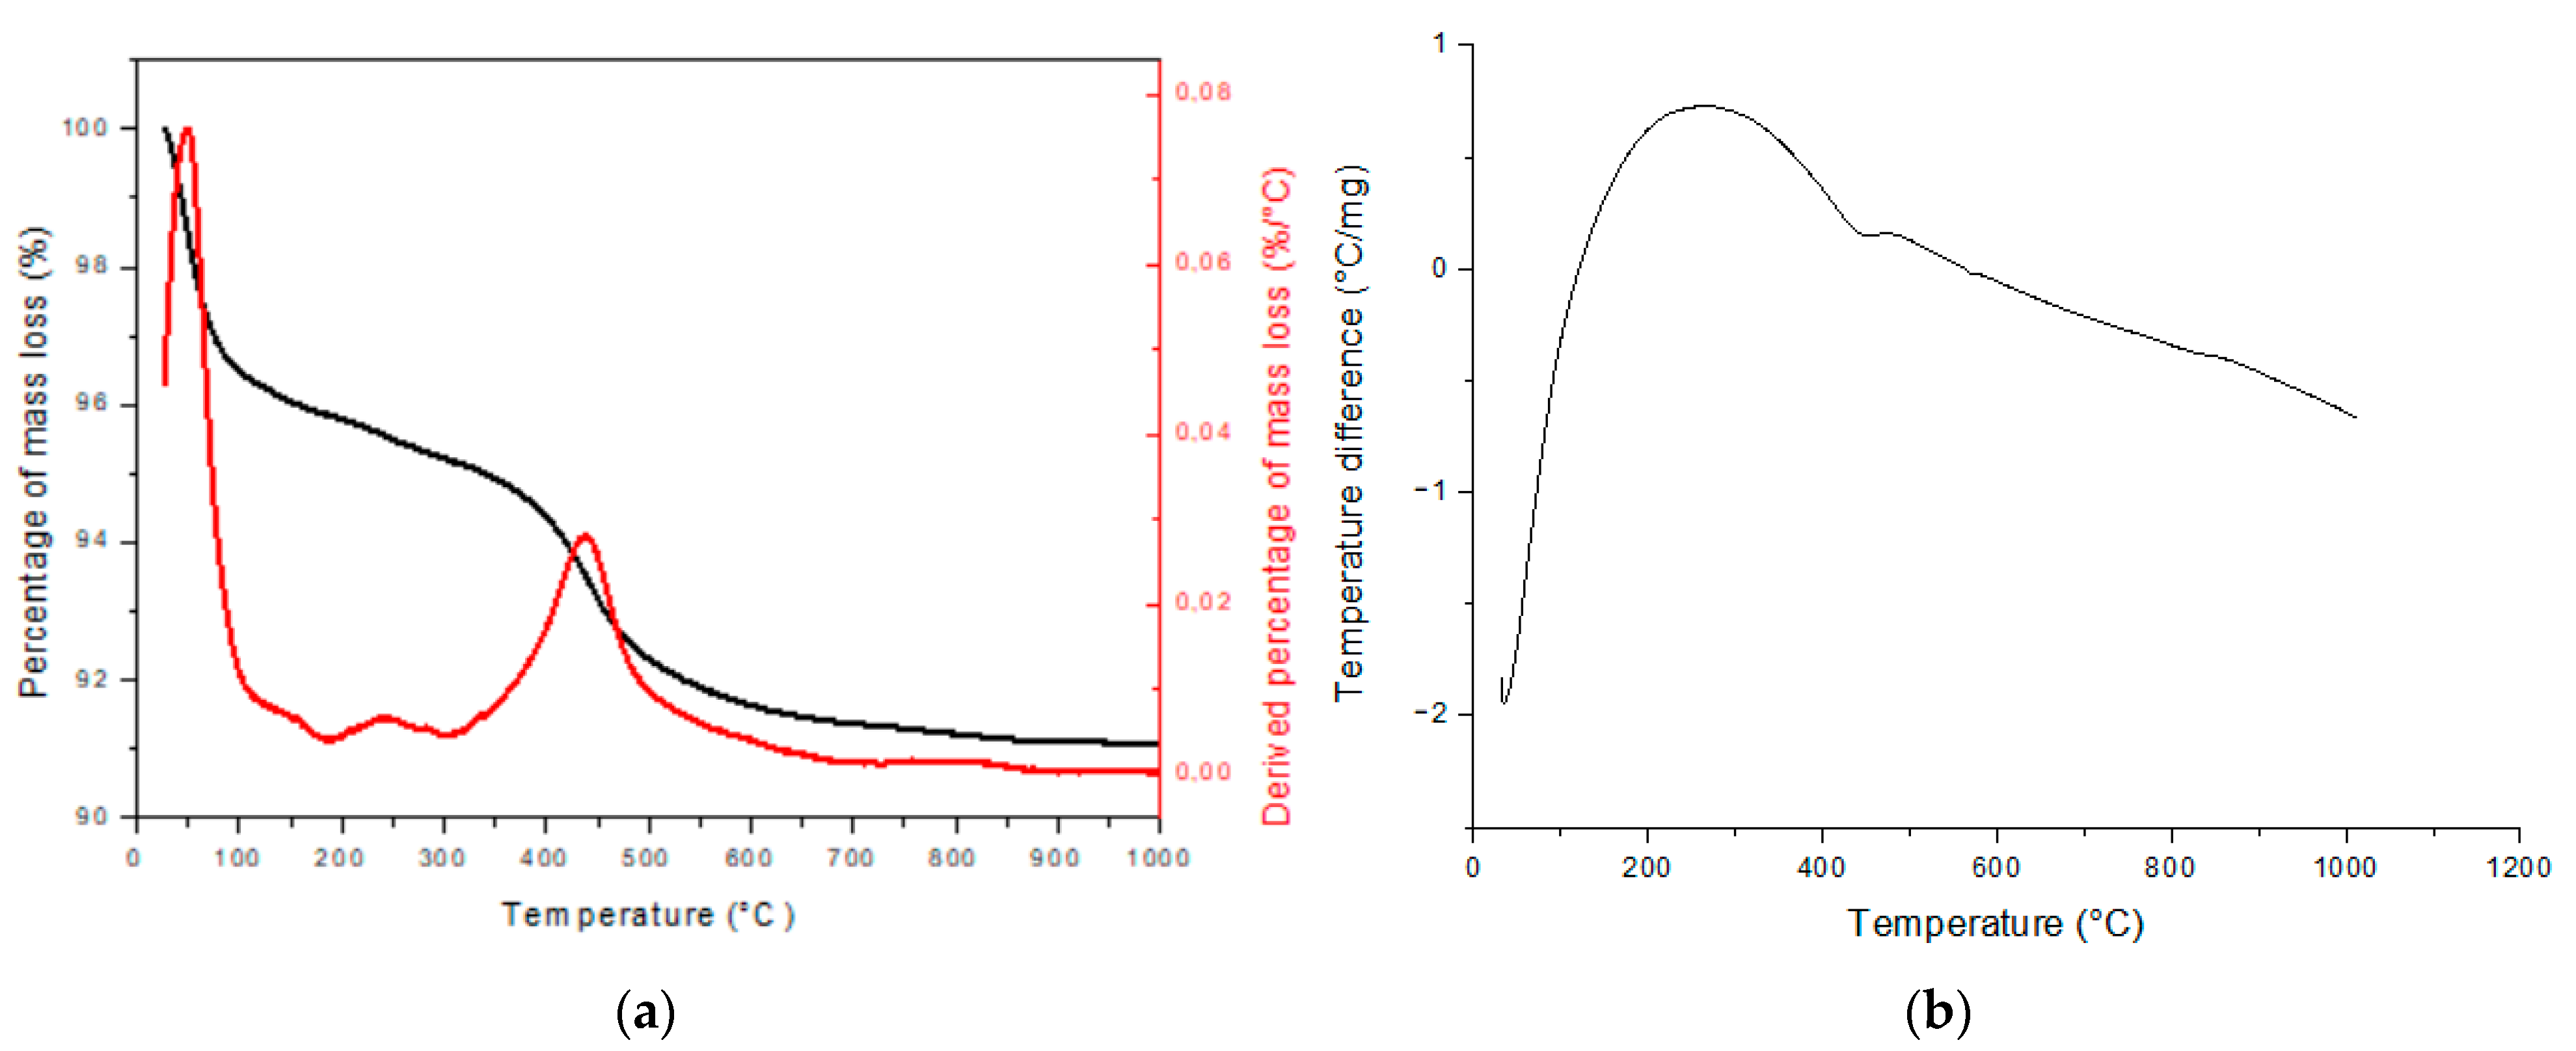
The thermogram in Figure 10a indicates a loss of liquid water or conformation corresponding to a low-temperature endothermic peak below 100 °C. Up to this temperature, a mass loss of less than 4.5% is observed, corroborated by the first DTG peak in Figure 10a. The total weight loss for the clay under analysis was approximately 9%.
Also observed (Figure 10b) is the presence of an exothermic band in the region of approximately 100 °C to 440 °C, with weight loss, possibly attributed to the combustion of organic matter. The peak between 440 °C and 500 °C stands out in the DTG of Figure 10a, corresponding to another stage of mass loss, which is associated with the small endothermic peak in Figure 10b, resulting from the loss of structural hydroxyl of the clay mineral; this step is known as dehydroxylation [45]. This peak is common in iron-rich clays, corroborating the results presented in the XRF and XRD. This type of clay is generally used in red or structural ceramics [45].

3.4. Immersion Corrosion Test

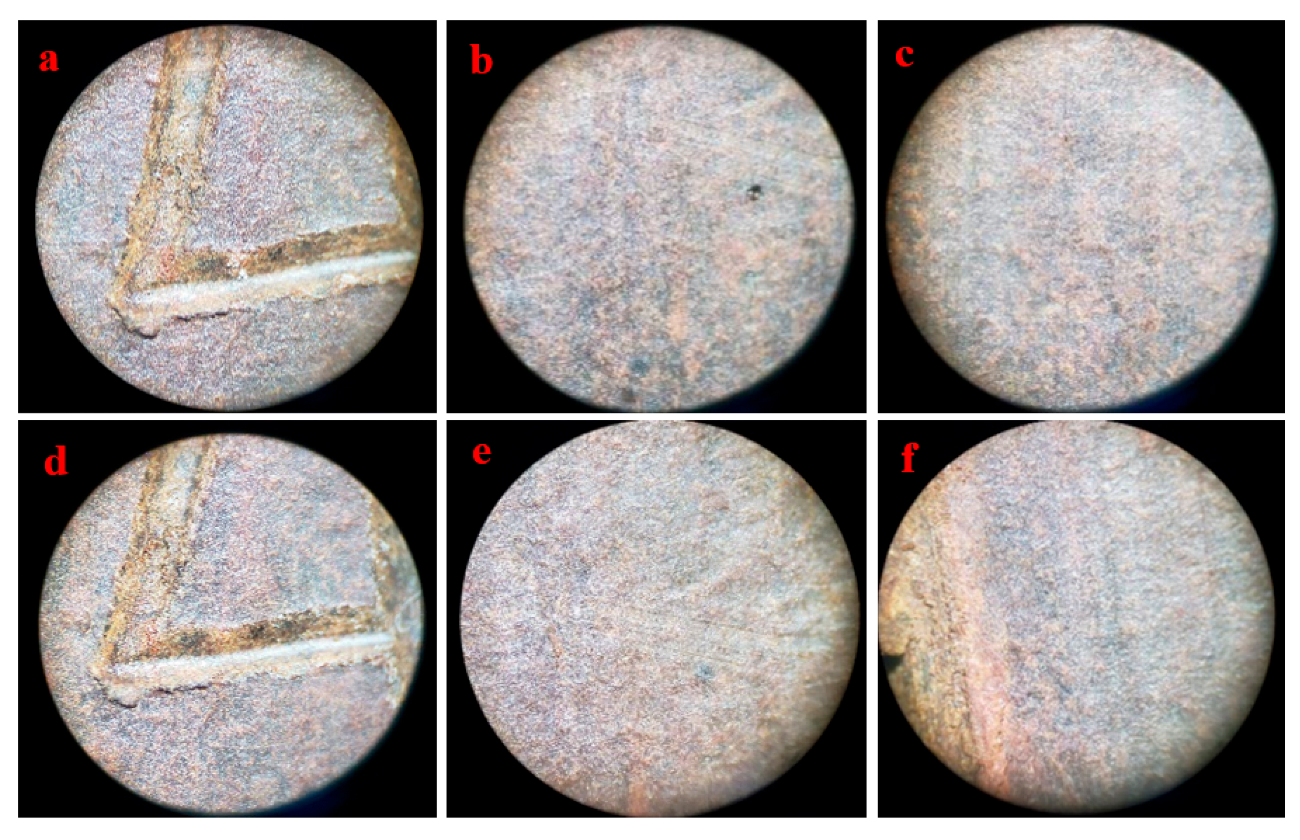
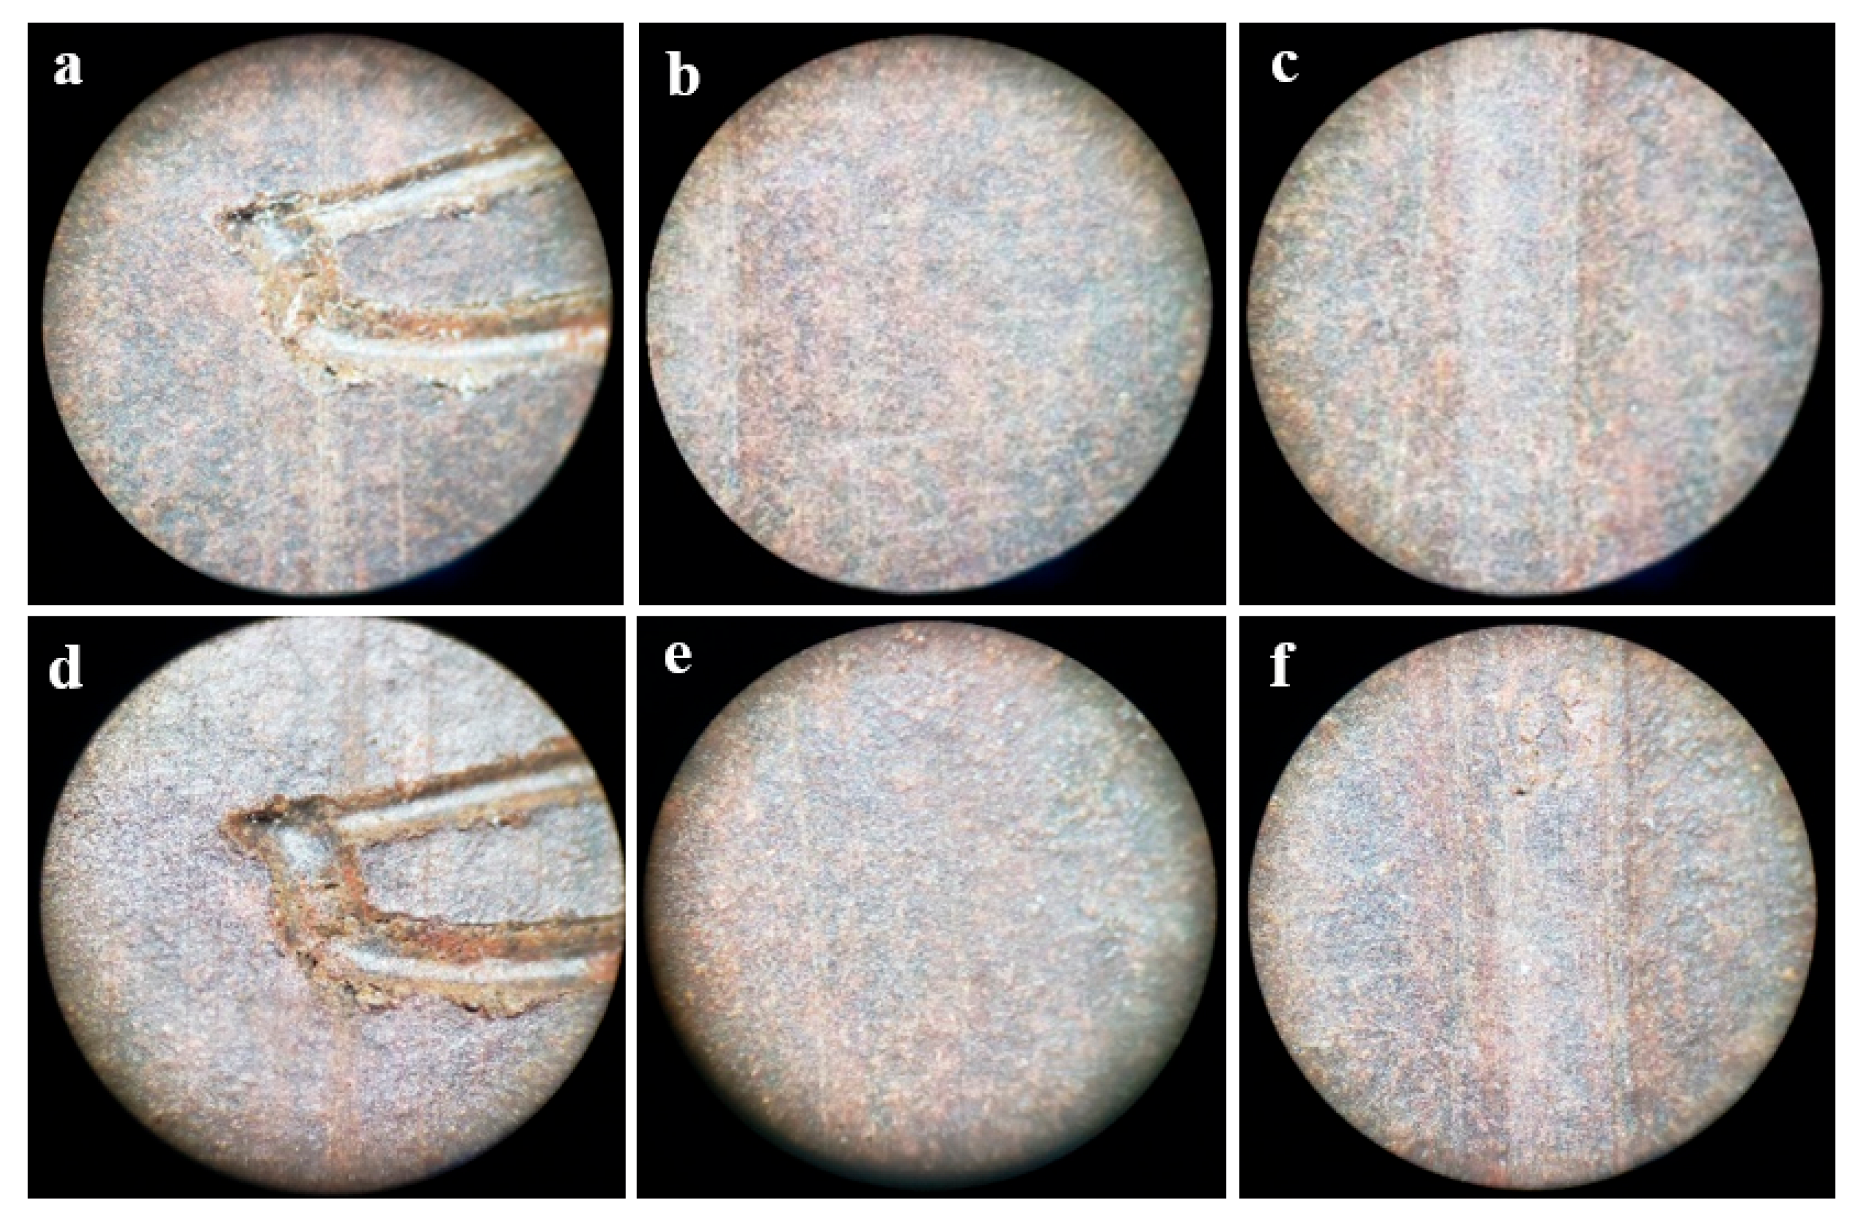
Figure 11 shows enlarged images of some surfaces of the faces of specimens from the CPL18 set, immersed in CNSL, before (Figure 11a–c) and after (Figure 11d–f) the period of immersion in corrosive solution for 18 days.
According to the images, the body did not have a corroded surface for this immersion period. Highlighted in Figure 11a,d are cavities referring to the number of one of the specimens (number 4) of the respective CPL18 set. According to the ASTM G4-01 (2014) [35] standard, although in exceptional cases, it may be necessary to notch the edge of the specimens for identification, it is preferable that they be stamped with a number. Still, according to this standard, the stamped number has the additional advantage that if a specimen presents a preferential attack in the stamped area, this implies that the material is susceptible to corrosion. It is also possible, in some cases, to detect corrosion cracks emanating from stamped areas.
Figure 12 shows enlarged images of some surfaces of the faces of specimens from the CPL32 set, immersed in CNSL, before (Figure 12a–c) and after (Figure 12d–f) the period of immersion in corrosive solution for 32 days.
According to the images, the body did not show a corroded surface during this immersion period. Highlighted in Figure 12a,d are cavities referring to the number of one of the specimens (number 5) of the respective CPL32 set, according to ASTM G4-01 (2014) [35].
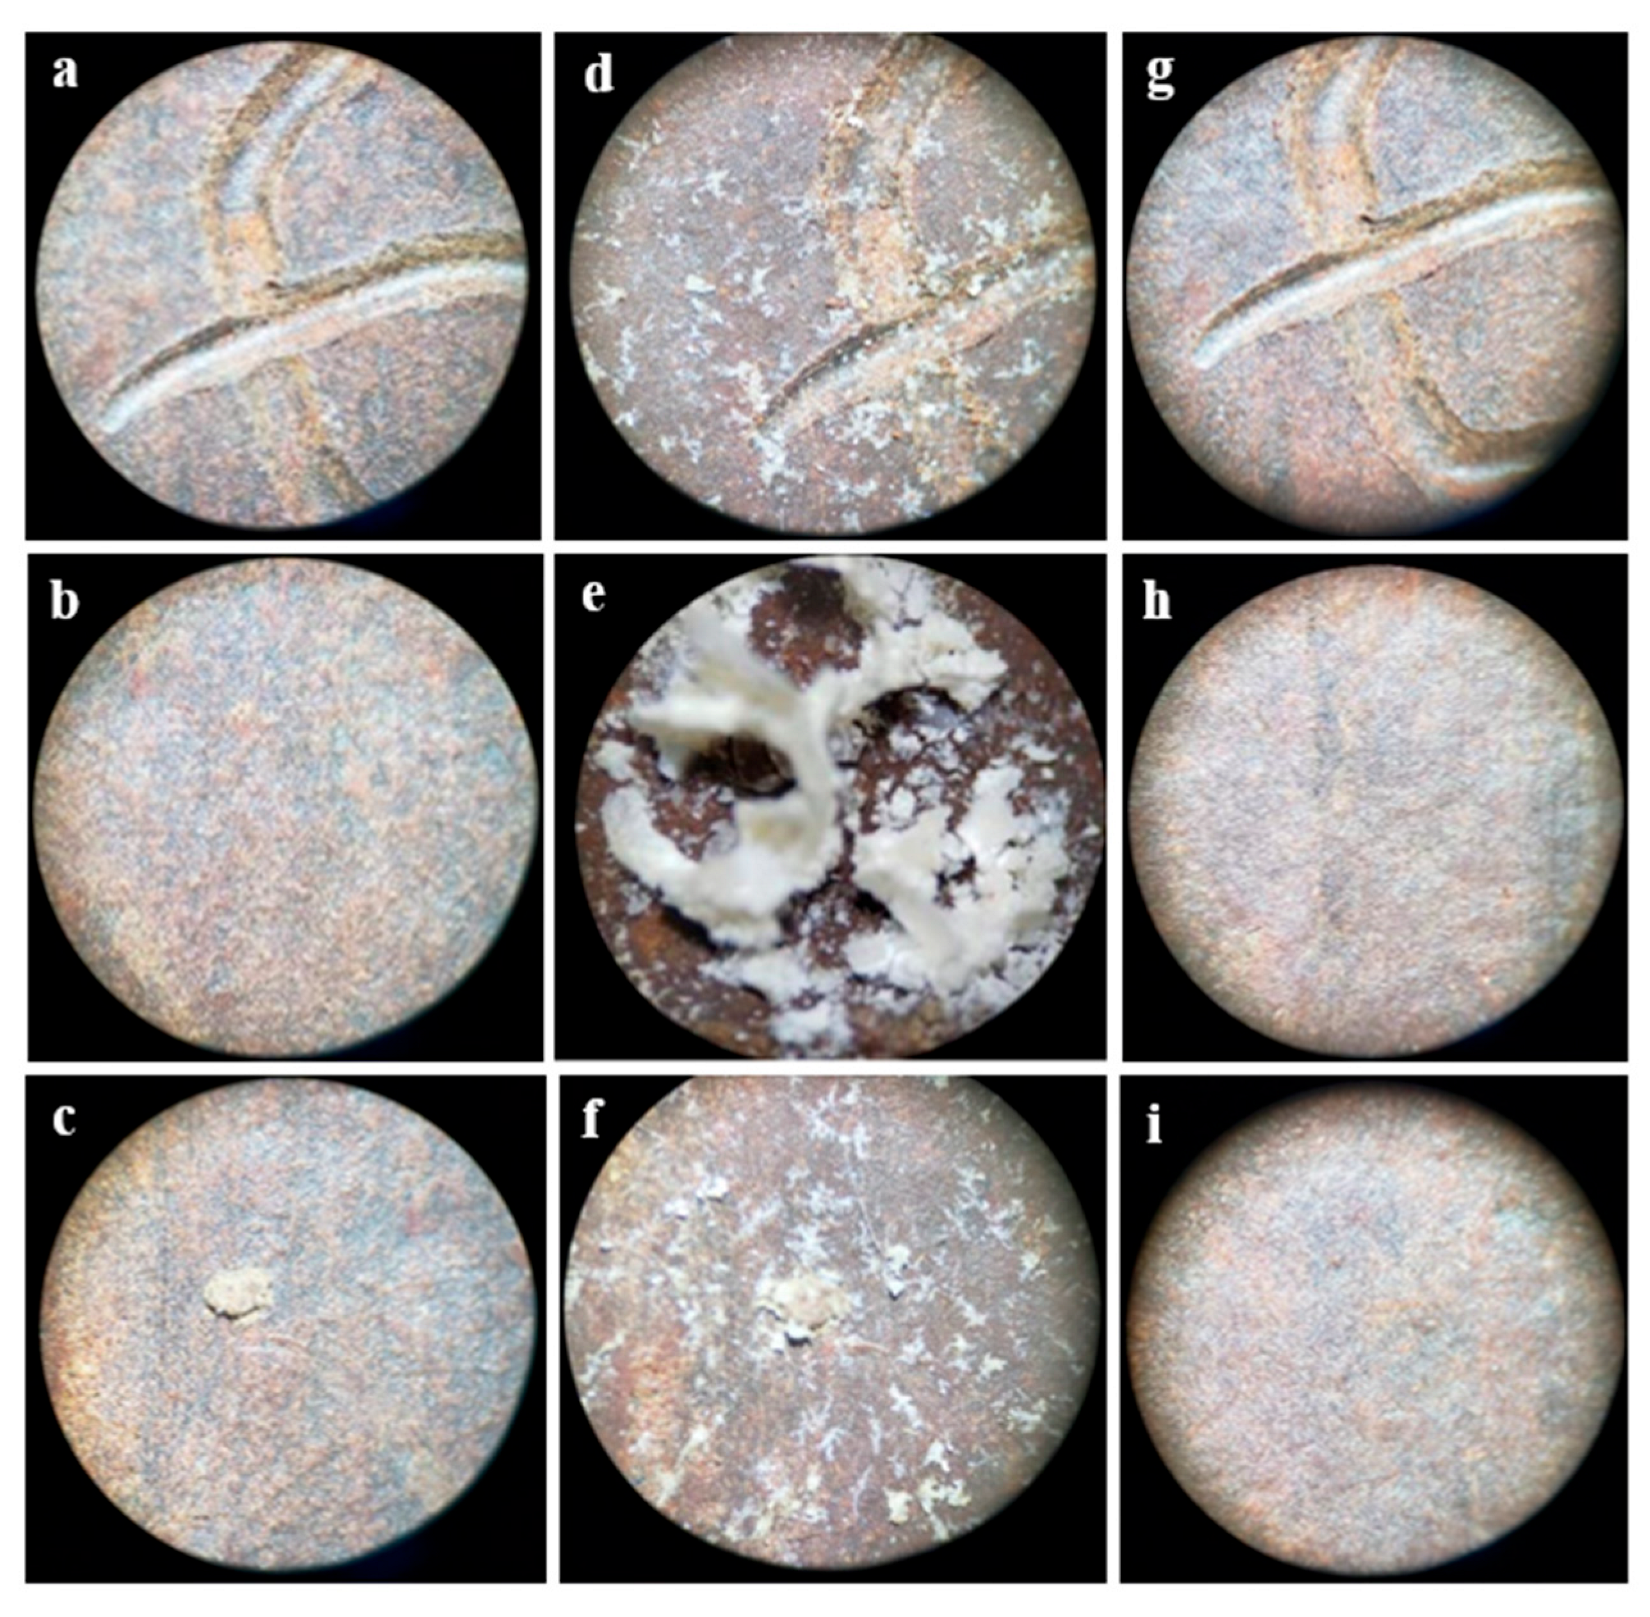
Figure 13 shows enlarged images of some surfaces of the faces of specimens from the CPL70 set, immersed in CNSL, before immersion in the corrosive solution (Figure 13a–c), after removal of the corrosive solution following 70 days of immersion (Figure 13d–f), and after cleaning the specimens (Figure 13g–i).
After removing the corrosive medium, the presence of mass deposited on the body’s surface from the corrosive solution stands out (Figure 13d–f). According to the images (Figure 13g–i), the body did not have a corroded surface for this immersion period. Highlighted in Figure 13a,d,g are cavities referring to the number of one of the specimens (number 6) of the respective CPL70 set, according to ASTM G4-01 (2014) [35].
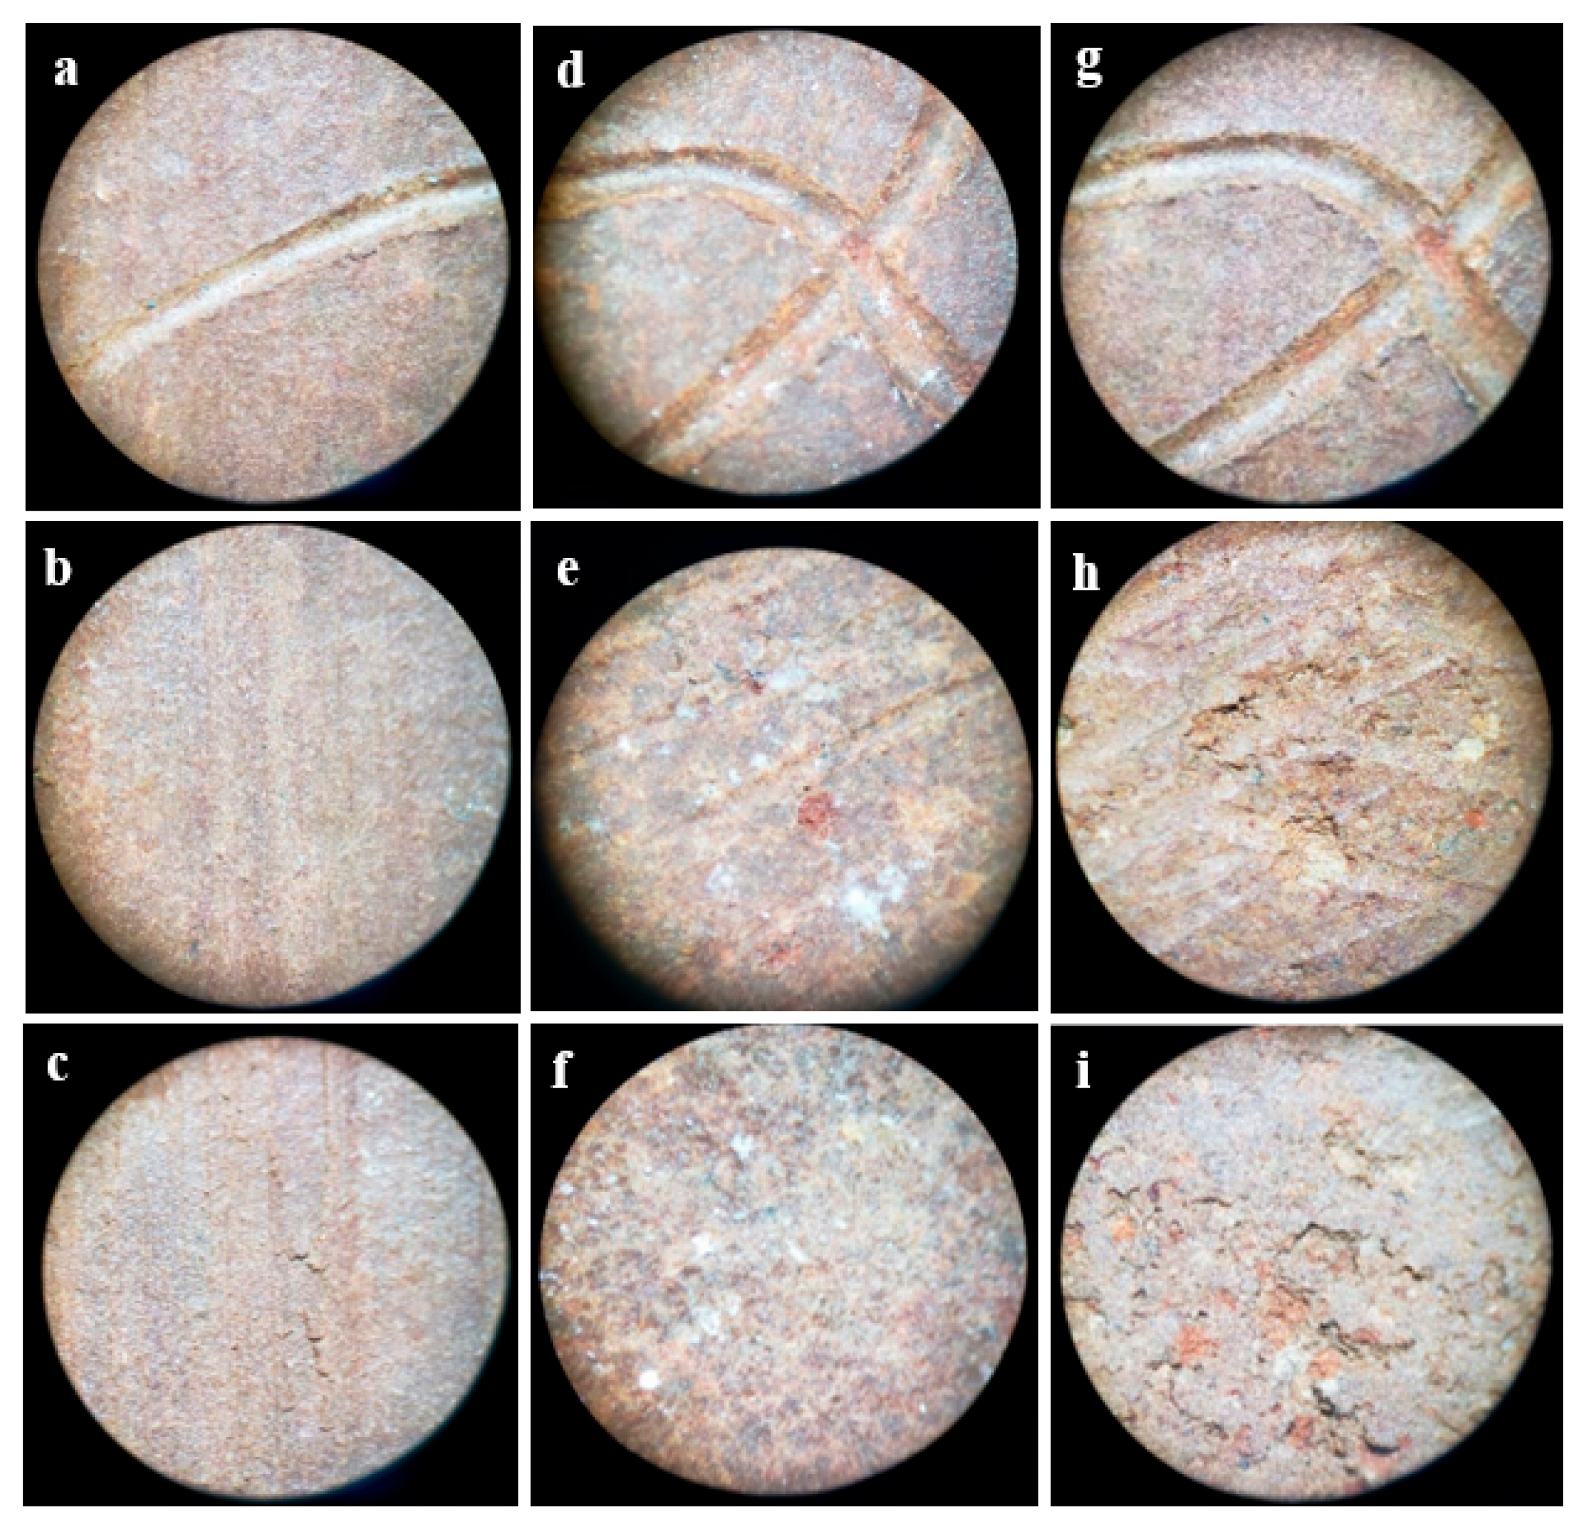
Figure 14 shows enlarged images of some surfaces of the faces of specimens from the CPWL70 set, without CNSL, before immersion in the corrosive solution (Figure 14a–c), after removal of the solution following the 70 days of immersion (Figure 14d–f), and after cleaning the specimens (Figure 14g–i). After removing the corrosive medium, it is observed that a small amount of mass is deposited on the surface of the body from the corrosive solution (Figure 14d–f). According to the images (Figure 14e,f,h,i), the body showed signs of corrosion at some points on the surface for this immersion period. Highlighted in Figure 14a,d,g are cavities referring to the number of one of the specimens (number 21) of the respective set CPWL70, according to ASTM G4-01 (2014) [35].
Table 4 shows the results of the calculations for the average corrosion rate (TC) and encrusted mass after immersion of the specimens in corrosive solution, according to Equations (1) and (2).
According to the results, the CPL70 (1.78 g) and CPWL70 (2.32 g) sets had a greater mass amount of corrosive material deposited on the surface due to the longer time (70 days) of exposure to the corrosive solution, thus corroborating Figure 13d–f and Figure 14d–f. Only the CP W L70 set (without CNSL) showed a mass loss, indicating corrosive action as shown in Figure 14e,f,h,i, with an average corrosion rate of 0.017 mm/year, and confirming the protective action of the CNSL on the surface of the bodies of sets CPL18, CPL32, and CPL70.
Table 5 presents the average percentage of water absorption and porosity, the average flexural strength modulus of the immersed sets (CPL18, CPL32, CPL70, and CPWL70), and the set of test specimens not immersed in corrosion (CPNC).
The highest average value of the encrusted masses found in the bodies of the CPWL70 set (WSC, Table 4) indicates that the corrosive action increased the porosity (ρ, Table 5) of each body since the corrosion of a ceramic material may be proportional to its porosity [8].
All test specimens showed a minimum resistance above 4.0 MPa and can be applied to manufacture solid or perforated bricks for sealing (VED40), as they meet the minimum requirements specified by the ABNT NBR 15270:2017 standard [51].
The sets of specimens bathed in CNSL showed an absorption value lower than the range specified by the standard mentioned above, confirming the protective action of the CNSL on the surface of the specimens. It was observed that the longer the exposure time in the corrosive solution, the lower the absorption and porosity values and, consequently, the higher the measured resistance values, thus confirming the relationship between these properties according to the literature [3]. According to Equation (3) [34], the CP bathed in CNSL and submitted to the corrosive solution showed high flexural strength (RF, Table 5), confirmed by the Q values (Table 5).

3.5. Infrared Discussion

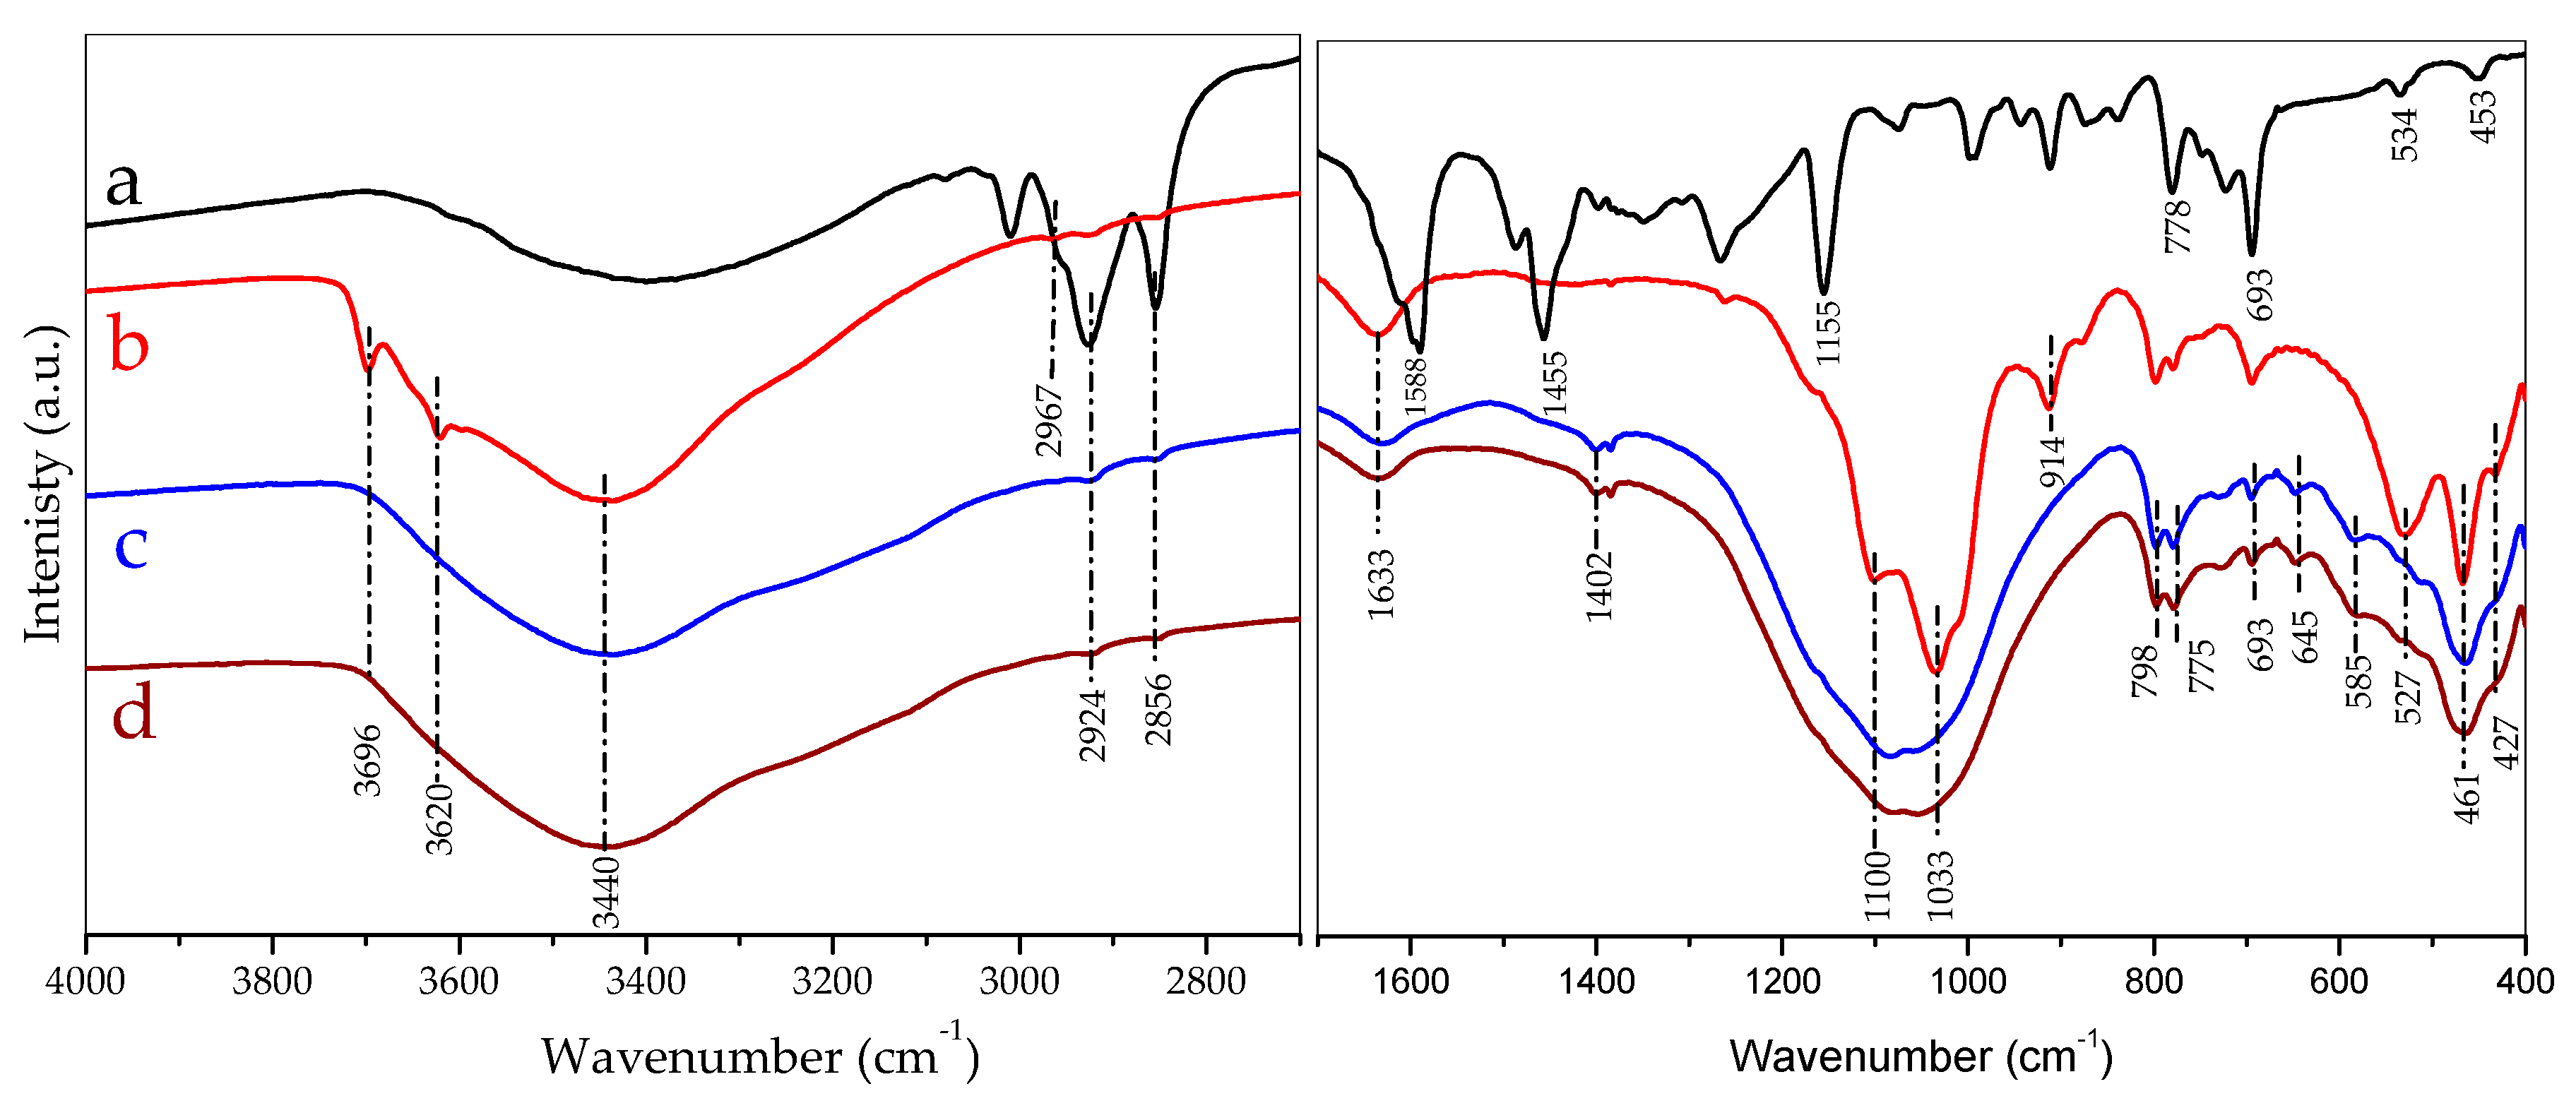
The structure spectra of CNSL were obtained by IR analysis (Figure 15a). A broad peak centered at 3393 cm−1 is ascribed to the vibration of the phenolic O-H bond, and the C-O bond stretch at 1265 and 1155 cm−1. The peaks at 3010, 1454, and 693 cm−1 are characteristic of vibration modes of the =C-H (sp2), C=C, C-H, and C-C bonds of the aromatic ring, respectively. The peak at 1588 cm−1 is related to aliphatic C=C stretching. The stretching of CH2 and CH3 is related to peaks at 2930 and 2854 cm−1. The deformation or stretching of the C-O-H group of phenolic compounds is observed in 1348 cm−1 [52].
The structure spectra of clay (Figure 15b), clay fired at 800 °C (Figure 15c), and clay fired at 800 °C immersed in CNSL (Figure 15d) were obtained by IR analysis. The red clay samples show a broad absorption band at around 3440 cm−1. The band at 3440 cm−1 and the weak band at around 1633 cm−1 are due to absorbed water and agree with the literature data (Figure 15b–d). [53]. The inter-layer hydrogen bonding in clay is assigned by a characteristic band at 3696 cm−1 (Figure 15b). Other bands at 3620 cm−1 (Figure 15b), 1033 cm−1, and 914 cm−1 show the presence of kaolinite (Al2Si2O5(OH)4) (Figure 15b–d) [54]. Inner hydroxyl groups, lying between the tetrahedral and octahedral sheets, give an absorption near 3620 cm−1 (Figure 15c,d) [55,56]. The presence of quartz in the sample can be explained by Si–O symmetrical stretching vibrations at around 798 and 775 cm−1, while Si–O symmetrical bending vibrations arise around 693 cm−1 due to the low level of Al for Si substitution [57]. It overlaps into one broad absorption band centered at 527 cm−1, assignable to Al–O–Si present in kaolinite. The broad absorption band around at 461 cm−1 was due to Si–O–Si bending vibration [58]. The pair at 2967 (Figure 15b), 2927, and 2854 cm−1 (Figure 15b–d) corresponded to the C–H stretching vibrations of some organic contribution [59]. The peak at 1633 cm−1 (Figure 15b–d) corresponded to the carboxyl groups (C=O, C-O), functional groups in the natural organic matter [60]. In the IR spectra between 400 and 1700 cm−1, the following band separations were identified: Si-O (427 and 461 cm−1); Al-O-Si (527 and 585 cm−1 ); Si-O-Si (645, 693, 775, and 798 cm−1); Al-O-H (914 cm−1); Si-O (1033 and 1100 cm−1) and Si-O-Si (1402 and 1633 cm−1) [61].
Trying to clearly describe the logical relationships among CNSL and corrosion and the probable mechanism of action of the cashew nut shell liquid as a corrosive agent, we analyzed the FTIR and XRD results of CNSL applied to ceramic clay materials. This investigation is encouraging and has shown that during the period investigated, the corrosive components in seawater (Cl, Na+, SO42−, Mg2+, K+, and Ca2+) did not affect the mineralogy of fired clay. However, it was not possible to determine the corrosion mechanism.

4. Conclusions

The anticorrosive action of cashew nut shell liquid on ceramic materials was investigated in this study through immersion corrosion testing. A clay from northeastern Brazil was used to make specimens for the tests. Sets of prismatic specimens coated with cashew nut shell liquid were submerged in a corrosive solution corrosive for periods of 18, 32, and 70 days and compared with other specimens without cashew nut shell liquid also immersed in a corrosive environment. At the end of 70 days in corrosive solution, the ceramic specimens without cashew nut shell liquid showed signs of wear on the surface, associated with an average mass loss of 20 mg and an average corrosive rate of 0.017 mm/year. These results verified that, although they have high hardness properties, ceramic materials can also suffer corrosion. The set of displaced bodies in cashew nut shell liquid showed no mass loss, reinforcing the potential of cashew nut shell liquid as a protective agent against corrosion on the surface of metallic material and ceramic materials. For the three chosen periods (18, 32, and 70 days), the sets of specimens immersed in CNSL showed a reduction in the percentage means of water absorption (6.08%, 4.69%, 3.86%) and porosity (10.40%, 8.24%, 6.84%) and increased in the mean flexural strength modulus (5.89 MPa, 6.22 MPa, 8.76 MPa). This may have occurred due to the prolonged exposure time of these materials to the corrosive solution, increasing the encrusted mass on the surface, thus creating a protective layer next to the cashew nut shell liquid. Notably, this work presents a low-cost solution, with sustainable raw materials and green additives. Therefore, the authors encourage the use of cashew nut shell liquid as a protective anticorrosive paint on solid bricks fired in any kiln, both the intermittent kiln common for small brick kilns and the Hoffmann kiln (or variants) in large brick kilns, where the cooking time temperature is usually around 800 °C. As the painting application conditions are variable (in outdoor parts, on construction sites, etc.) and drying (or curing) takes place at room temperature, this type of painting is called industrial painting; due to its industrial character, it is processed by the direct immersion of the bricks in cashew nut shell liquid.

Author Contributions

Conceptualization, K.d.S.L. and P.R.S.T.; methodology, K.d.S.L. and P.R.S.T.; software, K.d.S.L.; validation, K.d.S.L. and J.M.E.d.M.; formal analysis, K.d.S.L. and P.R.S.T.; investigation, K.d.S.L., A.A.d.C.J. and P.R.S.T.; resources, K.d.S.L.; writing—original draft preparation, K.d.S.L.; writing—review and editing, J.M.E.d.M.; visualization, K.d.S.L. and J.M.E.d.M.; supervision, J.M.E.d.M.; project administration, J.M.E.d.M.; funding acquisition, K.d.S.L. All authors have read and agreed to the published version of the manuscript.

Funding

This research was funded by the Interinstitutional Doctoral Program (Dinter—funding number 45/2018).

Institutional Review Board Statement

Not applicable.

Informed Consent Statement

Not applicable.

Data Availability Statement

The data used to support the findings of this study are included in the article.

Acknowledgments

We acknowledge CAPES, UFPI, and IFPI. We thank Euroalimentos Ltd.a for the CNSL donation, Renata Barbosa and Tatyane Alves for their suggestions, and Bruna Silva for this paper’s translation/revision.

Conflicts of Interest

The authors declare no conflict of interest.

References

  1. Kano, Y.; Ikeda, I.; Iyasu, T.; Yamaguchi, Y.; Yamada, Y.; Sakurada, O. Relationship between Corrosion Form and Elution Behavior of Copper Tubes Surfaces with Different Residual Carbon Amounts. Mater. Sci. Appl. 2022, 13, 595–602. [Google Scholar] [CrossRef]
  2. He, J.; Song, M.; Chen, K.; Kan, D.; Zhu, M. Polymer-Derived Ceramics Technology: Characteristics, Procedure, Product Structures, and Properties, and Development of the Technology in High-Entropy Ceramics. Crystals 2022, 12, 1292. [Google Scholar] [CrossRef]
  3. Bauer, L.A.F. Materiais de Construção; LTC: Rio de Janeiro, Brazil, 2019; ISBN 978-85-216-3235-1. [Google Scholar]
  4. Jose, S.A.; Merbin, J.; Pradeep, L.M. Cermet Systems: Synthesis, Properties, and Applications. Ceramics 2022, 5, 210–236. [Google Scholar] [CrossRef]
  5. Coelho, A.C.V.; de Souza Santos, P.; de Souza Santos, H. Argilas especiais: O que são, caracterização e propriedades. Química Nova 2007, 30, 146. [Google Scholar] [CrossRef]
  6. Lakhdar, Y.; Tuck, C.; Binner, J.; Terry, A.; Goodridge, R. Additive manufacturing of advanced ceramic materials. Prog. Mater. Sci. 2021, 116, 100736. [Google Scholar] [CrossRef]
  7. Gogotsi, Y.G.; Lavrenko, V.A. Corrosion of High-Performance Ceramics; Springer: Berlin/Heidelberg, Germany, 1992. [Google Scholar]
  8. McCaulay, R.A. Corrosion of Ceramic Materials; CRC Press: Boca Raton, FL, USA, 2013. [Google Scholar]
  9. Valenzuela-Gutierrez, A.; Lopez-Cuevas, J.; Gonzalez-Angeles, A.; Pilalua-Díaz, N. Addition of ceramics materials to improve the corrosion resistance of alumina refractories. SN Appl. Sci. 2019, 1, 784. [Google Scholar] [CrossRef]
  10. Krasnyi, B.L.; Tarasovskii, V.P.; Rakhmanova, E.V.; Bondar’, V.V. Resistência Química de Materiais Cerâmicos em Ácidos e Alcalis. Glass Ceram. 2004, 61, 337–339. [Google Scholar] [CrossRef]
  11. AMPP. Corrosion in the Water and Wastewater Industry. 2021. Available online: https://www.ampp.org/technical-research/what-is-corrosion/corrosion-reference-library/water-wastewater (accessed on 17 March 2023).
  12. Baboian, R. Corrosion—A National Problem; ASTM Stantardization News: West Conshohocken, PA, USA, 1986. [Google Scholar]
  13. Chipera, S.J.; Bish, D.L. Fitting full X-ray diffraction patterns for quantitative analysis: A method for readily quantifying crystalline and disordered phases. Adv. Mater. Phys. Chem. 2013, 3, 47–53. [Google Scholar] [CrossRef]
  14. Avizovas, R.; Baskutis, S.; Navickas, V.; Tamándl, L. Effect of Chemical Composition of Clay on Physical-Mechanical Properties of Clay Paving Blocks. Buildings 2022, 12, 943. [Google Scholar] [CrossRef]
  15. Golestani, G.; Shahidi, M.; Ghazanfari, D. Evacuação eletroquímica de drogas antibacterianas como inibidores ecológicos para corrosão de aço carbono em solução de HCl. Appl. Surf. Sci. 2014, 308, 347–362. [Google Scholar] [CrossRef]
  16. Paul, S.; Kar, B. Mitigação da corrosão do aço leve em ácido por inibidores verdes: Fermento, pimenta, alho e café. ISRN Corros. 2012. [Google Scholar] [CrossRef]
  17. Mohammed, H.; Sobri, S. Corrosion inhibition studies of cashew nut (Anacardium occidentale) on carbon steel in 1.0 M hydrochloric acid environment. Mater. Lett. 2018, 229, 82–84. [Google Scholar] [CrossRef]
  18. Iloamaeke, I.M.; Onuegbu, T.U.; Umeobika, U.C.; Umedum, N.L. Abordagem verde para inibição de corrosão de aço macio usando Emilia sonchifolia e Vitex doniana em meio HCl 2.5M. Int. J. Sci. Mod. Eng. 2013, 1, 48–52. [Google Scholar]
  19. Tran, D.T.; Lee, H.S.; Singh, J.K. Influence of phosphate ions on passive film formation in amino acid-containing concrete pore solutions with chloride ions. J. Build. Eng. 2023, 66, 105834. [Google Scholar] [CrossRef]
  20. Huang, L.; Liu, Y.; Wang, Z.M.; Lu, W.Y.; Li, X.Y.; Li, H.J.; Wu, Y.C. Exploration of procyanidin C1 from Uncaria laevigata as a green corrosion inhibitor in industry: Electrochemical assessment, theoretical simulation, and environmental safety. Sep. Purif. Technol. 2023, 318, 123950. [Google Scholar] [CrossRef]
  21. Ienascu, I.M.C.; Căta, A.; Chis, A.A.; Ştefănut, M.N.; Sfîrloagă, P.; Rusu, G.; Frum, A.; Arseniu, A.M.; Morgovan, C.; Rus, L.L.; et al. Some Brassicaceae Extracts as Potential Antioxidants and Green Corrosion Inhibitors. Materials 2023, 16, 2967. [Google Scholar] [CrossRef]
  22. Mazzetto, S.E.; Lomonaco, D. Óleo da Castanha de caju: Oportunidades e desafios no contexto do desenvolvimento e sustentabilidade industrial. Química Nova 2009, 32, 732–741. [Google Scholar] [CrossRef]
  23. Ike, D.C.; Ibezim-Ezeani, M.U.; Akaranta, O. Cashew nutshell liquid and its derivados in oil field applications: An update. Green Chem. Lett. Rev. 2021, 14, 620–633. [Google Scholar] [CrossRef]
  24. Furtado, L.B.; Nascimento, R.C.; Seidl, P.R.; Guimarães, M.J.O.C.; Costa, L.M.; Rocha, J.C.; Ponciano, J.A.C. Eco-friendly corrosion inhibitors based on Cashew nut shell liquid (CNSL) for acidizing fluids. J. Mol. Liq. 2019, 284, 393–404. [Google Scholar] [CrossRef]
  25. Nunes, M.S.; Bandeira, R.M.; Figueiredo, F.C.; dos Santos Junior, J.R.; de Matos, J.M.E. Corrosion protection of stainless steel by a new and low-cost organic coating obtained from cashew nutshell liquid. J. Appl. Polym. Sci. 2022, 140, 53420. [Google Scholar] [CrossRef]
  26. NBR 6457; Amostras de Solo—Preparação Para Ensaios de Compactação e Ensaios de Caracterização. Associação Brasileira de Normas Técnicas: Rio de Janeiro, Brazil, 2016.
  27. NBR 7180; Solo—Determinação do Limite de Plasticidade. Associação Brasileira de Normas Técnicas: Rio de Janeiro, Brazil, 2016.
  28. NBR 7181; Solo—Análise Granulométrica. Associação Brasileira de Normas Técnicas: Rio de Janeiro, Brazil, 2018.
  29. NBR NM-ISO 565; Peneiras de Ensaio—Tela de Tecido Metálico, Chapa Metálica Perfurada e Lâmina Eletroformada—Tamanhos Nominais de Abertura. Associação Brasileira de Normas Técnicas: Rio de Janeiro, Brazil, 1997.
  30. NBR 6459; Solo—Determinação do Limite de Liquidez. Associação Brasileira de Normas Técnicas: Rio de Janeiro, Brazil, 2017.
  31. NBR 10611; Corpos de Prova—Formas e Tipos de Ensaios—Padronização. Associação Brasileira de Normas Técnicas: Rio de Janeiro, Brazil, 2011.
  32. ASTM G1:03(2017)e1; Standard Practice for Preparing, Cleaning, and Evaluating Corrosion Test Specimens. American Society for Testing and Materials: West Conshohocken, PA, USA, 2017.
  33. Furtado, P. Pintura Anticorrosiva dos Metais; LTC: Rio de Janeiro, Brazil, 2010. [Google Scholar]
  34. NACE TM0499-2009; Standard Test Method—Immersion Corrosion Testing of Ceramic Materials. National Association of Corrosion Engineers: Houston, TX, USA, 2009.
  35. ASTM G4:01(2014); Standard Guide for Conducting Corrosion Tests in Field Applications. American Society for Testing and Materials: West Conshohocken, PA, USA, 2014.
  36. NACE/ASTM TM0169/G31-21; Standard Guide for Laboratory Immersion Corrosion Testing of Metals. NACE/ASTM International: West Conshohocken, PA, USA, 2021.
  37. ASTM D1141:98(2021); Standard Practice for the Preparation of Substitute Ocean Water. American Society for Testing and Materials: West Conshohocken, PA, USA, 2021.
  38. NBR ISO 10545-3; Placas Cerâmicas Parte 3: Determinação da Absorção de Água, Porosidade Aparente, Densidade Relativa Aparente e Densidade Aparente. Associação Brasileira de Normas Técnicas: Rio de Janeiro, Brazil, 2020.
  39. NBR ISO 10545-4; Placas Cerâmicas Parte 4: Determinação da Carga de Ruptura e Módulo de Resistência à Flexão. Associação Brasileira de Normas Técnicas: Rio de Janeiro, Brazil, 2020.
  40. ASTM C1161:18(2023); Standard Test Method for Flexural Strength of Advanced Ceramics at Ambient Temperature. American Society for Testing and Materials: West Conshohocken, PA, USA, 2023.
  41. ASTM C674:13(2023); Standard Test Methods for Flexural Properties of Ceramic Whiteware Materials. American Society for Testing and Materials: West Conshohocken, PA, USA, 2023.
  42. Das, B.M.; Sobhan, K. Fundamentos de Engenharia Geotécnica. Tradução da 8ª Edição Norte-Americana: Noveritis do Brasil; Cengage Learning: São Paulo, Brazil, 2017. [Google Scholar]
  43. Neto, P.M.S. Mecânica dos Solos, 1st ed.; Elsevier: Rio de Janeiro, Brazil, 2018. [Google Scholar]
  44. Bodó, B.; Jones, C. Introdução à Mecânica dos Solos. Tradução Maria Esther Soares Marques, Luiz Antonio Vieira Carneiro; LTC: Rio de Janeiro, Brazil, 2017; ISBN 978-85-216-3269-6. [Google Scholar]
  45. Santos, P.S. Ciência e Tecnologia de Argilas—Vol. 1; Edgar Blucher: São Paulo, Brazil, 1989. [Google Scholar]
  46. Gonçalves, W.P.; Silva, V.J.; Lima, L.K.S.; Neves, G.A.; Lira, H.L.; Santana, L.N.L. Efeito da temperatura de queima sobre as propriedades de materiais cerâmicos. In Proceedings of the 22º Congresso Brasileiro de Engenharia e Ciência dos Materiais, Natal, Brazil, 6–10 November 2016. [Google Scholar]
  47. Reis, A.S.; Oliveira, J.N.; Della-Sagrillo, V.P.; Valenzuela-Diaz, F.R. Caracterização e avaliação das propriedades cerâmicas de argila utilizada em cerâmica estrutural. In Proceedings of the 21º Congresso Brasileiro de Engenharia e Ciência dos Materiais, Cuiabá, Brazil, 9–13 November 2014. [Google Scholar]
  48. Carvalho, A.A.d., Jr.; Leite, K.d.S.; Elias de Matos, J.M. Viability of Morisca Powder Tailings for Ceramic Applications. Minerals 2023, 13, 459. [Google Scholar] [CrossRef]
  49. Nazile, U. The relationship between geotechnical index properties and the pore-size distribution of compacted clayey silts. Sci. Eng. Compos. Mater. 2015, 22, 623–632. [Google Scholar] [CrossRef]
  50. Mitchell, J.K.; Kenichi, S. Fundamentals of Soil Behavior, 3rd ed.; Wiley: New York, NY, USA, 2005. [Google Scholar]
  51. NBR 15270; Componentes Cerâmicos. Associação Brasileira de Normas Técnicas: Rio de Janeiro, Brazil, 2017.
  52. Grance, E.G.O.; Souza Jr, F.G.; Varela, A.; Pereira, E.D.; Oliveira, G.E.; Rodrigues, C.H.M. New petroleum absorbers based on lignin-cnsl-formol magnetic nanocomposites. J. Appl. Polym. Sci. 2012, 126, E305–E312. [Google Scholar] [CrossRef]
  53. Patel, R.N.; Bandyopadhyay, S.; Ganesh, A. Economic appraisal of supercritical fluid extraction of refined cashew nut shell liquid. J. Chromatogr. A 2006, 1124, 130–138. [Google Scholar] [CrossRef] [PubMed]
  54. Santos, R.C.; Amorim, A.G.N.; Thomasi, S.S.; Figueiredo, F.C.; Carneiro, C.S.; Silva, P.R.P.; Vasconcelos Neto, W.R.; Ferreira, A.G.; Santos Junior, J.R.; Leite, J.R.S.A. Development of an electrolytic method to obtain antioxidant for biodiesel from cashew nut shell liquid. Fuel 2015, 144, 415–422. [Google Scholar] [CrossRef]
  55. Szabo, Z.G.; Gabor, M.; Varga, N.; Poppl, J.; Najand, J. Multi Method Approach to follow the Changes in Kaolinite Structure. Therm. Anal. 1974, 2, 569–582. [Google Scholar]
  56. Farmer, V.C. Infrared Spectra of Minerals; Mineralogical Society: London, UK, 1974; pp. 1149–1173. [Google Scholar]
  57. Venkatachalapathy, R.; Sridharan, T.; Dhanapandian, S.; Manoharan, C. Determination of firing temperature of ancient potteries by means of infrared and Mossbauer studies. Spectrosc. Lett. 2002, 35, 769–779. [Google Scholar] [CrossRef]
  58. Franco, F.; Cecila, J.A.; Perez-Maqueda, L.A.; Perez-Rodriguez, J.L.; Gomes, C.S.F. Particle-size reduction of dickite by ultrasound treatments: Effect on the structure, shape and particle-size distribution. Appl. Clay Sci. 2007, 35, 119–127. [Google Scholar] [CrossRef]
  59. Kodama, H. Infrared Spectra of Minerals: Reference Guide to Identification and Characterization of Minerals for the Study of Soil; Agriculture Canada, Research Branch: Ottawa, ON, Canada, 1985; p. 198. [Google Scholar]
  60. Manoharan, C.; Sutharsan, P.; Dhanapandian, S.; Venkatachalapathy, R. Spectroscopic and thermal analysis of red clay for industrial applications from Tamilnadu, India. J. Mol. Struct. 2012, 1027, 99–103. [Google Scholar] [CrossRef]
  61. Russell, J.D. Infrared Methods—A Hand Book of Determinative Methods in Clay Mineralogy; Wilson, M.J., Ed.; Blackie and Son Ltd.: New York, NY, USA, 1987. [Google Scholar]
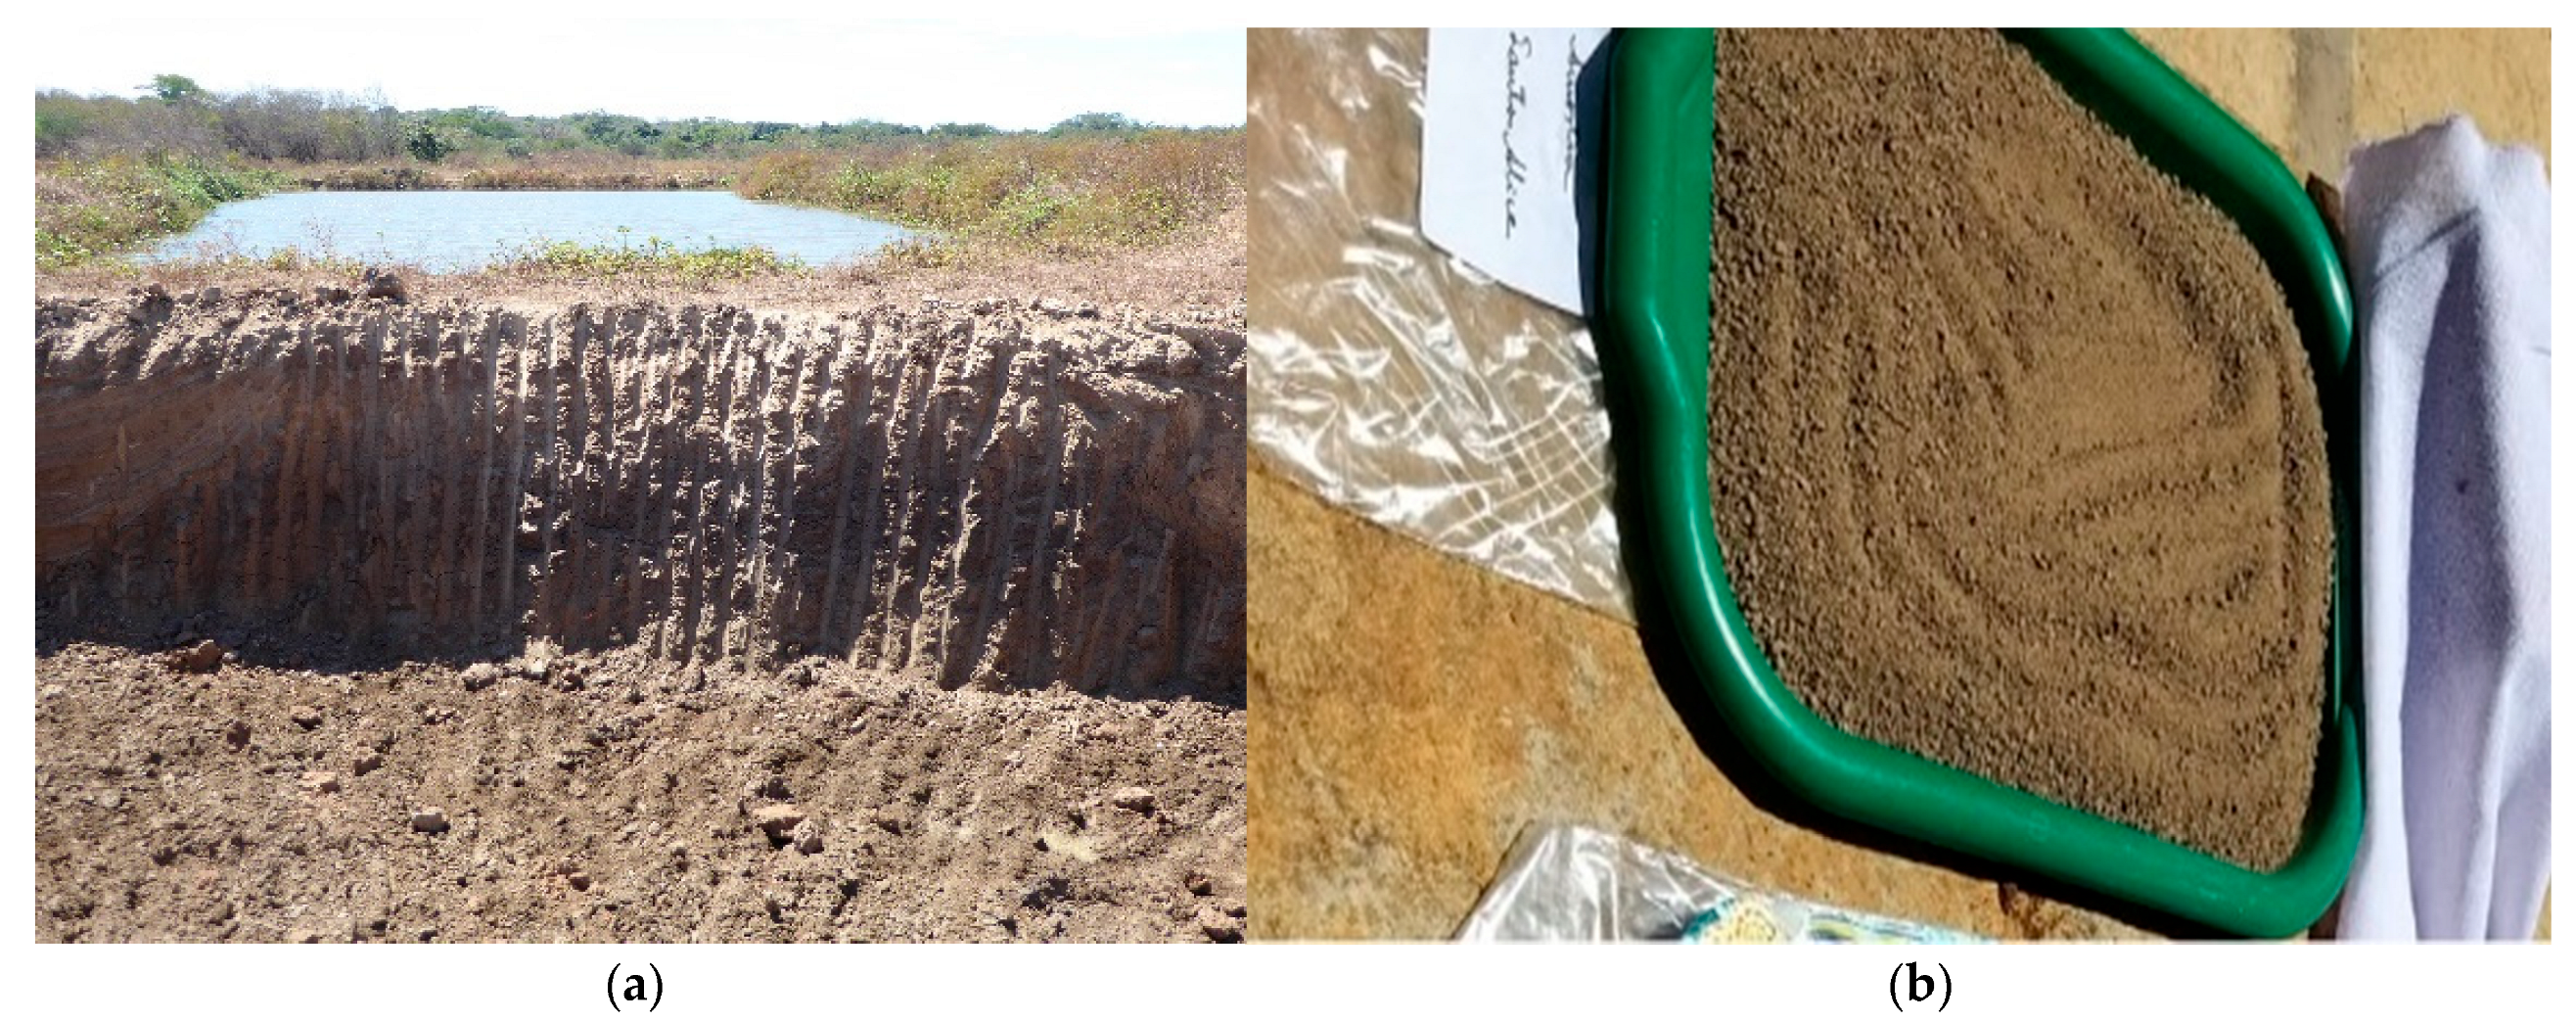
Figure 1. Extraction (a) and preparation (b) of the clay.
Sustainability 15 08743 g001
Figure 2. Hydraulic press (a); drying oven (b); muffle furnace (c); specimens sintered at 800 °C (d).
Sustainability 15 08743 g002
Figure 3. Beaker with technical CNSL (a); heating the CNSL to 180 °C (b); immersion of the specimen in heated CNSL (c); specimens after immersion in CNSL (d).
Sustainability 15 08743 g003
Figure 4. Joint to hold the specimens: a piece of PVC pipe to hold the specimens (a), a grapple to hold the piece of pipe (b), and support to hold the set of grapple, piece of pipe, and specimens (c); immersion tester (d).
Sustainability 15 08743 g004
Figure 5. Measuring the mass of the specimens before immersion (a); an optical instrument for observation (b).
Sustainability 15 08743 g005
Figure 6. Granulometric distribution curve for clay.
Sustainability 15 08743 g006
Figure 7. Flow curve for clay.
Sustainability 15 08743 g007
Figure 8. Plasticity chart.
Sustainability 15 08743 g008
Figure 9. Diffractogram of the clay samples (a = clay, b = clay fired at 800 °C, c = clay fired at 800 °C and exposed to a salt solution (CPLW70), d = clay fired at 800 °C + CNSL, and e = clay fired at 800 °C + CNSL and exposed to a salt solution (CPL70)).
Sustainability 15 08743 g009
Figure 10. TG and DTG curve (a); DTA curve of the clay sample (b).
Sustainability 15 08743 g010
Figure 11. Comparison of some surfaces of specimens from the CPL18 set: before (ac) and after (df) immersion in corrosive solution.
Sustainability 15 08743 g011
Figure 12. Comparison of some surfaces of specimens from the CPL32 set: before (ac) and after (df) immersion in corrosive solution.
Sustainability 15 08743 g012
Figure 13. Comparison of some surfaces of specimens from the CPL70 set: before immersion in corrosive solution (ac), after removing the corrosive solution (df), and after cleaning the body (gi).
Sustainability 15 08743 g013
Figure 14. Comparison of some surfaces of specimens from the CPWL70 set: before immersion in corrosive solution (ac), after removing the corrosive solution (df), and after cleaning the body (gi).
Sustainability 15 08743 g014
Figure 15. FTIR spectroscopy for (a) CNSL, (b) clay, (c) clay fired at 800 °C, and (d) clay fired at 800 °C + CNSL.
Sustainability 15 08743 g015
Table 1. The indicators of each ion concentration of simulated seawater.
Ion TypeClNa+SO42−Mg2+K+Ca2+
Simulated Seawater (mg/L)17,600956024301350380400
Table 2. Atterberg limits.
LL *LP **IP ***h IC ††
40.08%23.45%16.63%23.10%1.02
* Liquidity limit, ** plasticity limit, *** plasticity index, moisture content, †† consistency index.
Table 3. Chemical analysis of the clay sample.
Oxides(%)
SiO252.75
Al2O321.96
Fe3O49.72
K2O3.16
TiO22.19
MgO1.09
Others0.44
Fire loss8.69
Table 4. Corrosion rate and encrusted mass of CP immersed in the corrosive solution.
SamplesW1 (g)W2 (g)W3 (g)W (mg)A (cm2)T (h)ρ (g/cm3)TC (mm/Year)WSC (g)
CPL1818.7620.5218.81-37.254321.71-1.71
CPL3218.1119.8218.16-36.837681.75-1.66
CPL7018.6420.4818.70-37.3316801.77-1.78
CPWL7019.5921.8919.572038.4316801.600.0172.32
CP = set of specimens; W1 = average of the initial masses of the specimens of each set before exposure to the corrosive solution; W2 = average mass of corroded specimens from each set before cleaning; W3 = average mass of corroded specimens from each set after cleaning; W = W1 − W3, average mass loss of the specimens in each set; A = average of the surface areas of the specimens in each set; ρ = mean apparent density of the specimens in each set; TC = average corrosion rate of the specimens for the set in which there was corrosion; WSC = W2 − W3, average of the embedded masses of the specimens of each set.
Table 5. Absorption, porosity, and flexural strength of CP.
SamplesAA (%)AP (%)ρ (g/cm3)BL (N)FS (MPa)Q
CPL186.0810.401.71494.665.890.70
CPL324.698.241.75495.116.220.74
CPL703.866.841.77743.368.761.04
CPWL7010.1116.201.60733.207.94-
CPNC7.5812.631.67668.158.44-
AA: average water absorption of the specimens of each set; AP: average apparent porosity of the specimens in each set; ρ: mean apparent density of the specimens in each set; BL: average breaking load of the specimens of each set; FS: mean flexural strength modulus of the specimens in each set; Q: ratio between RF (of the immersed bodies in CNSL) and the modulus of resistance to flexion of specimen CPNC.
Disclaimer/Publisher’s Note: The statements, opinions and data contained in all publications are solely those of the individual author(s) and contributor(s) and not of MDPI and/or the editor(s). MDPI and/or the editor(s) disclaim responsibility for any injury to people or property resulting from any ideas, methods, instructions or products referred to in the content.