Abstract
In the process of rice straw nutrient bowl tray drying, real-time detection of changes in moisture content to achieve automatic adjustment of drying factors is one of the important means to ensure its drying quality. At present, the main method for measuring the moisture content of rice straw nutrient bowl trays is the drying and weighing method. This method is not only time consuming, labor intensive, and complex to operate, but also has poor real-time performance, which cannot meet the demand for real-time detection of the moisture content in the production process of rice straw nutrient bowl trays. In this regard, a real-time moisture content detection method for rice straw nutrient bowl trays based on hyperspectral imaging technology was studied. In this study we took the rice straw nutrient bowl tray during the drying process as the research object, adopted a single factor experiment, took microwave power, hot air temperature, and hot air speed as the drying factors, and took the moisture content of the rice straw nutrient bowl tray as the drying index. The rice straw nutrient bowl tray was dried according to the designed drying conditions. When drying, we removed the rice straw nutrient bowl tray every 5 min for weighing and collected hyperspectral image data within the wavelength range of 400~1000 nm until its quality remained unchanged. A total of 204 samples were collected. Using the average spectrum of the region of interest as the sample for effective spectral information, spectral preprocessing was performed using multivariate scattering correction (MSC), standardization normal variables (SNV), and Savitzky–Golay convolution smoothing (SG) methods. Principal component analysis (PCA) and competitive adaptive reweighting (CARS) methods were adopted for the dimensionality reduction of the spectral data. Three prediction models of rice straw nutrient bowl tray moisture content, namely random forest regression (RF), particle swarm optimization support vector regression (PSO-SVR), and XGBoost model were constructed using the reduced dimension spectral data. Finally, the performance of the model was compared using the coefficient of determination (R2) and mean square error (RMSE) as evaluation indicators. The research results indicate that the PCA-PSO-SVR model established based on SG method preprocessing has the best predictive performance, with a training set decision coefficient R2C of 0.984, a training set mean square error RMSE-C of 2.775, a testing set decision coefficient R2P of 0.971, and a testing set mean square error RMSE-P of 3.448. The model therefore has a high accuracy. This study achieved rapid detection of water content in rice straw nutrition trays. This method provides a reliable theoretical basis and technical support for the rapid detection of rice straw nutrient bowl tray moisture content, and is of great significance for improving the quality of rice straw nutrient bowl trays; promoting the popularization and application of raising rice straw nutrient bowl tray seedlings and whole process mechanized planting technology system; improving soil structure; and protecting the ecological environment.
1. Introduction
China is a major agricultural country, producing approximately 1.04 billion tons of crop straw annually, ranking first in the world in terms of production [1]. At present, in addition to the “Five Modernizations” technology project [2], there are still about 200 million tons of straw that have not been developed and utilized annually [1]. The surplus straw is mainly treated by burning in the field, which not only causes serious environmental pollution and a large amount of resource waste [3], but also damages the soil’s drought resistance and moisture retention ability. With the country’s emphasis on environmental protection and soil fertility, the resource utilization of excess straw has become an urgent problem to be solved [4,5]. To address the above-mentioned issue, our research group has developed the rice straw nutrient tray. Rice straw nutrition bowl tray (referred to as rice seedling tray) is the core of the rice straw nutrition bowl tray seedling cultivation and fully mechanized planting technology system. It is made mainly from crop straw as the raw material, to which nutritional additives, sterilization and disinfection agents, biological glue and pulp are added and processed through processes such as air pressure molding, drying, and shaping. The production practice has proved that the application of rice straw nutrition bowl trays seedling raising and whole process mechanized planting technology system to plant rice can consume a large amount of crop straw, broaden the resource utilization of straw, significantly improve the quality and yield of rice, improve the soil environment, increase the content of organic matter in the soil, and enhance soil fertility [4,6].
In the production of rice trays, the drying process is the determining factor for the drying quality of rice trays [7], and the change in moisture content of rice trays during the drying process is an important standard for judging the drying quality of rice trays. At present, the main method for measuring the moisture content of rice seedling trays is the drying and weighing method, which is not only time consuming, labor intensive, and complex to operate, but also has poor real-time performance. This poses great difficulties in studying the changes in moisture content of the rice straw nutrient bowl trays during the drying process and achieving an automatic adjustment of drying factors through the real-time detection of the moisture content of rice straw nutrient bowl trays during the drying process, to ensure their drying quality. With the continuous progress of spectral technology, the application of moisture content detection based on spectral technology is gradually increasing. For example, to quickly detect the water content of potato leaves, Sun Hong [8] and others collected hyperspectral data of 71 leaves, used correlation analysis and random forest to screen characteristic wavelengths, and established partial least squares regression models to verify that the set determination coefficients reached 0.933 and 0.941. Wei et al. [9] used tea as the research object to detect the moisture content and established an LS-SVR model. The accuracy of the model using both front and back modeling of tea was 0.951 and 0.918, respectively, proving the feasibility of using the hyperspectral prediction of tea moisture content. Zhang Jue et al. [10] used a hyperspectral imaging system to quickly, non-destructively, and accurately detect the moisture content of silage corn raw materials. They obtained hyperspectral images of silage corn raw materials and measured the actual moisture content using an oven heating method. Based on an improved discrete particle swarm optimization algorithm, feature bands were extracted and a partial least squares regression model was established to verify that the set decision coefficient reached 0.81. Dong et al. [11] used hyperspectral technology to obtain hyperspectral data of black tea and modeled it. Based on the SNV-Si-CARS-ELM model, they successfully predicted black tea moisture content with a prediction accuracy of 0.994. Li Hong et al. [12] used hyperspectral technology to study the moisture content of a lettuce canopy and achieved the visual detection of lettuce canopy leaves. Zhang Zhitao et al. [13] used hyperspectral technology to study soil moisture content, providing a new method for the rapid detection of soil moisture content. Liu et al. [14] collected hyperspectral data of pork slices and developed an MLR model, achieving a testing set accuracy of 0.914 for the water content detection of pork slices.
However, current research on using hyperspectral technology to detect moisture content mainly focuses on soil [15], meat [16], crops [17], and plant leaves [18]. There is no report on the use of hyperspectral technology to detect the moisture content of rice straw nutrient bowl trays. Therefore, this study proposes the use of hyperspectral technology for the water content detection in rice straw seedling trays.
In summary, this study focuses on the water content detection of seedling trays during the drying process using hyperspectral technology. Using multiple spectral preprocessing and dimensionality reduction methods, multiple moisture content detection models for rice seedling trays were constructed. Through comparative analysis, the optimal prediction model was determined to achieve the rapid water content detection of rice seedling trays. This provides assurance for improving the drying quality of rice seedling trays and is significant in promoting the popularization and application of rice straw nutrient bowl trays seedling raising and whole process mechanized planting technology system.
2. Materials and Methods
2.1. Sample Preparation
The preparation location of the rice seedling tray was the Heilongjiang Province Ecological Rice Seedling Raising Device and Whole Process Mechanized Engineering Technology Research Center. During preparation, the crushed rice straw, nutritional additives, sterilization and disinfection agents, bio glue, and pulp were made into a slurry in a certain proportion, and compressed into shape using a pneumatic bowl tray-forming machine under the following working conditions: vacuum degree −0.09 MPa, holding time 14 s, and adsorption time 5 s. The size of the formed rice seedling tray was 581 (long) × 273 (wide) × 16 (high) mm, with a total of 612 holes and an initial moisture content of approximately 81% (wet basis). A hot air-assisted microwave dryer was used to dry the rice seedling tray. The dried rice straw nutrient bowl tray is shown in Figure 1.
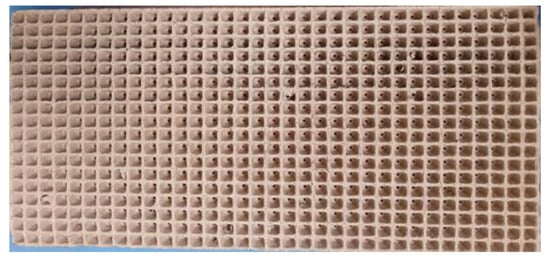
Figure 1.
Dried Rice Straw Nutrient Bowl Tray.
This study adopted a single factor experimental design for drying conditions. The single factor experimental conditions were as follows: a fixed heating temperature of 65°C, a hot air speed of 20 m/s, and a change in microwave power of 1000, 1200, 1400, 1600, and 1800 W. The fixed microwave power was 1400 W, the wind speed was 20 m/s, and the heating temperature was changed to 55, 60, 65, 70, and 75℃. The fixed microwave power was 1400 W, the heating temperature was 65 ℃, and the wind speed was changed to 10, 15, 20, 25, and 30 m/s. A total of 15 sets of experiments were conducted. When drying, we first ran the hot air-drying system for 10–20 min for preheating, placed the rice seedling tray on a tray, placed it in the drying room, and dried it according to the designed drying conditions. During the drying process, the rice seedling trays were weighed every 5 min and hyperspectral data were collected until the moisture content (wet basis) of the trays reached about 10%. The collected data were used to establish a hyperspectral moisture content prediction model.
2.2. Determination of Moisture Content in Rice Seedling Trays
The specific steps for measuring the moisture content of rice seedling trays were as follows: we washed the trays and placed them in a hot air-assisted microwave dryer. We set the temperature of the hot air at 105 °C, dried them using a hot air system for 1 h, took them out and weighed them, and repeated the drying until the quality of the trays remained unchanged. Then, we placed the rice seedling tray on a tray and weighed it; placed it in a hot air-assisted microwave dryer and dried it under the designed experimental conditions; and took it out and weighed it every five minutes to collect hyperspectral data. The moisture content calculation is shown in Formula (1) [19]:
In the formula, Dc is the moisture content of the material on a wet basis at time t, %; mt is the mass of the material at time t, g; and md is the dry matter mass of the material, g.
2.3. Spectral Data Collection and Region of Interest Selection
Sample collection requires a darkroom environment, with the light source preferably confined to a halogen lamp on the experimental platform. Therefore, sample collection should be conducted in a completely dark room or during the late-night hours. Considering these factors, the optimal time for sample collection is from 23:00 to 02:00 at night, with all external light sources in the laboratory sealed off to ensure complete darkness.
The experimental data were collected using a hyperspectral imaging system produced by Headwall Company, with a spectral range of 400~1000 nm, a sampling wavelength interval of 0.74 nm, and a resolution of 2~3 nm. We set the parameters as follows: exposure time was 250 ms, object distance was 450 mm, step length was 120 mm, and movement speed was 4 mm/s. The image sensor should be fixed, and the seedling tray should be placed on the loading platform for spectral data acquisition using a line scanning method. During the collection process, the halogen lamp should be adjusted to its maximum power of 50 W, and the lampshade should be adjusted to achieve an incident angle of 45° on the surface of the rice seedling tray sample, with the distance between the light source and the sample surface approximately 20 cm. To reduce the noise caused by system light source factors or camera dark current interference, after each group of samples was photographed, a black-and-white calibration correction was performed on the system.
Due to the unevenness of the front of the rice seedling tray and the large height difference, diffuse reflection may occur. Therefore, the back of the rice seedling tray was selected for spectral data collection, and holes were avoided when we selected areas of interest. The selected location is shown in Figure 2.
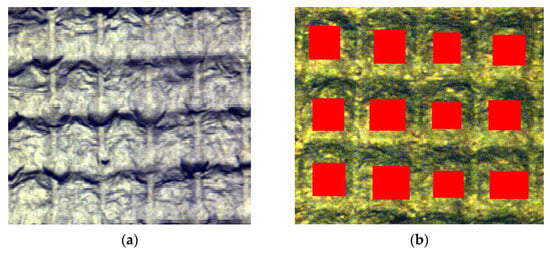
Figure 2.
(a) Hyperspectral imaging of Rice Straw Nutrient Bowl Tray; (b) schematic diagram of ROI selection for rice seedling tray samples.
2.4. Hyperspectral Preprocessing Methods
The collection process of hyperspectral data is prone to interference from the surrounding environment [20] (such as scattered light, current fluctuations, diffuse reflection, etc.). Due to the uneven height of the rice seedling tray, there is a significant difference in the brightness of the image. Therefore, it is necessary to preprocess the rice seedling tray spectral data. In this article we used Multiple Scatter Correction (MSC), Standardization Normal Variables (SNV), and Savitzky–Golay Convolutional Smoothing (SG) to preprocess spectral data. Among them, MSC can effectively eliminate the impact of diffuse reflection on spectral data [21,22], SNV can eliminate scattering effects by scaling and centering each individual spectrum [23], and SG can to some extent eliminate the impact of noise caused by external interference [24,25]. After processing the hyperspectral information through three preprocessing methods, the spectral data were used as the input variable and the moisture content of the rice seedling tray was used as the output variable for subsequent modeling work.
2.5. Dimension Reduction Method
Hyperspectral data contains many spectral bands, and the direct use of full-band modeling can easily lead to high model complexity and overfitting problems, so it is necessary to reduce the dimensions of the spectral data before subsequent modeling. There are two main types of dimensionality reduction methods for hyperspectral data. One is to perform mathematical transformations on the original spectral data to obtain new feature combinations, which is called feature extraction; another type is to directly select effective feature bands from the original spectral data, known as feature selection. Principal component analysis (PCA) is a commonly used feature extraction method [26], which has the advantages of low complexity and no parameter settings. It is used by many researchers for the feature extraction of hyperspectral data. PCA can convert multiple features into a few principal components, which are uncorrelated linear combinations of the original variables and can reflect most of the information in the original data [27]. Competitive adaptive reweighted sampling (CARS) is a common feature band selection method [28], which can improve the collinearity problem between spectral features. The variables included in this set are the optimal combination of feature variables [29]; in this study we used two methods, PCA and CARS, to reduce the dimensionality of rice seedling tray spectral data.
2.6. Modeling Methods
2.6.1. Random Forest Regression
Random forest (RF) belongs to the Bagging algorithm, which can be used to process high-dimensional data and has a strong adaptability to data sets. It obtains m subsets by randomly selecting n samples from the training samples and trains a decision tree for each subset separately; a total of m decision trees are trained. The output of random forest is the average of the prediction results of m decision trees [30]. In this paper, a random forest regression model was established based on the classification regression tree (CART). In the input space D composed of samples, for any partition feature A, the corresponding arbitrary partition point s was divided into datasets D1 and D2 on both sides. We found the feature and feature value partition point corresponding to the minimum sum of the mean squared deviations of D1 and D2, and the expression is:
where c1 is the sample output mean of the D1 dataset and c2 is the sample output mean of the D2 dataset.
We repeated the partitioning of the D1 and D2 subspaces until there were no features to partition; we constructed a regression tree with the nodes at this time.
2.6.2. Particle Swarm Optimization Support Vector Regression Model
Support Vector Regression (SVR) is a kernel function that transforms the original nonlinear regression problem into a dual problem in a high-dimensional feature space [31]. It has advantages in small sample, nonlinear, and high-dimensional data. Penalty function C and insensitive loss function parameters in SVR ε will affect the accuracy and generalization ability of the model [32,33], but in practical operation, it is difficult to select the optimal value between C and ε, so particle swarm optimization (PSO) is used for optimization. The goal of PSO is to enable all particles to find the optimal solution in the multi-dimensional hypervolume. Firstly, we assigned initial random positions and initial random velocities to all particles in space. Then, based on the velocity of each particle, the known optimal global position in space, and the known optimal position of each particle were determined. The position of each particle was sequentially changed until the particles gather or aggregate around one or more optimal positions [34].
The principle of the particle swarm optimization algorithm is as follows: The optimization algorithm is a group of particles moving in the search space, influenced by their own best past position, pbest, and the best past position of the entire group or nearest neighbors, gbest. The formula for updating the d-th dimensional velocity of particle I in each iteration is:
where c1 and c2 are acceleration constants used to adjust the maximum step size of learning; r1 and r2 are random functions used to increase search randomness; and is the inertia weight, with a non-negative value, used to adjust the search range of the solution space.
The formula for updating the d-th dimensional position of particle I is:
where is the d-th dimensional component of the velocity vector of particle I in the k-th iteration, is the d-th dimensional component of the particle I position vector in the k-th iteration. The flow chart of the particle swarm optimization support vector regression algorithm is shown in Figure 3.
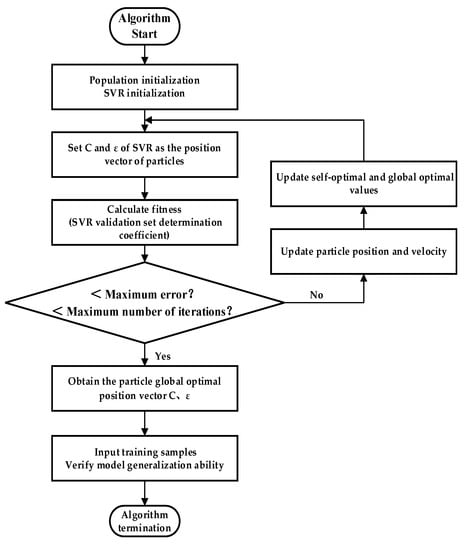
Figure 3.
Flow chart of the particle swarm optimization support vector regression algorithm.
2.6.3. Xgboost Model
XGBoost is a gradient-enhanced decision tree (GBDT) [35,36], which has the advantages of high adjustability and fast model training. In this study, a greedy algorithm was used to divide the tree; that is, we first calculated the loss function of the current tree, and then took the tree whose loss function decreased the most and whose gain function was the largest as the shape of the current tree.
2.6.4. Establishment and Evaluation of Regression Models
We used MSC-, SNV-, and SG-smoothing methods for spectral preprocessing. PCA and CARS methods were also used for spectral data dimensionality reduction. Using reduced dimensional spectral data, we established RF, PSO-SVR, and XGBoost models. In this article we used the coefficient of determination (R2) and root mean square error (RMSE) as evaluation indicators to analyze the fitting effect of the regression model, and then determined the quality of the model.
In the formula, yi represents the measured value of the i-th sample; y represents the predicted value of the i-th sample; represents the average measurement value; and n represents the number of samples.
In this study we used ENVI 5.2 for sample region-of-interest selection, drew spectral curves using Origin Pro 8, used The Unscrambler X 10.4 for spectral data preprocessing, and used Python 3.6 for spectral data dimensionality reduction and prediction model fitting.
3. Results
3.1. Data Statistics and Analysis
To visually distinguish the differences between samples with different moisture contents from the perspective of spectral curves, the spectral curves with moisture contents ranging from 0 to 10%, 10% to 20%, 20% to 30%, 30% to 40%, 40% to 50%, 50% to 60%, and above 70% were averaged, and the average spectral curve is shown in Figure 4. As shown in the figure, samples with a moisture content of 0–10% have the highest reflectivity, while samples with a moisture content above 70% have the lowest reflectivity. In the entire region of 400–1000 nm, the moisture content and reflectance of the rice seedling tray generally show a trend of higher moisture content and lower reflectance; this is consistent with previous research. The overall spectral curve exhibits an increasing trend between 400 and 792 nm, reaching the peak of the full spectrum reflectance at a wavelength of 792 nm. The spectral curve shows slight fluctuations between 792 and 877 nm. From 792 to 1000 nm, the spectral curve exhibits a decreasing trend. The peak values of the spectral curve are 0.947 (0–10%), 0.883 (10–20%), 0.827 (20–30%), 0.779 (30–40%), 0.719 (40–50%), 0.622 (50–60%), 0.501 (60–70%), and 0.369 (70% and above).
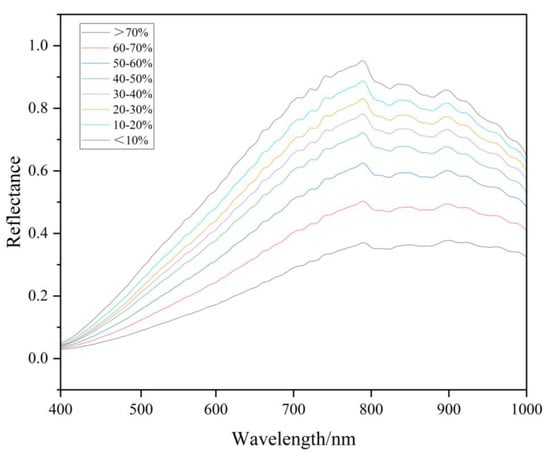
Figure 4.
Average spectral curves of bowl trays with different water contents.
3.2. Spectral Preprocessing
The original spectral curve and pre-treatment curve of the rice seedling tray are shown in Figure 5. Each curve in the Figure 5 represents the spectral values of a specific sample. From the graph, it can be seen that the original spectral data are relatively scattered, with a significant difference in brightness and darkness. The spectral data preprocessed by MSC and SNV are more concentrated than the original spectral data, and the trend and characteristics of changes are more obvious. The spectral data preprocessed by SG have no significant difference compared to the original data, but their curve is smoother, preserving most of the information in the original data.
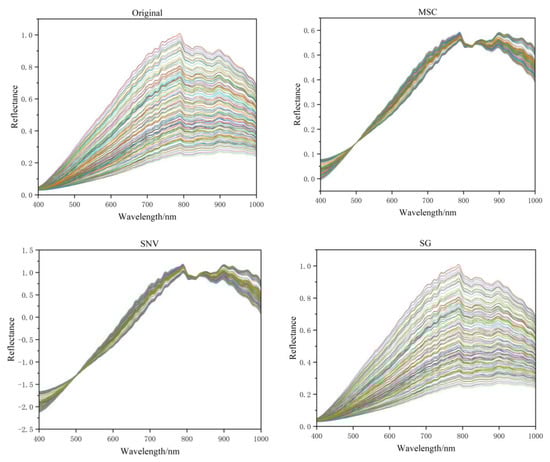
Figure 5.
Processing results of different spectral data preprocessing methods.
The PCC heatmap of the spectral data is shown in Figure 6. From the figure, it can be observed that there is a strong correlation between the bands. Therefore, it is necessary to perform dimensionality reduction on the data.
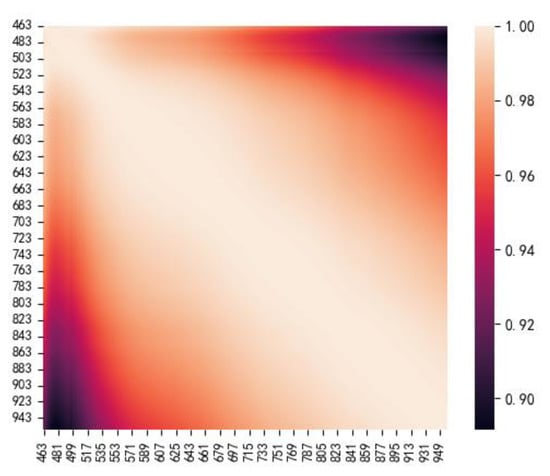
Figure 6.
PCC heatmap of hyperspectral data.
3.3. Spectral Data Dimensionality Reduction
The cumulative contribution rates of the top 10 principal components of the new feature matrix after dimensionality reduction using PCA are shown in Figure 7. From the figure, it can be seen that the cumulative contribution rates of the first four principal components of the original spectral data and the spectral data preprocessed by SG gradually increase, while the cumulative contribution rates after the fourth principal component do not increase significantly. To ensure that the reduced feature matrix contains as much information as possible, and to control the complexity of subsequent modeling, the first four principal components are selected for subsequent modeling work. The cumulative contribution rate of the first six principal components of the spectral data preprocessed by MSC and SNV gradually increases, and the cumulative contribution rate after the sixth principal component does not increase significantly. Therefore, the first six principal components are selected for subsequent modeling work.
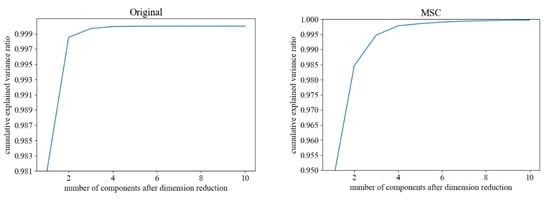
Figure 7.
Principal Component Cumulative Contribution Rate.
We used CARS to select feature bands from the original spectral data and preprocessed spectral data. The screening threshold was 0.8, and the Monte Carlo sampling frequency was 200. The screening process is shown in Figure 8. In the figure, it can be seen that as the number of runs increases, the number of characteristic wavelengths gradually decreases, and RMSECV first decreases and then increases. The characteristic wavelength results extracted by CARS from four different preprocessing methods of spectral data are shown in Table 1. From Table 1, it can be seen that the order of feature wavelengths extracted from different preprocessed hyperspectral is: SNV > SG > original hyperspectral > SNV, with the selected feature wavelengths accounting for 16.57%, 12.12%, 10.10%, and 9.02% of the total wavelength, respectively. The number of invalid wavelengths removed is 413, 435, 445, and 449, respectively.
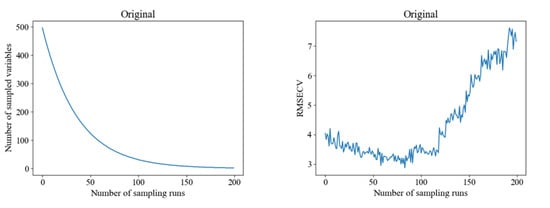
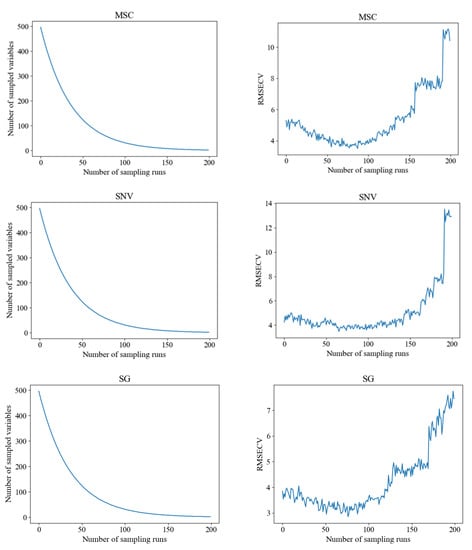
Figure 8.
CARS filtering feature wavelength process.

Table 1.
Hyperspectral characteristic wavelengths extracted by CARS.
3.4. Detection Results Based on Different Spectral Preprocessing Methods and Dimensionality Reduction Methods Modeling
To eliminate the influence of human factors on sample partitioning, a random partitioning method was employed in this study. During sample partitioning, the number of training samples is usually greater than that of testing samples. The ratio of training set to validation set and to testing set is set to 6:2:2 in this chapter, resulting in 142 training samples, 41 validation samples, and 41 testing samples. The sample partitioning results are shown in Table 2. As shown in the Table 2, the mean and standard deviation of the training set, validation set, and testing set are all relatively close, indicating a relatively uniform sample partitioning.
Table 2.
Statistics of rice seedling tray samples moisture content.
The selection of hyperparameters for each model is shown in the Table A1, Table A2 and Table A3. The process of PSO-optimized SVR is shown in the Figure A1. The results of the rice seedling tray moisture content model established based on different preprocessing methods and dimensionality reduction methods are shown in Table 3. The Taylor diagram for the training and testing datasets is shown in Figure 9.
Table 3.
Determination coefficients and mean square error of different modeling methods.
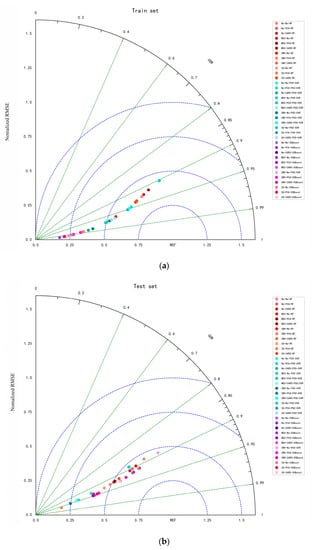
Figure 9.
(a) Taylor diagram of the train set; (b) Taylor diagram of the test set.
4. Discussion
4.1. Best Model Analysis
In this paper, RF, PSO-SVR, and XGBoost methods are used to establish a hyperspectral prediction model for estimating moisture content. The parameters of the RF and XGBoost models are selected by drawing learning curves. In the established RF model, SG-PCA-RF has the best performance; in the established PSO-SVR model, SG-PCA-PSO-SVR has the best performance; in the established XGBoost model, PCA-XGBoost has the best performance. The predicted results of these three models are shown in the Figure 10.
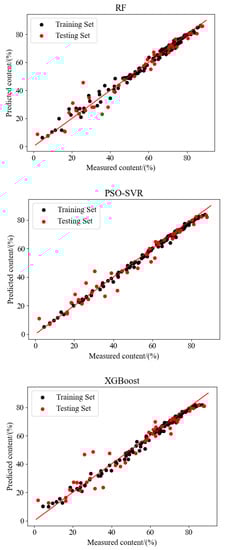
Figure 10.
Prediction results of three models.
It can be seen from Table 3 and Figure 9 that compared with the untreated spectral data, the difference between the training set determination coefficient (R2C) and the test set determination coefficient (R2P) is smaller when the pre-treated spectral data modeling is used. The RF and PSO-SVR models established using spectral data preprocessed by SG have better performance, while the XGBoost model established using unprocessed spectral data has better performance. The R2P of the model established using dimensionality reduced data is larger, indicating that the model established using dimensionality reduced data has a better predictive performance. The model accuracy of spectral data modeling extracted by the PCA algorithm is generally higher than that of spectral data modeling processed by CARS, which may be due to the fact that the feature matrix extracted by PCA contains more features related to the moisture content of rice seedling trays.
Overall, the PSO-SVR model is more suitable for establishing a model for predicting the moisture content of rice seedling trays, followed by RF and finally XGBoost, which performs poorly. Among all the models, the PSO-SVR model established from the spectral data processed by SG and PCA performs best. Compared with the original data modeling, its R2P increases by 0.085 and RMSE-P decreases by 3.384.
4.2. Limitations and Future Work
The drying conditions set in this study represent the typical scenario encountered during the drying of seedling trays under conventional conditions. Therefore, the established model is only effective under conventional conditions. For special drying conditions, it is necessary to expand the range of seedling tray moisture content samples to enhance the adaptability of the model.
In our study, due to data availability and equipment limitations, we chose to use the visible/near-infrared (VNIR) band for water content detection. However, it is worth noting that besides the primary water absorption bands, there are other sensitive bands that can reflect water content differences. For instance, the red-edge spectrum in the 680–780 nm range, where the reflectance increases with decreasing water content. By utilizing these additional bands, it is possible to predict water content. In future research, we aim to explore the use of short-wave infrared (SWIR) for water content detection.
The high speed and convenient estimation of moisture content in rice seedling trays using hyperspectral analysis provides a useful tool for controlling the drying process. However, the reflectance of rice seedling trays is affected by various components, so the application of the model needs to be discussed for trays produced with different processes. With the increase in the number of tray samples, we will continue to optimize the model.
5. Conclusions
This article explores the detection effect of rice seedling tray moisture content using hyperspectral imaging technology. Multivariate scatter correction (MSC), variable standardization (SNV), and Savitzky–Golay convolution smoothing (SG) were used to preprocess the spectral data; principal component analysis (PCA) and competitive adaptive reweighting (CARS) were used to reduce the dimensions of the spectral data. Three regression models, namely random forest (RF), particle swarm optimization support vector machine (PSO-SVR) and XGBoost were constructed. The following conclusions are drawn: (1) The R2P of all models can reach above 0.88, indicating that hyperspectral imaging technology can be used for detecting the moisture content of rice seedling trays. (2) The models R2C and R2P established using raw spectral data have a significant difference, while the model established using preprocessed spectral data has a smaller difference between R2C and R2P. Within the experimental scope of this study, SG preprocessing is more suitable for the establishment of RF and PSO-SVR models, and unprocessed spectral data are more suitable for the establishment of XGBoost models. (3) Overall, the model established using dimensionality reduced spectral data has a larger coefficient of determination and better performance. Among them, the model established using PCA-extracted feature variables has the best effect, indicating that within the scope of this experiment, PCA is more suitable for feature extraction of rice seedling tray moisture content compared to CARS. (4) The optimal moisture content detection model determined in this study is SG-PCA-PSO-SVR (R2C = 0.984, RMSE-C = 2.775, R2P = 0.971, RMSE-P = 3.448), which has the best predictive effect.
To summarize, this study determines the optimal hyperspectral detection model of rice seedling tray moisture content by collecting samples of rice seedling tray moisture content in the drying process. This method provides a reliable theoretical basis and technical support for the nondestructive development of rice straw nutrient bowl tray moisture content detection, and is of great significance for the promotion and application of rice straw nutrient bowl tray seedling raising and whole process mechanized planting technology system, improving soil structure, increasing rice yield and protecting the ecological environment.
Author Contributions
Research conceptualization, H.Y.; methodology, H.Y., Y.H. and Z.Z.; investigation, L.Q., K.Z., J.J., H.L. and X.Z.; resources, H.Y. and L.Q.; writing, H.Y. and Y.H. All authors have read and agreed to the published version of the manuscript.
Funding
This study was funded by the Project of national science and technology supporting plan (2014BAD06B01), Project funded by China Postdoctoral Science Foundation (2016M601404), National Key R&D Program of China (2016YFD0800602), Supported by Heilongjiang Provincial Natural Science Foundation of China (C2015037), Special Research Fund for the Doctoral Program of Higher Education (20112305120003), and Scientific Research Initiation Plan for Talents of the Returned Chinese People (ZRCLG201902). The sponsors had no role in the design, execution, interpretation, or writing of the study.
Conflicts of Interest
The authors declare no conflict of interest.
Abbreviation
| MSC | multivariate scattering correction |
| SNV | standardization normal variables |
| SG | Savitzky–Golay convolution smoothing |
| PCA | principal component analysis |
| CARS | competitive adaptive reweighting |
| RF | random forest regression |
| PSO-SVR | particle swarm optimization support vector regression |
Appendix A
Table A1.
Parameter selection of RF.
Table A1.
Parameter selection of RF.
| Preprocessing Method | Number of Feature Bands | n Estimators | Max Depth | Min Samples Leaf | Min Samples Split | Max Features | Max Leaf Nodes |
|---|---|---|---|---|---|---|---|
| None | No | 116 | 16 | 1 | 2 | 48 | 14 |
| PCA | 50 | 9 | 1 | 2 | 10 | 49 | |
| CARS | 80 | 10 | 1 | 2 | 9 | 44 | |
| MSC | None | 185 | 6 | 1 | 4 | 38 | 42 |
| PCA | 118 | 10 | 1 | 2 | 7 | 39 | |
| CARS | 50 | 8 | 1 | 2 | 49 | 39 | |
| SNV | None | 145 | 6 | 1 | 4 | 38 | 42 |
| PCA | 43 | 15 | 1 | 2 | 6 | 48 | |
| CARS | 22 | 10 | 1 | 2 | 34 | 49 | |
| SG | None | 55 | 13 | 1 | 2 | 48 | 41 |
| PCA | 51 | 10 | 1 | 2 | 10 | 49 | |
| CARS | 87 | 7 | 1 | 2 | 48 | 34 |
Table A2.
Parameter selection of PSO-SVR.
Table A2.
Parameter selection of PSO-SVR.
| Preprocessing Method | Number of Feature Bands | C | γ | ε |
|---|---|---|---|---|
| NO | NO | 10 | 4.870 | 0.209 |
| PCA | 10 | 0.100 | 0.209 | |
| CARS | 10 | 0.382 | 0.540 | |
| MSC | NO | 10 | 0.820 | 0.123 |
| PCA | 10 | 0.408 | 0.143 | |
| CARS | 10 | 2.924 | 1 | |
| SNV | NO | 10 | 1.054 | 0.177 |
| PCA | 10 | 1.044 | 0.184 | |
| CARS | 10 | 2.129 | 1 | |
| SG | NO | 10 | 0.562 | 0.209 |
| PCA | 10 | 0.2 | 0.209 | |
| CARS | 10 | 0.416 | 0.619 |
Table A3.
Parameter selection of XGBoost.
Table A3.
Parameter selection of XGBoost.
| Preprocessing Method | Number of Feature Bands | Learning_Rate | Subsample | Max_Depth | n_Estimators |
|---|---|---|---|---|---|
| None | None | 0.1 | 0.3 | 7 | 50 |
| PCA | 0.1 | 0.5 | 9 | 50 | |
| CARS | 0.1 | 0.5 | 11 | 50 | |
| MSC | None | 1 | 0.4 | 7 | 45 |
| PCA | 0.1 | 0.4 | 19 | 50 | |
| CARS | 1 | 0.5 | 5 | 50 | |
| SNV | None | 0.1 | 0.3 | 7 | 50 |
| PCA | 0.1 | 0.3 | 7 | 50 | |
| CARS | 0.1 | 0.4 | 9 | 50 | |
| SG | None | 0.1 | 0.3 | 7 | 50 |
| PCA | 0.1 | 0.2 | 5 | 50 | |
| CARS | 0.1 | 0.5 | 13 | 50 |
Appendix B


Figure A1.
PSO selection process for SVR parameters.
References
- Qian, Y.T.; Zhang, Y.P.; Du, J.; Kong, X.P.; Chang, Z.P.; Ye, X.M. Advantages and disadvantages analysis of comprehensive utilization of straw in Jiangsu Province and countermeasure suggestions for collection-storage-transportation system. Trans. Chin. Soc. Agric. Eng. 2019, 35, 154–160. [Google Scholar]
- Wang, J.W.; Tang, H.; Wang, J.F. Comprehensive Utilization Status and Development Analysis of Crop Straw Resource in Northeast China. Trans. Chin. Soc. Agric. Mach. 2017, 48, 1–21. [Google Scholar]
- Goodman, B.A. Utilization of Waste Straw and Husks from Rice Production: A Review. J. Bioresour. Bioprod. 2020, 5, 143–162. [Google Scholar] [CrossRef]
- Yu, H.M.; Li, H.Y.; Zhang, X.Y.; Wang, H.Y.; Sun, Y. Drying Kinetic Model of Microwave Coupled with Hot Air Drying of Straw-based Nutrient Seedling-growing Bowl Tray. Trans. Chin. Soc. Agric. Mach. 2020, 51, 339–348. [Google Scholar]
- Zhang, Y.; Zhu, Q.J.; Gao, S.; Liu, S.; Li, L.H.; Chen, H.T. Optimization of Technological Parameters of Straw Fiber-Based Plant Fiber Seedling Pot Raw Materials. Appl. Sci. 2021, 11, 7152. [Google Scholar] [CrossRef]
- Yu, H.M.; Li, H.Y.; Wang, C.; Li, H.L.; Zhang, X.Y.; Liang, Q.; Yu, B.B. Simulation Analysis of Flow Field Uniformity in Air Distribution Room of Rice Seedbed Microwave Hot Air Coupling Dryer. J. Agric. Mech. Res. 2020, 42, 15–21. [Google Scholar]
- Yu, H.M.; Wang, C.; Han, Z.X.; Sun, Y.; Zhang, W.; Hu, J.; Liu, T.X. Optimization of steam drying conditions for seedling-growing tray made of paddy-straw. Trans. Chin. Soc. Agric. Eng. 2013, 29, 40–49. [Google Scholar]
- Sun, H.; Liu, N.; Wu, L.; Zheng, T.; Li, M.Z.; Wu, J.Z. Visualization of Water Content Distribution in Potato Leaves Based on Hyperspectral Image. Spectrosc. Spectr. Anal. 2019, 39, 910–916. [Google Scholar]
- Wei, Y.Z.; Wu, F.Y.; Xu, J.; Sha, J.; Zhao, Z.; He, Y.; Li, X. Visual Detection of the Moisture Content of Tea Leaves with Hyperspectral Imaging Technology. J. Food Eng. 2019, 248, 89–96. [Google Scholar] [CrossRef]
- Zhang, J.; Tian, H.Q.; Zhao, Z.Y.; Zhang, L.N.; Zhang, J.; Li, F. Moisture content dectection in silage maize raw material based on hyperspectrum and improved discrete particle swarm. Trans. Chin. Soc. Agric. Eng. 2019, 35, 285–293. [Google Scholar]
- Dong, C.; An, T.; Yang, M.; Yang, C.; Liu, Z.; Li, Y.; Duan, D.; Fan, S. Quantitative Prediction and Visual Detection of the Moisture Content of Withering Leaves in Black Tea (Camellia Sinensis) with Hyperspectral Image. Infrared Phys. Technol. 2022, 123, 104118. [Google Scholar] [CrossRef]
- Li, H.; Zhang, K.; Chen, C.; Zhang, Z.Z.; Liu, Z.P. Detection of Moisture Content in Lettuce Canopy Based on Hyperspectral lmaging Technique. Trans. Chin. Soc. Agric. Mach. 2021, 52, 211–217. [Google Scholar]
- Zhang, Z.T.; Wang, H.F.; Arnon, K.; Chen, J.Y.; Han, W.T. Inversion of Soil Moisture Content from Hyperspectra Based on Ridge Regression. Trans. Chin. Soc. Agric. Eng. 2018, 49, 240–248. [Google Scholar]
- Liu, D.; Qu, J.; Sun, D.W.; Pu, H.; Zeng, X.A. Non-Destructive Prediction of Salt Contents and Water Activity of Porcine Meat Slices by Hyperspectral Imaging in a Salting Process. Innov. Food Sci. Emerg. Technol. 2013, 20, 316–323. [Google Scholar] [CrossRef]
- Wu, T.; Yu, J.; Lu, J.; Zou, X.; Zhang, W. Research on Inversion Model of Cultivated Soil Moisture Content Based on Hyperspectral Imaging Analysis. Agriculture 2020, 10, 292. [Google Scholar] [CrossRef]
- Wu, D.; Shi, H.; Wang, S.; He, Y.; Bao, Y.; Liu, K. Rapid Prediction of Moisture Content of Dehydrated Prawns Using Online Hyperspectral Imaging System. Anal. Chim. Acta 2012, 726, 57–66. [Google Scholar] [CrossRef] [PubMed]
- Huang, M.; Wang, Q.; Zhang, M.; Zhu, Q. Prediction of Color and Moisture Content for Vegetable Soybean during Drying Using Hyperspectral Imaging Technology. J. Food Eng. 2014, 128, 24–30. [Google Scholar] [CrossRef]
- Raponi, F.; Moscetti, R.; Monarca, D.; Colantoni, A.; Massantini, R. Monitoring and Optimization of the Process of Drying Fruits and Vegetables Using Computer Vision: A Review. Sustainability 2017, 9, 2009. [Google Scholar] [CrossRef]
- Qian, W.; Yang, S.K.; Liu, G.L.; He, G.; Wang, Z.H.; Du, J.Q. Optimization of Drying Process Parameters of Solar Herbage Dry Equipment. Trans. Chin. Soc. Agric. Mach. 2018, 49, 110–118. [Google Scholar]
- Tian, X.Y.; Huang, X.Y.; Bai, J.W.; Lv, R.Q.; Sun, Z.Y. Detection of Anthocyanin Content of Purple Sweet Potato during Storage Period Based on Near Infrared Spectroscopy. Trans. Chin. Soc. Agric. Mach. 2019, 50, 350–355. [Google Scholar]
- Bai, T.C.; Yu, C.L.; Wang, X.P.; Wang, Y.M.; Zhang, N.N.; Yao, N. Near Infrared Spectrum Detection Method for Moisture Content of Populus Euphratica Leaf. Spectrosc. Spectr. Anal. 2017, 37, 3419–3423. [Google Scholar]
- Fearn, T.; Riccioli, C.; Garrido-Varo, A.; Guerrero-Ginel, J.E. On the Geometry of SNV and MSC. Chemom. Intell. Lab. Syst. 2009, 96, 22–26. [Google Scholar] [CrossRef]
- Hui, G.Y.; Sun, L.J.; Wang, J.N.; Wang, L.K.; Dai, C.J. Research on the Pre-Processing Methods of Wheat Hardness Prediction Model Based on Visible-Near Infrared Spectroscopy. Spectrosc. Spectr. Anal. 2016, 36, 2111–2116. [Google Scholar]
- Chen, J.Y.; Xing, Z.; Zhang, Z.T.; Lao, C.C.; Li, X.W.; Wang, H.F. Comprehensive Evaluation of Waste Water Quality Based on Quantitative Inversion Model Hyperspectral Technology. Trans. Chin. Soc. Agric. Mach. 2019, 50, 200–209. [Google Scholar]
- Li, Y.; Tan, X.; Zhang, W.; Jiao, Q.; Xu, Y.; Li, H.; Zou, Y.; Yang, L.; Fang, Y. Research and Application of Several Key Techniques in Hyperspectral Image Preprocessing. Front. Plant Sci. 2021, 12, 627865. [Google Scholar] [CrossRef] [PubMed]
- Uddin, M.P.; Mamun, M.A.; Hossain, M.A. PCA-Based Feature Reduction for Hyperspectral Remote Sensing Image Classification. IETE Tech. Rev. 2021, 38, 377–396. [Google Scholar] [CrossRef]
- Yan, S.A.; Shi, M.Z.; Lin, X.X.; Li, W.; Yao, Q.H. Principal Component Analysis and Cluster Analysis for Evaluating Amino Acid of Different Table Grapes (Vitis vinifera L.) Varieties. Sci. Technol. Food Ind. 2022, 43, 372–379. [Google Scholar]
- Napoli, C.D.; Pope, I.; Masia, F.; Watson, P.; Langbein, W.; Borri, P. Hyperspectral and Differential CARS Microscopy for Quantitative Chemical Imaging in Human Adipocytes. Biomed. Opt. Express 2014, 5, 1378–1390. [Google Scholar] [CrossRef]
- Liang, L.; Wei, L.; Fang, G.; Xu, F.; Deng, Y.; Shen, K.; Tian, Q.; Wu, T.; Zhu, B. Prediction of Holocellulose and Lignin Content of Pulp Wood Feedstock Using near Infrared Spectroscopy and Variable Selection. Spectrochim. Acta Part A Mol. Biomol. Spectrosc. 2020, 225, 117515. [Google Scholar] [CrossRef]
- Wang, T.J.; Fang, K.; Yang, Y.; Zhang, X.D. Multi-spectral remote sensing inversion of soil heavy metal content using random forest regression model. Bull. Surv. Mapp. 2021, 92–95. [Google Scholar] [CrossRef]
- Shourian, M.; Mousavi, S.J. Performance Assessment of a Coupled Particle Swarm Optimization and Network Flow Programming Model for Optimum Water Allocation. Water Resour Manag. 2017, 31, 4835–4853. [Google Scholar] [CrossRef]
- Bayrami, B. Estimation of splitting tensile strength of modified recycled aggregate concrete using hybrid algorithms. Available SSRN 3992623 2022, 44, 375–392. [Google Scholar] [CrossRef]
- Shi, X.; Yu, X.; Esmaeili-Falak, M. Improved Arithmetic Optimization Algorithm and Its Application to Carbon Fiber Reinforced Polymer-Steel Bond Strength Estimation. Compos. Struct. 2023, 306, 116599. [Google Scholar] [CrossRef]
- Chen, P.; Qi, C.; Liu, R.W.; Wang, Z.Z.; Luo, H.; Yuan, J.J.; Liu, J.P. Quantitative Analysis of Carbon Content in Fly Ash Using LIBS Based on Support Vector Machine Regression. Acta Opt. Sin. 2022, 42, 278–285. [Google Scholar]
- Qian, L.S.; Jiang, H.; Chang, S.S.; Li, D.; Wang, C.Y.; Chen, J.Y.; Dai, X.M. Extracting field-scale crop distribution in Lingnan using spatiotemporal filtering of Sentinel-1 time-series data. Trans. Chin. Soc. Agric. Eng. 2022, 38, 158–166. [Google Scholar]
- Esmaeili-Falak, M.; Benemaran, R.S. Ensemble Deep Learning-Based Models to Predict the Resilient Modulus of Modified Base Materials Subjected to Wet-Dry Cycles. Geomech. Eng. 2023, 32, 583–600. [Google Scholar]
Disclaimer/Publisher’s Note: The statements, opinions and data contained in all publications are solely those of the individual author(s) and contributor(s) and not of MDPI and/or the editor(s). MDPI and/or the editor(s) disclaim responsibility for any injury to people or property resulting from any ideas, methods, instructions or products referred to in the content. |
© 2023 by the authors. Licensee MDPI, Basel, Switzerland. This article is an open access article distributed under the terms and conditions of the Creative Commons Attribution (CC BY) license (https://creativecommons.org/licenses/by/4.0/).