1. Introduction
In recent years, concern about environmental issues has been clearly evident around the world. The combination of profitability and commitment in the management of environmental impacts contributes toward sustainable development, and this attitude is of interest to society as a whole.
Eco-innovation is any innovation for an organization that results in the reduction in environmental risks and other negative impacts, in a more efficient and responsible way. It is the use of natural resources, the assimilation or exploitation of a service, or the method of management carried out in a sustainable manner.
However, despite differences in wording, all definitions embrace the environmental component and reflect the two main consequences of eco-innovation: fewer adverse effects on the environment and more efficient use of resources [
1].
Defining eco-innovation is not an easy task although several attempts have been made in the literature. In general, these definitions emphasize that eco-innovations reduce the environmental impact caused by consumption and production activities, regardless of whether the main motivation for their development or deployment is environmental [
2].
Environmental practices and eco-innovations refer to strategies, technologies, and approaches that aim to minimize the negative impact of human activities on the natural environment and promote sustainable development. However, in this study, the adoptions of any environmental practices are considered eco-innovations.
Although innovation processes aimed at sustainable development (eco-innovations) have received increasing attention in recent years, theoretical and methodological approaches to analyzing these processes are poorly developed [
3].
There is no evidence that eco-innovation impacts a company’s performance, specifically in the field of hospitality services.
Companies today face a wide variety of environmental challenges, among which climate change, pollution control, and declining natural resources are the most concerning. While there is increasing pressure to provide sustainable products and services, little is known about what drives the many types of eco-innovation, or how these activities impact companies’ performance [
4].
By means of a survey and a literature review on eco-innovative practices at hotels and inns, this research project was structured to be descriptive and quantitative, and sought to combine the results of eco-innovation and the company’s performance.
The relationship between innovation and sustainable development has received increasing attention [
5].
Overall, the service–profit chain [
6] is a framework that links services and operations, employee ratings, and customer ratings, aimed at profitability and growth [
7].
In the total number of descriptive results, more than 52% of environmental companies developed or improved new products or services [
8].
The exponential growth of the tourism sector in recent years has revealed the need to be more conscious of the impact of this sector, especially that of hotels, on the environment [
9].
This research addresses environmental issues in the hotel sector in Brazil. The hotel sector is highly competitive, and companies that operate in this market need to offer a quality service to attract and keep customers. The hotel sector is constantly evolving and adapting to market changes and new technologies, and is adopting eco-innovation to promote sustainability and reduce its environmental impact. In addition to being good for the environment, eco-innovation can be seen as a differentiator by guests who value sustainability and socio-environmental responsibility.
Sustainability has become increasingly important, and research needs to analyze the role of emerging eco-innovations and consumer-driven innovations in tourism and hospitality [
10].
The purpose of the paper is to test, with adaptations, the Article A1 impact factor JCR 5589, published in Emerald Insight’s
Management Decision journal in 2016, by the authors in [
11].
2. Literature Review
2.1. Environmental Pressures
In recent years, the toughening of environmental regulations all around the world has motivated companies to seek the implementation of practices for environmental management [
12].
Eco-innovation has emerged in the strategic scenarios of companies due to increased environmental pressures and regulations.
Increasingly strict environmental regulations and consumer awareness regarding environmental protection and sustainability are driving forces in the hospitality industry [
13].
Previous studies have shown that external pressure is the main factor in the adoption of environmental practices [
14].
Other researchers have found that government regulations are the main external factors that lead companies to adopt environmental practices [
15,
16].
As for eco-innovation, the influence of green pressure from stakeholders is mediated by companies’ environmental commitment [
17].
Regulatory pressure generally refers to the binding force of various laws, rules, and regulations, as well as policies enacted by governments [
18]. Companies must comply with laws and regulations on environmental preservation, or else they will be subject to fines and other restrictive measures.
To adopt eco-innovation, companies are subject to formal regulatory pressure from the government and also informal regulatory pressure from other stakeholders [
19].
Regulatory pressure comes mainly from standards and values established in society.
The determinants of eco-innovation vary depending on the type of eco-innovation, such as product, process, or organizational. The results indicate that competitive pressure is a common driver of all three types of eco-innovation. Although the three types are all stimulated by different factors, competitive pressure acts as a common driver of all three types, and eco-innovation deployment is becoming a relevant strategy for companies to establish a green image and pursue sustainability in this competitive environment [
1].
In the hospitality industry context, a hospitality company also faces intense pressure from different interest groups regarding environmental issues [
20].
Hypothesis 1 (H1). External pressures are positively related to the adoption of environmental practices [
21].
2.2. Adoption of Environmental Practices
The adoption of eco-innovation not only improves a company’s image but also provides satisfaction for the company’s customers and employees. Thus, a small service company can adopt an environmentally responsible stance that helps to create a positive public image and transform it into an example for other companies in the sector [
22,
23,
24].
The adoption of eco-innovation is increasingly becoming a relevant strategy for companies to establish a green image and pursue sustainability in this intensely competitive environment [
25].
Adopting eco-innovation improves a company’s environmental performance, and accordingly, has a positive indirect impact on its economic performance [
26].
Cost savings are an important driver for reducing energy and material costs, pointing to the role of energy and raw material prices, as well as taxation, as drivers of eco-innovation [
27].
For SMEs (small and medium-sized enterprises), studies have shown that the adoption of environmental practices is a concern of customers, the government, local society, and employees, among others [
23,
24,
28].
Customer needs are another important source of eco-innovations, especially products with better environmental performance and process innovations that increase efficiency and reduce energy consumption, waste, and the use of hazardous substances [
27].
Eco-innovation is driven by a combination of internal and external drivers; the ability to adopt eco-innovative responses, combining internal and external capabilities, partially mediates the relationship between drivers and eco-innovation performance. Furthermore, companies with greater efficiency tend to carry out more eco-innovative activities [
29].
Examples of eco-innovations in hospitality and tourism (e.g., LED lamps, solar panels, paperless check-in) have been empirically tested to contribute to improved financial and operational performance [
30,
31].
Hypothesis 2 (H2). The adoption of environmental practices is positively related to operational improvements [
23,
32].
2.3. The Adoption of Environmental Practices Is Directly/Indirectly Positively Related to Competitiveness
The overall performance of eco-innovation and issues related to competitiveness are actively correlated with ethical practices, the social responsibility of business leaders, environmental issues, and corporate values [
33].
Interest in eco-innovation within the corporate environment has grown considerably in recent years, allowing for the examination of general strategies for eco-innovation in this scenario, and the fact that a company can obtain a competitive advantage by adopting, implementing, assessing, and investing in eco-innovation [
34].
Sustainable product innovation is positively correlated with competitive advantages and sustainable dynamic capability, with the latter having a significant impact on the former. Furthermore, resource integration capability, resource reconfiguration, and environmental perception of green dynamic capability act as intermediary factors between green product innovation and competitive advantages [
35].
The adoption of environmental practices in the hotel sector contributes to improving the competitiveness and public image of the business, both internally and externally [
31].
Hypothesis 3 (H3). The adoption of environmental practices is directly and positively related to competitiveness [
36].
Hypothesis 4 (H4). The adoption of environmental practices is indirectly positively related to competitiveness—mediated by an operational improvement [
36].
2.4. Adoption of Environmental Practices Is Positively Related to Performance Mediated by Competitiveness
The last few decades have witnessed an increase in the number of eco-innovative solutions that improve companies’ environmental performance, while helping them to remain competitive [
37].
The relationship between eco-innovation and performance depends on environmental orientation and the commitment of resources. The results demonstrate that, although environmental orientation does not directly impact business performance, it enhances the beneficial effect of eco-innovation on business performance. Companies that are dedicated to the environment have more advantages in eco-innovation performance when they commit more organizational resources [
38].
In recent years, eco-design and eco-innovation have become highly relevant, as they aim to reduce the environmental impact of both products and production processes, using new technologies and ways of working that contribute to sustainable development and, at the same time, help to increase the competitiveness of companies [
39].
Empirical results show that the strategic orientation of eco-innovation has a positive influence on the competitive advantage of hospitality companies [
40].
Hypothesis 5 (H5). The adoption of environmental practices is positively related to performance mediated by competitiveness [
11].
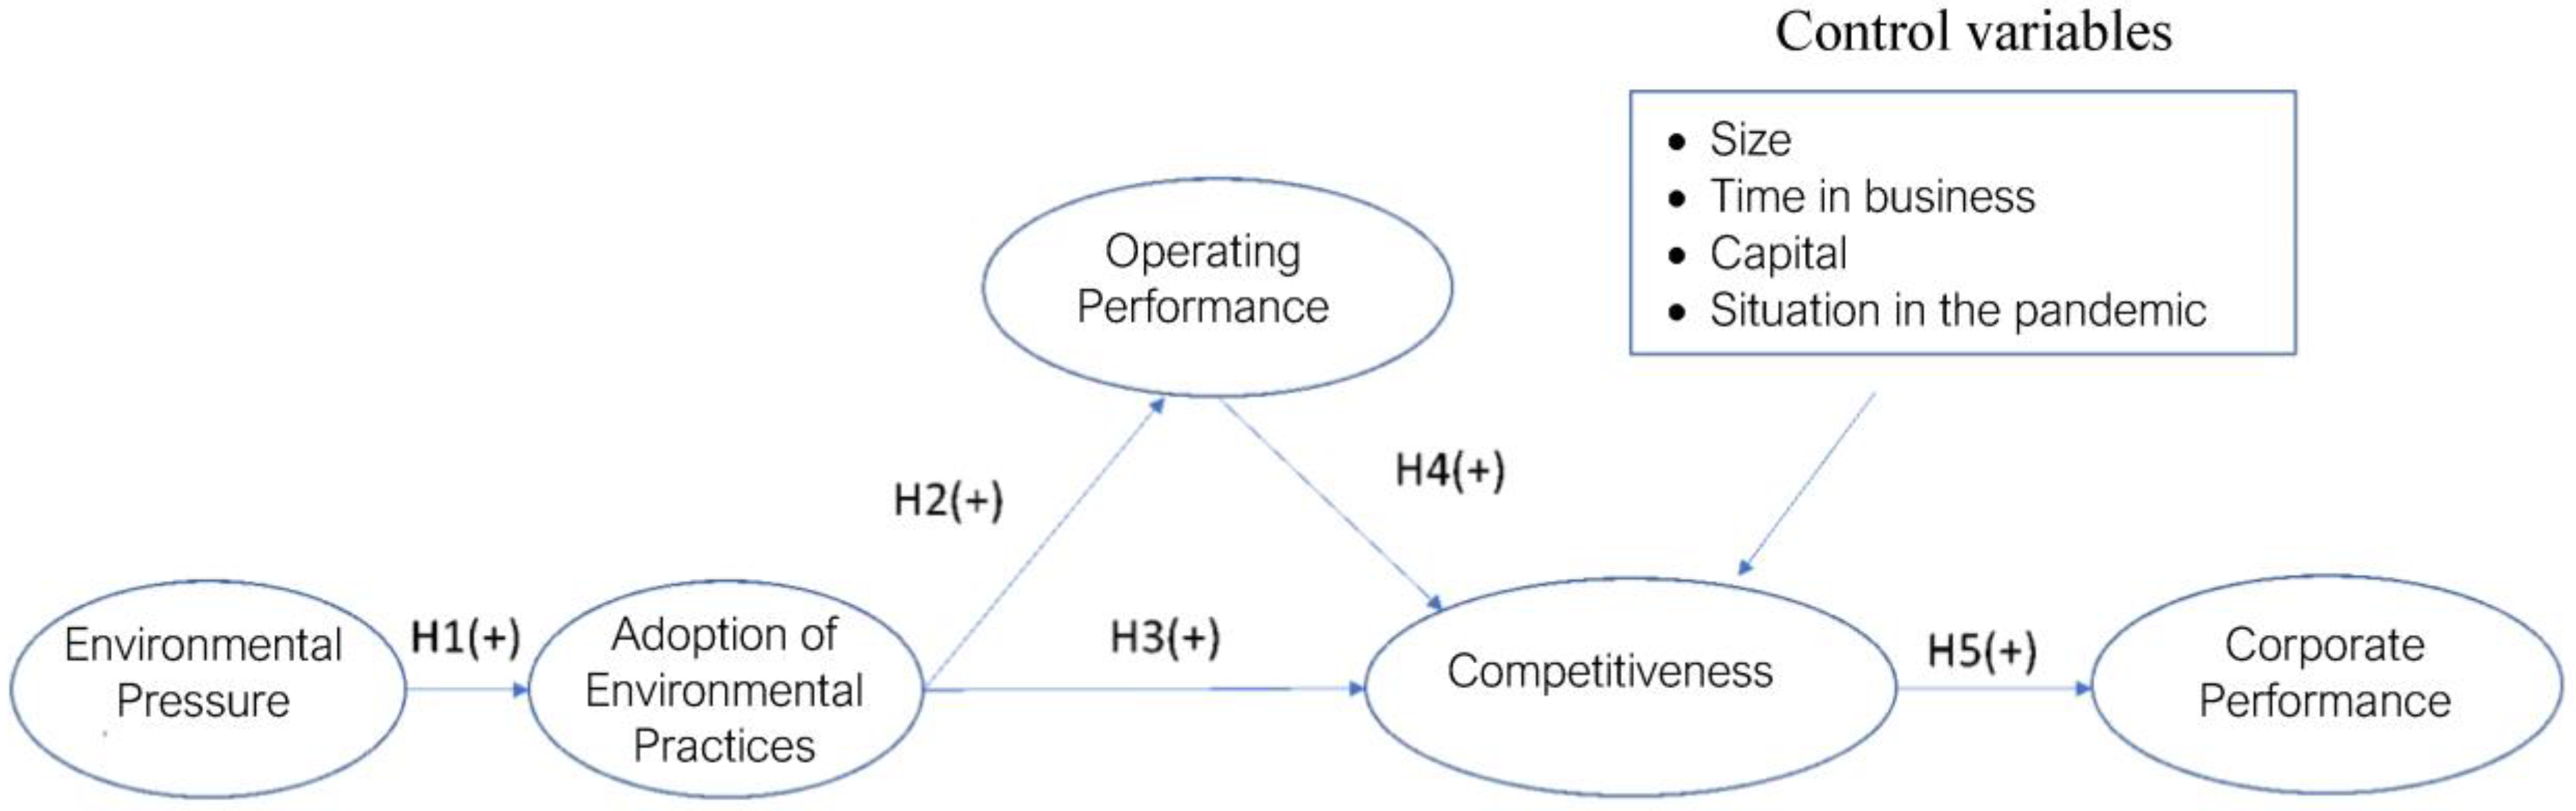
3. Control Variables
In this study, the effects of the following control variables on the company’s competitiveness were evaluated: enterprise category, establishment size, time in business, capital stock, and situation experienced during the pandemic.
Hotels and inns were chosen for the reason that a large part of the growth of the hotel sector is evidenced by concern for the environment, reflected in the increased demand for this recreation service and contact with nature.
According to the Caldas Aulete Dictionary, an “inn” (pousada in Portuguese) is a kind of small hotel or guesthouse in sparsely populated, generally touristic locations. Usually, inns are horizontal constructions, which bestows a more intimate and welcoming atmosphere to the environment, providing greater privacy to guests.
The size of the establishment is defined by the number of employees. Establishments with up to 100 employees are considered small, while those with more than 500 employees are considered large.
Time in business can be an important factor for the enterprise’s operating performance and competitiveness and, consequently, for its overall performance.
Three segments were defined: less than 5 years, 5 to 10 years, and more than 10 years in business.
Likewise, the company’s ownership control can influence competitiveness. Accordingly, the study also proposes verifying the influence between establishments with publicly traded and privately held capital.
As the questionnaires (
Appendix A) were sent in early 2022, the perception of the effect of the pandemic on the company’s performance was also included in the questionnaire.
Ultimately, establishments that reacted more quickly to the new reality may have had positive effects, in that tourism (as is widely known) was one of the segments most negatively affected by the pandemic [
41].
Figure 1 presents the structural model of this study.
4. Methodology
4.1. Tools Used
The research was structured to be descriptive and quantitative, through a survey.
Sampling was non-probabilistic and by convenience. The answers to the questionnaire were based on interval scales with seven items in the Likert-type pattern (1 = maximum agreement and 7 = maximum disagreement) for the constructs of environmental pressure, environmental practice adoption, operational performance, and competitiveness. For the company’s performance, the interval scales were for 5 items in the Likert-type pattern (1 = considerable reduction and 5 = considerable increase).
The 5 scales of the study were the same as those used by [
11] in a study on travel agencies in Spain.
The questionnaire was back-translated—a method used to maintain equivalence between the original and translated versions—using independent translators. One of the translators translated the original into Portuguese and a second one back-translated it into English. This was compared with the original to certify the equivalence of concepts [
42]. The questionnaire included indicators of the level of services (lodging, food, and recreation) in the company performance construct and demographic data on the category of the establishment, number of employees, control of capital, time in business, and perception of how the pandemic affected the company’s business.
Table 1 shows the indicators of each study construct.
4.2. Data Collection
As indicated by [
50], GPower software version 3.1.9.4 was used to determine the minimum sample size of 138 participants. Emails were sent to 474 potential respondents (3.5 times the minimum size) throughout Brazil, with a link to Google Forms. Data collection was processed from 3 January to 23 June 2022, resulting in 233 completed questionnaires.
Scheme 1 shows the evolution of responses over time.
4.3. Data Analysis
All questionnaires were evaluated, and there were no records with missing data and/or monotonic responses. Thus, all 233 questionnaires were considered valid.
It is important to highlight that the answers to the questionnaires did not involve financial data and therefore only corresponded to the perceptions of the respondents.
After evaluation, the data were analyzed in five steps: (i) descriptive statistics; (ii) analysis of correlations; (iii) analysis of significant differences by group using ANOVA; (iv) evaluation of the measurement model; and (v) hypothesis testing through partial least squares structural equation modeling (PLS-SEM). Steps i and ii were performed using jamovi software version 2.3.18 [
51], step iii was performed with Stata software version 14.2 [
52], and steps iv and v were performed with SmartPLS software version 4.0.9.1.
5. Results
5.1. Descriptive Statistics
Table 2 presents the profile of the enterprises. Most are hotels (62%), privately held (95%), have less than 100 employees (56%), have been in business for more than 10 years (70%), and stated that the pandemic has been detrimental to their business (81%).
5.2. Correlations
The indicators were analyzed as reflective according to the theoretical framework [
53]. Each construct was analyzed by calculating the average value and analyzing the correlations between the indicators.
Table 3 shows the mean, median, and standard deviation of each construct.
5.2.1. Environmental Pressure
The environmental pressure construct consists of four items and the average value can be calculated by
Figure 2 shows the histogram and density distribution of responses.
A mean score of 2.88 and a median of 2.75 was found, indicating that respondents partially agreed that there is environmental pressure for companies.
Table 4 shows the correlations between the indicators of the construct.
The EP4 indicator, referring to the government’s role in promoting environmental protection activities, has a lower level of agreement among respondents, showing that there is a need for more actions from public authorities in relation to environmental protection.
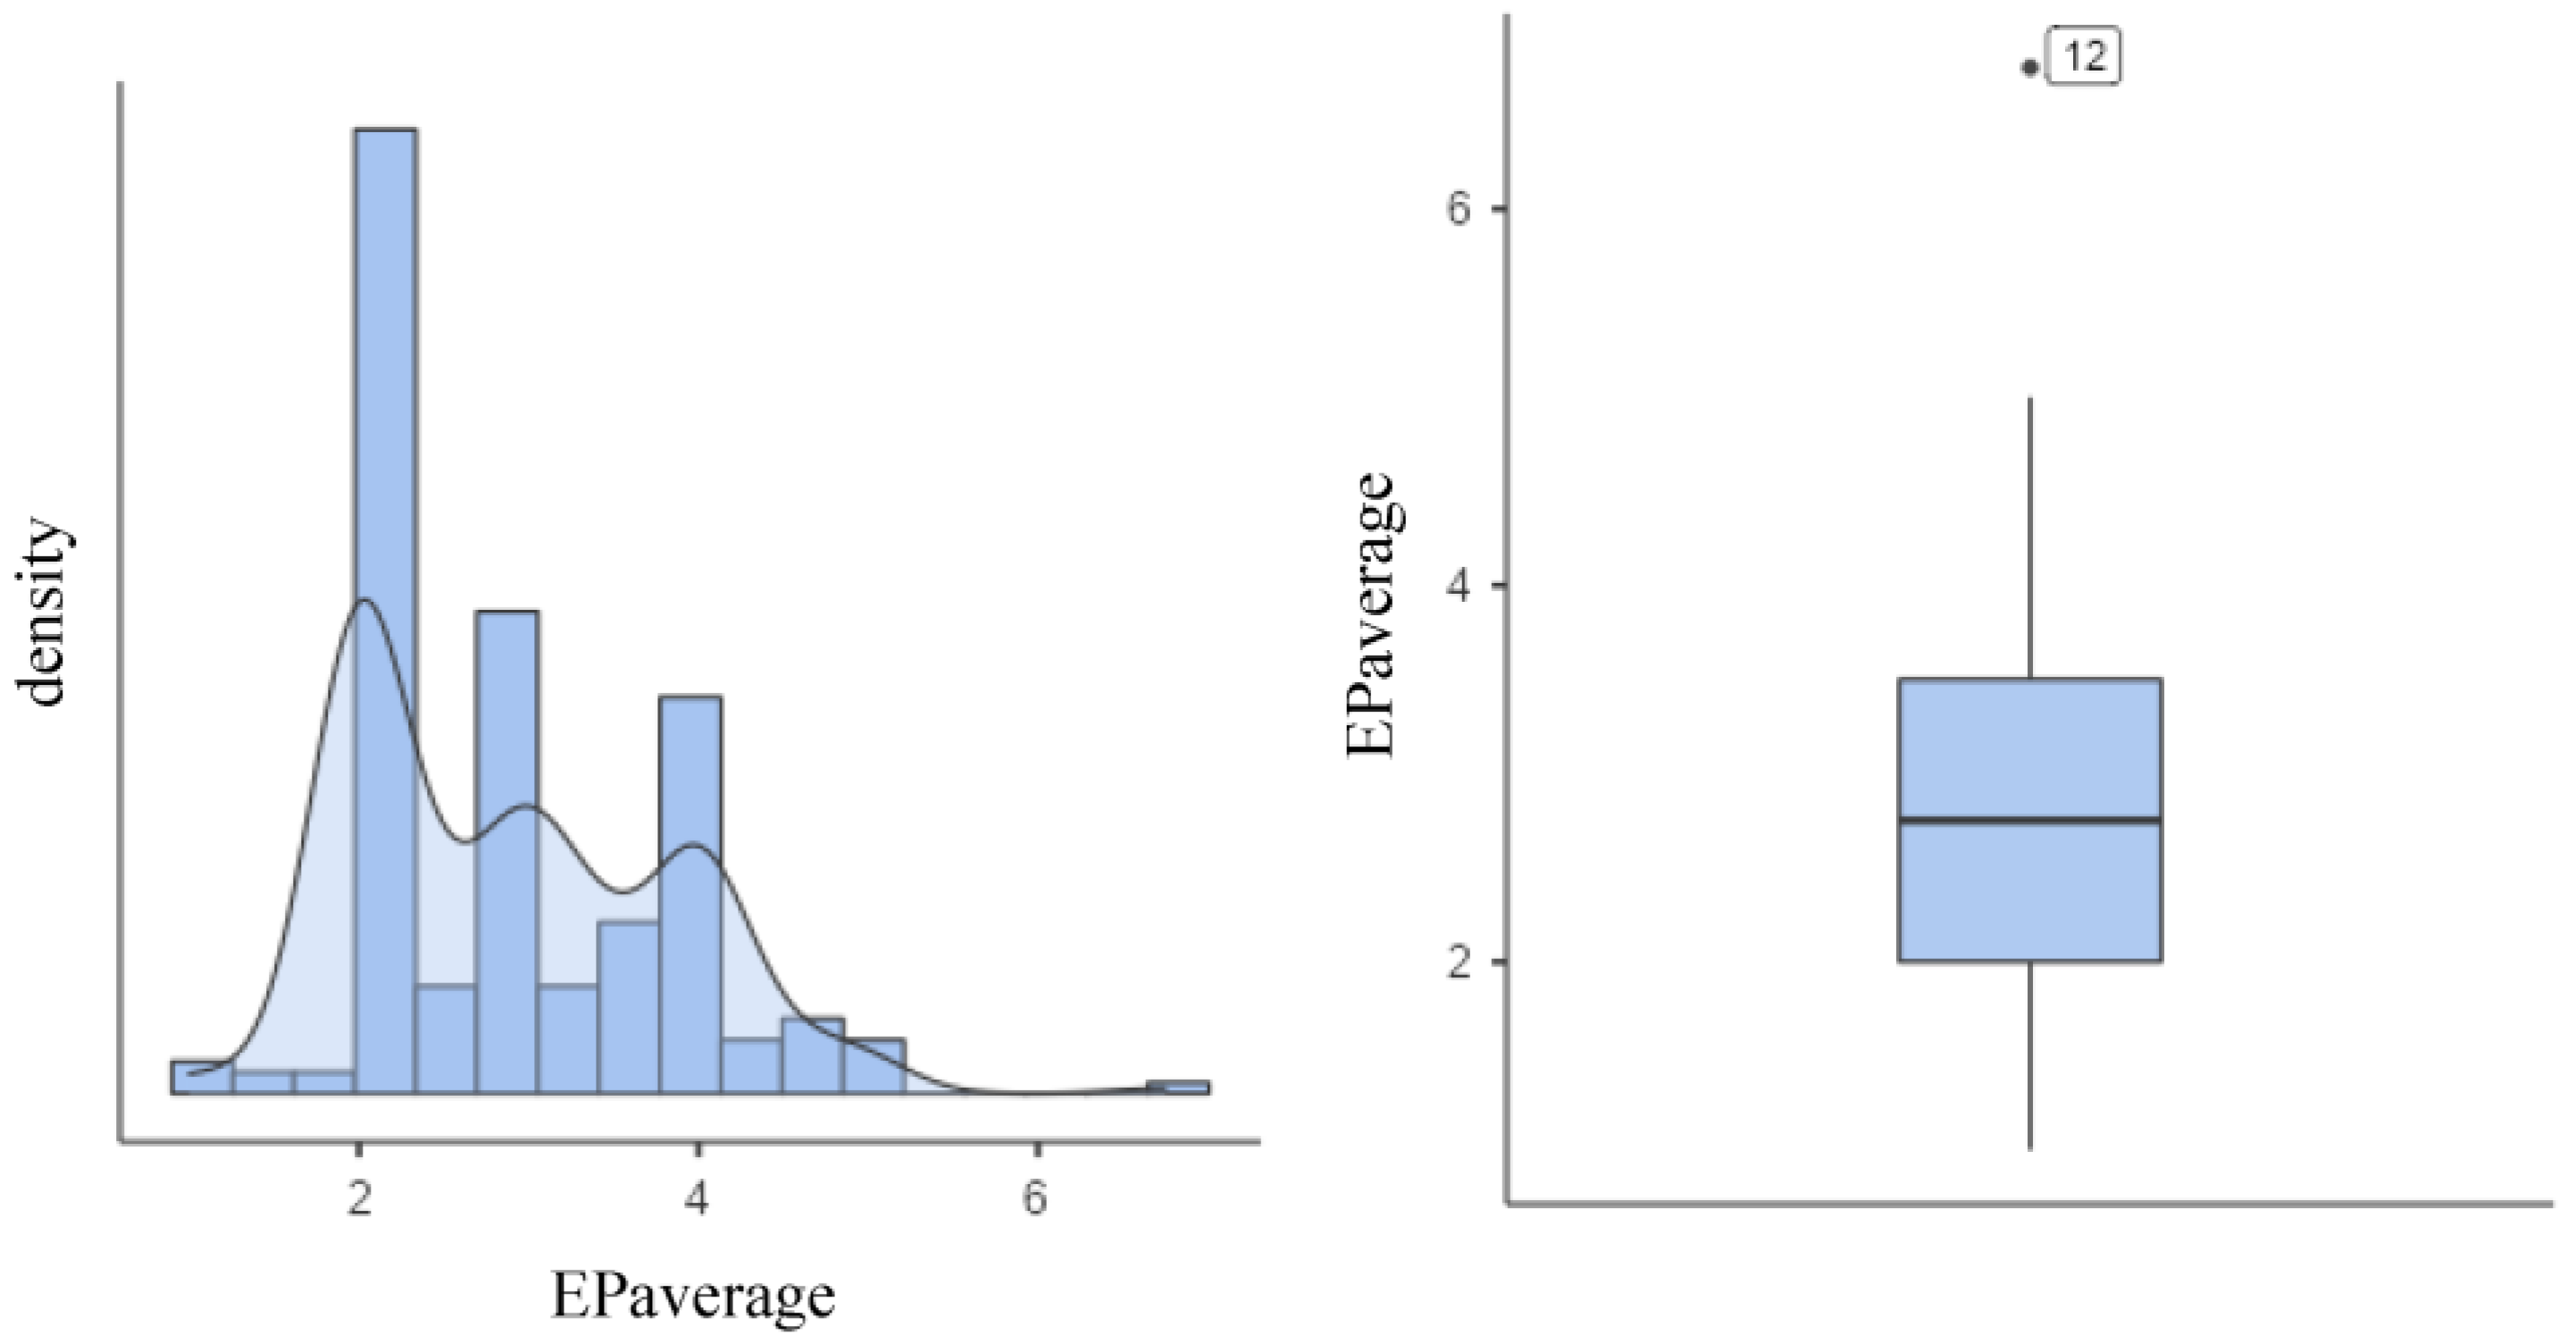
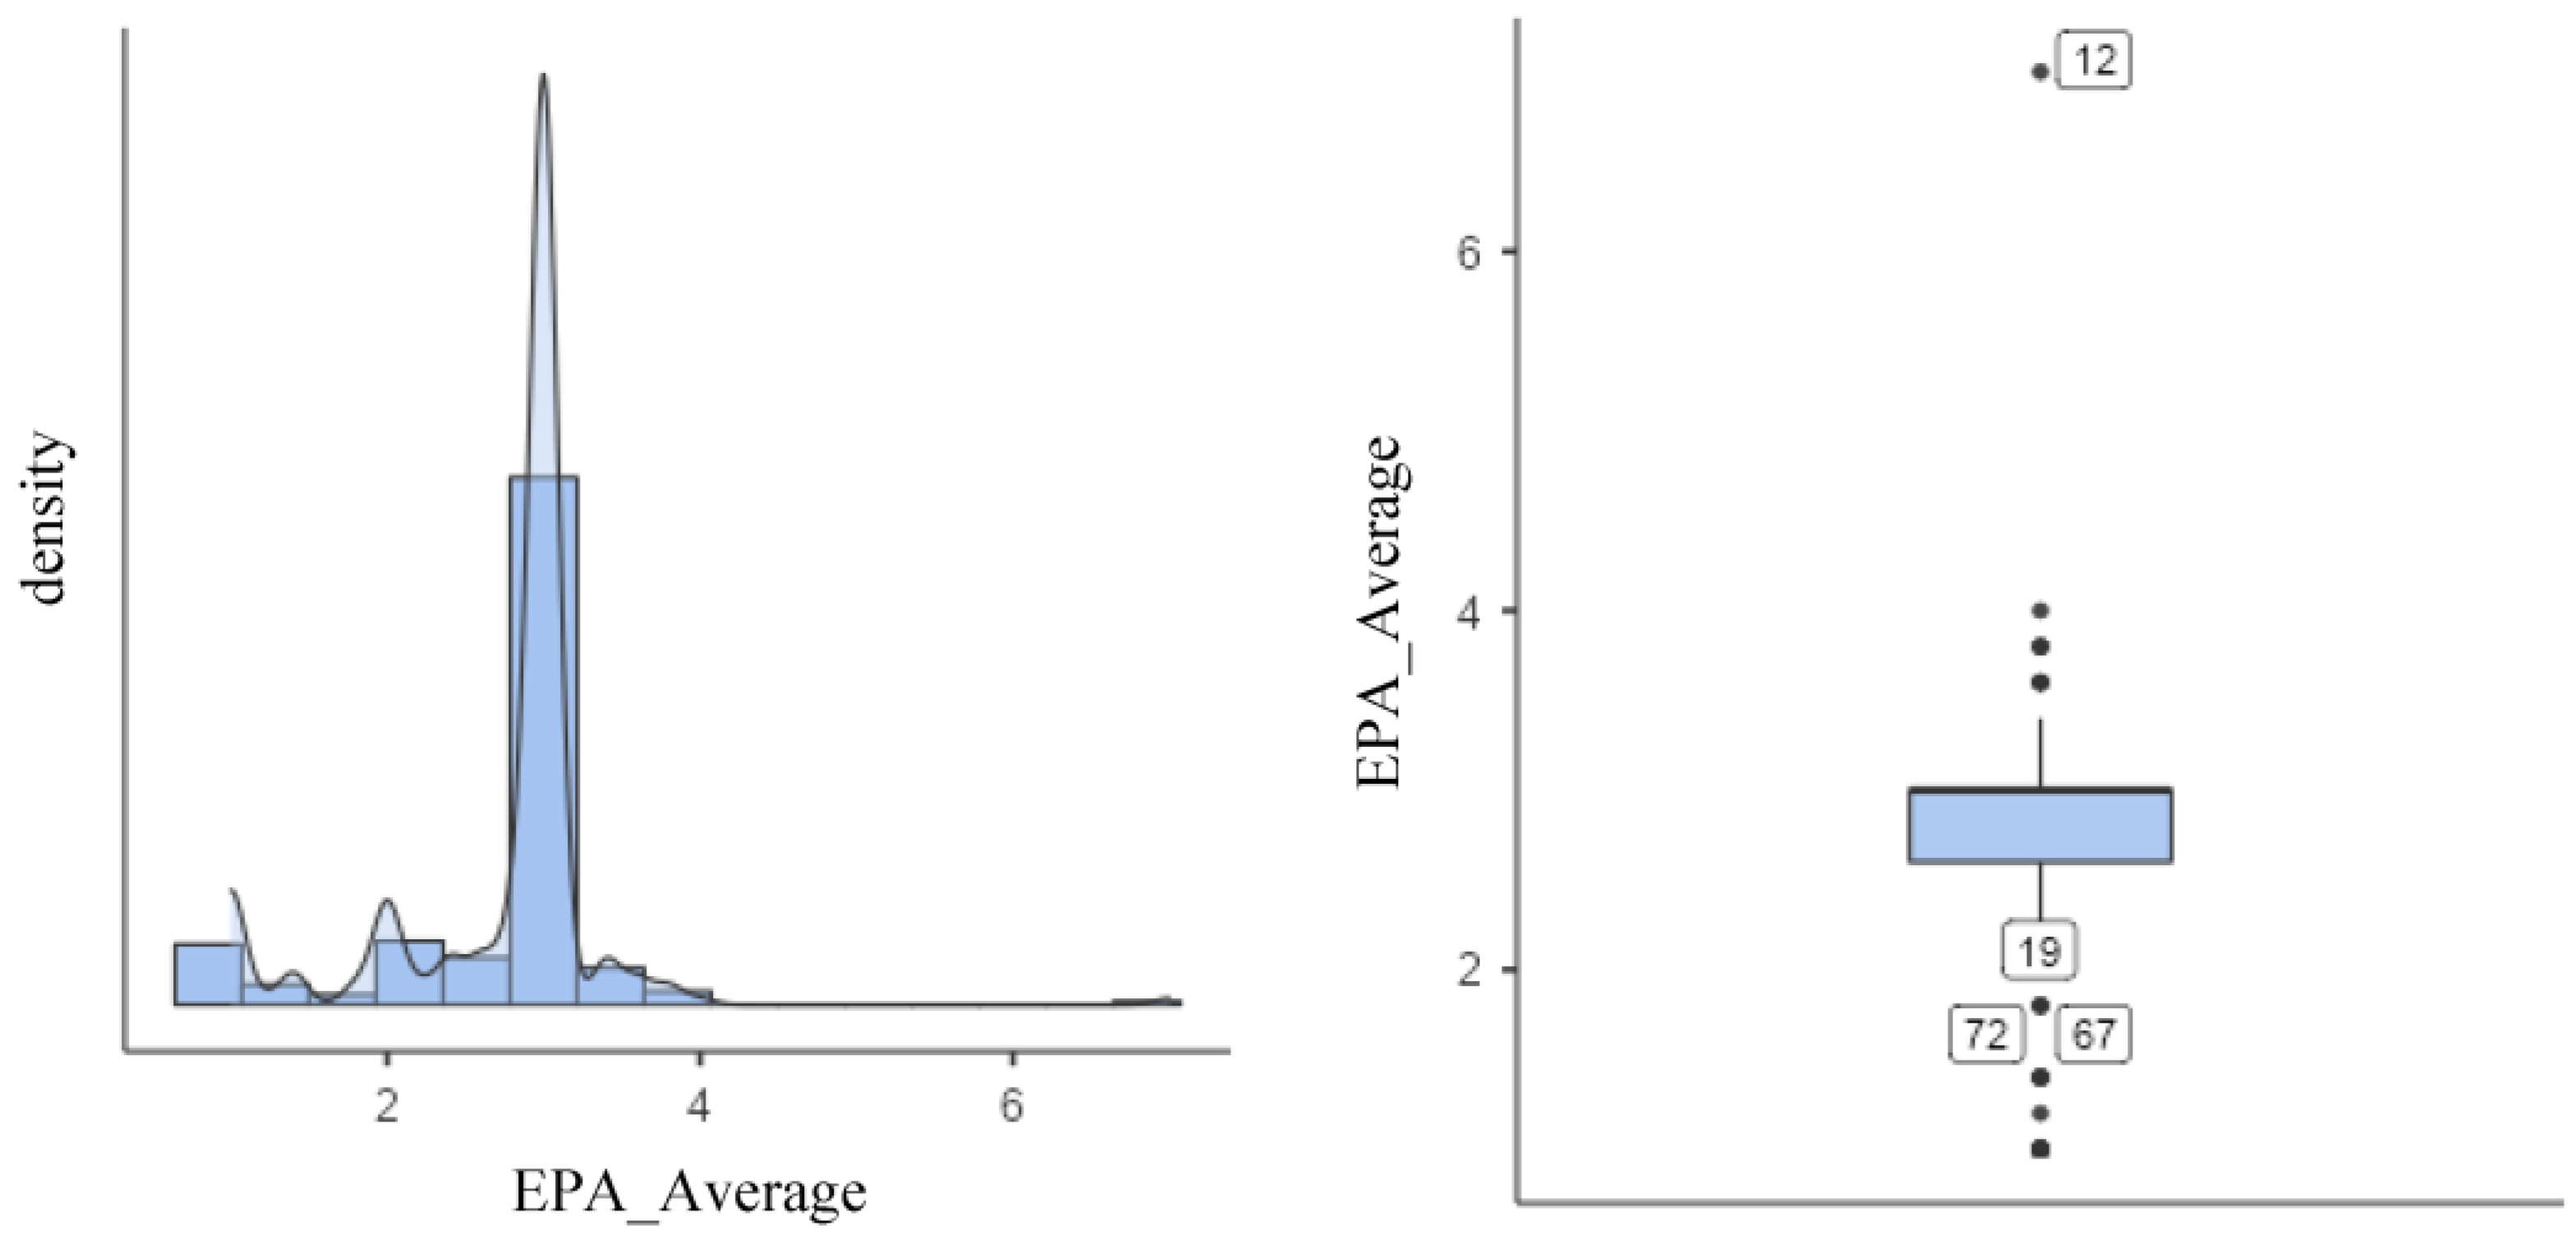
5.2.2. Adoption of Environmental Practices
Five indicators comprise the environmental practice adoption construct; the mean value can be calculated by
Figure 3 shows the histogram and density distribution of responses.
With the concentration of responses in “somewhat agree”, companies show that they are still not adopting the proper environmental practices.
Table 5 shows the correlations between the indicators of the construct.
The lower correlation of the AEP5 indicator with the other indicators shows that the implementation of selective garbage collection has even less adherence than other environmental practices such as purchasing ecological products, reducing the use of environmentally harmful products, and energy- and water-saving practices.
5.2.3. Operating Performance
The operating performance construct is composed of four indicators; the mean value can be calculated by
Figure 4 shows the histogram and density of the distribution of responses, indicating that respondents agree that environmental protection activities influence companies’ operating performance.
Table 6 shows the correlations between the indicators of the construct.
The OPPERF4 indicator related to obtaining public support for cleaner production is the least correlated with the other indicators, again showing the need for greater support from the authorities.
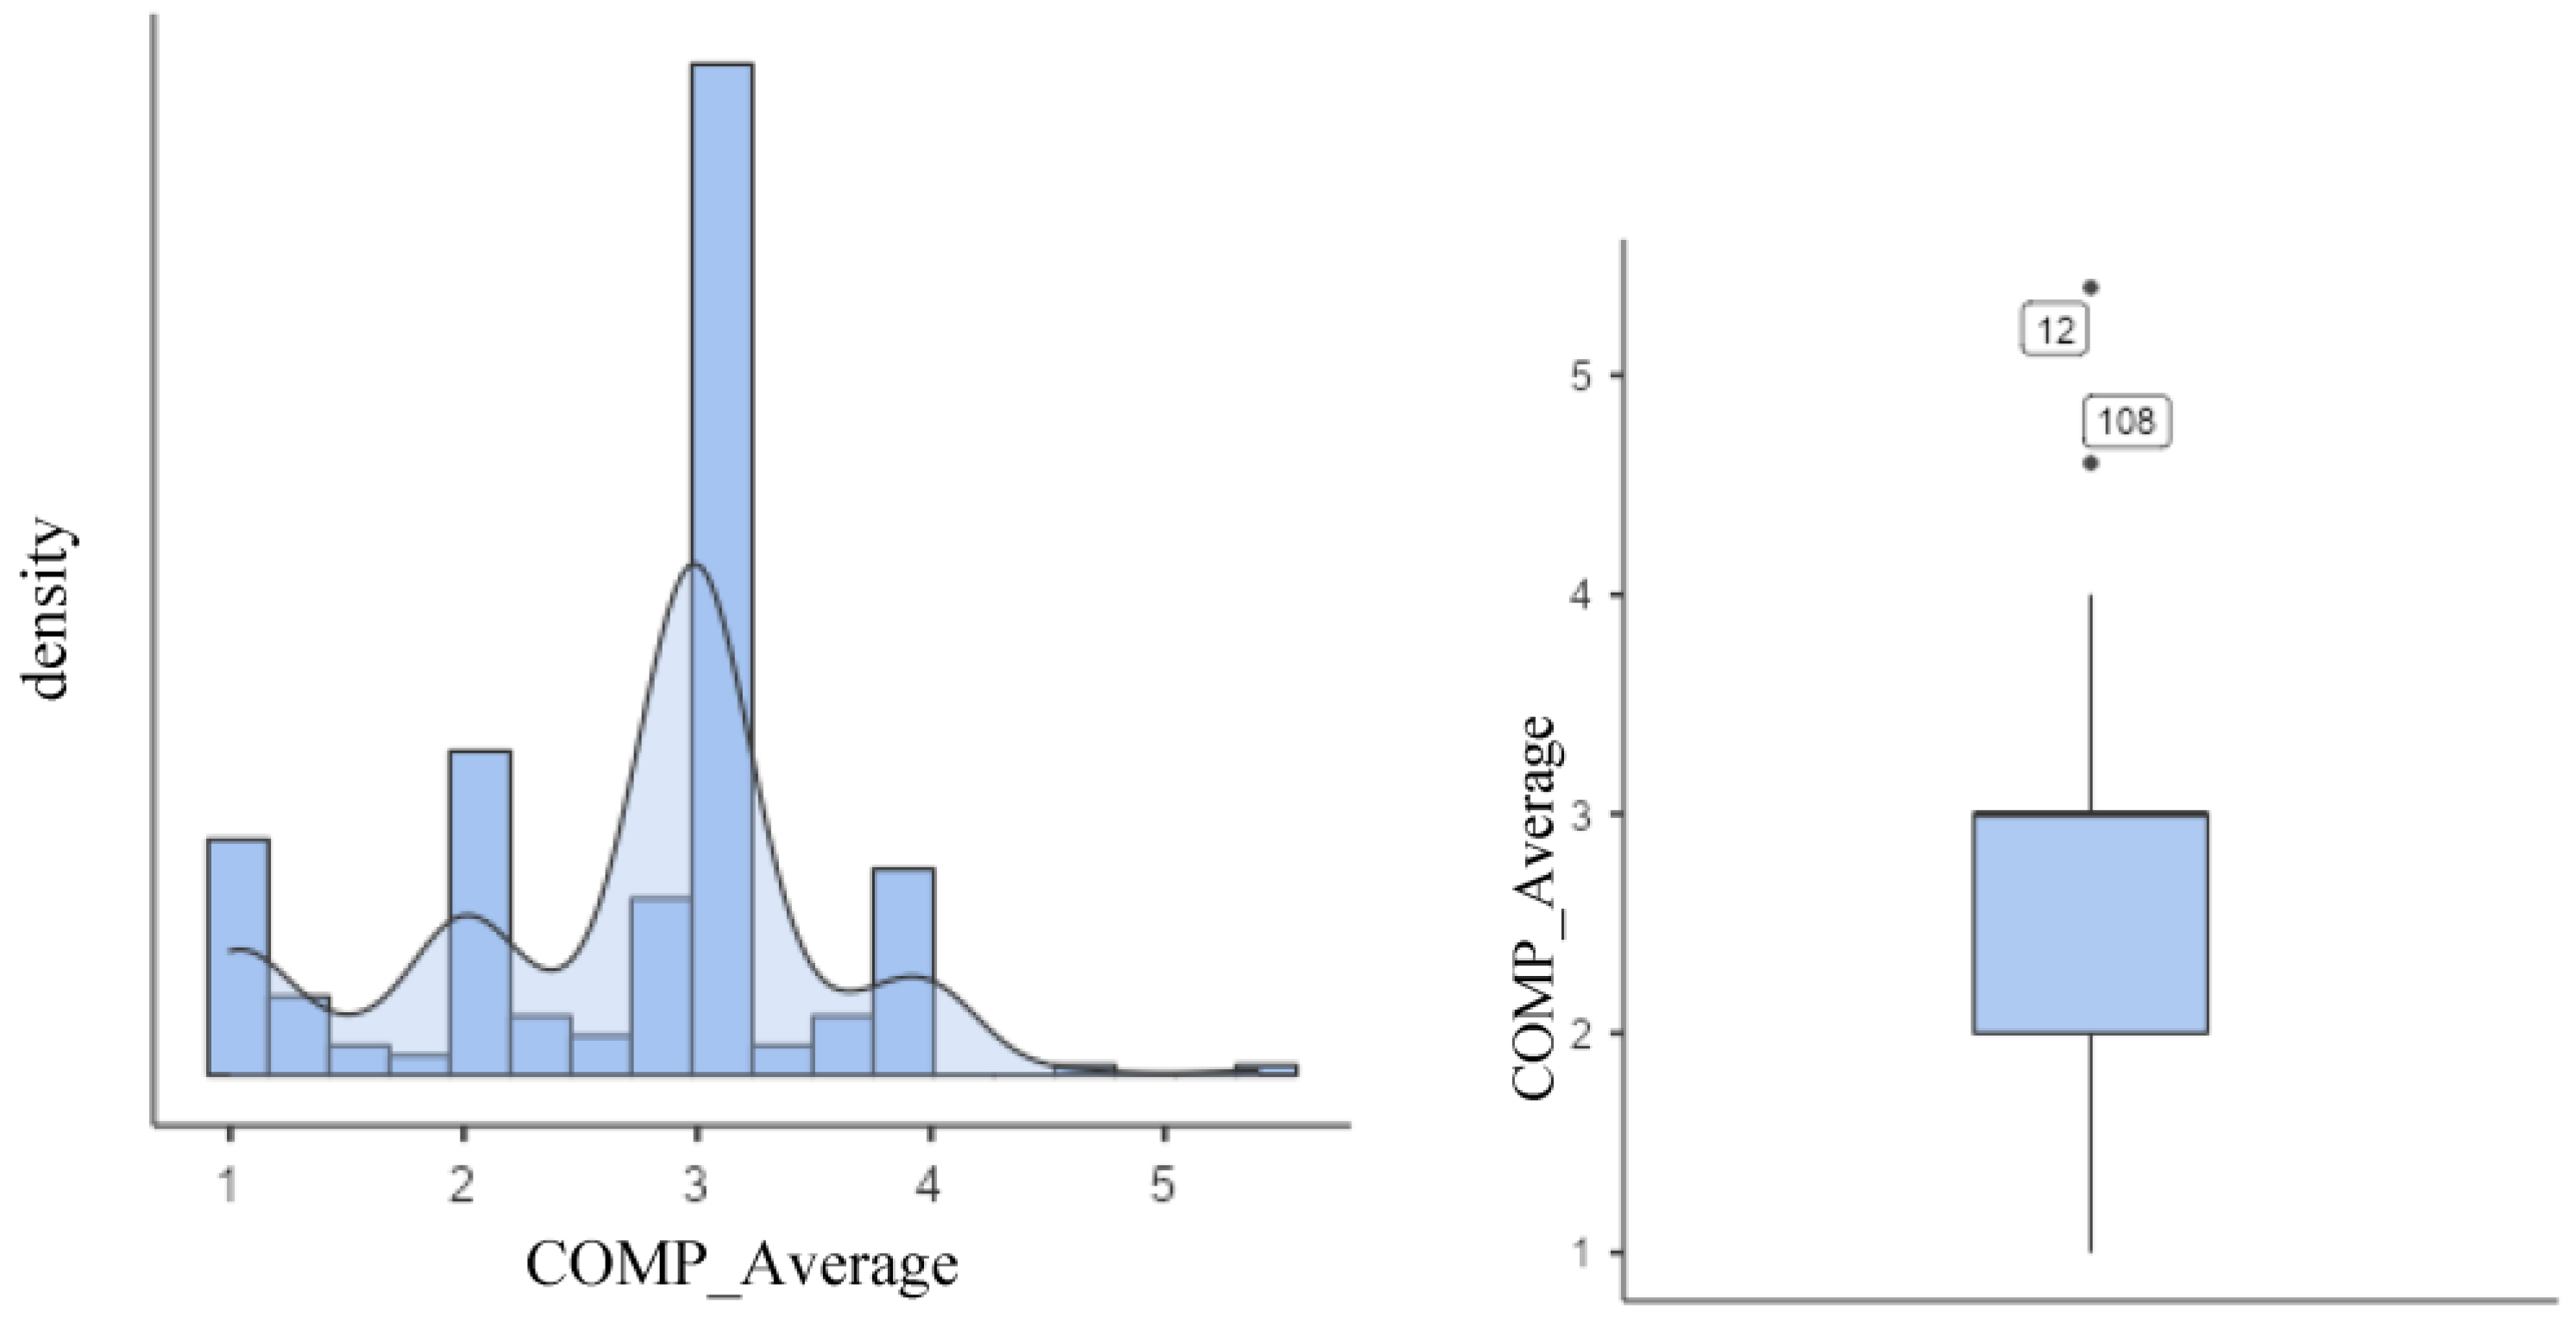
5.2.4. Competitiveness
Composed of five indicators, the competitiveness construct’s mean value can be calculated by
Figure 5 shows the histogram and density of the distribution of the responses, indicating that the respondents slightly or partially agree that they are more competitive than their competitors.
Table 7 shows the correlations between the indicators of the construct.
The COMP5 indicator related to the level of sales compared to competitors shows that this item has less agreement compared to the other indicators.
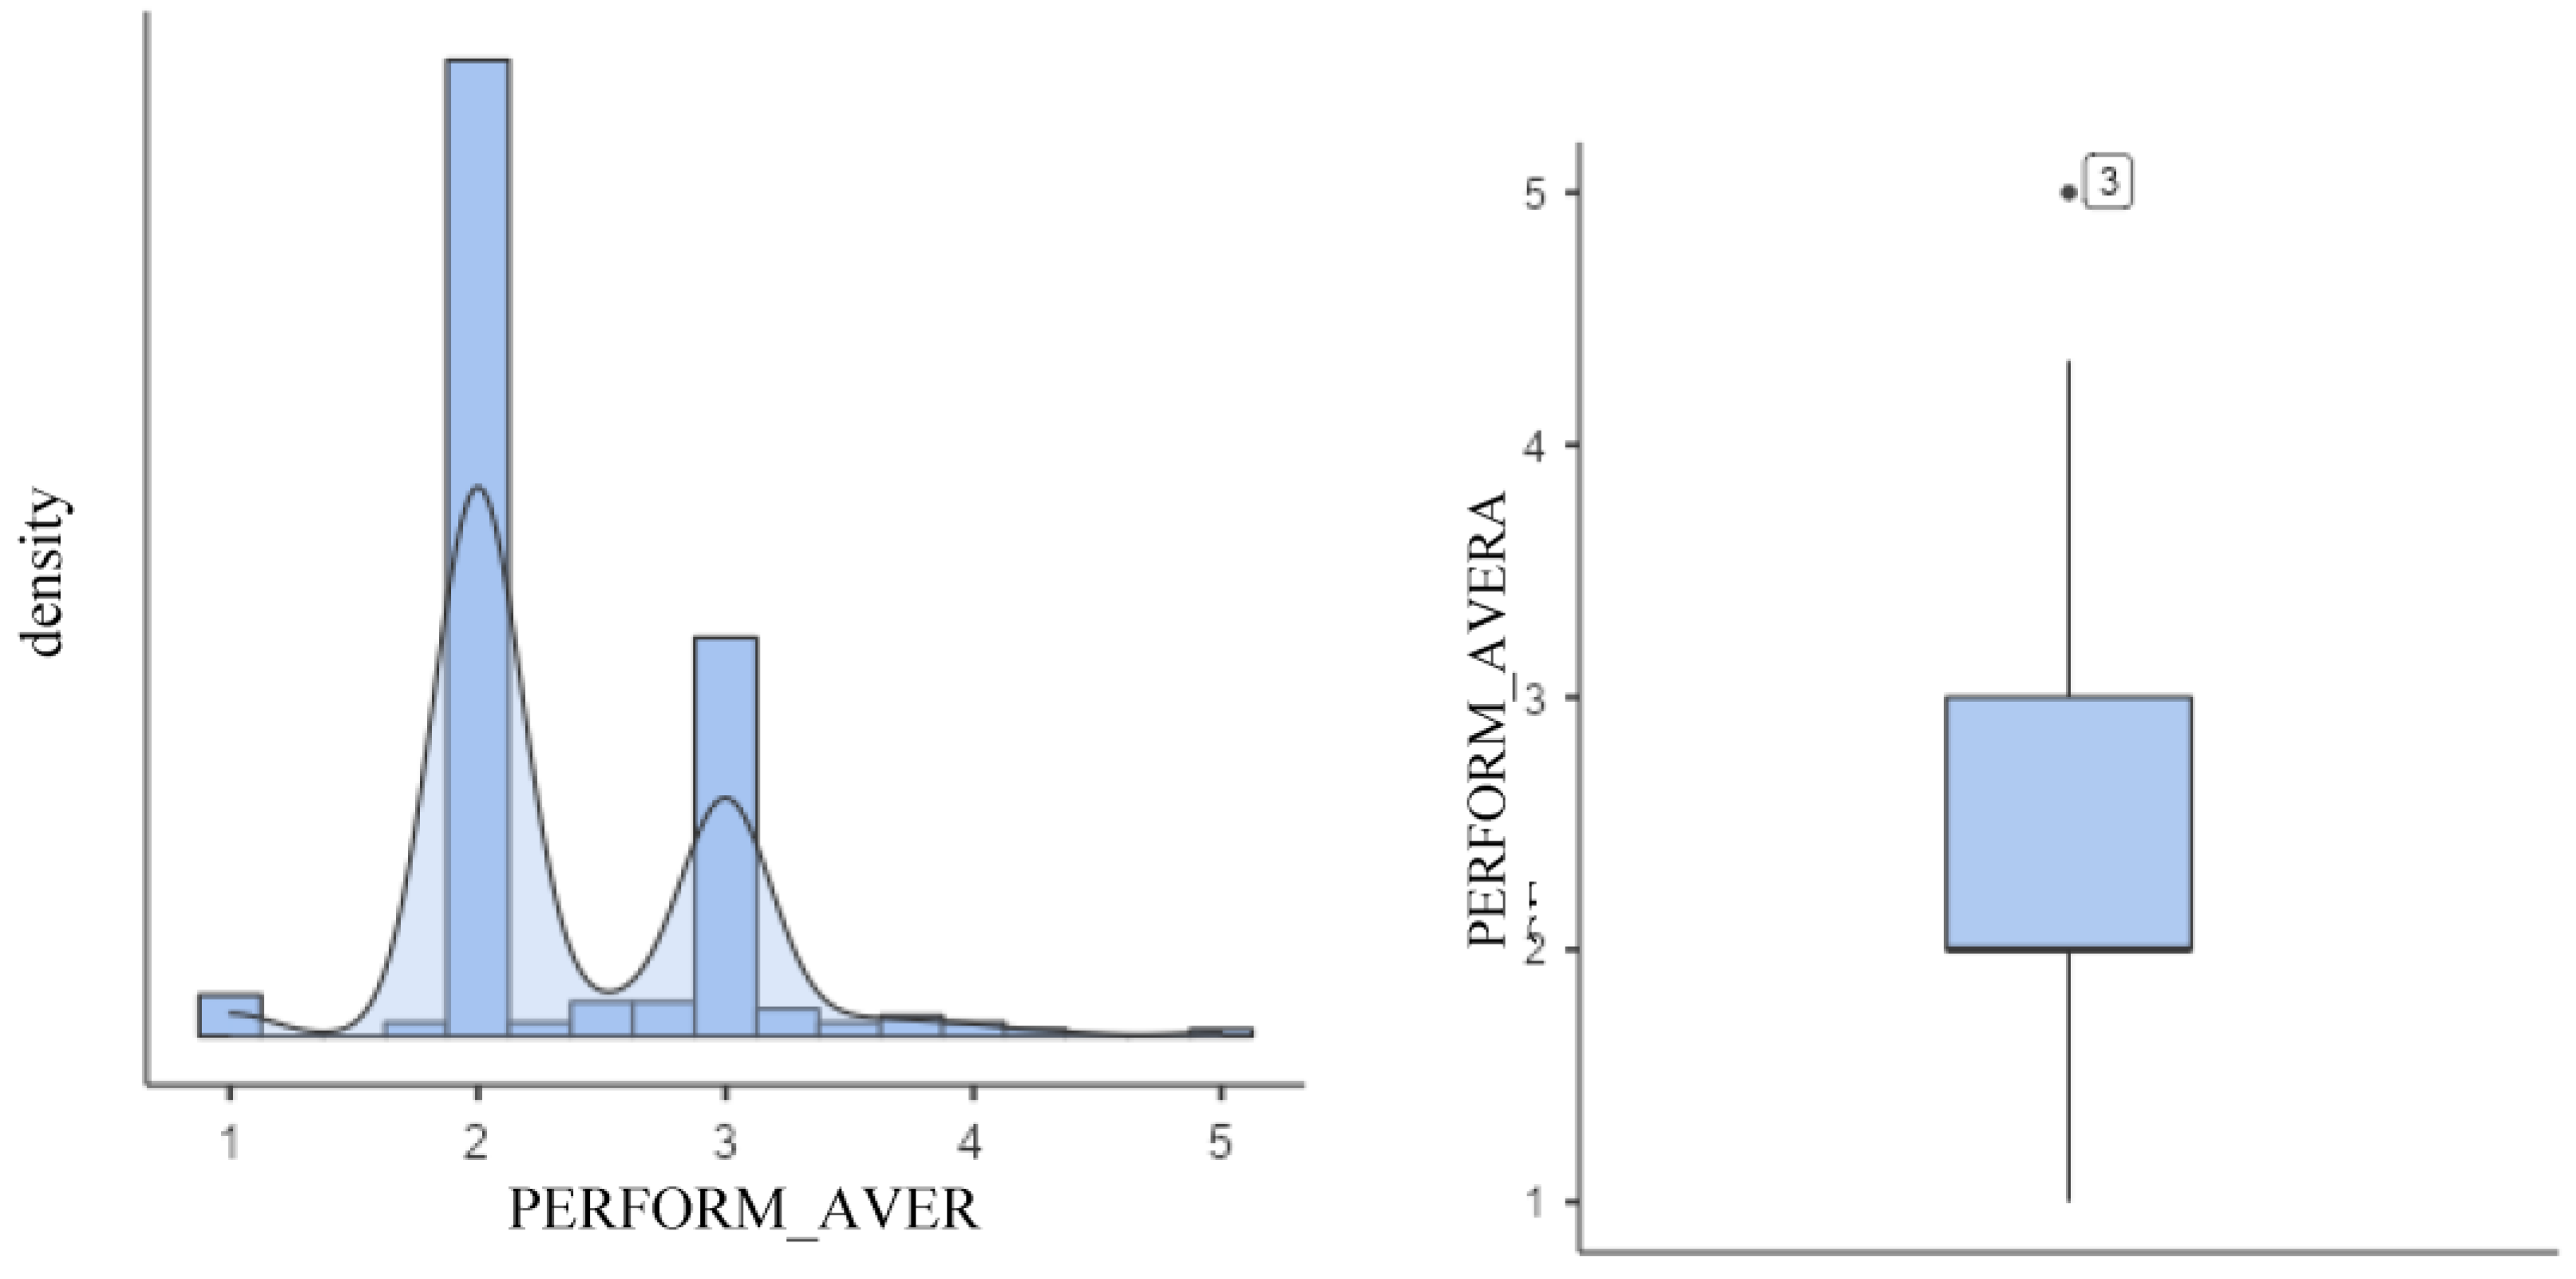
5.2.5. Corporate Performance
The company performance construct contains the most indicators (six) and indicates the performance of the last 2 years (2020 and 2021). Its mean value can be calculated by
Figure 6 shows the histogram and density of the distribution of the answers, indicating that the respondents partially agree that the company’s performance was reduced in the last two years.
Table 8 shows the correlations between the indicators of the construct.
The PERFORM6 indicator related to recreational services shows that these did not present a reduction in the level of service, while lodging (PERFORM4) and food services (PERFORM 5) reduced over the last two years. At the same time, there is a high correlation between sales (PERFORM1), profitability (PERFORM2), market share (PERFORM3), and lodging service level (PERFORM4).
5.3. Differences by Group of Characteristics
The statistical method of analysis of variance (ANOVA) is a hypothesis test of averages of two or more groups, demonstrating whether they are equal [
54].
The F-Test calculated by ANOVA should be complemented by the Bonferroni test, in which the averages are compared in pairs in order to verify whether the differences should be considered statistically significant [
55].
To verify whether the average of the competitiveness construct differs for the category, size, time in business, and control groups, Stata [
52] was used through the following command: one way <variable> <group>, tabulate bonferroni.
Table 9 shows the means, standard deviation, and F-value for competitiveness.
There is no significant difference between the competitiveness averages in the category group, while in the other groups, the hypothesis that the averages for competitiveness between components are equal can be rejected.
Table 10 shows the differences and the
p-value for the comparison of average competitiveness of each component within the group, using the Bonferroni test.
In the “size” item, larger establishments had better operating performance on average, but without a statistically significant difference.
On average, enterprises with more than 10 years in business showed better competitiveness than those with less than 5 years (p < 0.1) and from 5 to 10 years in business (not statistically significant). In terms of capital control, publicly traded enterprises showed better competitiveness, on average, compared to privately held companies (p < 0.01).
The hotel sector is constantly evolving and adapting to market changes and new technologies. The COVID-19 pandemic required hotels to quickly adapt to ensure the safety of guests and employees and maintain business viability. The establishments that reported positive effects of the pandemic on business showed better competitiveness, on average, than those that reported negative effects on earnings due to COVID-19 (p < 0.01), but there was no statistically significant difference in competitiveness with those that declared no change in earnings. When comparing those who reported no change with those who reported being harmed by the pandemic, the competitiveness of the latter was lower than that of the former (p < 0.1).
5.4. Evaluating the Measurement Model
SmartPLS 4.0 software [
56] was used to estimate the model and evaluate the convergent validity, discriminant validity, and reliability of the constructs.
Table 11 shows the cross-loading matrix, indicating that all items had higher factor loadings in their constructs than in any other construct.
With the exception of one item with a loading equal to 0.509 (PERFORM6), the items had a factor loading above 0.7, and all constructs had an average variance extracted above 0.5, indicating convergent validity [
53].
Table 12 was obtained through the bootstrap technique with 10,000 iterations, showing that all factor loadings obtained are statistically significant (
p < 0.01). Bootstrapping is a non-parametric procedure that allows testing the statistical significance of several PLS-SEM results, since it does not assume that the data are distributed normally. It is not possible to apply parametric significance tests to test whether coefficients such as external weights, external loadings, and path coefficients are significant. Rather, PLS-SEM relies on a non-parametric bootstrap procedure [
57] that consists of creating sub-samples with observations randomly drawn from the original data set (with replacement). The sub-sample estimates the PLS path model. This process is repeated with several random subsamples that have been created—typically around 10,000—and the parameter estimates obtained from the sub-samples are used to derive 95% confidence intervals for testing for the significance [
56].
Table 13 shows the correlation matrix between the latent variables. As the average variance extracted (AVE) values are greater than 0.5, there is convergent validity. The square root of the AVE (diagonal values in
Table 12) is greater than the correlations (off-diagonal values), thus demonstrating discriminant validity [
53]. The composite reliability and Cronbach’s alpha values are above 0.8, indicating the reliability of latent variables [
58]. Therefore, the model showed convergent validity, discriminant validity, and reliability.
5.5. Evaluating the Structural Model
The analysis of the structural model was carried out in three stages: (i) influence of control variables to select the most significant ones; (ii) analysis of the structural model only with the latent variables in order to correct possible problems, especially multicollinearity; and (iii) general analysis of the model with the latent and control variables to confirm (or not) the study’s hypotheses.
Table 14 shows the results of all the models used in the aforementioned steps.
For the first stage, the variables of size (proxy for number of employees), time in business, capital control (publicly traded or privately held), and perception of the effect of the pandemic (favorable or unfavorable) on the situation were included in Model I, in the competitiveness latent variable. It was noted that none of the control variables showed statistical significance, and multicollinearity was identified in the components COMP2, COMP3, COMP4, and COMP5 (VIF > 5), which may explain the result. Observing the data of the components, COMP2 was excluded, and the components had a VIF lower than 3.7, thereby solving the problem of multicollinearity (Model II). Thus, the result obtained was that the more employees the establishment has, the greater the competitiveness (p < 0.1). In Model III, the variables related to the perception of being favored or suffering loss due to the pandemic were excluded so as to verify whether they interfered with the results of the other variables. In fact, with the exclusion of these, the capital variable started to show statistical significance (p < 0.1). Model IV, which operates only with the control variables of size and capital, indicates that the larger the size, the greater the competitiveness (p < 0.1) and that publicly traded capital provides greater competitiveness (p < 0.05). It should be noted that the negative sign of the relationship is explained by the fact that the closer to 1, the greater the competitiveness construct. The same logic applies to the other constructs, apart from company performance, where the closer to 5, the greater the perceived increase, both financially (sales, profitability, and market share) and in the provision of services (lodging, food, and recreation).
For the analysis of the structural model only with the latent variables to correct any problems, especially multicollinearity, Model V was built. With the exception of the company performance construct, all constructs were statistically significant (
p < 0.01). The high correlation between the components of the company performance construct resulted in multicollinearity, with a VIF greater than 27.9. Examining the data, Model VI was constructed excluding the components with the highest collinearity (PERFORM2, PERFORM3, and PERFORM4), resulting in a VIF of less than 4.528 [
59].
Lastly, Model VII was constructed, formed by joining Model VI (latent variables) with Model IV (control variables). Hypothesis H1 (environmental pressure is positively related to adoption of environmental practices) was confirmed (
p < 0.01), albeit with an effect (f
2) between small and average [
53]. This result was also obtained in a previous study on service companies [
11], which corroborates the confirmation of H1.
Hypothesis H2 (adoption of environmental practices is positively related to operational improvements) was confirmed (
p < 0.01), with a large effect. This conclusion was seen in previous studies on hotels [
31,
45] and service companies [
11], which showed similar results, thereby confirming H2.
Hypothesis H3 (adoption of environmental practices is positively related to competitiveness) was also confirmed (
p < 0.01), with a medium effect, and is corroborated by the results obtained in previous studies on hotels [
31] and service companies [
11].
Likewise, hypothesis H4 (adoption of environmental practices is indirectly positively related to competitiveness—mediated by an operational improvement) was confirmed (
p < 0.01), although with a small effect. It was also observed that the larger the size of the establishment, the greater the competitiveness (
p < 0.01). In a service company study [
11], the adoption of environmental practices also positively influenced competitiveness, although there was no mention of the influence of company size.
The only unconfirmed hypothesis was H5, in which it was expected that the adoption of environmental practices, mediated by competitiveness, would reflect positively on performance. Although this fact occurred, it was not statistically significant; therefore, it cannot be said that the adoption of environmental practices, mediated by competitiveness, provides better performance. This result is different from a previous study conducted in service companies [
11], in which the adoption of environmental practices positively influenced the performance of service companies.
6. Discussion
The aim of this study was to show that the adoption of environmental practices could be positive related to pressure from society (H1), the operational performance (H2), and the competitiveness of companies in the hotel industry (H3). Additionally, better operational performance could be positively related to competitiveness (H4). Lastly, greater competitiveness could positively influence a company’s performance (H5). Hypotheses H1, H2, H3, and H4 were confirmed in the study, but hypothesis H5 was not. It is likely that this hypothesis remained unconfirmed due to several factors: (i) the influence of competitiveness on company performance may not be as relevant as shown by the f2 effect (0.019 = weak), and the predictive power of the adjusted R2 = 0.014 was low; (ii) the sample was collected in several regions of Brazil that have diversified tourist attractiveness, which influences the companies’ performance; and (iii) the measurements were made in relation to the variations in performance in the last two years, so companies that were high performers may have maintained their performance and continued to be very competitive.
Among the study’s limitations, we mention the following: (i) the impossibility of generalizing the results due to non-probabilistic sampling; (ii) the lack of identification of the places/regions where the establishments are located; (iii) the time in business and the number of employees were requested by range and not in absolute values; and (iv) the answers were only qualitative, thus precluding the identification of different levels of performance, particularly financial.
Eco-innovation considers four antecedents at the organization level (ability to recognize and seize opportunities, attitudes of top managers, and pressure from stakeholders) and three outcomes (cost and differentiation in relation to a company’s competitive advantage and the result of its organizational performance). Sustainable innovation is critical if we wish to minimize the environmental damage caused by tourism companies. Eco-innovation fully mediates the relationships between the ability to recognize opportunities in both dimensions of competitive advantage [
60].
The hospitality industry has a significant stake in eco-innovation, offering amenities and venues for major events and meetings to promote sustainability and actions to deal with climate change, as a priority for conducting business and to ensure that people and the planet can prosper, both now and in the future.
The industry must promote eco-innovations in order to leverage companies’ capabilities and resources to generate a competitive advantage [
60]. The contribution of this study is that it shows that eco-innovation plays a significant role in the performance of companies (sales, profitability, and market share), thus corroborating the research and confirming the new growth trends in the sectors of hotels and inns.
With the results of this research, we are sending out an alert on environmental issues, showing that the adoption of eco-innovation by service companies brings about a wide array of benefits, improving hotels’ and inns’ competitiveness and performance in this segment of the market.
The results of the data obtained from the answers to the questionnaires present a new scenario, since we did not find any articles on eco-innovation associated with the performance of companies in Brazil using the structural equation model, with the treatment confirmed by the results obtained in the statistical tests.
7. Conclusions
The objective of this study was to explore the impact of adopting eco-innovation on the performance of companies in the hotel sector in Brazil. The results show that environmental pressure is positively related to the adoption of environmental practices, and this adoption is positively related to operational improvements and the competitiveness of companies in the hotel sector. Furthermore, the adoption of environmental practices is indirectly positively related to competitiveness, mediated by an operational improvement. Finally, the adoption of environmental practices, although positively related to performance, mediated by competitiveness, was not statistically significant, and, therefore, it cannot be said that this adoption would generate better performance in companies in the hotel sector in Brazil. Thus, in a broader context, the objective of this study was to provide useful empirical evidence and bring elements, perceptions, and support to the discussion of the theme that the adoption of eco-innovation positively impacts companies in the hotel sector. This study opens new ground for researchers interested in eco-innovation associated with competitiveness and its impact on a company’s performance.


