Article

MaaS Adoption and Sustainability for Systematic Trips: Estimation of Environmental Impacts in a Medium-Sized City

by
Riccardo Ceccato
1,*,
Andrea Baldassa
1,2,
Federico Orsini
1,2,
Riccardo Rossi
1,2 and
Massimiliano Gastaldi
1,2,3
1
Department of Civil, Architectural and Environmental Engineering, University of Padua, 35131 Padua, Italy
2
Mobility and Behavior Research Centre—MoBe, University of Padua, 35131 Padua, Italy
3
Department of General Psychology, University of Padua, 35131 Padua, Italy
*
Author to whom correspondence should be addressed.
Sustainability 2023, 15(11), 8690; https://doi.org/10.3390/su15118690
Submission received: 28 April 2023 / Revised: 19 May 2023 / Accepted: 25 May 2023 / Published: 27 May 2023
(This article belongs to the Special Issue Looking Back, Looking Ahead: Vehicle Sharing and Sustainability)

Abstract

:
Mobility as a Service (MaaS) is often seen as a promising solution to address societal and environmental challenges. Despite the importance of quantifying its potential benefits, few previous works have focused on the impacts on the environment, and all of them considered large cities. This study aims to forecast the diffusion of MaaS in a medium-sized city and quantify the consequent reduction in pollutant emissions for commuting trips. Answers from a mobility survey administered to employees of the Municipality of Padua (Italy) were used to calibrate a model predicting MaaS adoption, which was applied to real working trips to estimate daily vehicle emissions savings in future scenarios with different MaaS bundles. The results indicated that the opportunity to have multimodal mobility options providing door-to-door travel is a fundamental element to ensure wide MaaS diffusion. Furthermore, public transport was confirmed to be the backbone of such a system. Compared to the current scenario, we observed up to a 41% reduction in pollutant emissions. The analysis pointed out that MaaS adoption is highly dependent on the characteristics of the proposed bundles, thus highlighting the importance of a proper design of the service and ex ante evaluation of emission savings.

1. Introduction

The widespread diffusion of digital technologies and recent shifts toward service-oriented approaches, as opposed to asset-oriented approaches, have prompted deep impacts in several sectors, including mobility [1,2,3]. From this perspective, Mobility as a Service (MaaS) is considered as an innovative ecosystem that will lead to disruptive changes in the concept of mobility [4]. According to this new paradigm, the system does not provide access to individual transport products or services, but delivers mobility where it is needed [5]. Unlike traditional transport systems, where users have a limited possibility to define the type and level of service they receive and operators have to provide a service independently of actual usage, an MaaS system ensures direct communication between providers and end users, who can select the most appropriate mobility service for their journeys. In addition, the service allows users, providers, and regulators to monitor trips in real time, thus optimizing their specific needs [5]. Although there is no agreed definition of MaaS [6], it can be defined as an integrated framework that offers personalized and multimodal mobility services through a digital platform, where users can plan, book, and pay for their trips [7]. The system is designed to achieve sustainable policy goals [8] and is often viewed as a promising solution to address societal and environmental challenges, especially in urban areas [4,9]. In many cities, the car-oriented mobility style has led to congestion, pollution problems, and inefficient land use [6,10]. This has prompted local authorities to promote the shift from private car to public transport [11]; however, this cannot satisfy all travel needs as a standalone service. MaaS can effectively provide multimodal sustainable options to satisfy individual mobility requirements [10]. Therefore, from this perspective, MaaS could have the potential to change travel behavior to achieve the sustainability goals for which it should be designed [1,12].
Specifically, one of the fundamental goals of MaaS is to satisfy all the mobility needs of travelers, by providing a wide range of mobility options. In line with this perspective, the system aims to connect users with transport services in a more responsive way than the traditional system [5]. As an alternative to driving alone, desired outcomes of MaaS are reduced car ownership, vehicle kilometers travelled, and parking demand, and improved accessibility and equity [13]. The growing literature on MaaS highlights the challenges that this service is facing/has to face to foster the adoption of multimodal solutions provided within the system [10,14]. First, its attractiveness is mainly affected by the service level of the offered mobility options [15]. Second, apart from being an application providing a seamless booking and payment experience and travel information, it could be simply seen as a combination of existing modes [7]. Many people may already be aware of these alternatives, thus reducing MaaS’ attractiveness [15]. In order to address these challenges and improve sustainable mobility habits, in the past, some authors proposed combining the service with measures to reduce car use [11], including car-oriented options such as electric car sharing services [16], or implementing MaaS as a mobility service within a wider platform that includes both transport and nontransport services [17]. Given this prospect, many studies have been performed on MaaS’ characteristics and adoption [18], with the aim of evaluating potential demand and designing its attributes [8]. Most of them focus on the acceptance of the service among travelers [1,6,19] and the choice of MaaS bundles [12,20,21]. These studies were carried out by adopting two approaches: Stated-Preference (SP) experiments, to evaluate nonexisting services, and before/after analysis of pilot projects. Data from pilot experiments are more valuable and allow one to overcome the hypothetical bias of SP experiments [22]. However, they can be difficult to implement and, as experimental studies, they may not provide a sufficient number of subscribers and enough variation in specific parameters to analyze the adoption propensity and calibrate forecasting models [6].
Matyas and Kamargianni [21] carried out a seminal work in which they calibrated bundle choice models on SP data from a mobility survey administered in London. The results of a sequential portfolio choice SP experiment were used by Caiati et al. [1] to investigate MaaS acceptance, bundle preference, and willingness to pay for the service in the Netherlands. Hensher et al. [12] used data from the Sydney MaaS trial to develop a model to jointly forecast the choice between MaaS bundles and the total kilometers travelled by car. A similar dataset was adopted by Ho et al. [22] to investigate users’ preference for different subscription plans and pay-as-you-go option. Recently, Franco and Vitetta [23] studied preferences for MaaS bundles in an Italian city by considering answers to SP experiments. Kriswardhana and Eszterg’ar-Kiss [9] implemented a model to evaluate the relationship among MaaS packages, users’ adoption of the service, and their attitudinal attributes using SP data from college students. Focusing on a sample of Dutch car owners, Van’t Veer et al. [24] evaluated factors affecting the potential decision to use MaaS.
Despite the numerous studies on MaaS adoption and bundling packages, the analysis of its impacts is still at an early stage [4]. This service is expected to prompt the switch from private cars to more sustainable vehicles, with several benefits for society, such as improving air quality, reducing congestion and the use of public space, and increasing accessibility and equity [13,22]. Because of these strong potential benefits, the quantification of these effects is of paramount importance for assessing the actual potentiality of MaaS [7]. Nevertheless, there is little evidence to assess to what extent these positive effects could occur [4]. In particular, few previous works have quantified the impacts of MaaS on the environment [6], and all are focused on large cities.
As regards potential shifts away from private car use, controversial results have been obtained. For instance, Sochor et al. [25] observed that participants in the Gothenburg MaaS trial halved the number of trips using this means. Using data from the Sydney trial, Hensher et al. [12] provided evidence that MaaS implementation could prompt a reduction of car-based kilometers travelled. On the other hand, from a pilot study in Ghent, Storme et al. [26] found that car owners were not likely to shift away from their vehicles. However, to the best of author’ knowledge, no previous works have focused on the direct estimation of the impacts of MaaS on air quality, with the notable exception of Labee et al. [6], who quantified potential savings in greenhouse gas emissions by applying an activity-based model in Amsterdam.
In this paper, the results of an SP survey administered to employees of the Municipality of Padua (Italy) were used to calibrate a model that forecasts the adoption of MaaS for commute trips. The model was applied to a dataset of real working trips to estimate the potential reduction in pollutant emissions from vehicles, under various scenarios with different service bundles. Unlike previous works, this study aimed to shed light on the potential diffusion of MaaS and its environmental benefits in medium-sized cities. The results could be helpful for both local governments and service providers. The former can understand to what extent the potential diffusion of MaaS can contribute to the achievement of sustainable goals [1], while the latter can take advantage of the estimate of latent demand for the service, thus measuring its attractiveness in a new market [8].

2. Materials and Methods

2.1. Data Collection

To reach the objectives of the paper, data from a mobility survey administered to employees of the Municipality of Padua were used. Padua is a densely medium-sized city in northern Italy, with about 200,000 inhabitants living in 93 square kilometers. The population density ranges from 1000 to 5900 inhabitants per square kilometer with an average value of 2200 inhabitants per square kilometer [27]. Currently, in the city, several transport services are operating: public transport (with urban buses, a tram line, and taxis), bike sharing (both station-based and free-floating services), e-scooter sharing, and station-based car sharing. The connection to external areas is ensured by suburban and train services, and park-and-ride areas.
The questionnaire was divided into Revealed-Preferences (RP) and Stated-Preferences (SP) parts. In the first section, detailed questions were asked about a typical commute trip carried out on a generic working day (trip length, travel cost, origin and destination, and travel modes); furthermore, information regarding travel habits of respondents was collected. In the second section, the interviewees took part in SP experiments in which they had to (1) choose between two MaaS bundles and (2) declare their propensity to actually use the chosen service to perform their commuting trips. In the SP experiments, each bundle was defined by combining the existing mobility service in the study area (bike sharing, e-scooter sharing, car sharing, urban bus/tram, suburban bus/train, park-and-ride, and night bus) and the corresponding price on a monthly basis. The inclusion of services in the packages and their costs were estimated considering information reported in the RP part of the survey and real price schemes in the area. Focusing on a real trip with realistic attributes increased the realism of the choice tasks and, thus, the reliability of answers. A D-optimal design was adopted to generate 16 choice scenarios, which were grouped so that each respondent had to face four choice tasks. In the last section of the survey, socioeconomic information was collected at both the household and individual levels. A complete description of the survey is reported in [20], where interested readers can find details about the design of SP scenarios.
The questionnaire was administered between October 2020 and January 2021 by sending emails to all 1600 employees.

2.2. Model for MaaS Adoption Forecasting

In this paper, data collected from the questions of the second SP part were used to calibrate a model that predicts the probability of adopting the chosen MaaS bundle to perform the commuting trip reported in the RP section of the survey. Specifically, answers related to the choice between the previously selected MaaS package and the travel mode actually adopted to commute were considered as dependent variables; therefore, a binary logit model was estimated. In this way, the future potential use of MaaS, replacing current mobility solutions for systematic trips to workplaces, can be predicted. Since each individual had to answer more than one SP question, a mixed logit model was implemented considering the panel nature of the data. This allowed us to take into account the correlation between error terms over multiple choice tasks for the same respondent [28]. Specifically, in the model specification, a panel-effect term was introduced [21].
Following this approach, the utility of decision maker n, obtained for the alternative i in choice task t is given by:
U i n t = V i n t + α i n + ε i n t
where V i n t is the systematic utility defined as the β X i n ( X i n is the vector of observed variables related to alternative i, and β is the vector of corresponding coefficients to be estimated); α i n is the panel-effect term. This term is independent from ε i n t , which is the error term assumed to be an independently, identically distributed extreme value. The probability of choosing the i conditional to α n is given by:
P ( i n t | α n ) = e V i n t + α i n j e V j n t + α j n
The contribution of the decision maker n to the log-likelihood conditional to α n (i.e., the probability that the individual n makes a sequence of choices T) is given by:
P ( i n 1 , i n 2 , , i n T | α n ) = t P ( i n t | α n )
The unconditional probability is the integral of Equation (3) over α :
P ( i n 1 , i n 2 , , i n T ) = α t P ( i n t α f ( α ) d α
The integral in Equation (4) cannot be calculated analytically, therefore a simulation was applied. Specifically, first the functional form of f α is defined. In this paper, α was assumed to follow a normal distribution with zero mean and σpanel standard deviation [21]. Then, a series of R draws ( α r ) is derived from that density function (500 Halton intelligent draws were used). After that, the integral in Equation (4) is approximated as:
P ( i n 1 , i n 2 , , i n T ) = 1 R r t P ( i n t α r
The parameters β and σpanel are estimated by maximizing the log-likelihood function (Equation (6)):
n ln P ( i n 1 , i n 2 , , i n T )
The model was then applied to the real dataset of reported commuting trips to predict the probability of adopting the chosen MaaS bundle to travel to the workplace.
The list and description of explanatory variables used in the final version of the model are reported in Table 1. They include variables related to (1) travel habits of respondents, such as frequency of use of travel modes, and their characteristics, such as income, and (2) attributes of the composition of the MaaS package, i.e., the presence of specific mobility options with defined characteristics, such as unlimited bike sharing. The latter were obtained from the first SP part, where an MaaS bundle was selected among those presented [29,30].

2.3. Emission Estimates

Since the service does not currently exist, different future scenarios were generated considering the combination of existing transport services in the area. The price of a package was calculated by adding the costs of the mobility services in that package, which were based on the fares of current operators in the area. The estimated choice model was applied to these hypothetical scenarios to forecast the probability of adopting MaaS, as an alternative mobility solution to that actually used to commute, considering bundle characteristics different from those presented in the first SP part of the survey.
In order to evaluate to what extent MaaS adoption can contribute to the sustainability of commuting trips, for each scenario, including the current scenario (the Base scenario), pollutant emissions generated by vehicles reaching the workplaces were estimated. A tank-to-wheel analysis was carried out, thus only quantifying the pollutants generated by tailpipe emissions. The estimation was carried out by adopting the COPERT model, developed by the European Environment Agency (EEA) [31] and based on the Handbook of Emission Factors of Road Transport (HBEFA) [32]. This approach has been widely used in previous works [6,33,34]. Following this method, for each pollutant, a unique emission factor, representing the average emission per unit of distance, was used as representative of the circulating fleet [35]. For these reasons, the approach is not completely accurate. However, in this paper, scenarios were evaluated in relative terms; therefore, the same level of approximation was applied consistently to all of them [36].
The estimation of pollutant emissions was performed by considering the characteristics of vehicles circulating in the area, obtained from the Automobile Club d’Italia (ACI) [37] and the real length of the commuting trips, reported in the RP part of the survey. In particular, for each scenario, the number of commuting trips carried out with the usual travel mode (i.e., for those individuals not switching to MaaS) was estimated by applying the calibrated adoption model. After that, emission factors were applied considering the travelled distance of each journey. In this way, total CO, CO2, NOx, PM10, and PM2.5 values generated by working trips were estimated.
Regarding pollutants generated by mobility solutions in the MaaS bundle, the characteristics of real services in the area were considered. Operators of e-scooter sharing and car sharing currently make electric vehicles available in the area; therefore, they were assumed to produce no tailpipe emissions [6]. Public transport vehicles are not electric; however, they usually circulate independently of the number of users. Therefore, since results are evaluated in relation to the Base scenario, their net contribution to pollutants was null. A park-and-ride was included in the bundles; therefore, potential users of these MaaS packages could decide to use private car to reach the parking facility. To adopt a conservative approach, the pollutant emissions generated by these trips were included in the analysis for those who had an available car to commute, considering the location of the existing park-and-ride infrastructures in the area.

3. Results

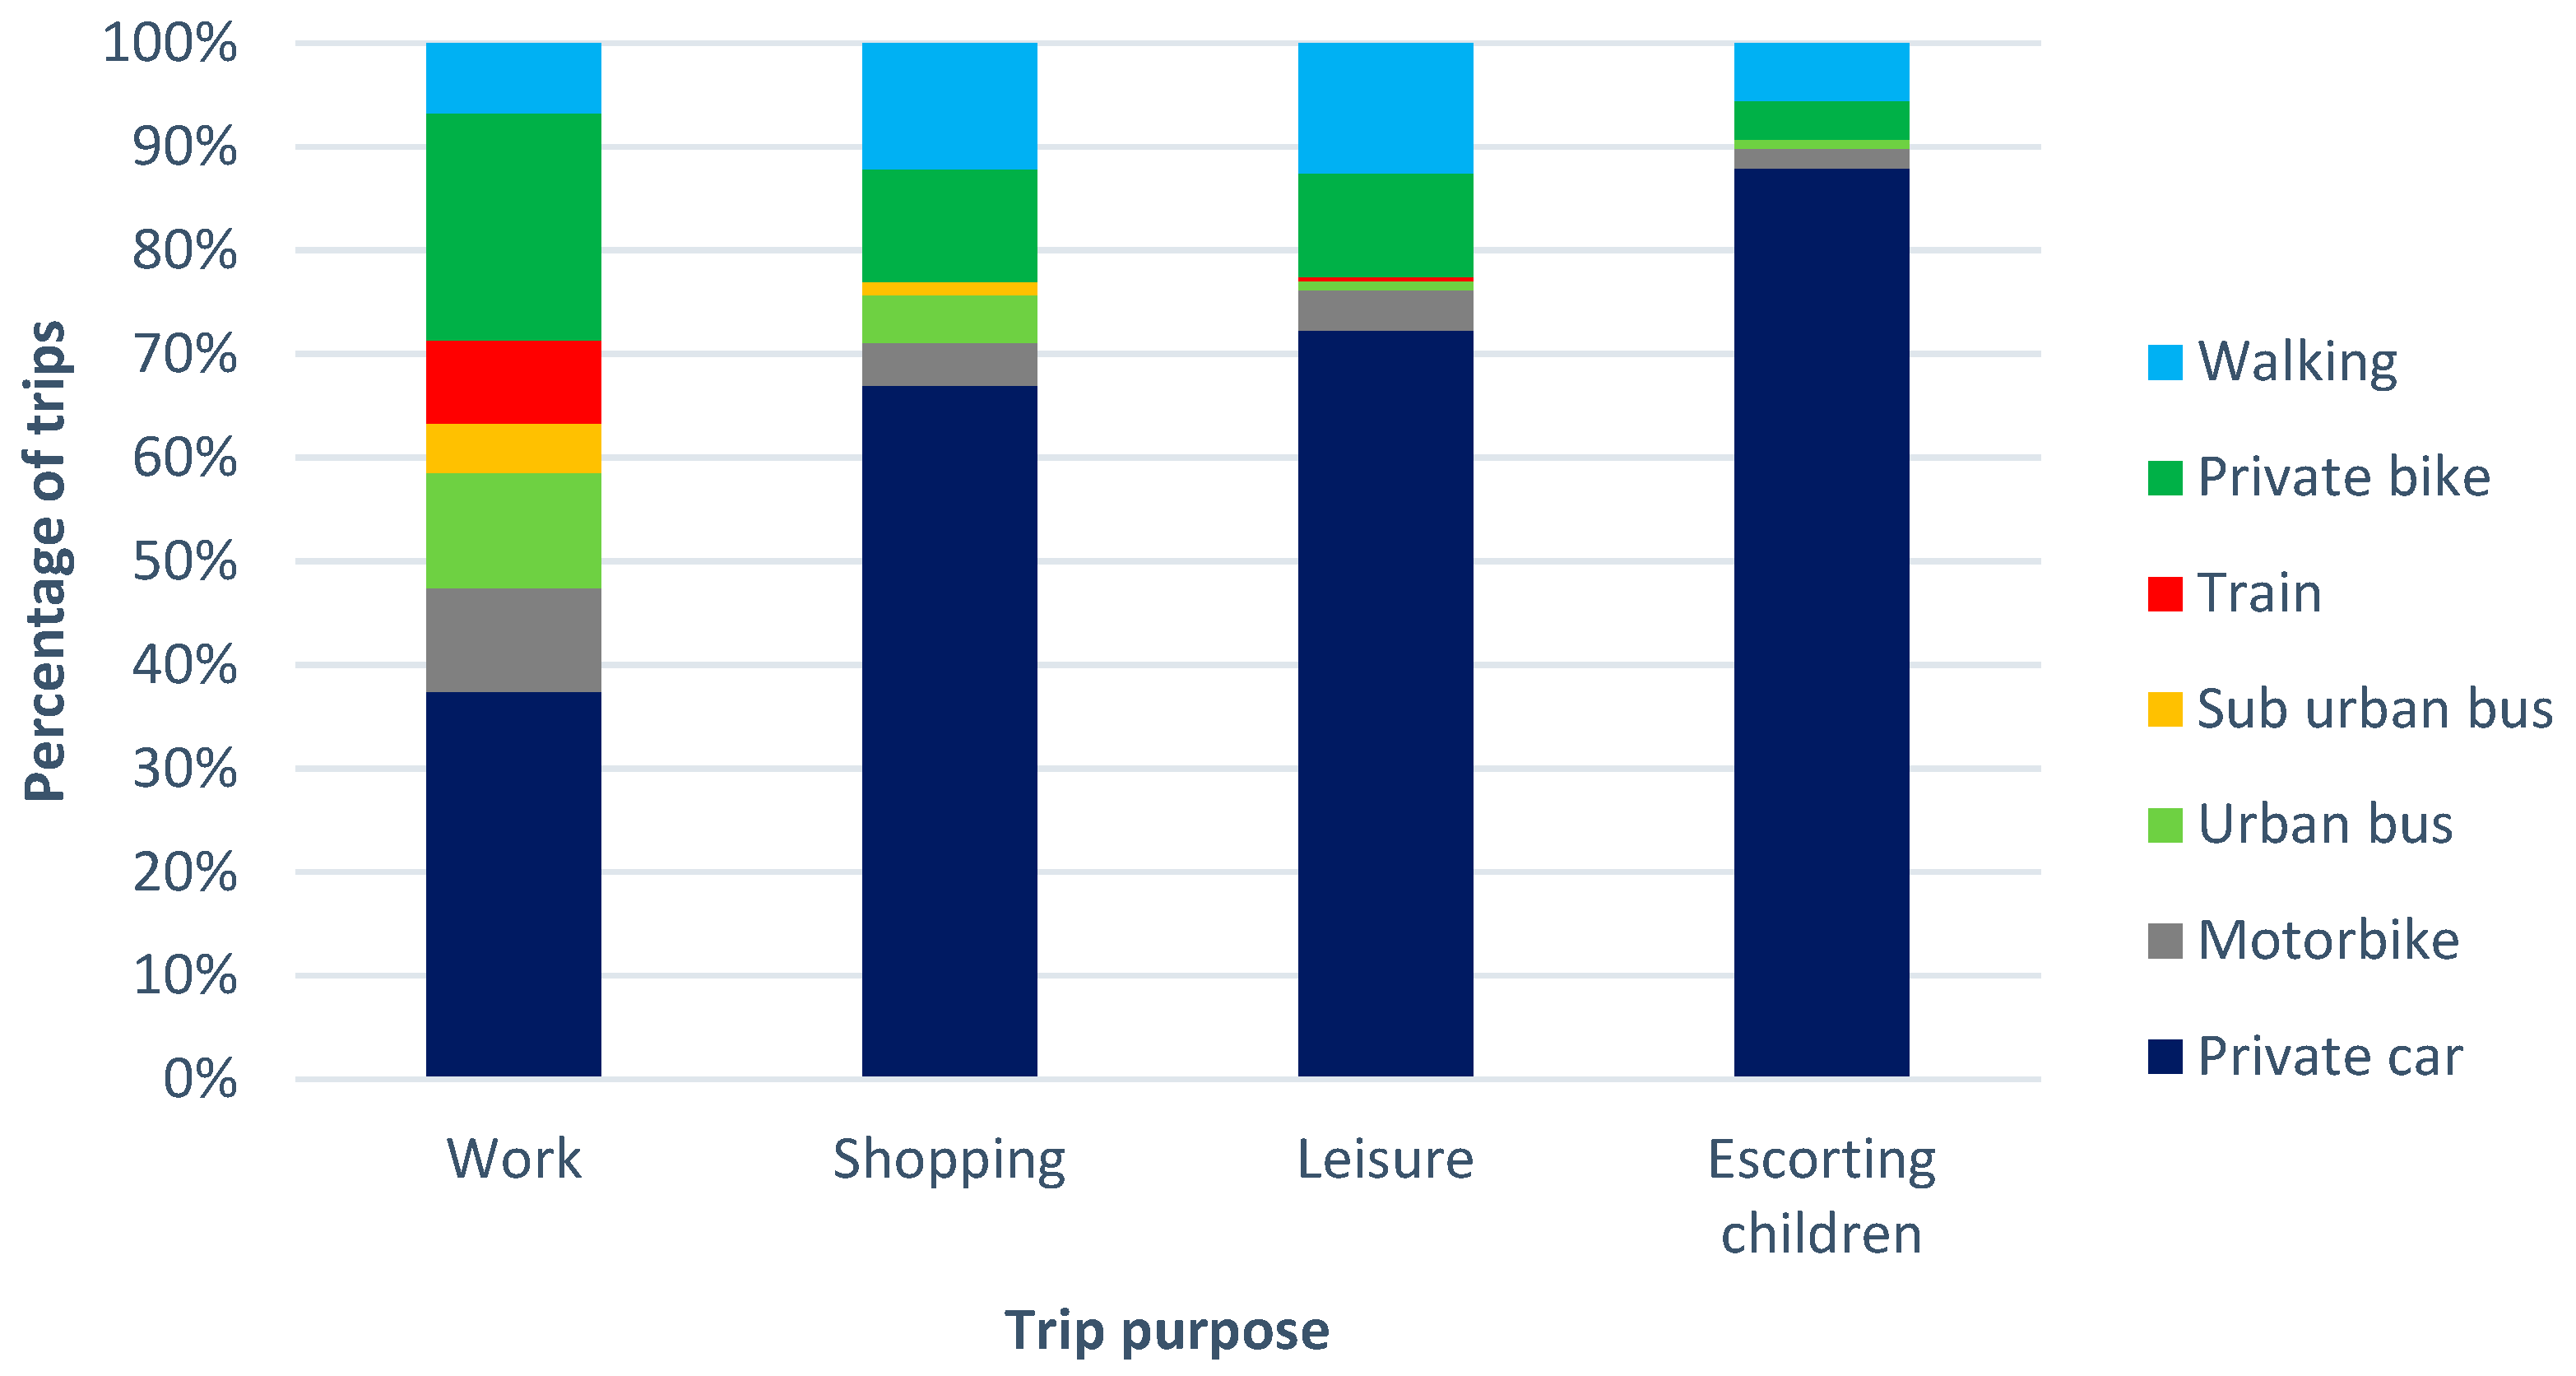
3.1. Descriptive Statistics of the Sample

The collected answers resulted in 255 complete interviews, which correspond to a sampling rate of about 16%. Considering a 95% confidence level, the sample size was found to be appropriate for a margin of error of 10% [38].
The representativeness of the sample could not be evaluated, since detailed information regarding the characteristics of the interviewed universe was not available. In addition, 66% of the respondents were women and 34% were men. The mean age was 52 years, with 16% of individuals aged from 35 to 44 years, 35% from 45 to 54 years, and 45% from 55 to 64 years. Further descriptive statistics can be found in [20]. Given the aim of this paper, a preliminary analysis of the registered attributes related to sustainable travel habits is reported hereinafter.
Figure 1 depicts the recorded distribution of trips performed for various trip purposes (work, shopping, leisure, and escorting children) and using different travel modes (private car, motorbike, urban and suburban bus, train, private bike, and walking). As expected, private car was adopted for all the considered trip purposes. In particular, due to its flexibility, it was widely used for escorting children, and it is the main travel means for nonsystematic trips (shopping and leisure purposes); moreover, 35% of commuting trips were performed by car. Furthermore, the highest modal share of public transport (urban bus, suburban bus, and train) was observed for work purposes (24%), and 6% of shopping trips were carried out by urban bus. The figure shows that a significant portion of trips were performed on active modes. For shopping and leisure purposes, the shares of private bike and walking were 10% and 12%, respectively. Nevertheless, it is worth noting that around 22% of commuting trips were performed on a private bike (more than 80% of the interviewees had at least two bikes in their households). This confirms the findings of previous studies in the same area, for example [39], highlighting that Padua is one of the Italian cities with the highest use of bikes.
As regards commuting trips, Figure 2 shows the distribution of the main travel modes adopted to reach the workplaces for different trip lengths. As expected, private bike was mostly used for trips shorter than 5 km. Private car trips were recorded for distances ranging from 2 to 50 km, with a peak of 10–20 km (60%). The modal share of public transport was quite variable, depending on the specific means and the related operating area: about 17% of trips shorter than 5 km were carried out on urban bus; the percentage of commuting trips on suburban bus was almost constant (around 10%) for trips longer than 10 km; more than 50% of trips longer than 20 km were performed by train, but its adoption increased with trip length (up to 80%).

3.2. Model Estimation

The results of the estimation of the final version of the MaaS adoption model are reported in Table 2. By observing the table, one can note that the coefficient of the panel effect σpanel is significant, indicating that the model can properly capture correlations among observations for the same individual [21]. As expected, the cost of the plan per unit distance decreases the likelihood of adopting MaaS. The coefficient of the constant is negative, highlighting that the respondents were not so willing to subscribe to the service.
The composition of the potential MaaS bundles was found to play an important role in the decision to use the service. The analysis of coefficients indicates that e-scooter sharing alone cannot increase the probability of adopting MaaS, nevertheless, an opposite effect might occur if e-scooters are proposed in combination with park-and-ride and urban bus. This highlights the effectiveness of the service as a last-mile solution. Similarly, the sampled commuters were found not to be willing to use MaaS with urban bus alone; on the other hand, it should be combined with car sharing or e-scooter sharing in order to foster MaaS diffusion. Furthermore, the results indicate that long-distance public transport (suburban bus or train) can increase the attractiveness of the service. Lastly, the inclusion of night buses reduces the likelihood to adopt MaaS; this is an expected outcome, given the age of respondents, who may not be inclined to perform activities during the night that could require travelling by bus.
The travel habits of the respondents could impact the adoption of MaaS. In particular, the willingness to join the service decreases for individuals who frequently use private bike and train. The former result could indicate that bikers are satisfied with their travel mode and, therefore, are not likely to switch to alternative means included in the MaaS bundle. The latter result could suggest that train users did not find any advantages in adopting the proposed packages for their trips. Moreover, those who usually commuted by suburban bus are more willing to adopt MaaS.

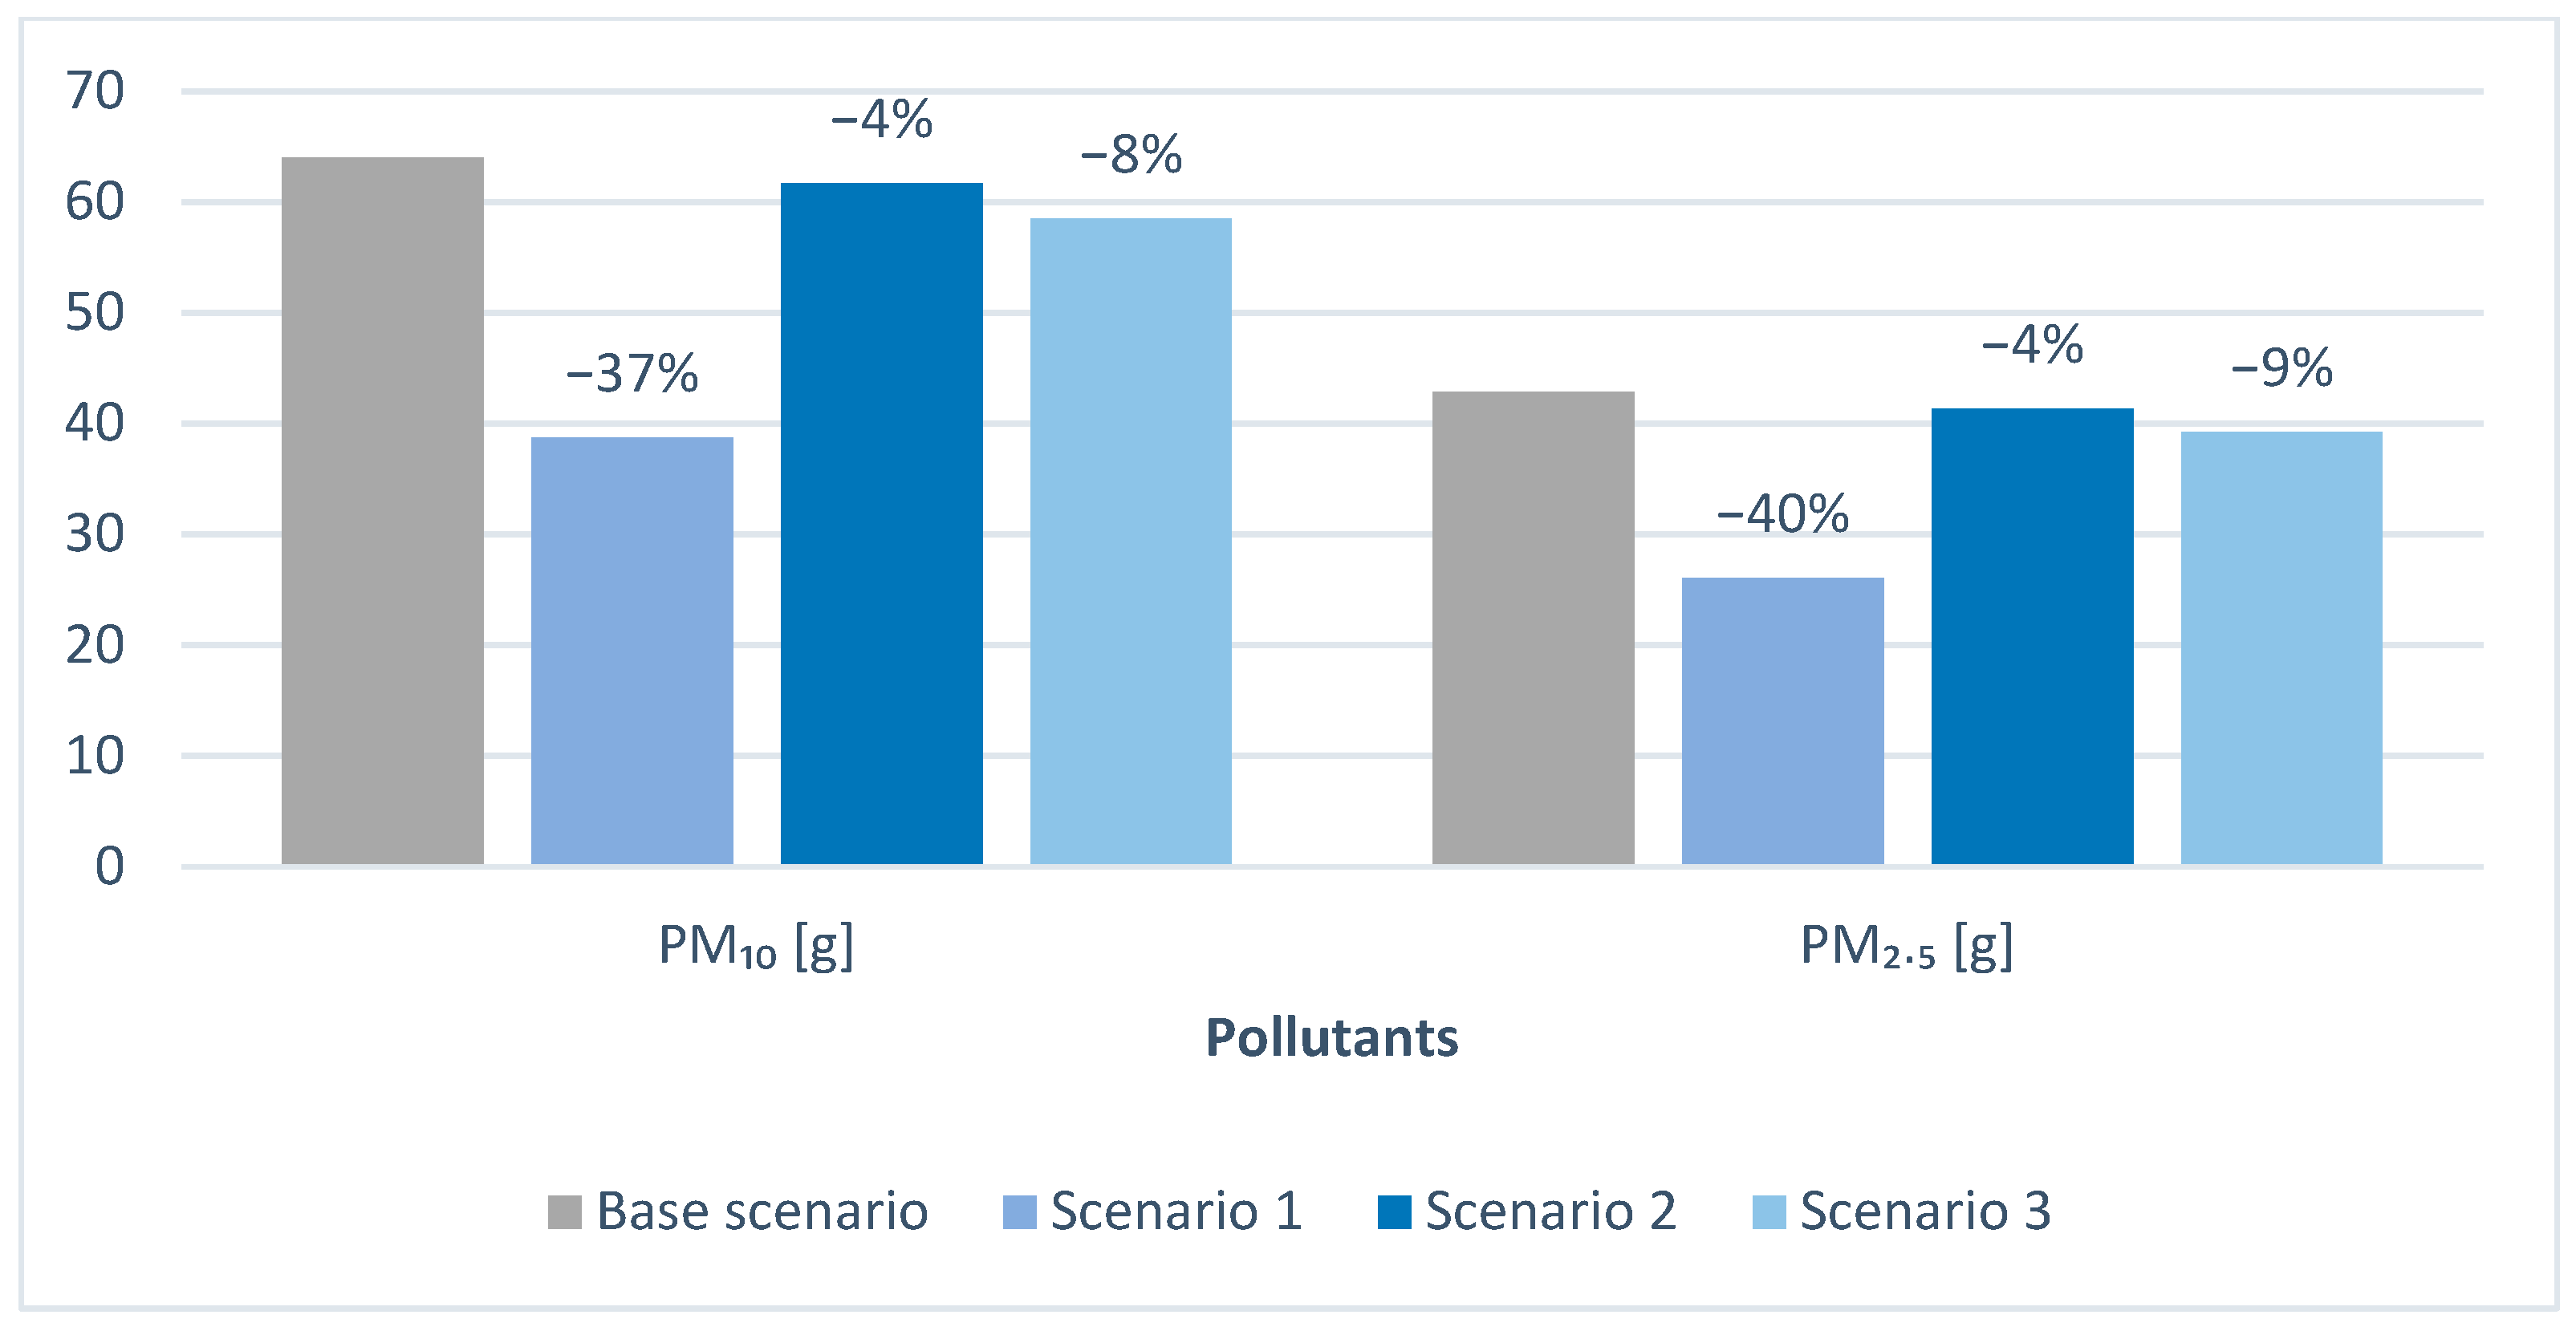
3.3. MaaS Adoption Scenarios

Table 3 reports the considered hypothetical future scenarios, which were generated by considering the realistic potential combination of services in the area. In addition, since the impacts of MaaS on the sustainability of trips depend on its adoption, the marginal utilities obtained from the final version of the calibrated model were analyzed [6]. In particular, different combinations of the variables related to MaaS bundle were tested, to maximize and minimize the value of the utility function of MaaS adoption. In this way, the following three scenarios were evaluated:
  • Scenario 1, in which the probability of MaaS adoption is maximized;
  • Scenario 2, in which the probability of MaaS adoption is minimized;
  • Scenario 3, which includes mobility services currently managed by the same operator in the city, thus representing the most feasible MaaS that could be implemented in the area.
These scenarios allowed us to assess the potential range of the contribution of MaaS on pollutant emissions reduction for commuting trips (Scenarios 1 and 2), and the impacts of the most likely MaaS that could operate in the city (Scenario 3).
The results of the model applied to the dataset of commuting trips performed by respondents in a typical working day are reported in Table 4 for all the considered scenarios. The table shows that the potential future market share of MaaS is highly dependent on bundle composition.
Figure 3 and Figure 4 show the estimated daily pollutant emissions generated by commuting trips for the Base scenario and the future ones; percentage variations from the current scenario (the Base scenario) are reported for the three considered MaaS scenarios (Scenarios 1–3). As expected, Scenario 1 exhibited the highest reduction in emissions compared to the Base scenario (37–41%), since, in this case, the MaaS bundle was designed so that the adoption of the service is maximized. Conversely, the lowest reduction was obtained for Scenario 2 (4%), which minimizes the service diffusion. These two scenarios represent an optimistic and a pessimistic perspective, respectively, regarding the use of MaaS for commuting trips.
Furthermore, compared to the Base scenario, percentage reductions of around 8–9% were observed for the scenario in which MaaS only integrates services currently managed by the same operator in the city (Scenario 3).

4. Discussion

The analysis of results of the estimated MaaS adoption model allowed us to understand the factors and the characteristics of the service that can affect the decision to join such a mobility solution to perform commuting trips. In particular, the outcomes clearly indicated that one of the potentialities of MaaS is the opportunity to provide multimodal mobility solutions to satisfy the travel needs of users. The observed results showed that individuals are more willing to subscribe if the service allows them to combine multiple modes, e.g., e-scooter sharing with public transport and park-and-ride or car sharing with urban bus. This finding confirms that the value added from MaaS, which could effectively ensure its diffusion, is the offer of multimodal door-to-door travel options [22]. In addition, the analysis of results showed that public transport can be considered as the backbone of MaaS solutions [1]. Specifically, the likelihood to join the service was found to increase if such a mode was included in the bundles. This indicates that individuals tend to adopt MaaS where public transport is within the offered plan, as found by previous authors [21]. For this reason, maintaining a high standard of public transport level of service is of paramount importance to ensure the wide adoption of MaaS [11]. With the aim to assigning a central role of public transit [7], policy makers and operators should provide a reliable and accessible service in their cities [11]. To achieve the same target, innovative mobility solutions, such as connected autonomous vehicles [2,3], could contribute to automatically prioritizing public transport means on the road. Furthermore, the results confirmed that e-scooter sharing could be an effective mobility option that can complement public transport as a last-mile solution [40], thus fostering its adoption within an MaaS ecosystem. The estimated model allowed us to investigate the travel modes that are less likely to be replaced by MaaS diffusion. Specifically, people traveling by train or bicycle were not willing to adopt the service. The latter finding can be considered as a positive element with respect to the ultimate goal of MaaS. In particular, many previous authors have pointed out that this service could induce a shift from green travel modes (public transport and active modes) to less sustainable solutions (considering the full life-cycle), such as car-based shared mobility options and e-scooter sharing. [4,13,16]. Since sustainable urban mobility is one of the societal goals of MaaS [7], these modal shifts should be avoided. From this perspective, the role of public authorities in this mobility ecosystem could be fundamental to raise the awareness of the societal effects of travel choices among citizens, thus prompting the diffusion of sustainable habits following a broad-spectrum vision of future mobility [11]. For the case study considered in this paper, this potential risk did not seem to occur, since people who frequently used bikes or walked to work were found to have a low willingness to adopt MaaS. Even if this result is site-specific, it suggests that a proper design of such sustainable mobility options is fundamental to guarantee that MaaS can be effectively introduced to provide environmental benefits for society.
The results from the model application highlighted that the future market share of MaaS, as an alternative to travel modes adopted to commute, is highly dependent on the configuration of the proposed bundles [6]. This shows that a proper design of the service, including an ex ante evaluation of its potential diffusion, is of utmost importance to ensure the effectiveness of MaaS in reaching the highest attractiveness, thus allowing the achievement of the promised environmental goals [1,24]. The investigated future scenarios where an MaaS ecosystem is introduced allowed us to quantify the potential extent of pollutant emissions savings for commuting trips. In particular, considering a pessimistic and optimistic perspective, the reduction in CO, CO2, NOx, PM10, and PM2.5 could range from 4 to 41%, compared to the current scenario. This interval is similar to that obtained by previous authors [6]. Moreover, it is worth noting that these estimations are only related to a single trip from home to work. However, as people usually carry out more than one journey in their workday, sometimes combining multiple trips with different purposes, MaaS could be used for the whole trip chain [13]. For this reason, a greater benefit is likely to be observed [13]. An additional scenario was evaluated, where the bundle only included transport services currently managed by the same operator in the city. However, in this case, the percentage reduction (8–9%) was closer to the value obtained for the pessimistic scenario. Although these results are site-specific, they highlight the importance of the integration of services from multiple operators within the same MaaS ecosystem, in order to increase its adoption. Nevertheless, the consequent integration of different business models represents one of the challenges that MaaS has to face [41,42]. As indicated by previous authors [43], such a system requires interaction among many actors with different and often conflicting logics. These potential issues highlight the importance of the role of public authorities, which should drive the MaaS ecosystem to effectively achieve the societal goals that it is expected to accomplish [5,11,44].
Even though the findings described in this paper are related to the considered case study, the developed analysis shows importance of the proper estimation of emission savings that the adoption of MaaS for commuting trips could generate. This is of paramount importance to evaluate to what extent such a system can contribute to paving the way toward sustainable mobility [16,22]. For this reason, the results may be useful to local authorities, who can find several recommendations on how an MaaS system can be designed to achieve environmental pollution reduction targets in urban areas.

5. Conclusions

In this paper, the reduction in pollutant emissions generated by commuting trips after the hypothetical diffusion of MaaS in a medium-sized city was estimated. The answers of a mobility survey administered to employees of the Municipality of Padua (Italy) were used to calibrate a model that forecasts the adoption of MaaS for working trips. The model was applied to the real working trips reported by the respondents. Future scenarios with different mobility services included in an MaaS ecosystem were considered. For each scenario, daily pollutant emissions from commuting trips were estimated and compared with the current situation.
The analysis of results from the model calibration phase pointed out useful considerations concerning MaaS’ potential adoption:
  • The opportunity to have multimodal mobility options that can provide door-to-door trips is a fundamental element to ensure a wide diffusion of MaaS;
  • Public transport is confirmed to be the backbone of such a system; therefore, efforts to guarantee a high level of service of public transit could be key elements to promote MaaS adoption;
  • The risk of shifting to less sustainable travel modes included in the bundle could not occur in the study area, since frequent bikers and those who commuted by train or walking are not willing to join the service.
Estimation of pollutant emissions for the considered scenarios after the introduction of MaaS allowed us to obtain the range of percentage reductions from the current scenario (4–41%). The analysis showed that MaaS adoption is highly dependent on the characteristics of the proposed bundles, thus highlighting the importance of a proper design of the service and an ex ante evaluation of emission savings.
A set of recommendations for policy makers and mobility operators can be derived from the findings of the presented work. First, MaaS systems should be designed so that users can enjoy a complete seamless travel experience. In particular, traditional transport modes, such as public transport means, should be combined with innovative micromobility solutions ensuring last-mile trips, such as e-scooter and bike sharing. Furthermore, this allows one to improve the accessibility of public transport, thus widening its catchment area. In addition, operators should maintain a high level of service of public transport to foster MaaS adoption, since it represents the key mobility options within a bundle. This target can be achieved through interventions toward reliability, flexibility, and accessibility, such as real-time information to travelers, on-demand public transit, and priority lanes in the streets. Lastly, policy makers should pay attention to the risk of a potential shift from public transport to less sustainable modes within an MaaS package. Moreover, the developed analysis can be considered as a preliminary evaluation framework for the environmental impacts of this service. However, public authorities should periodically monitor whether MaaS is achieving the societal goals for which it was introduced.
The implemented procedure focused on the estimation of pollutant emissions for commuting trips before and after MaaS adoption. However, additional effects include variations in land use, as a consequence of its interaction with the transport system, which is likely to be altered by the introduction of MaaS. Furthermore, congestion issues after potential shifts to car-oriented mobility solutions provided by the new service should be investigated. These impacts were not evaluated in the analysis due to the available information from the travel survey. Future steps of this research work can include (1) the investigation of multimodal scenarios, (2) the evaluation of MaaS adoption and related emission savings for a whole day, thus considering all travel purposes observed in a typical working day, and (3) the analysis of what travel mode within the chosen MaaS bundle could be effectively adopted to commute, allowing for the evaluation of the specific shifts from the previous mobility solution to a preferred mode in the package.

Author Contributions

Conceptualization, R.C., A.B. and F.O.; methodology, R.C.; software, R.C.; formal analysis, R.C.; data curation, R.C., A.B. and F.O.; writing—original draft preparation, R.C.; writing—review and editing, A.B., F.O. and M.G.; supervision, R.R. and M.G.; project administration, R.R.; funding acquisition, R.R. All authors have read and agreed to the published version of the manuscript.

Funding

This research received no external funding.

Institutional Review Board Statement

Not applicable.

Informed Consent Statement

Informed consent was obtained from all subjects involved in the study.

Data Availability Statement

The data presented in this study are available on request from the corresponding author.

Acknowledgments

This study was carried out within the MOST—Sustainable Mobility National Research Centre and received funding from the European Union Next-GenerationEU (PIANO NAZIONALE DI RIPRESA E RESILIENZA (PNRR)—MISSIONE 4 COMPONENTE 2, INVESTIMENTO 1.4—D.D. 1033 17 June 2022, CN00000023). This manuscript reflects only the authors’ views and opinions, neither the European Union nor the European Commission can be considered responsible for them. The authors thank the Municipality of Padua for providing support in survey administration and Andrea Colovini for his contribution in survey design.

Conflicts of Interest

The authors declare no conflict of interest.

References

  1. Caiati, V.; Rasouli, S.; Timmermans, H. Bundling, Pricing Schemes and Extra Features Preferences for Mobility as a Service: Sequential Portfolio Choice Experiment. Transp. Res. Part A Policy Pract. 2020, 131, 123–148. [Google Scholar] [CrossRef]
  2. Wu, J.; Qu, X. Intersection Control with Connected and Automated Vehicles: A Review. J. Intell. Connect. Veh. 2022, 5, 260–269. [Google Scholar] [CrossRef]
  3. Xu, L.; Jin, S.; Li, B.; Wu, J. Traffic Signal Coordination Control for Arterials with Dedicated CAV Lanes. J. Intell. Connect. Veh. 2023, 5, 72–87. [Google Scholar] [CrossRef]
  4. Alyavina, E.; Nikitas, A.; Njoya, E.T. Mobility as a Service (MaaS): A Thematic Map of Challenges and Opportunities. Res. Transp. Bus. Manag. 2022, 43, 100783. [Google Scholar] [CrossRef]
  5. Enoch, M.; Potter, S. MaaS (Mobility as a Service) Market Futures Explored. Transp. Policy 2023, 134, 31–40. [Google Scholar] [CrossRef]
  6. Labee, P.; Rasouli, S.; Liao, F. The Implications of Mobility as a Service for Urban Emissions. Transp. Res. Part D Transp. Environ. 2022, 102, 103128. [Google Scholar] [CrossRef]
  7. Hensher, D.A.; Mulley, C.; Nelson, J.D. Mobility as a Service (MaaS)—Going Somewhere or Nowhere? Transp. Policy 2021, 111, 153–156. [Google Scholar] [CrossRef]
  8. Ho, C.Q.; Mulley, C.; Hensher, D.A. Public Preferences for Mobility as a Service: Insights from Stated Preference Surveys. Transp. Res. Part A Policy Pract. 2020, 131, 70–90. [Google Scholar] [CrossRef]
  9. Kriswardhana, W.; Eszterg’ar-Kiss, D. Exploring the Aspects of MaaS Adoption Based on College Students’ Preferences. Transp. Policy 2023, 136, 113–125. [Google Scholar] [CrossRef]
  10. Matyas, M. Opportunities and Barriers to Multimodal Cities: Lessons Learned from in-Depth Interviews about Attitudes towards Mobility as a Service. Eur. Transp. Res. Rev. 2020, 12, 7. [Google Scholar] [CrossRef]
  11. Alyavina, E.; Nikitas, A.; Tchouamou Njoya, E. Mobility as a Service and Sustainable Travel Behaviour: A Thematic Analysis Study. Transp. Res. Part F Traffic Psychol. Behav. 2020, 73, 362–381. [Google Scholar] [CrossRef]
  12. Hensher, D.A.; Ho, C.Q.; Reck, D.J. Mobility as a Service and Private Car Use: Evidence from the Sydney MaaS Trial. Transp. Res. Part A Policy Pract. 2021, 145, 17–33. [Google Scholar] [CrossRef]
  13. Butler, L.; Yigitcanlar, T.; Paz, A. Barriers and Risks of Mobility-as-a-Service (MaaS) Adoption in Cities: A Systematic Review of the Literature. Cities 2021, 109, 103036. [Google Scholar] [CrossRef]
  14. Hensher, D.A.; Mulley, C.; Nelson, J.D. What Is an Ideal (Utopian) Mobility as a Service (MaaS) Framework? A Communication Note. Transp. Res. Part A Policy Pract. 2023, 172, 103675. [Google Scholar] [CrossRef]
  15. Hensher, D.A. The Reason MaaS Is Such a Challenge: A Note. Transp. Policy 2022, 129, 137–139. [Google Scholar] [CrossRef]
  16. Hensher, D.A.; Nelson, J.D.; Mulley, C. Electric Car Sharing as a Service (ECSaaS)—Acknowledging the Role of the Car in the Public Mobility Ecosystem and What It Might Mean for MaaS as EMaaS? Transp. Policy 2022, 116, 212–216. [Google Scholar] [CrossRef]
  17. Hensher, D.A.; Hietanen, S. Mobility as a Feature (MaaF): Rethinking the Focus of the Second Generation of Mobility as a Service (MaaS). Transp. Rev. 2023, 43, 325–329. [Google Scholar] [CrossRef]
  18. Kriswardhana, W.; Esztergár-Kiss, D. A Systematic Literature Review of Mobility as a Service: Examining the Socio-Technical Factors in MaaS Adoption and Bundling Packages. Travel Behav. Soc. 2023, 31, 232–243. [Google Scholar] [CrossRef]
  19. Baldassa, A.; Orsini, F.; Ceccato, R. Telework and MaaS Adoption in a Post Pandemic Scenario. Evidence from Municipal Employees of Padua, Italy. Case Stud. Transp. Policy 2023, 12, 101010. [Google Scholar] [CrossRef]
  20. Baldassa, A.; Ceccato, R.; Orsini, F.; Rossi, R.; Gastaldi, M. MaaS Bundling and Acceptance in the Pandemic Era: Evidence from Padua, Italy. J. Adv. Transp. 2022, 2022, 9833689. [Google Scholar] [CrossRef]
  21. Matyas, M.; Kamargianni, M. The Potential of Mobility as a Service Bundles as a Mobility Management Tool. Transportation 2019, 46, 1951–1968. [Google Scholar] [CrossRef]
  22. Ho, C.Q.; Hensher, D.A.; Reck, D.J. Drivers of Participant’s Choices of Monthly Mobility Bundles: Key Behavioural Findings from the Sydney Mobility as a Service (MaaS) Trial. Transp. Res. Part C Emerg. Technol. 2021, 124, 102932. [Google Scholar] [CrossRef]
  23. Franco, A.; Vitetta, A. Preference Model in the Context of Mobility as a Service: A Pilot Case Study. Sustainability 2023, 15, 4802. [Google Scholar] [CrossRef]
  24. van ’t Veer, R.; Annema, J.A.; Araghi, Y.; Homem de Almeida Correia, G.; van Wee, B. Mobility-as-a-Service (MaaS): A Latent Class Cluster Analysis to Identify Dutch Vehicle Owners’ Use Intention. Transp. Res. Part A Policy Pract. 2023, 169, 103608. [Google Scholar] [CrossRef]
  25. Sochor, J.; Karlsson, I.C.M.A.; Strömberg, H. Trying out Mobility as a Service: Experiences from a Field Trial and Implications for Understanding Demand. Transp. Res. Rec. 2016, 2542, 57–64. [Google Scholar] [CrossRef]
  26. Storme, T.; De Vos, J.; De Paepe, L.; Witlox, F. Limitations to the Car-Substitution Effect of MaaS. Findings from a Belgian Pilot Study. Transp. Res. Part A Policy Pract. 2020, 131, 196–205. [Google Scholar] [CrossRef]
  27. Comune di Padova. Annuario Statistico Comunale—Capitolo 2; Comune di Padova: Padova, Italy, 2021. [Google Scholar]
  28. Hess, S.; Rose, J.M.; Hensher, D.A. Asymmetric Preference Formation in Willingness to Pay Estimates in Discrete Choice Models. Transp. Res. E Logist. Transp. Rev. 2008, 44, 847–863. [Google Scholar] [CrossRef]
  29. Feneri, A.M.; Rasouli, S.; Timmermans, H.J.P. Modeling the Effect of Mobility-as-a-Service on Mode Choice Decisions. Transp. Lett. 2022, 14, 324–331. [Google Scholar] [CrossRef]
  30. Kim, S.; Choo, S.; Choi, S.; Lee, H. What Factors Affect Commuters’ Utility of Choosing Mobility as a Service? An Empirical Evidence from Seoul. Sustainability 2021, 13, 9324. [Google Scholar] [CrossRef]
  31. EMISIA COPERT—The Industry Standard Emission Calculator. Available online: https://www.emisia.com/utilities/copert/ (accessed on 20 April 2023).
  32. Ntziachristos, L.; Samaras, Z.; Kouridis, C.; Samaras, C.; Hassel, D.; Mellios, G.; Mccrae, I.; Hickman, J.; Zierock, H.; Keller, M.; et al. EMEP/EEA Air Pollutant Emission Inventory Guidebook 2019; Publications Office of the European Union: Luxembourg, 2019. [Google Scholar]
  33. Sobrino, N.; Arce, R. Understanding Per-Trip Commuting CO2 Emissions: A Case Study of the Technical University of Madrid. Transp. Res. D Transp. Environ. 2021, 96, 102895. [Google Scholar] [CrossRef]
  34. Carboni, A.; Orsini, F. Dry Ports and Related Environmental Benefits: A Case Study in Italy. Case Stud. Transp. Policy 2020, 8, 416–428. [Google Scholar] [CrossRef]
  35. Lejri, D.; Can, A.; Schiper, N.; Leclercq, L. Accounting for Traffic Speed Dynamics When Calculating COPERT and PHEM Pollutant Emissions at the Urban Scale. Transp. Res. D Transp. Environ. 2018, 63, 588–603. [Google Scholar] [CrossRef]
  36. Ceccato, R.; Baldassa, A.; Rossi, R.; Gastaldi, M. Potential Long-Term Effects of Covid-19 on Telecommuting and Environment: An Italian Case-Study. Transp. Res. D Transp. Environ. 2022, 109, 103401. [Google Scholar] [CrossRef] [PubMed]
  37. ACI Autoritratto Parco Veicolare Italiano. Available online: https://www.aci.it/laci/studi-e-ricerche/dati-e-statistiche/autoritratto.html (accessed on 20 April 2023).
  38. Hensher, D.A.; Rose, J.M.; Greene, W.H. Applied Choice Analysis: A Primer; Cambridge University Press: Cambridge, UK, 2005. [Google Scholar]
  39. Ceccato, R.; Rossi, R.; Gastaldi, M. Travel Demand Prediction during COVID-19 Pandemic: Educational and Working Trips at the University of Padova. Sustainability 2021, 13, 6596. [Google Scholar] [CrossRef]
  40. Baek, K.; Lee, H.; Chung, J.H.; Kim, J. Electric Scooter Sharing: How Do People Value It as a Last-Mile Transportation Mode? Transp. Res. D Transp. Environ. 2021, 90, 102642. [Google Scholar] [CrossRef]
  41. Polydoropoulou, A.; Pagoni, I.; Tsirimpa, A.; Roumboutsos, A.; Kamargianni, M.; Tsouros, I. Prototype Business Models for Mobility-as-a-Service. Transp. Res. Part A Policy Pract. 2020, 131, 149–162. [Google Scholar] [CrossRef]
  42. Krauss, K.; Moll, C.; Köhler, J.; Axhausen, K.W. Designing Mobility-as-a-Service Business Models Using Morphological Analysis. Res. Transp. Bus. Manag. 2022, 45, 100857. [Google Scholar] [CrossRef]
  43. Guyader, H.; Nansubuga, B.; Skill, K. Institutional Logics at Play in a Mobility-as-a-Service Ecosystem. Sustainability 2021, 13, 8285. [Google Scholar] [CrossRef]
  44. Pangbourne, K.; Mladenović, M.N.; Stead, D.; Milakis, D. Questioning Mobility as a Service: Unanticipated Implications for Society and Governance. Transp. Res. Part A Policy Pract. 2020, 131, 35–49. [Google Scholar] [CrossRef]
Figure 1. Percentage distribution of trip purposes and travel modes.
Sustainability 15 08690 g001
Figure 2. Modal share of commuting trips for different trip lengths.
Sustainability 15 08690 g002
Figure 3. Simulated CO, CO2, and NOx emissions per day for the Base scenario and the three future scenarios.
Sustainability 15 08690 g003
Figure 4. Simulated PM10 and PM2.5 emissions per day for the Base scenario and the three future scenarios.
Sustainability 15 08690 g004
Table 1. Description of explanatory variables included in the MaaS adoption model.
NameDescriptionLevel
Bike frequencyFrequency of private bike use (times/week)Individual
Bike sharingBike sharing service (unlimited) in the MaaS bundleMaaS
Car sharingCar sharing service (pay-as-you-go) in the MaaS bundleMaaS
Car sharing—hoursCar sharing service (5 h) in the MaaS bundleMaaS
E-scooter sharingE-scooter sharing service (unlimited) in the MaaS bundleMaaS
Leisure frequencyFrequency of leisure trips (times/week)Individual
Night busNight bus service in the MaaS bundleMaaS
Park-and-ridePark-and-ride service (unlimited) in the MaaS bundleMaaS
Past suburban busUse of suburban bus to commuteIndividual
Past walkingWalking to commuteIndividual
Plan cost per distance/incomeMonthly cost of the MaaS bundle (EUR) per unit distance of the trip divided by income (EUR 1000)MaaS/Individual
Suburban bus/trainSuburban bus/train public service (unlimited) in the MaaS bundleMaaS
Train frequencyFrequency of train use (times/week)Individual
Urban bus/tramUrban bus/tram public service (unlimited) in the MaaS bundleMaaS
Table 2. Estimation results of the MaaS adoption model.
NameCoeff.Std. Err.t-Valuep-Value
Constant−1.5800.904−1.740.081 †
σpanel3.4500.4847.13<0.001 ***
Bike frequency−0.4660.175−2.660.008 **
Bike sharing−0.6700.435−1.540.124
Car sharing−0.2010.452−0.450.656
Car sharing—hours−0.5360.538−1.000.319
E-scooter sharing−1.1900.479−2.480.013 *
Leisure frequency0.7320.2792.630.009 **
Night bus−0.0730.034−2.160.031 *
Park-and-ride−1.5100.634−2.380.017 *
Park-and-ride: Bike sharing1.3500.8881.520.130
Park-and-ride: E-scooter sharing1.5500.8881.750.081 †
Past suburban bus2.9300.4806.12<0.001 ***
Past walking−1.0600.627−1.690.092 †
Plan cost per distance/income−0.0780.041−1.920.055 †
Suburban bus/train2.9300.4806.12<0.001 ***
Train frequency−0.7290.254−2.870.004 **
Urban bus/tram−2.3700.962−2.460.014 *
Urban bus/tram: Bike sharing0.7490.6881.090.276
Urban bus/tram: Car sharing 1.5200.8301.830.067 †
Urban bus/tram: Car sharing hour−0.2601.290−0.200.840
Urban bus/tram: E-scooter sharing2.4601.0702.290.022 *
Statistics
N. of observation255 (1020)
N. of draws500
Null log likelihood−578.26
Final log likelihood−344.69
r20.40
Significance codes: *** p-value < 0.001; ** p-value < 0.01; * p-value < 0.05; † p-value < 0.10.
Table 3. Mobility services included in MaaS bundles for future scenarios.
Scenario 1Scenario 2Scenario 3
E-scooter sharingx
Bike sharingx
Park-and-ridexxx
Car sharingx x
Car sharing—5 h x
Suburban bus/trainx
Urban bus/tramxxx
Night bus x
Table 4. Share of MaaS and non-MaaS commuting trips for the three scenarios.
ScenarioShare of MaaS Trips (%)Share of Non-MaaS Trips (%)
Scenario 18713
Scenario 2496
Scenario 31288
Disclaimer/Publisher’s Note: The statements, opinions and data contained in all publications are solely those of the individual author(s) and contributor(s) and not of MDPI and/or the editor(s). MDPI and/or the editor(s) disclaim responsibility for any injury to people or property resulting from any ideas, methods, instructions or products referred to in the content.

