Article

Wave Power Trends over the Mediterranean Sea Based on Innovative Methods and 60-Year ERA5 Reanalysis

1
Department of Civil Engineering, Görükle Campus, Bursa Uludag University, 16059 Bursa, Turkey
2
Ayazaga Campus, Istanbul Technical University, 34469 Istanbul, Turkey
*
Author to whom correspondence should be addressed.
Sustainability 2023, 15(11), 8590; https://doi.org/10.3390/su15118590
Submission received: 10 April 2023 / Revised: 21 May 2023 / Accepted: 22 May 2023 / Published: 25 May 2023
(This article belongs to the Special Issue Sustainability of Wave Energy Resources in the Sea)

Abstract

:
The present study aims to evaluate long-term wave power (Pwave) trends over the Mediterranean Sea using innovative and classical trend analysis techniques, considering the annual and seasonal means. For this purpose, the data were selected for the ERA5 reanalysis with 0.5° × 0.5° spatial resolution and 1 h temporal resolution during 60 years between 1962 and 2021. Spatial assessment of the annual and seasonal trends was first performed using the innovative trend analysis (ITA) and Mann–Kendall (MK) test. To obtain more detailed information, innovative polygon trend analysis (IPTA), improved visualization of innovative trend analysis (IV-ITA), and star graph methods were applied to annual, seasonal, and monthly mean Pwave at 12 stations selected. The results allow us to identify an increasing trend above the 10% change rate with the innovative method and above the 95% confidence level with the Mann–Kendall test in mean wave power in the Levantine basin and the Libyan Sea at all timescales. The use of various innovative methods offered similar results in certain respects and complemented each other.

1. Introduction

The Mediterranean Sea is defined as a main hot-spot according to the results of the global climate change projection scenarios (Giorgi, 2006) [1]. As reported in the 6th Assessment Report of the Intergovernmental Panel on Climate Change (IPCC) (IPCC, 2022) [2], the temperatures over the Mediterranean basin increased approximately 20% faster than the global average. The Mediterranean Sea, connected to the Atlantic Ocean and one of the largest semienclosed seas, is strongly influenced by the local and global climate (IPCC, 2022) [2]. Thus, it is regarded as one of the world’s most susceptible to climate change’s effects (IPCC, 2013) [3]. Kaur et al. (2021) [4] highlighted that wave power is an important climate indicator that provides information about current renewable energy sources and variability. Therefore, to address the climate change challenge, using clean and renewable energy is a promising solution to reduce the released harmful greenhouse gases that contribute to climate change. For instance, wave energy is one of the promoted renewable energy sources. However, future climate change may also affect renewable energy resources and their exploitation. The optimal regions selected for exploiting wave energy resources are mainly those characterized by high wave energy potential (Iglesias & Carballo, 2010 [5]; Aristodemo & Algieri Ferraro, 2018 [6]).
Meanwhile, the projected change and statistical trends in wave climate reported by several researchers may negatively impact the current wave energy resources. At some locations of the globe, the wave energy resources present a significant negative trend of the annual wave energy resources (Bromirski et al., 2013 [7]; Bromirski & Cayan, 2015 [8]; Simonetti & Cappietti, 2023 [9]) and a negative change in the future projections (Zheng et al., 2019 [10]; Karunarathna et al., 2020 [11]; Pourali et al., 2023 [12]). The decrease in wave energy resources may considerably affect the sustainability and cost-effectiveness of the wave energy converter systems. Thus, a significantly increasing trend in the annual wave energy resources may be advantageous for some wave energy converters (WECs) to ensure sustainable development. At the same time, it can still increase the risk of instability and extreme events. In light of the energy crisis and environmental pollution, variability in wave power potential is also crucial when choosing a location for a wave farm (Shao et al., 2022) [13]. Thus, understanding long-term trends of wave climate parameters and wave power (ocean wave energy) is essential to provide necessary information for planning and designing future marine structures, protecting the coast from damage, and also for WECs implementation (Iglesias & Carballo, 2010 [5]; De Leo et al., 2020 [14]; Caloiero et al., 2022 [15]). It is expected that the likely change in wave energy resources would significantly impact the effectiveness of the planned or established wave energy conversion plants.
Recently, several researchers have conducted trend studies on wave climate parameters (Vanem & Walker, 2013 [16]; Anoop et al., 2015 [17]; Mao et al. (2016) [18]; Aydoğan & Ayat, 2018 [19]; Caloiero et al., 2019 [20]; De Leo et al., 2020, 2021 [14,21]; Islek et al., 2020 [22]; Amarouche & Akpınar, 2021 [23]; Amarouche et al., 2021 [24]; Akçay et al., 2022 [25]; Acar et al., 2023 [26]) and wave power (Reguero et al., 2019 [27]; Ahn & Neary, 2020 [28]; Divinsky & Kosyan, 2020 [29]; Caloiero & Aristodemo, 2021 [30]; Caloiero et al., 2022 [15]; Hall et al., 2022 [31]; Kamranzad et al., 2022 [32]) in different parts of the world. Mao et al. (2016) [18] conducted wave climate pattern analysis in Lake Michigan from 2002–2012 for multiple observed buoy stations ranging from deep to medium to shallow waters. Reguero et al. (2019) [27] reported that wave power has increased by 0.4% globally since 1948 and can be defined as a potential climate change indicator because global warming strengthens waves. However, an increasing trend case is not observed at all locations. According to Kamranzad et al. (2022) [32], the change in wave power is mainly related to the change in the swell climate globally. Therefore, they pointed out the significance of focusing on these long-term changes when choosing appropriate locations to install wave farms. However, it is noticed that in the closed seas, such as the Mediterranean, swell may be less dominant than windy seas (Barbariol et al., 2019) [33].
In previous studies, researchers generally used the classical Mann–Kendall test, Theil–Sen method, and linear regression analysis. Apart from classical methods, the innovative trend analysis (ITA) method, suggested by Şen (2012) [34], the innovative polygon trend analysis (IPTA), the improved visualization of ITA (IV-ITA), and star graph methods based on ITA have been the basis for several recent studies (Acar et al., 2022, 2023 [26,35]; Akçay et al., 2022) [25] and have provided greater clarity in the perception of long-term climatic trends. The innovative methods are open to the visual interpretation of the results, do not contain assumptions such as normal distribution and serial dependence, etc., and are easy to apply. Information on data subclasses (low and high categories) can be accessed directly with ITA as it can be expressed visually. Presently, few studies have used the ITA method to investigate the trend of the significant wave height (De Leo et al., 2020, 2021) [14,21], and there is no study applying the ITA methods for wave power trend assessment. Annual and seasonal trends for mean wave power over the Mediterranean Sea based on 60-year (1962–2021) ERA5 reanalysis with 0.5° × 0.5° spatial resolution and 1 h temporal resolution were evaluated using the innovative trend analysis methods and Mann–Kendall test during the present study. The change rates calculated according to ITA were mapped for annual and seasonal scales. Furthermore, a detailed evaluation based on graphical representations of innovative methods was performed at representative stations selected in regions with a significant trend. IV-ITA and ITA graphs on an annual scale, seasonal IPTA, and monthly star graphs were considered in the detailed analysis.

2. Data Used

The data needed to compute wave power trends over the Mediterranean Sea (Figure 1) were obtained from the ERA5 reanalysis, a fifth-generation atmospheric reanalysis product. It has been produced by the European Center for Medium-Range Weather Forecasts (ECMWF) globally from 1959 to the present. It is based on a hybrid incremental 4D-Var data assimilation system (Bonavita et al., 2016) [36]. ERA5 is also produced using ensemble data assimilation, enabling the assessment of reanalysis of product uncertainties (Hersbach et al., 2018) [37]. The data provided for ocean waves in the ERA5 reanalysis have a spatial resolution of 0.5° × 0.5° and a temporal resolution of 1 h. The necessary parameters for calculating wave power (significant wave height H s and peak period T p ) were downloaded from Copernicus Climate Change Service (C3S) Climate Date Store (https://cds.climate.copernicus.eu/; last accessed in 10 September 2022) during 60 years from 1962 to 2021.
The ERA5 wave reanalysis was recently used by several researchers (Barbariol et al., 2021 [38]; Benetazzo et al., 2022 [39]; Karathanasi et al., 2022 [40]; Kozyrakis et al., 2023 [41]) for the evaluation of the offshore wave climate in the Mediterranean Sea. Thus, validation of ERA5 wave data for the Mediterranean region was performed by Kardakaris et al. (2021) [42] against seven wave buoys measurements in the Aegean Sea. Despite the complex morphology of the Aegean Sea, the correlation obtained for significant wave height data from ERA5 was >0.95 with a bias of 0.03 m. The correlation for the energy period from ERA5 was also >0.85. A good agreement between the in situ measurement data of Greek and Italian buoys and the ERA5 reanalysis dataset was found for the Eastern Mediterranean by Karathanasi et al. (2022) [40], and the correlation for significant wave height (peak period) was >0.95 (>0.80) with a bias of 0.027 m (0.239 s). Moreover, Abu Zed et al. (2022) [43] stated that ERA5 is more suitable in the Southeast Mediterranean Sea. In addition, Barbariol et al. (2021) [38] confirmed that the ERA5 dataset, verified against satellite altimetry, currently represents the latest state of long-term atmospheric reanalysis in the Mediterranean Sea and can be used for wind wave hindcast.

3. Methodology

In the present study, we first applied ITA and Mann–Kendall test to determine the annual and seasonal trends in wave power and their significant level over the past 60 years. Secondly, the locations characterized by a significant increase or decrease and no trend based on both test results were subjected to a more detailed trend analysis by applying the innovative polygon trend analysis (IPTA) proposed by Şen et al. (2019) [44]. Detailed information about selected locations can be found in Table 1. The methods used for trend analysis are described in the following sections.

3.1. Wave Power Computations

Wave power ( P w a v e ) over the Mediterranean Sea was calculated with a 1 h resolution H s and T p data from the ERA5 reanalysis. It is computed by the following equation (Karimirad, 2014) [45]:
P w a v e = ρ · g 2 64 · π · T e · H s 2
where ρ is the seawater density (1025 kg/m3),   g is the gravity acceleration (9.81 m/s2), H s is the significant wave height, and T e is the energy period that is accepted as T e 0.9 T p (Amrutha & Sanil Kumar, 2016) [46]. A wave power dataset with a 1 h resolution and 60 years is obtained using Equation (1). Then, the hourly wave power data are reduced to annual and seasonal mean wave power data for trend analysis.

3.2. Mann–Kendall Test for Trend Analysis

One of the methods used to assess the long-term variation of wave power is the nonparametric Mann–Kendall test (Mann, 1945 [47]; Kendall, 1975 [48]), used frequently by researchers to determine the significance of the trend. This method, which does not require normality in the data distribution, depends on the Z value calculated based on the Mann–Kendall test statistic (S), in which the trend is increasing (Z > 0), decreasing (Z < 0), or there is no trend (Z = 0). The calculated Z value is compared with standard normal distribution with significance levels. If the absolute calculated Z value exceeds the standard Z value, the null hypothesis (H0) is rejected, and the trend is statistically significant. Otherwise, H0 is accepted, and there is no significant trend. In this study, the confidence (significance) level was considered 50% to 99.9% (α = 0.5 to α = 0.001). At confidence levels below 50%, it is considered that there is no significant trend. It was also examined up to the 50% level to see the change in lower confidence levels.

3.3. Innovative Trend Analysis Methods

Innovative trend analysis is used to determine annual and seasonal mean wave power trends. The innovative approach proposed by Şen (2012) [34] does not depend on assumptions such as normal distribution, short data length, or serial dependence. In this methodology, the time series is divided into two equal parts, and each part is sorted in ascending order as {s1} and {s2}. The scatter plot is drawn with the first ({s1}) and second ({s2}) half on the x-axis and the y-axis, respectively. By adding the 1:1 (45°) line, it is determined that if it is above (below) the 1:1 line, it indicates an increasing (decreasing) trend, and if the data are very close to or just above the 1:1 line, there is no trend. With this method, it is possible to divide the time series into different subclasses, such as low, medium, and high. It is also possible to calculate the trend change rate with the equation ( 100 · | s 2 ¯ s 1 ¯ | s 2 ¯ ) (Şen, 2020) [49], where s 1 ¯ and s 2 ¯ are the first and second half mean, respectively. If s 1 ¯ < s 2 ¯   ( s 1 ¯ > s 2 ¯ ) , the trend is increasing (decreasing). If the calculated value is below ±5%, it is considered that there is no significant trend in the given time series (Şen, 2020) [49].
The ITA, which emerged in the last decade, has been frequently used by researchers, and new methods have also been developed based on this method. Innovative polygon trend analysis (IPTA), proposed by Şen et al. (2019) [44], investigates trend probabilities and behaviors in time series on many timescales such as seasonal, monthly, and daily. In the IPTA method, the time series is divided into two equal parts, as in ITA, and the basic statistics for each month/season/day are calculated for both parts. In the scatter graph, the values are marked so that the first (second) part is on the horizontal (vertical) axis. The star graph related to the IPTA method, recommended by Şen (2021) [50], allows us to see the variation of the variables by showing the temporal duration, the slope of the trend between two consecutive months, and the distances to the consecutive months. In the improved visualization of ITA (IV-ITA) method proposed by Güçlü (2020) [51], the data can be statistically categorized as low values and high values by applying the Pettitt change point test to the differences of the time series that are divided into two halves and ranked in ascending order. Detailed information about the ITA, IPTA, IPTA with star graph, and IV-ITA methods can be found in Acar et al. (2022, 2023) [26,35] and Akçay et al. (2022) [25].
Given the concept of this method, which is based on a graphical approach, it is not practical to apply this type of analysis at the spatial level. This analysis is therefore applied to the selected reference hot-spot locations, which are characterized by a significant trend according to the results of the ITA and Mann–Kendall tests. Using these methods, we can determine both the transitions in certain time intervals (monthly and seasonal) and their changes, as well as the behavior of maximum and minimum values in the time series. In some cases, while there is no trend in the time series, opposite trends can be seen in the low and high categories.

4. Results and Discussion

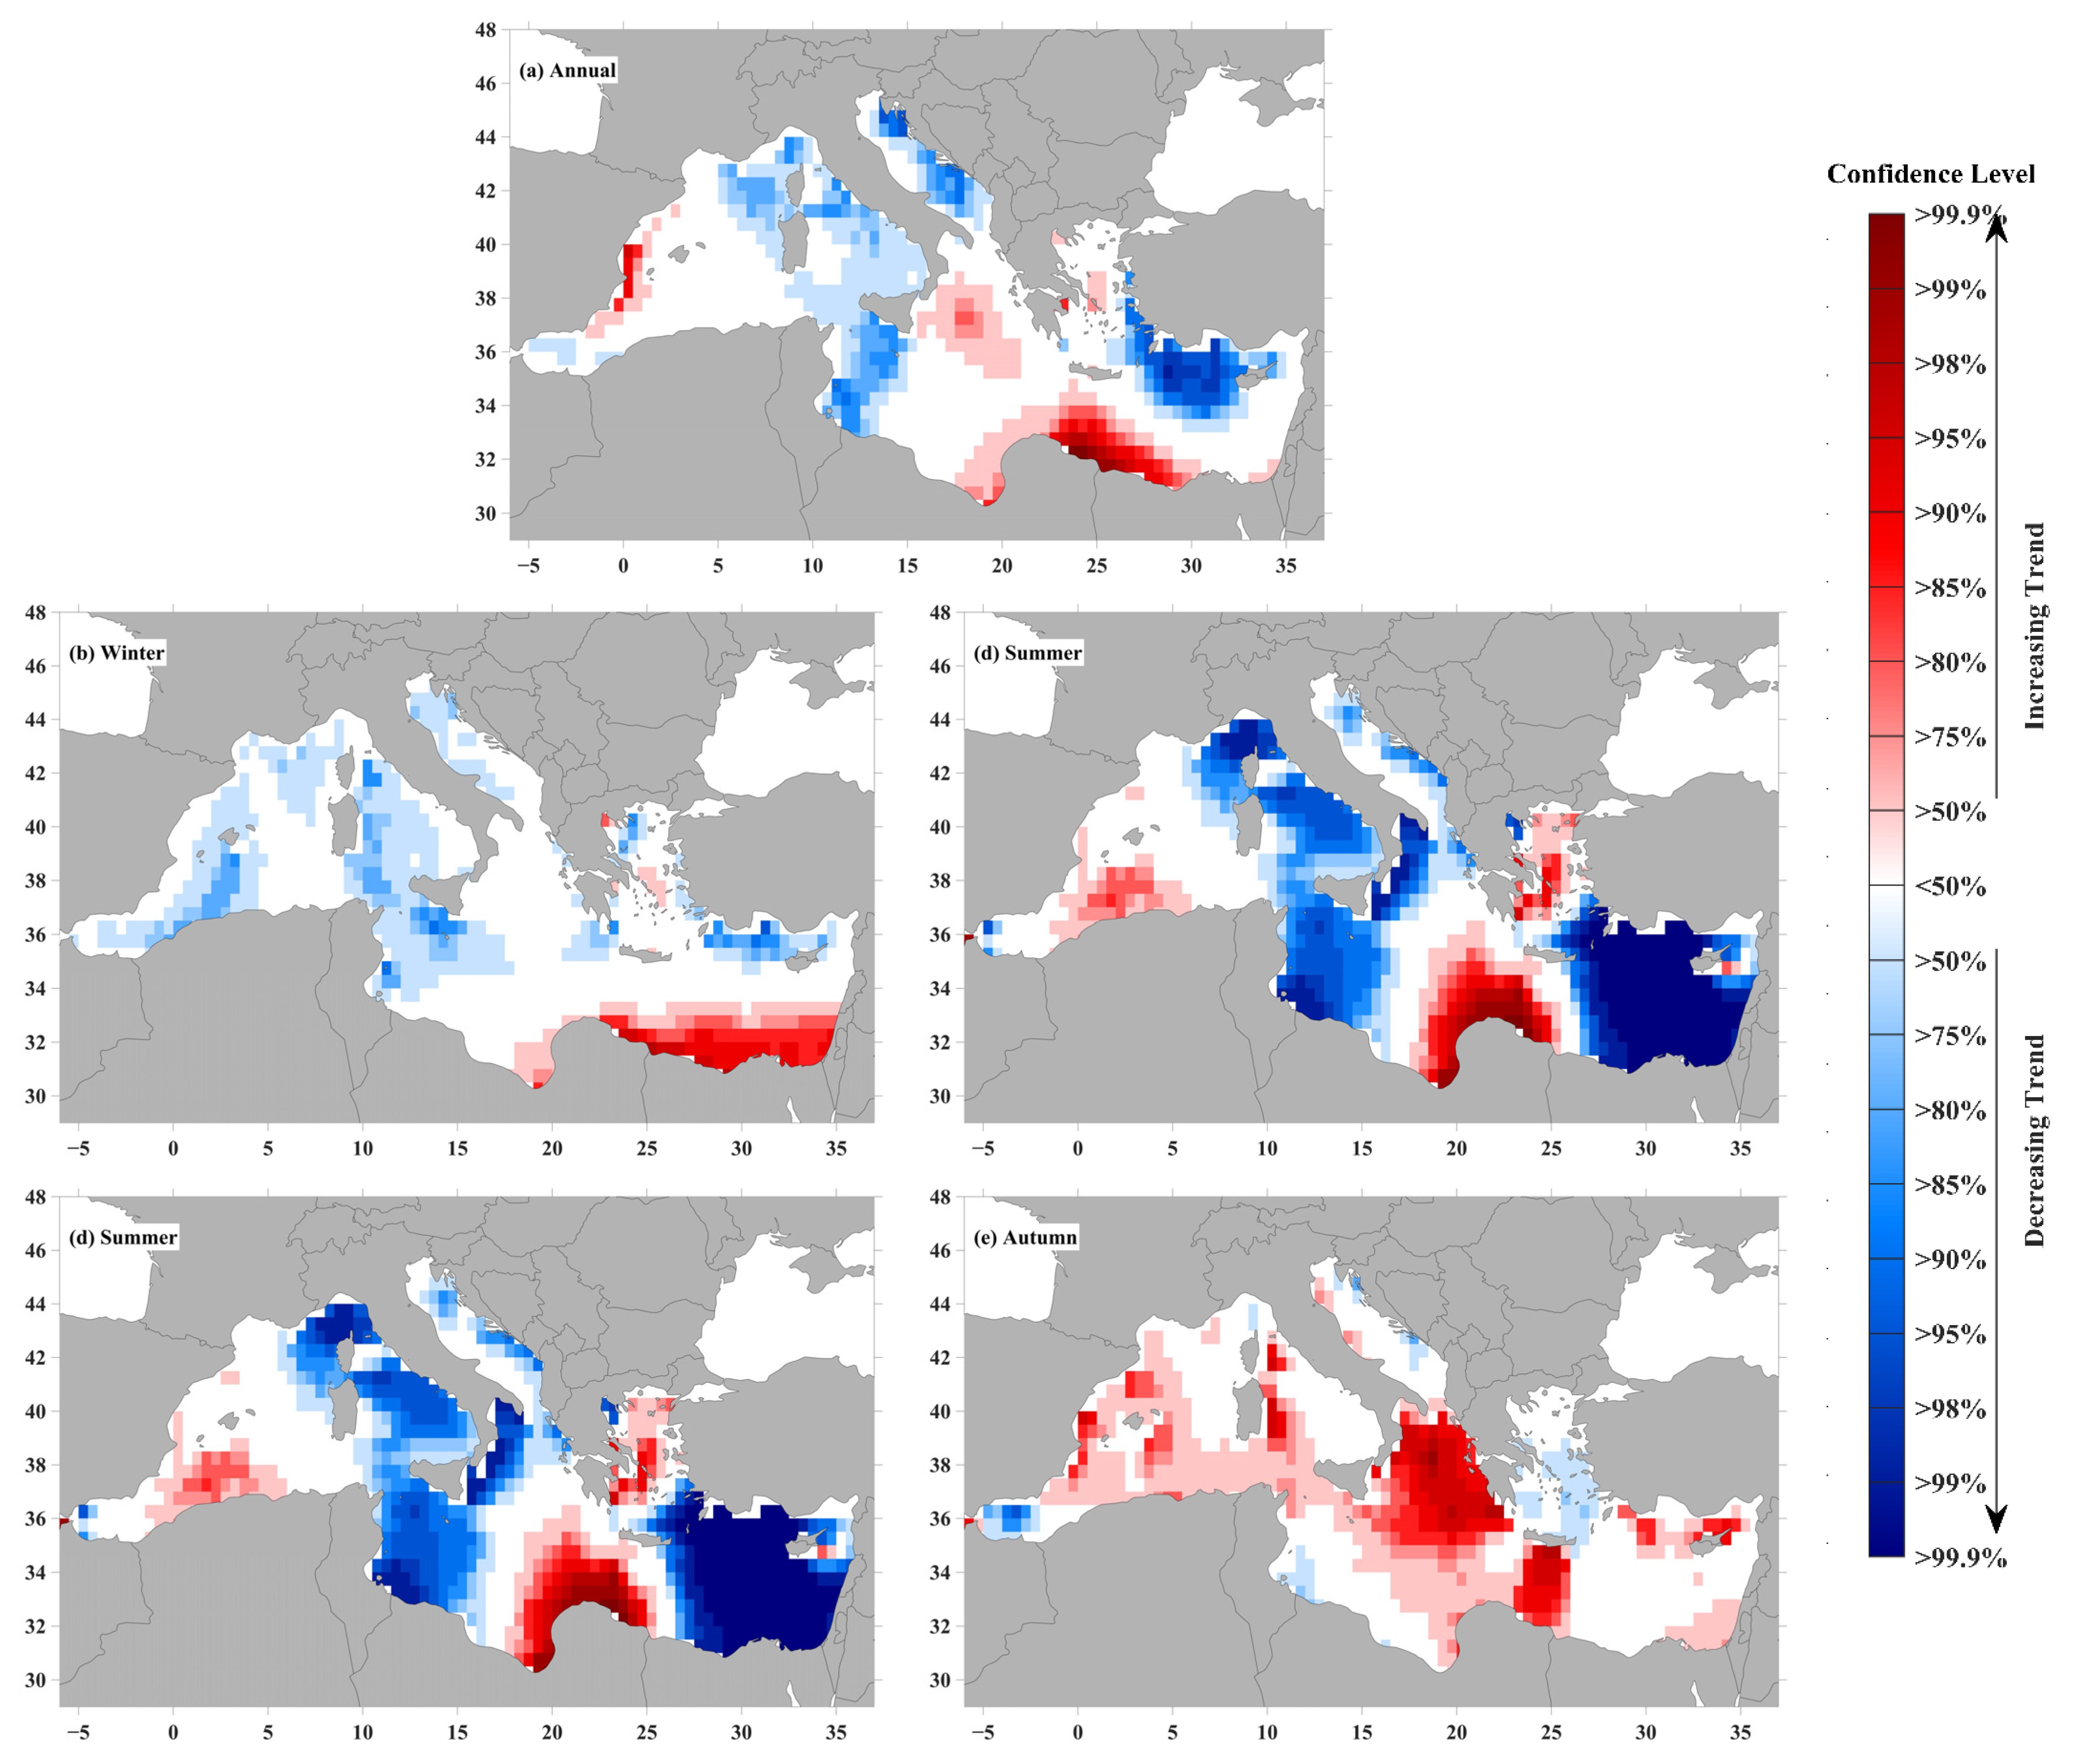
4.1. Spatial Assessment of the Annual and Seasonal Trends

The maps containing the trend change rates determined by the ITA of the annual and seasonal mean Pwave over the Mediterranean Sea are presented in Figure 2, while the MK test results are given at different confidence levels (CL) in Figure 3. Since the graphical representation of spatial-scale data according to ITA would be quite challenging, a detailed examination was made using different innovative methods for 12 representative stations. Annual and seasonal ITA change rates for selected stations are presented in Table 2, and MK-Z values are presented in Table 3.
According to ITA, it is noteworthy that the change rate did not generally exceed ±15% in all periods. There is usually a 5% increase in annual mean Pwave in the Balearic, Ionian, Aegean, and Libyan Seas, as seen in Figure 2a. The change in the remaining regions is decreasing and does not exceed −7.5%.
In the winter season, there is a generally decreasing trend in mean Pwave, with the change rate remaining in the band between 2.5% and 10%. At the same time, it tends to increase in the Libyan and Aegean Seas (Figure 2b). In spring, there is an increasing trend not exceeding 10% in the western Mediterranean Sea and 7.5% in the Aegean, Libyan, and Ionian Seas (Figure 2c). The trend patterns of the summer (Figure 2d) and the spring seasons are quite similar. However, the increasing trend observed in the spring was realized in a decreasing direction in the summer months in the Ionian and Tyrrhenian Seas. It was also noted that the positive change rate was over 10%. In autumn, the mean Pwave tends to increase with a 10% change rate in almost the entire Mediterranean Sea (Figure 2e). In addition, the Aegean and Alboran Seas and the Gulf of Gabes have a decreasing trend of 5%.
MK trend results for annual mean Pwave showed an increasing trend in the Libyan Sea (95% CL) and Balearic Sea (90% CL) (Figure 3a). A decreasing trend was also detected in the Adriatic, Tyrrhenian, and Ligurian Seas and in the area between Tunisia and Sicily, which does not exceed 80% CL. Seasonal MK test results are presented in Figure 3b–e. It is detected that the confidence level is generally below 50%, according to the MK test. The increasing trend above the 90% confidence level in the Libyan Sea in winter, the Balearic and Libyan Seas in spring, and the Tyrrhenian Sea in autumn are noteworthy. It is interesting that the decreasing trend, which is dominant, especially in the eastern and central Mediterranean Sea, during the summer season, CL is up to 99.9%.
The variation in wind and waves in the Mediterranean Sea is linked to several climate patterns. Nissen et al., (2010) [52] linked the cyclonic activity causing wind storm in the Mediterranean Sea to the North Atlantic Oscillation (NAO) and the East Atlantic/West Russia EA/WR patterns. Thus, other climate models can also be linked to the Mediterranean wave regime, such as the Scandinavian model (SCA) and the East Atlantic model (EA), according to Lionello & Galati, (2008) [53]. It is thought that the wave power in the Mediterranean Sea is affected by the Etesian winds, which affect the Levantine Basin by blowing strongly, especially in summer, Mistral blowing from the north/northwest direction, which affects the Balearic, Ligurian, and Tyrrhenian Seas and blowing stronger and colder, especially in winter, Libeccio and Sirocco winds blowing over the Alboran Sea to the Levantine, Tyrrhenian, and Ionian seas, and Bora blowing towards the northwest over the Adriatic Sea (Barbariol et al., 2021) [38]. The observed increasing and decreasing trend(s) in the Mediterranean sub-basins depend on the change in wind regime and the variability in the linked climate patterns. An assessment of the teleconnection between the climates patterns and the wave energy variation in the different Mediterranean Sea sub-basins may allow us to understand the reason behind the opposing trend direction observed in different regions of the Mediterranean Sea.
Contrary to our findings, Caloiero et al. (2022) [15] stated that the annual and seasonal mean Pwave trends are increasing over almost the entire Mediterranean Sea based on MK and Theil–Sen tests. They also emphasized that annual trends of mean Pwave were significant and positive in approximately 80% of the study area. However, with the MK test, they accepted the CL as 90%, and it was determined that the MK findings of the present study were on an annual basis just in the Libyan, Adriatic, Balearic, and Levantine Seas in terms of CL, but differed in terms of trend type. This striking difference is because both studies’ dataset, period, spatial, and temporal resolution parameters differ. They used the ERA-Interim reanalysis dataset with a spatial resolution of 0.75° × 0.75° and a temporal resolution of 6 h for 40 years (1979–2018). Caloiero et al. (2021) [30] found that the annual and seasonal mean Pwave were significant at almost all points and were under the effect of an increasing trend not exceeding 0.4 kW/m/10 years according to the Theil–Sen method for the 1979–2018 period in the central Mediterranean region. However, these results were also inconsistent with the current study. It can only be said that a result compatible with the increasing trend determined by the ITA was obtained in the autumn (Figure 2e); however, this study diverges from Mann–Kendall test results, as trends often occur at 50–75% CLs. Since the datasets used in both studies mentioned above differ in time intervals, results that are quite inconsistent with the current study, it will be useful to make the necessary analyses by dividing the long time interval investigated into certain periods.
While values above 5% are considered significant in the ITA approach, researchers usually consider the 95% CL significant for MK. There are significant trends according to ITA in all selected stations (Table 2). However, the MK test’s CL is mostly below 95% (Table 3). Considering the type of trend, if there is a decreasing (increasing) trend according to the MK test, a decreasing (increasing) trend was also detected with ITA. In addition, the change rate was generally above 5% in regions with high confidence levels.

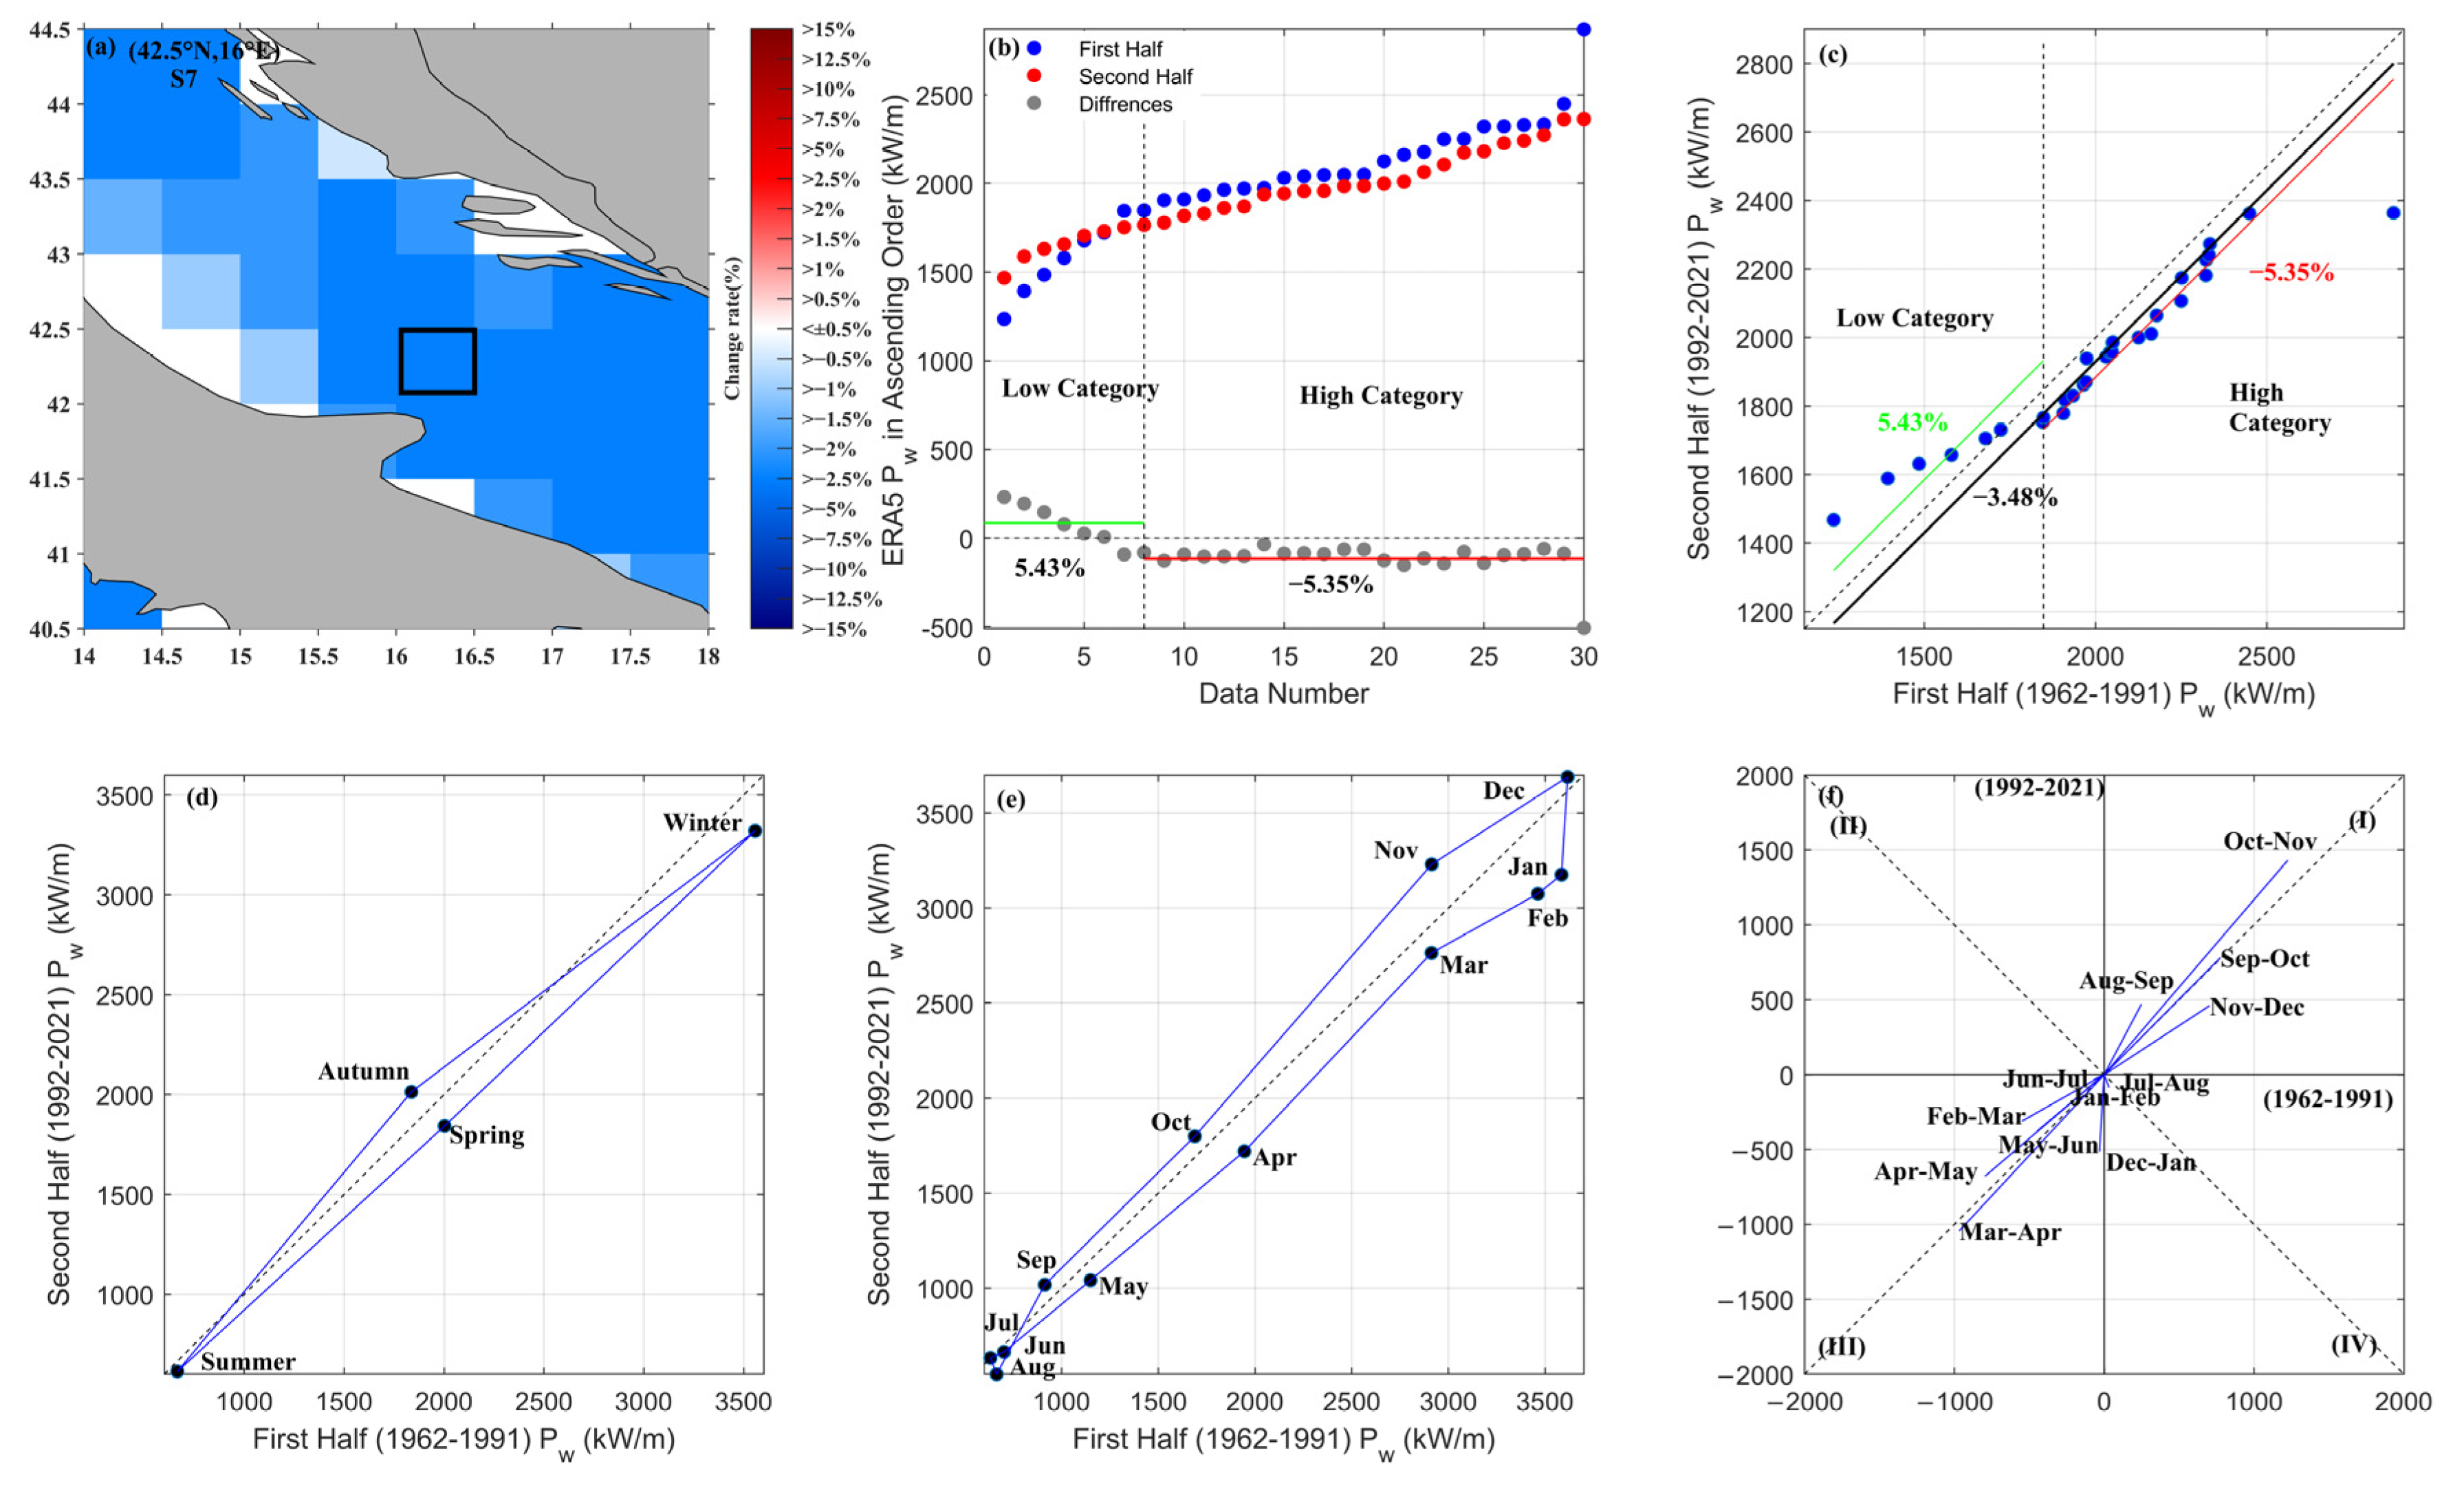
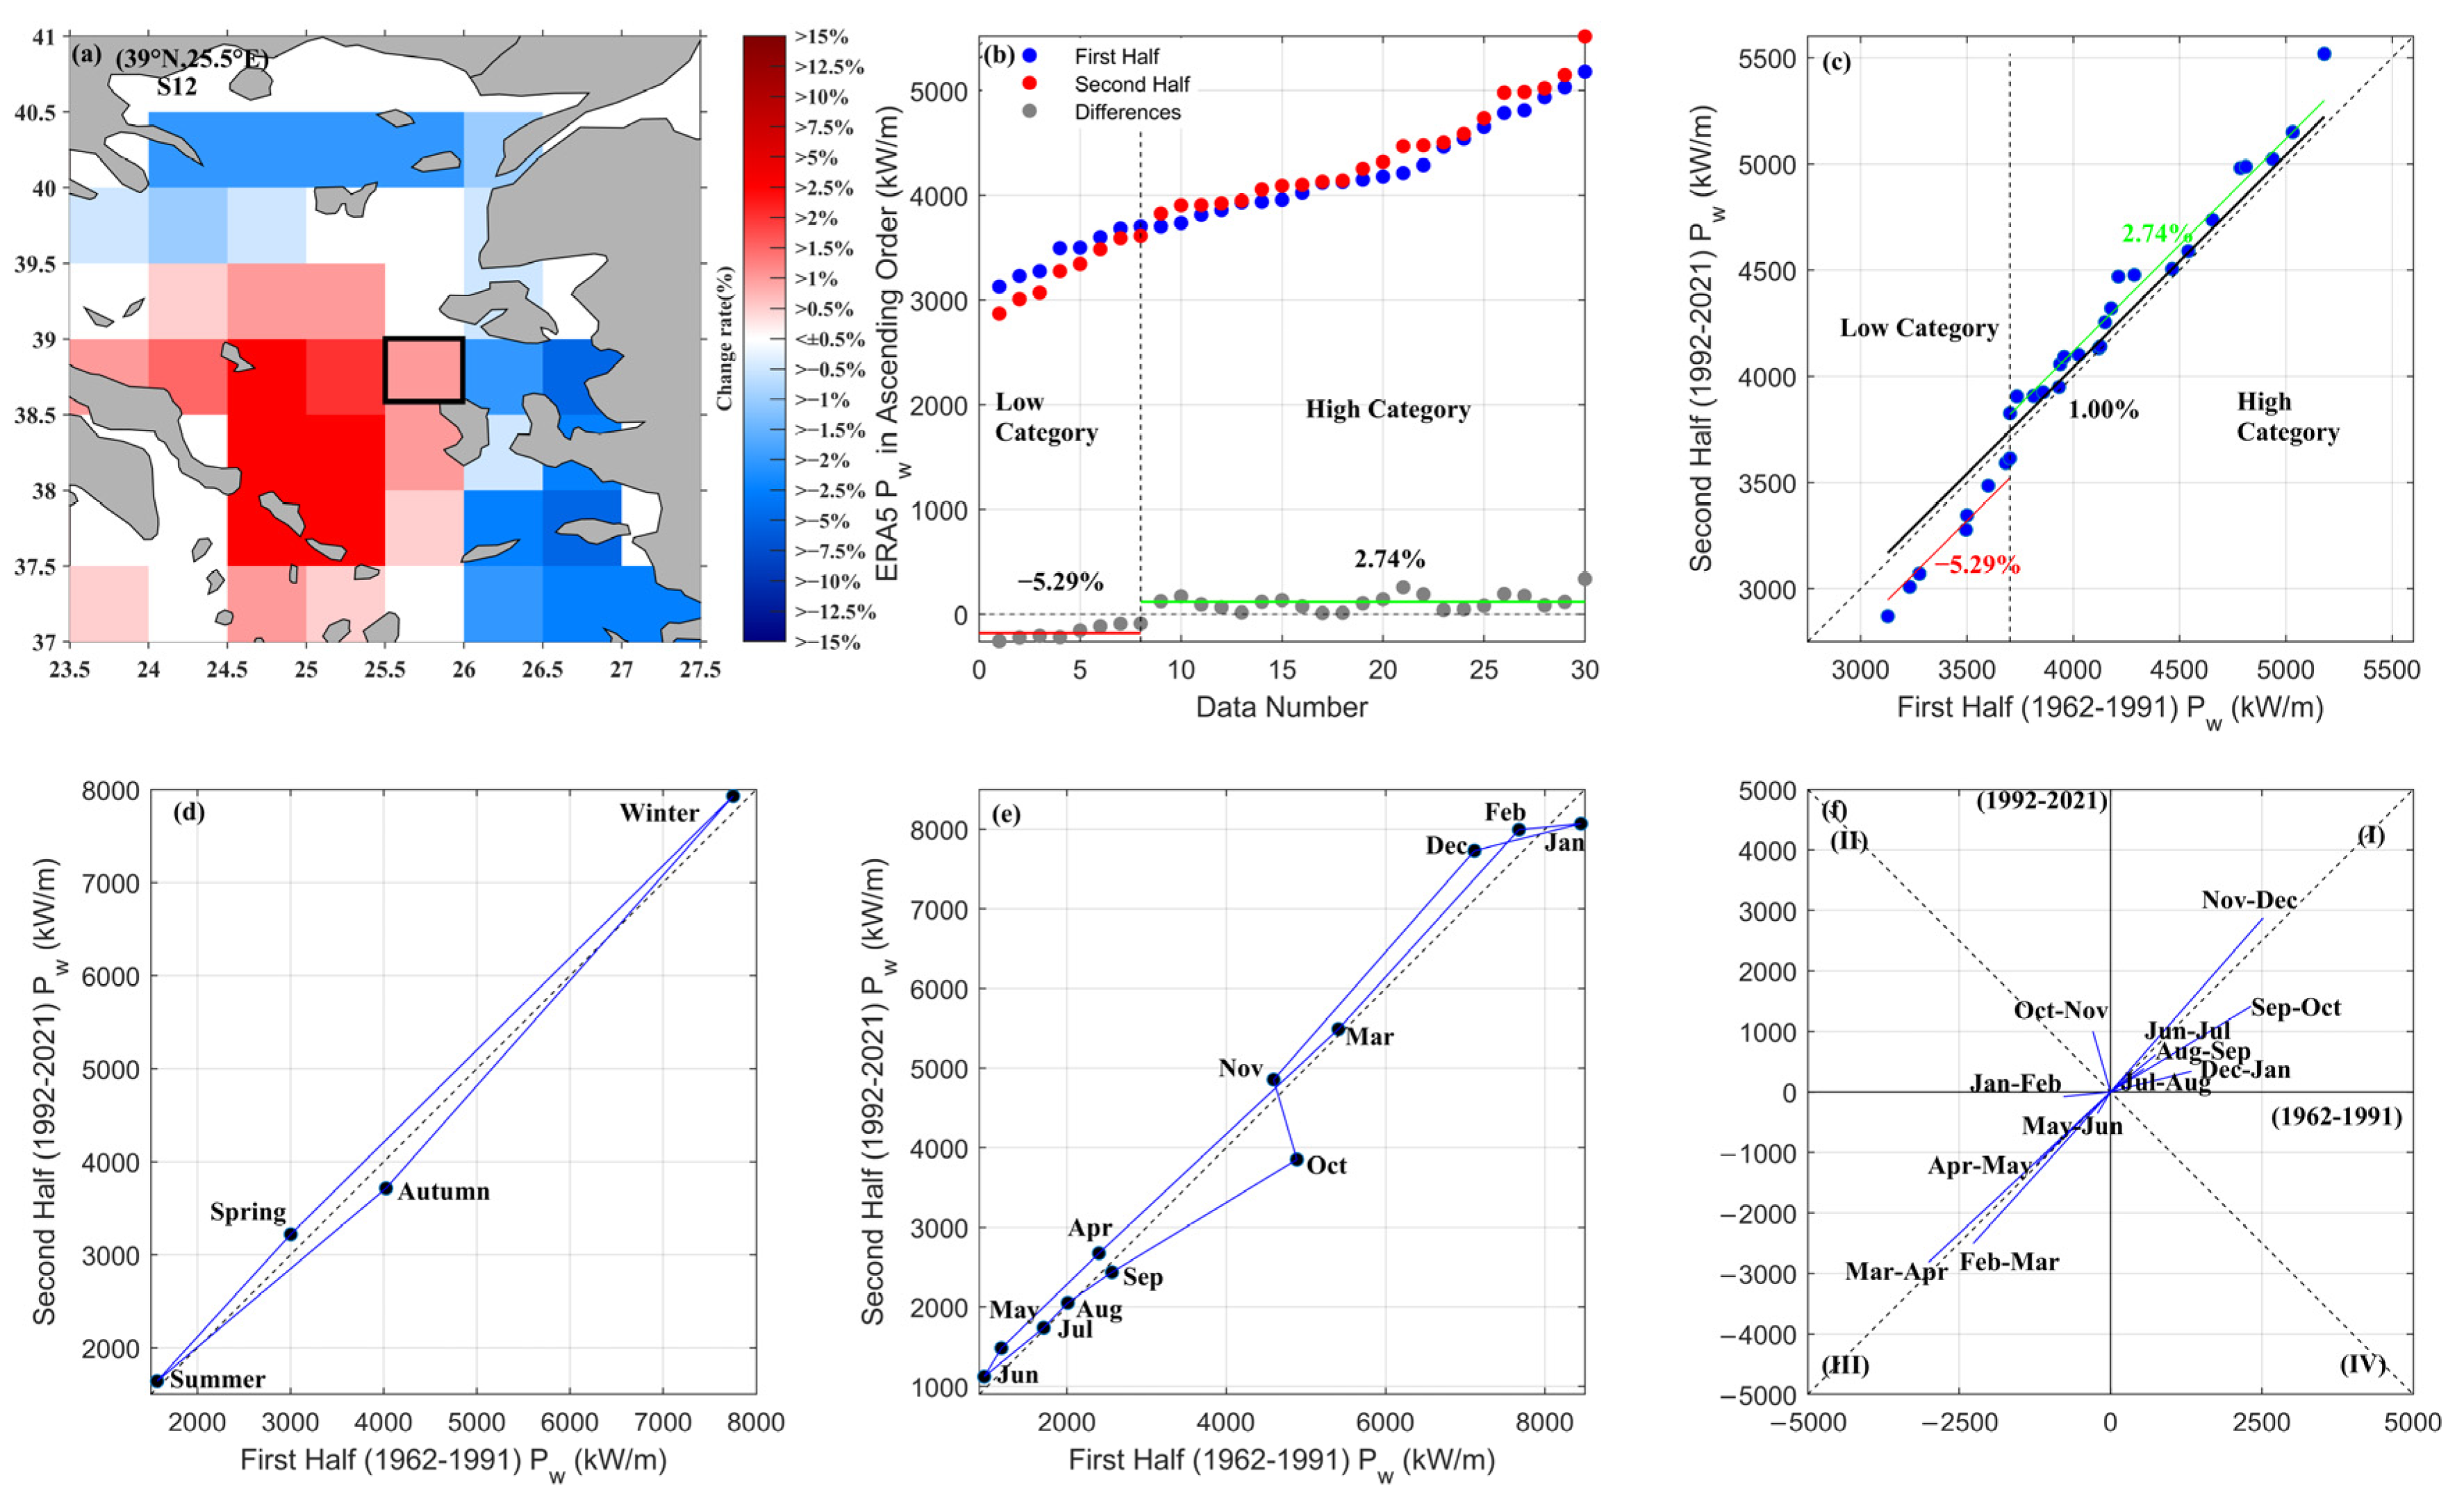
4.2. Detailed Assessment Based on the Innovative Methods for the Hot-Spot Locations

The graphs obtained by applying the innovative trend analysis methods to the mean Pwave at 12 locations representing the regions showing a trend above the 5% change rate are given in Figure 4 and Figure 5 for the five locations selected. The results for the other seven locations can be found in the Appendix A.
The general findings are supported by other innovative trend methods applied to the mean Pwave at selected locations. For instance, as seen in Table 2 at location S1, the annual mean Pwave is increasing with a change rate of 3.96%. In the IV-ITA method (Figure 4a), which statistically divides the data into low and high subclasses, a change point was determined in the 24th datum of the difference series. Accordingly, the low (high) category annual mean Pwave showed an increasing (decreasing) trend with a change rate of 6.69% (3.26%). According to the seasonal IPTA (Figure 5a), there is a decreasing trend in the winter season, while there is an increasing trend in the spring, summer, and autumn seasons for mean Pwave. This result for location S1 is also clearly demonstrated in Figure 2b–e. Although an increasing trend of more than 10% emerged in the spring, summer, and autumn seasons, it was determined that the effect of the increasing trend in the summer season was less with the seasonal IPTA. The monthly IPTA graph (Figure 5f) shows a decreasing trend in December and February in winter, while there is an increasing trend in January. Despite this, it is seen with the seasonal IPTA that there is a decreasing trend in the winter season. The increasing trend in the March–May period affects the spring. In the star graph (Figure 4k), monthly passes usually stay in (I) and (III) regions. It means that there is an increase (decrease) in both the first and second time periods in the I (III) region. Notably, the first and second halves increased in all intermonth transitions from July to December.
Location S2 near Malta is located in an area where the mean annual Pwave shows a decreasing trend (−4.90%) according to ITA (Table 2). It is noteworthy that the decreasing pattern in the low category Pwave with a −1.04% trend and in the high category Pwave with a −6.39% trend, which is more significant, is dominant in the subcategories by IV-ITA (Figure 4b,g). According to seasonal IPTA (Figure 5b,g), the mean Pwave decreases in winter, spring, and summer, while it increases slightly in autumn. The decreasing trend in the March–May period and in June and August resulted in the decreasing trend spring and summer seasons, respectively. As in location S1, the monthly transitions in the star graph (Figure 5l) take place in the regions (I) and (III) at location S2. While the first and second half values increase at the same rate in the monthly transitions of September–October, and October–November, which are almost above the 1:1 line, the March–April transition decreases at the same rate.
An increasing trend was detected in the low (9.40%) and high (2.49%) categories at location S3 in the Libyan Sea (Table 2). When we evaluate the whole series, the change rate is 7.96%. The effect of the mean Pwave in the low category is greater for this (Figure 4h). In Figure 5c, according to seasonal IPTA, there is an increasing trend in all seasons, and the most significant effect is in the winter season. We were looking at the seasonal ITA results between Figure 3b,e, which can confirm the increasing trends for mean Pwave at location S3. An increasing trend was determined in all months except for March and December (Figure 5h). While an increase is observed in both time series in the monthly transitions between June–July and September–January, it is especially striking in the star graph that the November–December transition has a very high value (Figure 5m).
At location S4 in north of the Levantine basin, the change rate for mean Pwave is −8.21% according to ITA, while it is −6.60% in the low category and −9.95% in the high category (Figure 4d,i). Seasonally, the mean Pwave decreases in winter, spring, and summer and increases slightly in autumn (Figure 5d). Except for May, September, and November, a decreasing trend is observed in the mean Pwave, staying below the 1:1 line. In the star graph (Figure 5n), the monthly transitions occur in the regions (I) and (III), generally.
In location S5, where the annual mean Pwave change rate is at ±0.5% (Table 2), the change rate is 1.06% for the low category and −1.55% for the high category (Figure 4e,j). On a seasonal basis, there is no significant trend, except for a slight decrease in winter (Figure 5e). However, interestingly, an increasing trend higher than a 5% change rate (8.47%) in summer (Table 2) was detected, even though the point of summer was so close to the 1:1 line according to IPTA. Moreover, as other stations draw attention, the values are pretty close during summer (June–August). This is because the values are very close and low in the summer months, as seen in Figure 5j, and a slight change creates a significant effect in percentage. Notably, the mean Pwave showed an increasing trend in all annual and seasonal periods, especially in the Libyan Sea, where the location S5 is located, and significant trends above 95% CL emerged. According to innovative trend test results, low-category annual mean Pwave increased while high-category annual mean Pwave decreased at Stations 1 and 5. In the others, while the low category increased (decreased), an increase (decrease) was observed in the high category. According to the seasonal analysis, it is seen that mean Pwave is closer to each other in autumn and spring, lower in summer, and much higher in winter. It was noted that monthly mean Pwave decreased in January–July and increased in August–December.
De Leo et al. (2020) [14] also stated an increasing trend in the Libyan and Tyrrhenian Seas in the mean Hs, whereby it is known that the square of Hs is directly related to the wave power. This increasing trend in wave power may cause damage to existing coastal and marine structures. In addition, the results can be beneficial in designing future coastal structures, developing existing structures, and operating ships and ports. As is known, hot-spot regions with high energy potential are preferred for installing WECs and wave farms (Iglesias & Carballo, 2010 [5]; Aristodemo & Algieri Ferraro, 2018 [6]). Thus, areas with an increasing trend over all periods may be considered suitable sites for installing WECs. Locations that exhibit a consistently increasing trend may reflect more sustainability of the energy resources. However, the designs of the WECs structures in those locations should be performed by considering the likely trend in the extreme wave that can affect the stability and the durability of the WEC infrastructure. Increased availability and decreased dependence on fossil fuels are two significant advantages of expanding renewable energy sources. In addition, countries will become more self-sufficient due to wave energy for electricity by using WECs (Pecher & Kofoed, 2017) [54].
Moreover, Reguero et al. (2019) [27] underlined that increasing global wave power is linked to global warming. Kamranzad et al. (2022) [32] showed that the change in Pwave is mainly related to the global swell climate. In addition, they found a decreasing change in the western and eastern Mediterranean Sea and an increasing change in the central Mediterranean Sea when the mean annual Pwave was compared over 30-year periods. Their result is similar to our ITA results, except for the trend type in the western Mediterranean Sea.
The graphs of locations S6 and S12 presented in the Appendix A show that the annual mean Pwave decreases in the Alboran, Adriatic, Ligurian, and Tyrrhenian Seas and the Gulf of Lion and increases in the Ionian and Aegean Seas. While low- and high-category Pwave decreases at the locations S6, S9, and S10, which show a decreasing trend on an annual scale, low-category Pwave increases and high-category Pwave decreases at the locations S7 and S8. In location S11 (S12), where the annual mean Pwave is increasing, the low-category Pwave showed an increasing (decreasing) trend, while the high-category Pwave showed a decreasing (increasing) trend. The decrease in the winter season is more impacted by the locations with a decreasing trend, as shown in the seasonal and monthly IPTA graphs.

5. Conclusions

The present study involves the long-term trend analysis of mean wave power in the Mediterranean Sea. Annual and seasonal mean wave power covering the last 60 years were calculated using the datasets of significant wave height and peak period from the ERA5 reanalysis. In addition to the innovative trend analysis (ITA) results presented at a spatial scale, innovative polygon trend analysis (IPTA), improved visualization (ITA), and star graph methods that count more detailed information were applied to 12 selected stations and visualized on a graphical basis. Moreover, evaluation was made with the Mann–Kendall test, often used in the literature to express the significance of the trend.
According to the ITA, it was noteworthy that an increasing trend was observed in the western Mediterranean and the Libyan Sea in all periods (except for the winter season in the western Mediterranean). In addition, the Mann–Kendall test revealed significant trends in the Levantine and Libyan Seas above the 95% confidence level. In the summer and autumn seasons, the trend of the mean Pwave, which has a change rate of over 15% with ITA and over 95% confidence level with Mann–Kendall, is noteworthy. However, IPTA results show that the mean Pwave is low in the summer and autumn seasons, while the winter season has the highest effect on the annual trend. Thus, although there was a small increase/decrease in the summer and autumn seasons, a higher rate of change was obtained. More detailed information about the trend determined by using different innovative methods has emerged, and the results are mutually supportive. In addition, quite different results were obtained from other studies in the literature, probably due to the difference in the dataset used, the temporal and spatial resolutions of the data used, period ranges, and the length of the time series.
It is highly advised to consider these findings for coastal and offshore structures’ sustainable development and to determine the Mediterranean Sea’s link to global climate change. The results shed light on establishing WECs in regions with high energy potential. In addition, examining the interannual trends in different period ranges, for example, 20-year or 30-year trends, can be considered as the subject of future work since the ERA5 dataset has a very long period, and it is difficult to detect the change in the last decades.

Author Contributions

Conceptualization, A.A.; Methodology, A.A., M.K. and K.A.; Software, E.A.; Formal analysis, E.A.; Investigation, E.A.; Resources, E.A.; Data curation, E.A. and K.A.; Writing–original draft, E.A.; Writing – review & editing, A.A., M.K. and K.A.; Visualization, E.A.; Supervision, A.A. and M.K. All authors have read and agreed to the published version of the manuscript.

Funding

This research received no external funding.

Institutional Review Board Statement

Not applicable.

Informed Consent Statement

Not applicable.

Data Availability Statement

The data are available on request.

Acknowledgments

We thank the European Center for Medium-Range Weather Forecasts (ECMWF) for providing ERA5 reanalysis datasets.

Conflicts of Interest

The authors declare no conflict of interest.

Appendix A

Figure A1. Trends of mean wave power (Pw) at location S6 (36° N, 4° W) in the Alboran Sea according to in-novative methods; (a) change rate map of annual Pw according to ITA (the location is enclosed in black square), (b) IV-ITA graph for annual Pw, (c) ITA graph for annual Pw (graph includes change rates for low (left line), high (right line) and all (black line) value categories and the green (red) line represents the increasing (decreasing) trend), (d) IPTA graph for seasonal Pw, (e) IPTA graph for monthly Pw, and (f) star graph for monthly Pw.
Sustainability 15 08590 g0a1
Figure A2. Trends of mean wave power (Pw) at location S7 (42.5° N, 16° E) in the Adriatic Sea according to innovative methods; (a) change rate map of annual Pw according to ITA (the location is enclosed in black square), (b) IV-ITA graph for annual Pw, (c) ITA graph for annual Pw (graph includes change rates for low (left line), high (right line) and all (black line) value categories and the green (red) line represents the increasing (decreasing) trend), (d) IPTA graph for seasonal Pw, (e) IPTA graph for monthly Pw, and (f) star graph for monthly Pw.
Sustainability 15 08590 g0a2
Figure A3. Trends of mean wave power (Pw) at location S8 (42° N, 6° E) in the Northwestern Mediterranean Sea according to innovative methods; (a) change rate map of annual Pw according to ITA (the location is enclosed in black square), (b) IV-ITA graph for annual Pw, (c) ITA graph for annual Pw (graph includes change rates for low (left line), high (right line) and all (black line) value categories and the green and red lines represent the increasing and decreasing trends, respectively), (d) IPTA graph for seasonal Pw, (e) IPTA graph for monthly Pw, and (f) star graph for monthly Pw.
Sustainability 15 08590 g0a3
Figure A4. Trends of mean wave power (Pw) at location S9 (43.5 °N, 9° E) in the Ligurian Sea according to innovative methods; (a) change rate map of annual Pw according to ITA (the location is enclosed in black square), (b) IV-ITA graph for annual Pw, (c) ITA graph for annual Pw (graph includes change rates for low (left line), high (right line) and all (black line) value categories and the green and red lines represent the increasing and decreasing trends, respectively), (d) IPTA graph for seasonal Pw, (e) IPTA graph for monthly Pw, and (f) star graph for monthly Pw.
Sustainability 15 08590 g0a4
Figure A5. Trends of mean wave power (Pw) at location S10 (40° N, 13° E) in the Tyrrhenian Sea according to innovative methods; (a) change rate map of annual Pw according to ITA (the location is enclosed in black square), (b) IV-ITA graph for annual Pw, (c) ITA graph for annual Pw (graph includes change rates for low (left line), high (right line) and all (black line) value categories and the green and red lines represent the increasing and decreasing trends, respectively), (d) IPTA graph for seasonal Pw, (e) IPTA graph for monthly Pw, and (f) star graph for monthly Pw.
Sustainability 15 08590 g0a5
Figure A6. Trends of mean wave power (Pw) at location S11 (37° N, 19° E) in the Ionian Sea according to innovative methods; (a) change rate map of annual Pw according to ITA (the location is enclosed in black square), (b) IV-ITA graph for annual Pw, (c) ITA graph for annual Pw (graph includes change rates for low (left line), high (right line) and all (black line) value categories and the green and red lines represent the increasing and decreasing trends, respectively), (d) IPTA graph for seasonal Pw, (e) IPTA graph for monthly Pw, and (f) star graph for monthly Pw.
Sustainability 15 08590 g0a6
Figure A7. Trends of mean wave power (Pw) at location S12 (39° N, 25.5 °E) in the Aegean Sea according to innovative methods; (a) change rate map of annual Pw according to ITA (the location is enclosed in black square), (b) IV-ITA graph for annual Pw, (c) ITA graph for annual Pw (graph includes change rates for low (left line), high (right line) and all (black line) value categories and the green and red lines represent the increasing and decreasing trends, respectively), (d) IPTA graph for seasonal Pw, (e) IPTA graph for monthly Pw, and (f) star graph for monthly Pw.
Sustainability 15 08590 g0a7

References

  1. Giorgi, F. Climate change hot-spots. Geophys. Res. Lett. 2006, 33, 8. [Google Scholar] [CrossRef]
  2. IPCC. Climate Change 2022: Impacts, Adaptation and Vulnerability. Contribution of Working Group II to the Sixth Assessment Report of the Intergovernmental Panel on Climate Change; Pörtner, H.-O., Roberts, D.C., Tignor, M., Poloczanska, E.S., Mintenbeck, K., Alegr, A., Eds.; Cambridge University Press: Cambridge, UK; New York, NY, USA, 2022; Available online: https://www.ipcc.ch/report/sixth-assessment-report-working-group-ii/ (accessed on 6 June 2022).
  3. IPCC. IPCC CLIMATE CHANGE 2013 Climate Change 2013. In Researchgate.Net. Available online: https://www.researchgate.net/profile/Abha_Chhabra2/publication/271702872_Carbon_and_Other_Biogeochemical_Cycles/links/54cf9ce80cf24601c094a45e/Carbon-and-Other-Biogeochemical-Cycles.pdf (accessed on 1 May 2019).
  4. Kaur, S.; Kumar, P.; Weller, E.; Young, I.R. Positive relationship between seasonal Indo-Pacific Ocean wave power and SST. Sci. Rep. 2021, 11, 17419. [Google Scholar] [CrossRef] [PubMed]
  5. Iglesias, G.; Carballo, R. Wave energy and nearshore hot spots: The case of the SE Bay of Biscay. Renew. Energy 2010, 35, 2490–2500. [Google Scholar] [CrossRef]
  6. Aristodemo, F.; Algieri Ferraro, D. Feasibility of WEC installations for domestic and public electrical supplies: A case study off the Calabrian coast. Renew. Energy 2018, 121, 261–285. [Google Scholar] [CrossRef]
  7. Bromirski, P.D.; Cayan, D.R.; Helly, J.; Wittmann, P. Wave power variability and trends across the North Pacific. J. Geophys. Res. Ocean. 2013, 118, 6329–6348. [Google Scholar] [CrossRef]
  8. Bromirski, P.D.; Cayan, D.R. Wave power variability and trends across the North Atlantic influenced by decadal climate patterns. J. Geophys. Res. Ocean. 2015, 120, 3419–3443. [Google Scholar] [CrossRef]
  9. Simonetti, I.; Cappietti, L. Mediterranean coastal wave-climate long-term trend in climate change scenarios and effects on the optimal sizing of OWC wave energy converters. Coast. Eng. 2023, 179, 104247. [Google Scholar] [CrossRef]
  10. Zheng, C.W.; Wu, G.X.; Chen, X.; Wang, Q.; Gao, Z.S.; Chen, Y.G.; Luo, X. CMIP5-Based Wave Energy Projection: Case Studies of the South China Sea and the East China Sea. IEEE Access 2019, 7, 82753–82763. [Google Scholar] [CrossRef]
  11. Karunarathna, H.; Maduwantha, P.; Kamranzad, B.; Rathnasooriya, H.; De Silva, K. Impacts of Global Climate Change on the Future Ocean Wave Power Potential: A Case Study from the Indian Ocean. Energies 2020, 13, 3028. [Google Scholar] [CrossRef]
  12. Pourali, M.; Kavianpour, M.R.; Kamranzad, B.; Alizadeh, M.J. Future variability of wave energy in the Gulf of Oman using a high resolution CMIP6 climate model. Energy 2023, 262, 125552. [Google Scholar] [CrossRef]
  13. Shao, Z.; Gao, H.; Liang, B.; Lee, D. Potential, trend and economic assessments of global wave power. Renew. Energy 2022, 195, 1087–1102. [Google Scholar] [CrossRef]
  14. De Leo, F.; De Leo, A.; Besio, G.; Briganti, R. Detection and quantification of trends in time series of significant wave heights: An application in the Mediterranean Sea. Ocean Eng. 2020, 202, 107155. [Google Scholar] [CrossRef]
  15. Caloiero, T.; Aristodemo, F.; Ferraro, D.A. Annual and seasonal trend detection of significant wave height, energy period and wave power in the Mediterranean Sea. Ocean Eng. 2022, 243, 110322. [Google Scholar] [CrossRef]
  16. Vanem, E.; Walker, S.E. Identifying trends in the ocean wave climate by time series analyses of significant wave height data. Ocean Eng. 2013, 61, 148–160. [Google Scholar] [CrossRef]
  17. Anoop, T.R.; Kumar, V.S.; Shanas, P.R.; Johnson, G. Surface Wave Climatology and Its Variability in the North Indian Ocean Based on ERA-Interim Reanalysis. J. Atmos. Ocean. Technol. 2015, 32, 1372–1385. [Google Scholar] [CrossRef]
  18. Mao, M.; Van Der Westhuysen, A.J.; Xia, M.; Schwab, D.J.; Chawla, A. Modeling wind waves from deep to shallow waters in Lake Michigan using unstructured SWAN. J. Geophys. Res. Ocean. 2016, 121, 3836–3865. [Google Scholar] [CrossRef]
  19. Aydoğan, B.; Ayat, B. Spatial variability of long-term trends of significant wave heights in the Black Sea. Appl. Ocean Res. 2018, 79, 20–35. [Google Scholar] [CrossRef]
  20. Caloiero, T.; Aristodemo, F.; Ferraro, D.A. Trend analysis of significant wave height and energy period in southern Italy. Theor. Appl. Climatol. 2019, 138, 917–930. [Google Scholar] [CrossRef]
  21. De Leo, F.; Besio, G.; Mentaschi, L. Trends and variability of ocean waves under RCP8.5 emission scenario in the Mediterranean Sea. Ocean Dyn. 2021, 71, 97–117. [Google Scholar] [CrossRef]
  22. Islek, F.; Yuksel, Y.; Sahin, C. Spatiotemporal long-term trends of extreme wind characteristics over the Black Sea. Dyn. Atmos. Ocean. 2020, 90, 101132. [Google Scholar] [CrossRef]
  23. Amarouche, K.; Akpınar, A. Increasing Trend on Storm Wave Intensity in the Western Mediterranean. Climate 2021, 9, 11. [Google Scholar] [CrossRef]
  24. Amarouche, K.; Bingölbali, B.; Akpınar, A. New wind-wave climate records in the Western Mediterranean Sea. Clim. Dyn. 2021, 58, 1899–1922. [Google Scholar] [CrossRef]
  25. Akçay, F.; Bingölbali, B.; Akpınar, A.; Kankal, M. Trend detection by innovative polygon trend analysis for winds and waves. Front. Mar. Sci. 2022, 9, 1479. [Google Scholar] [CrossRef]
  26. Acar, E.; Akpınar, A.; Kankal, M.; Amarouche, K. Increasing trends in spectral peak energy and period in a semi-closed sea. Renew. Energy 2023, 205, 1092–1104. [Google Scholar] [CrossRef]
  27. Reguero, B.G.; Losada, I.J.; Méndez, F.J. A recent increase in global wave power as a consequence of oceanic warming. Nat. Commun. 2019, 10, 205. [Google Scholar] [CrossRef] [PubMed]
  28. Ahn, S.; Neary, V.S. Non-stationary historical trends in wave energy climate for coastal waters of the United States. Ocean Eng. 2020, 216, 108044. [Google Scholar] [CrossRef]
  29. Divinsky, B.V.; Kosyan, R.D. Climatic trends in the fluctuations of wind waves power in the Black Sea. Estuar. Coast. Shelf Sci. 2020, 235, 106577. [Google Scholar] [CrossRef]
  30. Caloiero, T.; Aristodemo, F. Trend Detection of Wave Parameters along the Italian Seas. Water 2021, 13, 1634. [Google Scholar] [CrossRef]
  31. Hall, C.; Jensen, R.E.; Wang, D.W. Wave power trends along the U.S. coastline: In situ measurements and model hindcast estimates. Ocean Dyn. 2022, 1, 3. [Google Scholar] [CrossRef]
  32. Kamranzad, B.; Amarouche, K.; Akpınar, A. Linking the long-term variability in global wave energy to swell climate and redefining suitable coasts for energy exploitation. Sci. Rep. 2022, 12, 14692. [Google Scholar] [CrossRef]
  33. Barbariol, F.; Bidlot, J.R.; Cavaleri, L.; Sclavo, M.; Thomson, J.; Benetazzo, A. Maximum wave heights from global model reanalysis. Prog. Oceanogr. 2019, 175, 139–160. [Google Scholar] [CrossRef]
  34. Şen, Z. Innovative Trend Analysis Methodology. J. Hydrol. Eng. 2012, 17, 1042–1046. [Google Scholar] [CrossRef]
  35. Acar, E.; Kankal, M.; Akçay, F.; Şan, M. Innovative polygon trend analyses with star graph for rainfall and temperature data in agricultural regions of Turkey. Environ. Earth Sci. 2022, 81, 530. [Google Scholar] [CrossRef]
  36. Bonavita, M.; Hólm, E.; Isaksen, L.; Fisher, M. The evolution of the ECMWF hybrid data assimilation system. Q. J. R. Meteorol. Soc. 2016, 142, 287–303. [Google Scholar] [CrossRef]
  37. Hersbach, H.; Bell, B.; Berrisford, P.; Biavati, G.; Horányi, A.; Muñoz Sabater, J.; Nicolas, J.; Peubey, C.; Radu, R.; Rozum, I.; et al. ERA5 Hourly Data on Single Levels from 1979 to Present. Copernicus Climate Change Service (C3S) Climate Data Store (CDS). 2018. Available online: https://cds.climate.copernicus.eu/cdsapp#!/dataset/reanalysis-era5-single-levels?tab=overview (accessed on 9 April 2023).
  38. Barbariol, F.; Davison, S.; Falcieri, F.M.; Ferretti, R.; Ricchi, A.; Sclavo, M.; Benetazzo, A. Wind Waves in the Mediterranean Sea: An ERA5 Reanalysis Wind-Based Climatology. Front. Mar. Sci. 2021, 8, 1615. [Google Scholar] [CrossRef]
  39. Benetazzo, A.; Davison, S.; Barbariol, F.; Mercogliano, P.; Favaretto, C.; Sclavo, M. Correction of ERA5 Wind for Regional Climate Projections of Sea Waves. Water 2022, 14, 1590. [Google Scholar] [CrossRef]
  40. Karathanasi, F.E.; Soukissian, T.H.; Hayes, D.R. Wave Analysis for Offshore Aquaculture Projects: A Case Study for the Eastern Mediterranean Sea. Climate 2022, 10, 2. [Google Scholar] [CrossRef]
  41. Kozyrakis, G.V.; Spanoudaki, K.; Varouchakis, E.A. Long-term wave energy potential estimation in the Aegean and Ionian seas using dynamic downscaling and wave modelling techniques. Appl. Ocean Res. 2023, 131, 103446. [Google Scholar] [CrossRef]
  42. Kardakaris, K.; Boufidi, I.; Soukissian, T. Offshore Wind and Wave Energy Complementarity in the Greek Seas Based on ERA5 Data. Atmosphere 2021, 12, 1360. [Google Scholar] [CrossRef]
  43. Abu Zed, A.A.; Kansoh, R.M.; Iskander, M.M.; Elkholy, M. Wind and wave climate southeastern of the Mediterranean Sea based on a high-resolution SWAN model. Dyn. Atmos. Ocean. 2022, 99, 101311. [Google Scholar] [CrossRef]
  44. Şen, Z.; Şişman, E.; Dabanli, I. Innovative Polygon Trend Analysis (IPTA) and applications. J. Hydrol. 2019, 575, 202–210. [Google Scholar] [CrossRef]
  45. Karimirad, M. Offshore Energy Structures; Springer International Publishing: Cham, Switzerland, 2014. [Google Scholar] [CrossRef]
  46. Amrutha, M.M.; Sanil Kumar, V. Spatial and temporal variations of wave energy in the nearshore waters of the central west coast of India. Ann. Geophys. 2016, 34, 1197–1208. [Google Scholar] [CrossRef]
  47. Mann, H.B. Nonparametric Tests Against Trend Author (s): Henry B. Mann Published by: The Econometric Society Stable. Econometrica 1945, 13, 245–259. Available online: http://www.jstor.com/stable/1907187 (accessed on 8 April 2021). [CrossRef]
  48. Kendall, M. Rank Correlation Methods; Griffin: London, UK, 1975; Available online: https://www.worldcat.org/title/rank-correlation-methods/oclc/3827024 (accessed on 12 April 2021).
  49. Şen, Z. Up-to-date statistical essentials in climate change and hydrology: A review. Int. J. Glob. Warm. 2020, 22, 392–431. [Google Scholar] [CrossRef]
  50. Şen, Z. Conceptual monthly trend polygon methodology and climate change assessments. Hydrol. Sci. J. 2021, 66, 503–512. [Google Scholar] [CrossRef]
  51. Güçlü, Y.S. Improved visualization for trend analysis by comparing with classical Mann-Kendall test and ITA. J. Hydrol. 2020, 584, 124674. [Google Scholar] [CrossRef]
  52. Nissen, K.M.; Leckebusch, G.C.; Pinto, J.G.; Renggli, D.; Ulbrich, S.; Ulbrich, U. Cyclones Causing Wind Storms in the Mediterranean: Characteristics, Trends and Links to Large-Scale Patterns. Nat. Hazards Earth Syst. Sci. 2010, 10, 1379–1391. [Google Scholar] [CrossRef]
  53. Lionello, P.; Galati, M.B. Links of the Significant Wave Height Distribution in the Mediterranean Sea with the Northern Hemisphere Teleconnection Patterns. Adv. Geosci. 2008, 17, 13–18. [Google Scholar] [CrossRef]
  54. Pecher, A.; Kofoed, J. Handbook of Ocean Wave Energy; Pecher, A., Kofoed, J., Eds.; Springer Nature: Berlin/Heidelberg, Germany, 2017. [Google Scholar]
Figure 1. The Mediterranean Sea, its bathymetry, and the locations (green points) selected for the detailed analysis.
Sustainability 15 08590 g001
Figure 2. Innovative trend analysis (ITA) results for the period 1962–2021 of annual (a) and seasonal (be) mean wave power.
Sustainability 15 08590 g002
Figure 3. Mann–Kendall test results for the period 1962–2021 of annual (a) and seasonal (be) mean wave power.
Sustainability 15 08590 g003
Figure 4. Trends of mean wave power (Pw) at location S1–S5 in the Mediterranean Sea according to innovative methods; (ae) IV-ITA graph for annual Pw, (fj) ITA graph for annual Pw (graph includes change rates for low (left line), high (right line), and all (black line) value categories and the green and red lines represent the increasing and decreasing trends, respectively).
Sustainability 15 08590 g004
Figure 5. Trends of mean wave power (Pw) at location S1–S5 in the Mediterranean Sea according to IPTA methods; (ae) IPTA graph for seasonal Pw, (fj) IPTA graph for monthly Pw, and (ko) star graph for monthly Pw.
Sustainability 15 08590 g005
Table 1. Detailed information about selected locations.
LocationsLon (°)Lat (°)Depth (m)Site
S10.539752Balearic Sea
S21335.5540Strait of Sicily
S324.532.51800Libyan Sea
S430.5352413Levantine Sea
S521.5353339Libyan Sea
S6−4361286.5Alboran Sea
S71642.5128Adriatic Sea
S86422534Gulf of Lion
S9943.51971Ligurian Sea
S1013403595Tyrrhenian Sea
S1119373465Ionian Sea
S1225.539196Aegean Sea
Table 2. The heatmap of the ITA change rate for selected locations (values greater than 5% are expressed in bold and italic and the blue and red gradations indicate the decreasing and increasing trends, respectively).
S1S2S3S4S5S6S7S8S9S10S11S12
ITAAnnual3.963 −4.903 7.964 −8.208 −0.433 −3.439 −3.480 −4.689 −3.746 −6.149 2.8641.002
Winter −3.219 −6.984 7.892 −10.087 −3.422 −8.946 −7.127 −3.734 −9.743 −12.611 −0.0872.237
Spring7.590 −4.840 5.195 −7.436 −0.038−0.462 −8.669 −11.555 −11.785 −3.326 1.3906.778
Summer6.695 −9.786 11.094 −19.977 8.4698.028 −8.344 −4.956 −6.630 −7.692 −0.5774.636
Autumn 10.349 1.1499.1705.2883.041 −6.783 8.7740.180 12.377 3.240 11.720 −8.360
Change Rate
> 5%>12.5%>10%>7.5%>5%>2.5%>2%>1.5%>1%>0.5%±0.5%>−0.5%>−1%>−1.5%>−2%>−2.5%>−5%>−7.5%>−10%>−12.5%>−15%
Table 3. The heatmap of the MK-Z values for selected locations (values greater than 1.96 (95% CL) are expressed in bold and italic and the blue and red gradations indicate the decreasing and increasing trends, respectively).
S1S2S3S4S5S6S7S8S9S10S11S12
MKAnnual0.984−1.361 2.952 −2.478 −0.012−0.632−1.336−1.263−1.276−1.1781.1180.437
Winter−0.364−1.0451.871−0.692−0.607−0.802−0.729−1.105−1.008−0.8750.0240.547
Spring1.664 −1.543 1.895 −1.640 0.3280.814−0.765−1.421−0.9960.3040.2550.583
Summer0.158 −2.296 1.847 −5.430 1.1780.231−0.474−1.057 −1.798 −2.272 −0.1700.777
Autumn0.9720.1941.4460.7900.583 −1.506 −0.158−0.0850.7170.3642.247−0.692
Confidence Level
>99.9%>99%>98%>95%>90%>85%>80%>75%>50%±50%>50%>75%>80%>85%>90%>95%>98%>99%>99.9%
Disclaimer/Publisher’s Note: The statements, opinions and data contained in all publications are solely those of the individual author(s) and contributor(s) and not of MDPI and/or the editor(s). MDPI and/or the editor(s) disclaim responsibility for any injury to people or property resulting from any ideas, methods, instructions or products referred to in the content.

