Article

Damage Detection of High-Speed Railway Box Girder Using Train-Induced Dynamic Responses

1
School of Transportation Science and Engineering, Harbin Institute of Technology, 73 Huanghe Road, Harbin 150090, China
2
China Railway Design Corporation, Tianjin 300142, China
*
Author to whom correspondence should be addressed.
Sustainability 2023, 15(11), 8552; https://doi.org/10.3390/su15118552
Submission received: 1 March 2023 / Revised: 24 April 2023 / Accepted: 18 May 2023 / Published: 24 May 2023
(This article belongs to the Special Issue Structural Health Monitoring in Civil Infrastructure)

Abstract

:
This paper proposes a damage detection method based on the train-induced responses of high-speed railway box girders. Under the coupling effects of bending and torsion, the traditional damage detection method based on the Euler beam theory cannot be applied. In this research, the box girder section is divided into different components based on the plate element analysis method. The strain responses were preprocessed based on the principal component analysis (PCA) method to remove the influence of train operation variation. The residual error of the autoregressive (AR) model was used as a potential index of damage features. The optimal order of the model was determined based on the Bayesian information criterion (BIC) criterion. Finally, the confidence boundary (CB) of damage features (DF) constituting outliers can be estimated by the Gaussian inverse cumulative distribution function (ICDF). The numerical simulation results show that the proposed method in this paper can effectively identify, locate and quantify the damage, which verifies the accuracy of the proposed method. The proposed method effectively identifies the early damage of all components on the key section by using four strain sensors, and it is helpful for developing effective maintenance strategies for high-speed railway box girders.

1. Introduction

The total operating mileage of high-speed railways has exceeded 35,000 km in China, including high-speed railway bridges of 16,000 km. More than 85% of high-speed railway bridges are constructed with prestressed concrete simply supported box girders [1]. High-speed railway bridges face various potential risks during service, such as natural disasters, fatigue, and corrosion [2]. These potential problems will lead to different degrees of damage, which may affect the operational performance and safety of these bridges. Therefore, it is essential to maintain these railway bridges regularly through effective monitoring strategies. Thus, early damage detection of bridges has become an important and indispensable part of structural health monitoring (SHM) systems for high-speed railways, and the application of new methods or new materials in the field of SHM has been widely studied [3,4,5,6,7,8]. Extensive research efforts have been devoted to damage detection, and many effective methods have been proposed [9,10,11,12,13,14].
These methods can be divided into model updating or data-driven methods [15]. Model updating modifies the finite element model (FEM) through experimental data, which is not suitable for real-time SHM for large bridges due to complex calculations. The data-driven methods extract valuable information from time series data acquired in the field, which is no need for any structural analysis modeling or updating of the FEM, and online damage detection can be realized through data mining technology [16]. Since the modal characteristics are directly related to the structure stiffness, the structure stiffness is expected to change in the presence of damage. Therefore, modal-based damage identification method is the most common [17,18,19]. As the method based on operational modal analysis (OMA) requires recognition of high-order mode shapes, it is considered insensitive to early damage [20].
Many techniques have been successfully applied to the extraction of structural damage-sensitive features, such as symbolic data [21], wavelet components [22], and basic signal statistics. However, since the parameters of the autoregressive (AR) model reflect the inherent characteristics of the structures, model coefficients or residual errors can be extracted through time series analysis as damage-sensitive features [23]. In addition, the AR model only depends on the response of the structure, so it is widely used in the field of damage identification. Autoregressive with exogenous input (ARX) [24], autoregression and autoregression of exogenous input (ARARX) [25], autoregressive moving average (ARMA) [26], autoregressive moving average and exogenous input (ARMAX) [27] are also used for feature extraction as time series models.
The damage detection techniques generally distinguish structural responses under environmental and operational variations (EOV) from those induced by damage through feature modeling [28]. Regression-based methods (such as multiple linear regression [29,30]) or only based on latent variables (such as principal component analysis [18,20]) are widely used in feature modeling. For the data-driven methods, feature discrimination aims at classifying the features as healthy or damaged by supervised or unsupervised learning algorithms, where statistical process control [22] or multi-layer perceptron (MLP) neural network [31] belongs to supervised learning algorithms. Since there is little or no data obtained from damaged structures, unsupervised learning algorithms such as novelty detection methods have been widely studied and applied [32]. As a novelty detection technology, outlier analysis can identify whether the structure is damaged by fitting the data under baseline conditions with a probability distribution and then testing whether the new data conforms to the same distribution [33].
Although most SHM methods use environmental excitation or free vibration signals for analysis, some studies use the vehicle-induced response for bridge damage identification. Under an unknown moving load, Cavadas et al. [29] collected displacement and rotation data from the beam frame. By defining baseline data, outlier analysis is used to identify data beyond the baseline range as damaged data. The method successfully detected a 20% stiffness reduction of a beam element with a length of 30 cm, but its limitation is that only a single load is considered. Gonzalez and Karoumi [33] used the machine learning model based on artificial neural networks (ANN) and Gaussian processes to train the deck accelerations and bridge weigh-in-motion data so as to classify the data as healthy or damaged. Nie et al. [34] proposed a damage detection method using two sensors. The local damage index is defined using the cross-correlation coefficient between the measured responses, and the effectiveness of the proposed method is verified by the simply supported beam experiment in the laboratory. Although this field has been extensively studied, there are still few cases of damage detection based on train-induced dynamic response. The environmental and operational variations in structural response are often ignored in most damage detection methods, the damage types of structure are limited, the load excitation is very specific, and the vehicle-bridge coupling effect is rarely considered. In addition, the bridges are simply modeled as Euler–Bernoulli beams, which limits their usability in real and complex bridges.
In this study, when a train passes through the 32 m simply supported box girder with two lanes, the train load is distributed eccentrically. Under the action of the bending-torsion coupling effect, the deformation of the box girder does not conform to the assumption of the plane section, and it cannot be simplified as an Euler–Bernoulli beam model [1]. Therefore, the FEM is modeled using solid elements, a multi-body dynamics model of the train-track-bridge system is established, and the strain responses of different components of each key section are extracted by simulating the operation of the high-speed train.
This paper proposes a damage detection method based on the train-induced responses of the high-speed railway box girder. Under the coupling effects of bending and torsion, the traditional damage detection method based on the Euler beam theory cannot be applied. In this research, the box girder section is divided into different components based on the plate element analysis method. The FEM verified by experiments was used to simulate the baseline and damage conditions. In addition, the effects of noise, different train speeds, different train weights, and vertical track irregularity are considered under all conditions. The numerical simulation results show that the proposed method in this paper can effectively identify, locate and quantify the damage, which verifies the accuracy of the proposed method.
The rest of the paper is organized as follows. Section 2 firstly introduces the method of removing the principal component of train-induced responses, then describes the residual error of the AR model used as a damage feature in feature extraction, and finally introduces the outlier analysis based on a newly proposed damage index. Section 3 presents the numerical simulation of a typical 32 m simply supported box girder of a high-speed railway, which verifies the accuracy and robustness of the proposed method. Some conclusions are finally drawn in Section 4. The framework of the proposed method is shown in Figure 1.

2. Damage Detection Methodology

2.1. Analysis of the Removal of Principal Components

In order to separate environmental and operational variations (EOV) from dynamic train-induced responses and obtain the main damage-sensitive features, principal component analysis [18] was used in this paper for feature modeling, and some related studies have shown that PCA can effectively remove the effects of EOV [35,36].
The PCA model can be written as [18]
Y k × n = X k × n T n × n
where X is the response time-series data,  Y  is the principal components of X, k is the number of passing trains, and n is the length of strain signal, T is an n-by-n orthonormal linear transformation matrix.
The covariance matrix of the X in the baseline condition, C, which can be expressed as
C = T Λ T
where  T  and  Λ  are matrixes obtained by the singular value decomposition of the covariance matrix of X.
Since the purpose of this research is to detect damage with local characters, the feature modeling procedure involves removing the most significant principal components from the features and retaining the remaining components for subsequent statistical analysis. The matrix  Λ  can be divided into a matrix with the first p eigenvalues and a matrix with the remaining m-p eigenvalues, where m is the dimension of the matrix  Λ . In this study, the value of p is determined based on the rule of thumb in which the cumulative percentage of the variance reaches 80% [9].
After the value of p is determined, the first p component of matrix Y can be remapped to the original space using the following formula [9]:
X p = X T ^ T ^ T X ~ = X X p
where  T ^  is the first p columns of  T , and  X ~  is the strain time domain signals after removing the principal component  X p . After preprocessing the signals of all conditions, Equation (4) can be obtained:
X ~ b a s e l i n e = X b a s e l i n e X p _ b a s e l i n e X ~ d a m a g e d = X d a m a g e d X p _ b a s e l i n e

2.2. Feature Extraction

In the field of structural health monitoring (SHM), time series analysis attempts to fit mathematical models with time series data, and the AR models are widely used to extract damage-sensitive features of structures [37].
The AR(m) model can be written as [37]
x j = i = 1 m a i x j i + ε j
where  x j , j = m + 1 , m + 2 , m + 3 , , n  is the response time-series data from  X ~  in Equation (3), m is the number of AR parameters in Equation (5),  ε j  is the residual error of the signal  x j .
According to Equation (5), the matrix form of n-m algebraic equations can be expressed as
S = H w + ε x m + 1 x m + 2 x n = x 1 x 2 x m x 2 x 3 x m + 1 x n m x n m + 1 x n 1 a m a m 1 a 1 + ε m + 1 ε m + 2 ε n
where  S H ε  represent the dependent variable, independent variable, and model residual of the AR model in this study. Here, the current vector of the response,  S , is defined as a linear combination of the m previous response vectors  H  multiplied by AR constant parameters  w ε  is an unobservable random error (or residual error).
In undamaged and damaged conditions, AR parameters were extracted from the time domain signals after removing the principal component for each sensor, respectively, and then the vector of model residuals  ε ^  under the baseline and damage state was used as damage characteristics.
ε ^ = S S ^ = S H w ^

2.3. Outlier Analysis Based on a Newly Proposed Damage Index

In this study, a new index has been proposed to indicate the damage characteristics of box girder structures. Damage features (DF) is defined as the difference between fit ratios (FR), as shown in Equations (8) and (9):
F R 1 = s m e a s u r e d _ b a s e l i n e s ^ r e c o n s t r u c t e d _ b a s e l i n e s m e a s u r e d _ b a s e l i n e F R 2 = s m e a s u r e d _ d a m a g e d s ^ r e c o n s t r u c t e d _ d a m a g e d s m e a s u r e d _ d a m a g e d
D F = F R 2 F R 1 F R 2 × 100
where  s m e a s u r e d _ b a s e l i n e s ^ r e c o n s t r u c t e d _ b a s e l i n e  are the measured and reconstructed output from the data set for baseline conditions, respectively. In addition,  s m e a s u r e d _ d a m a g e d s ^ r e c o n s t r u c t e d _ d a m a g e d  are the measured and reconstructed output from the data set for damaged conditions, respectively.
The DF values are linear transformations of the residuals, which is approximately subject to a normal distribution, and outlier analysis can be performed based on statistical threshold [38,39]. Under this assumption, the confidence boundary (CB) of DF constituting outliers can be estimated by the Gaussian inverse cumulative distribution function (ICDF). The average value of the baseline feature vector is  μ , the standard deviation is  σ , and the significance level is  α . The inverse function can be defined according to the Gaussian cumulative distribution function as follows [9]:
C B = i n v F ( 1 α )
where
F x / μ , σ = 1 σ 2 π α x e 1 2 x μ σ 2 d y , f o r x
Therefore, when DF is equal to or greater than CB, the feature can be considered an outlier.

3. Numerical Simulation and Validation of the Proposed Algorithm

3.1. FEM of the Widely Used Simply Supported Box Girder

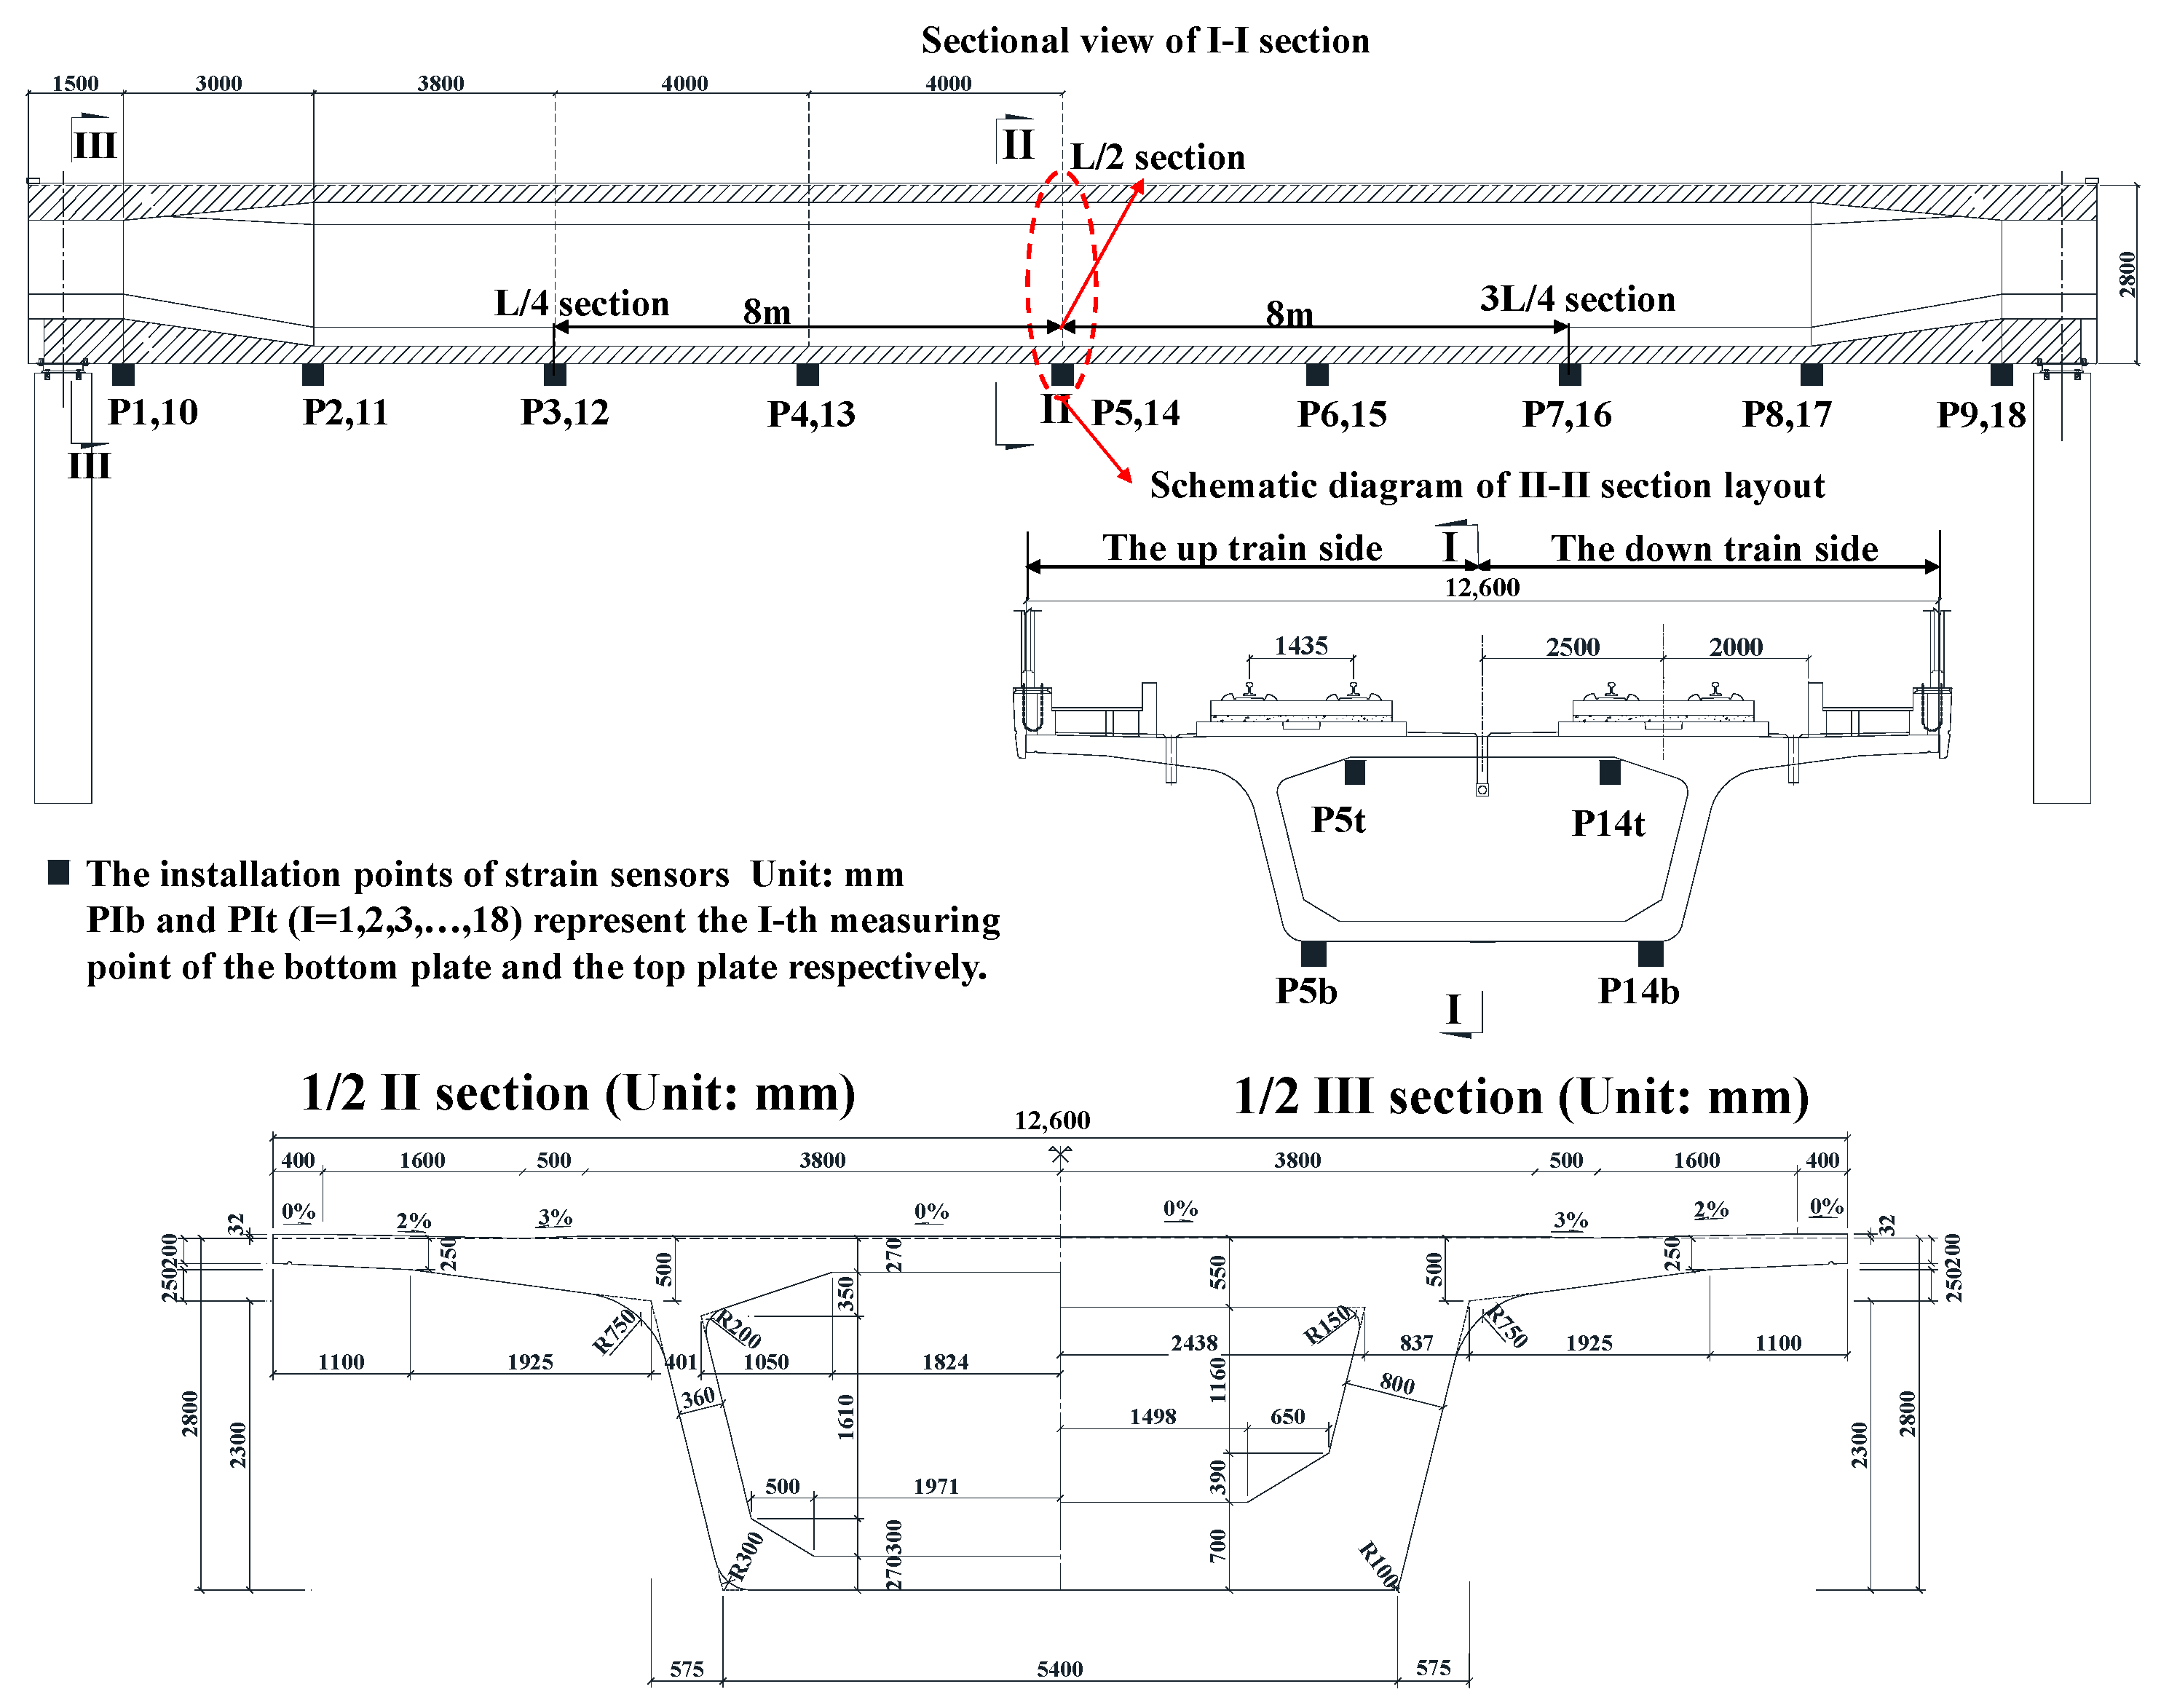
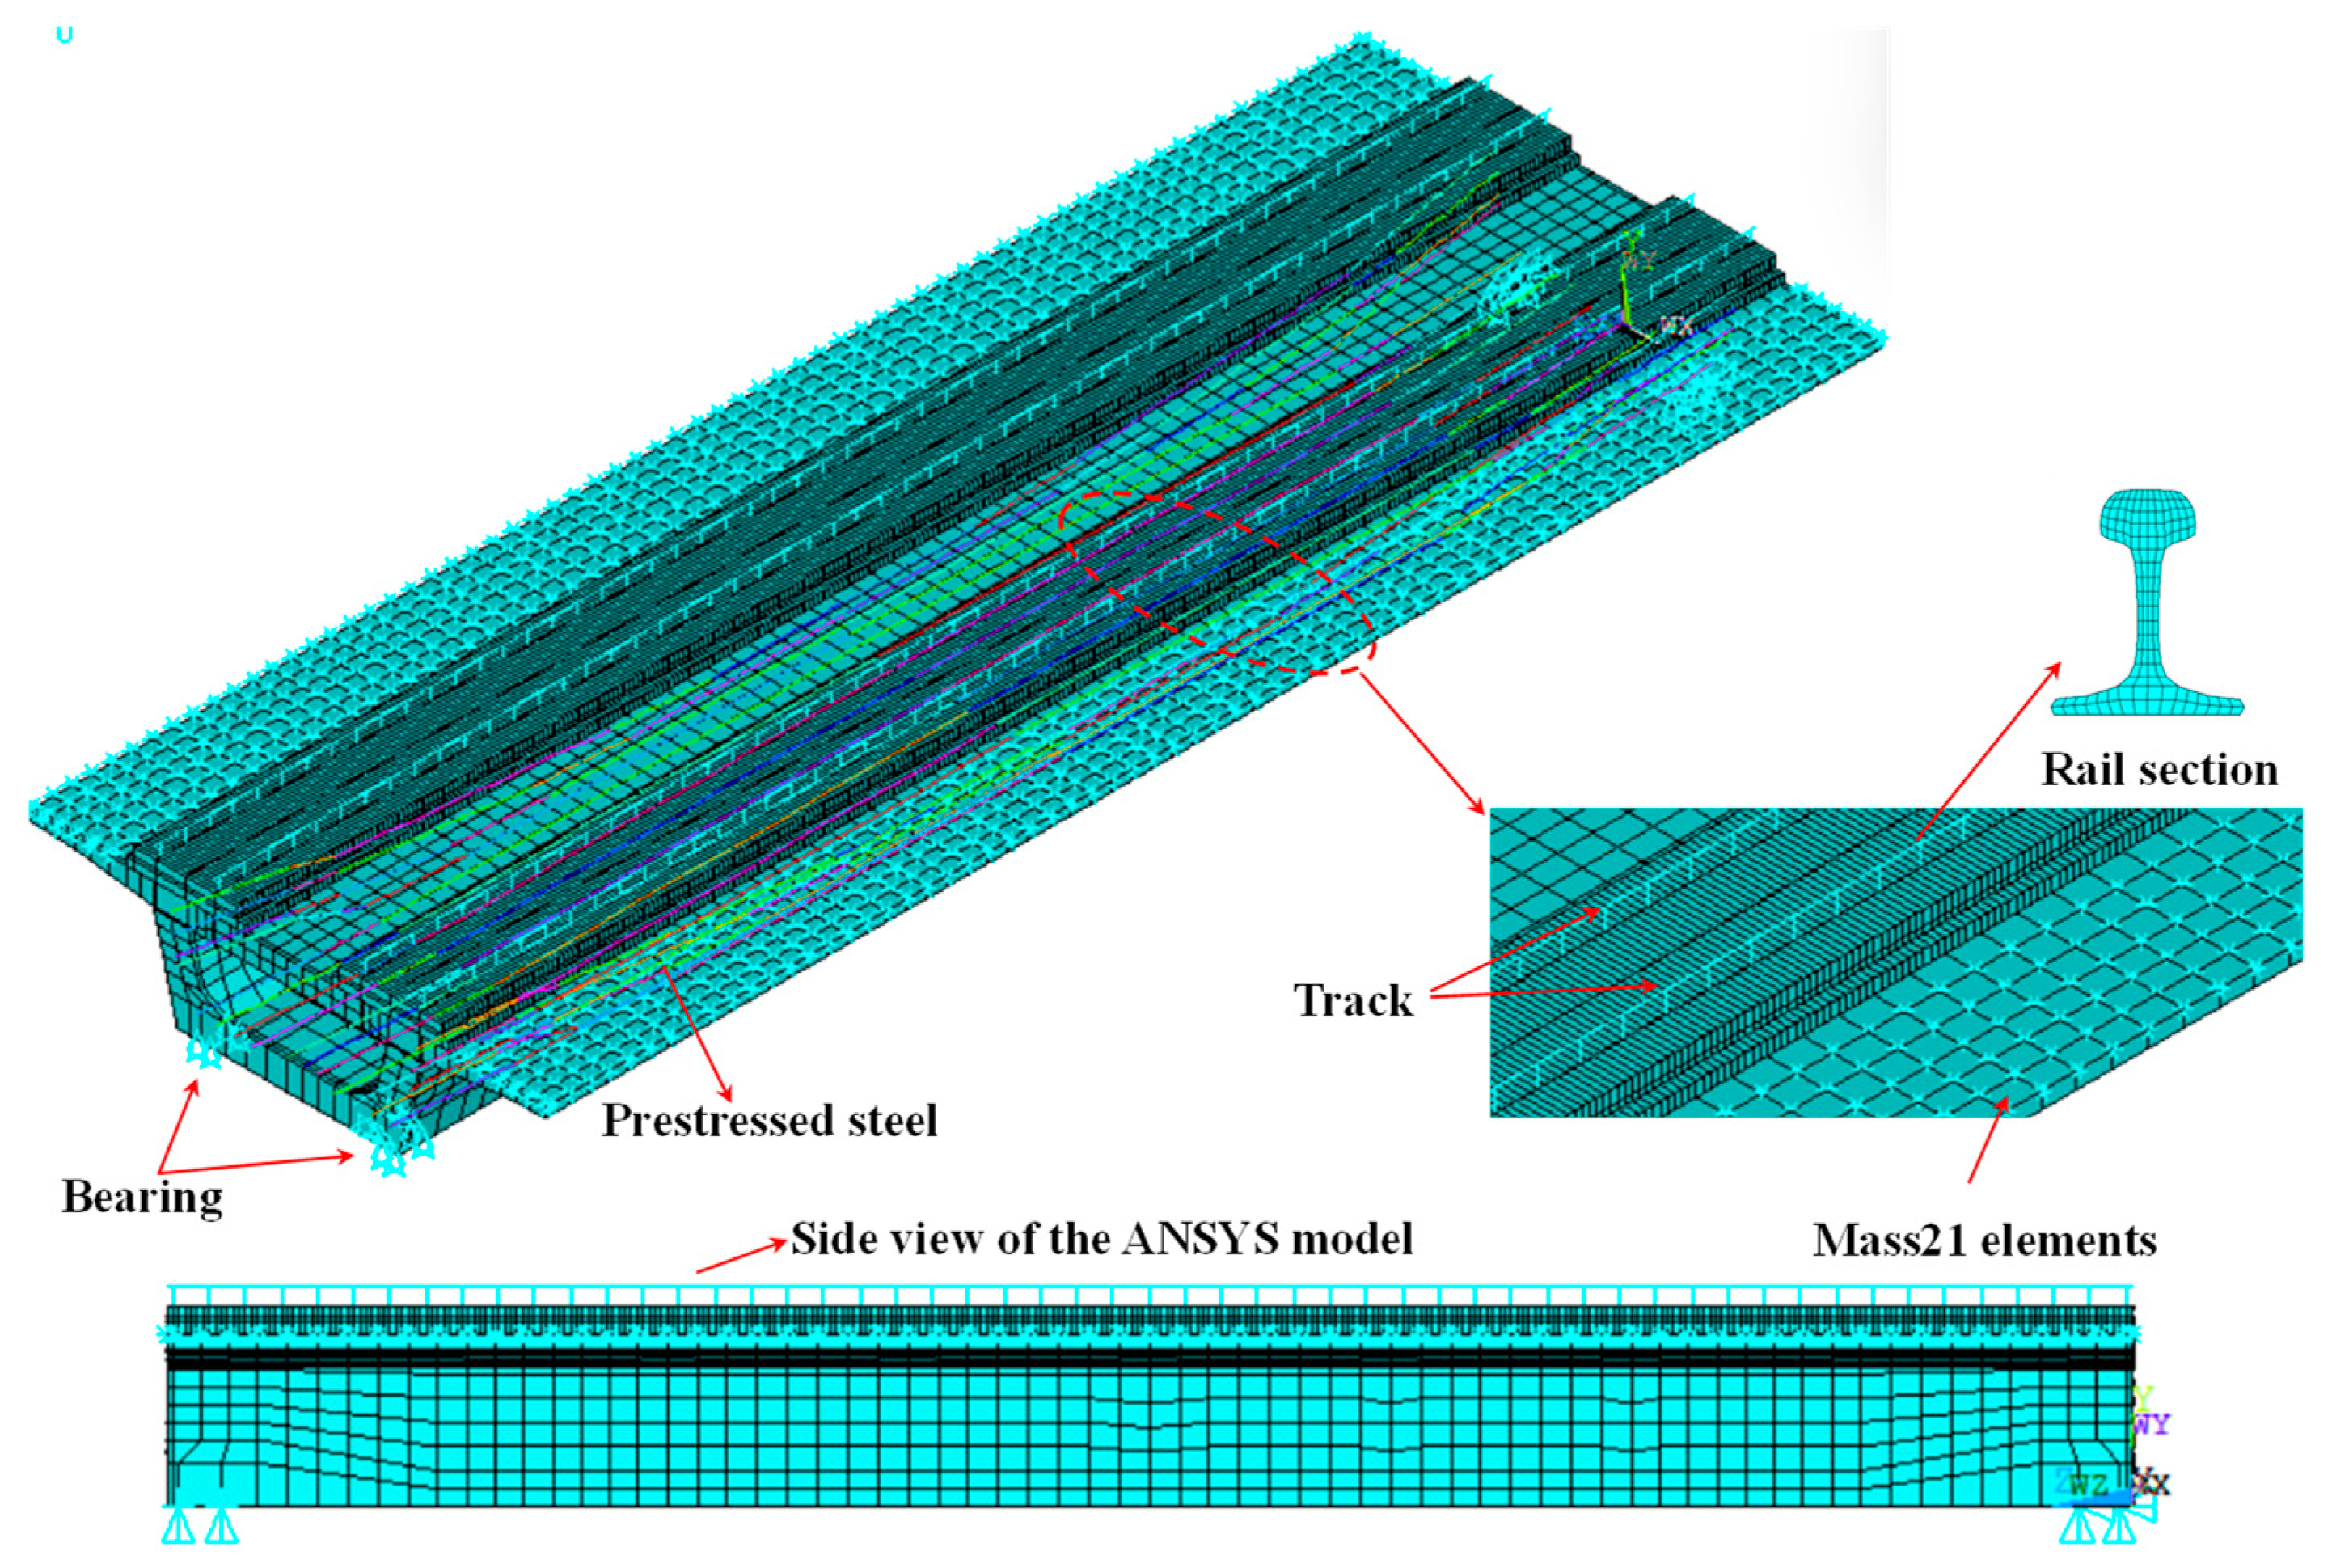
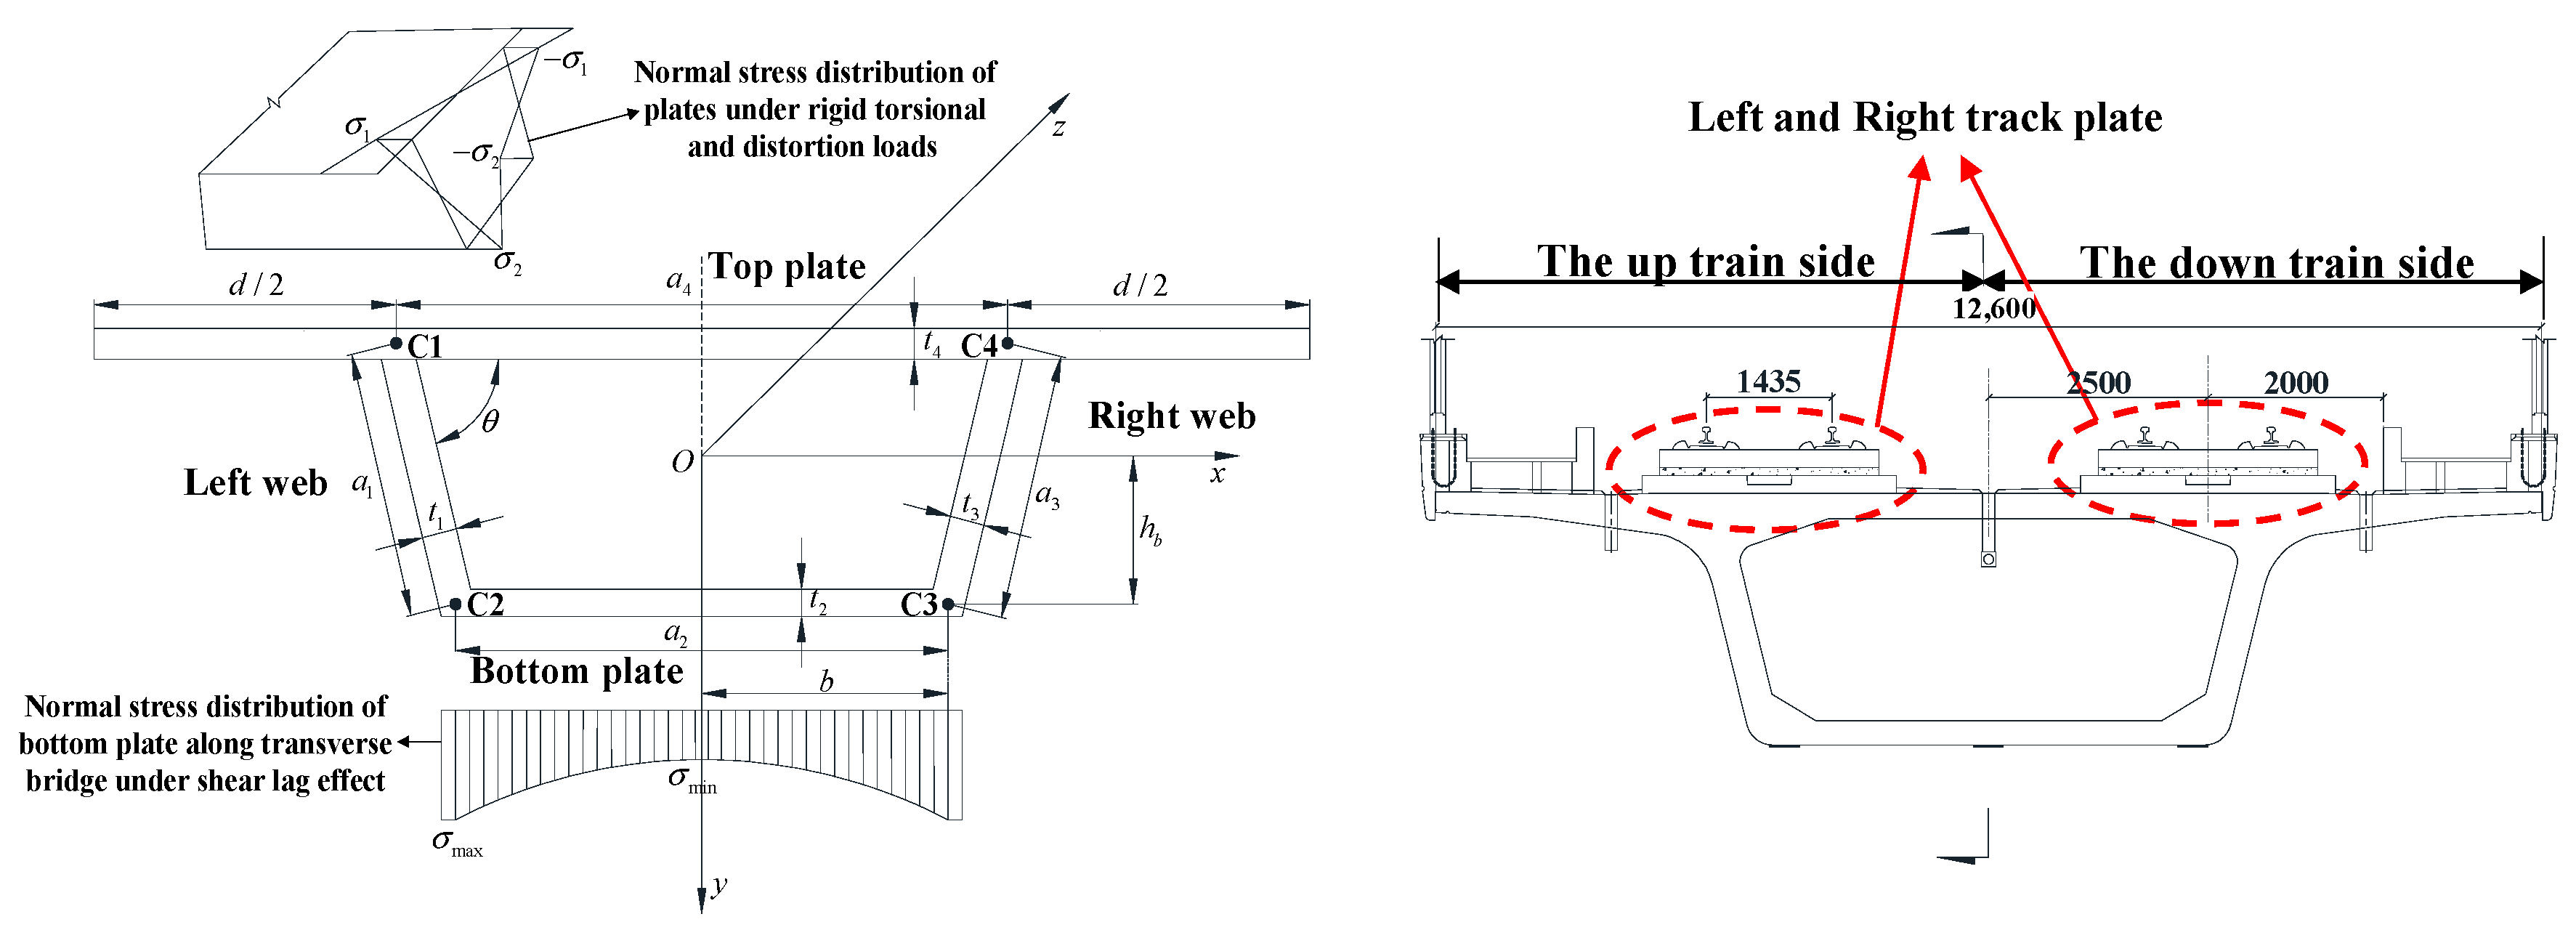
For the 32m simply supported box girder widely used in high-speed railways, in the author’s research in reference [1], Wang et al. [1] established its three-dimensional (3D) FEM with ANSYS software and described the modeling process of each component in detail, including the main girder, prestressed steel, and track plate. In their study, the design drawings and sensor layout of the box girder was shown in Figure 2. The FEM is updated according to the measured data of the dynamic load test. The 3D FEM was established, as shown in Figure 3. The detailed parameters in FEM are shown in Table 1.
Universal Mechanism (UM) is a large general-purpose multi-body system dynamics simulation software that has been widely used in railway transportation, highway transportation, aerospace, and other fields. Wang et al. [1] imported the ANSYS FEM into UM software and established a multi-body dynamics model of the train-track-bridge system of high-speed railways. Due to the fact that the stiffness constraints of the bearings from the ANSYS FEM cannot be imported into UM software, stiffness constraints are imposed on the bearing area of the investigated bridge in the UM for support simulation. The track was modeled as a continuous elastic foundation beam, and the foundation below the rails was regarded as a connection of parallel and series linear spring damping systems in the vertical and transverse directions in UM. As shown in Figure 3, the track model is established in ANSYS according to the design parameters of a high-speed railway track.
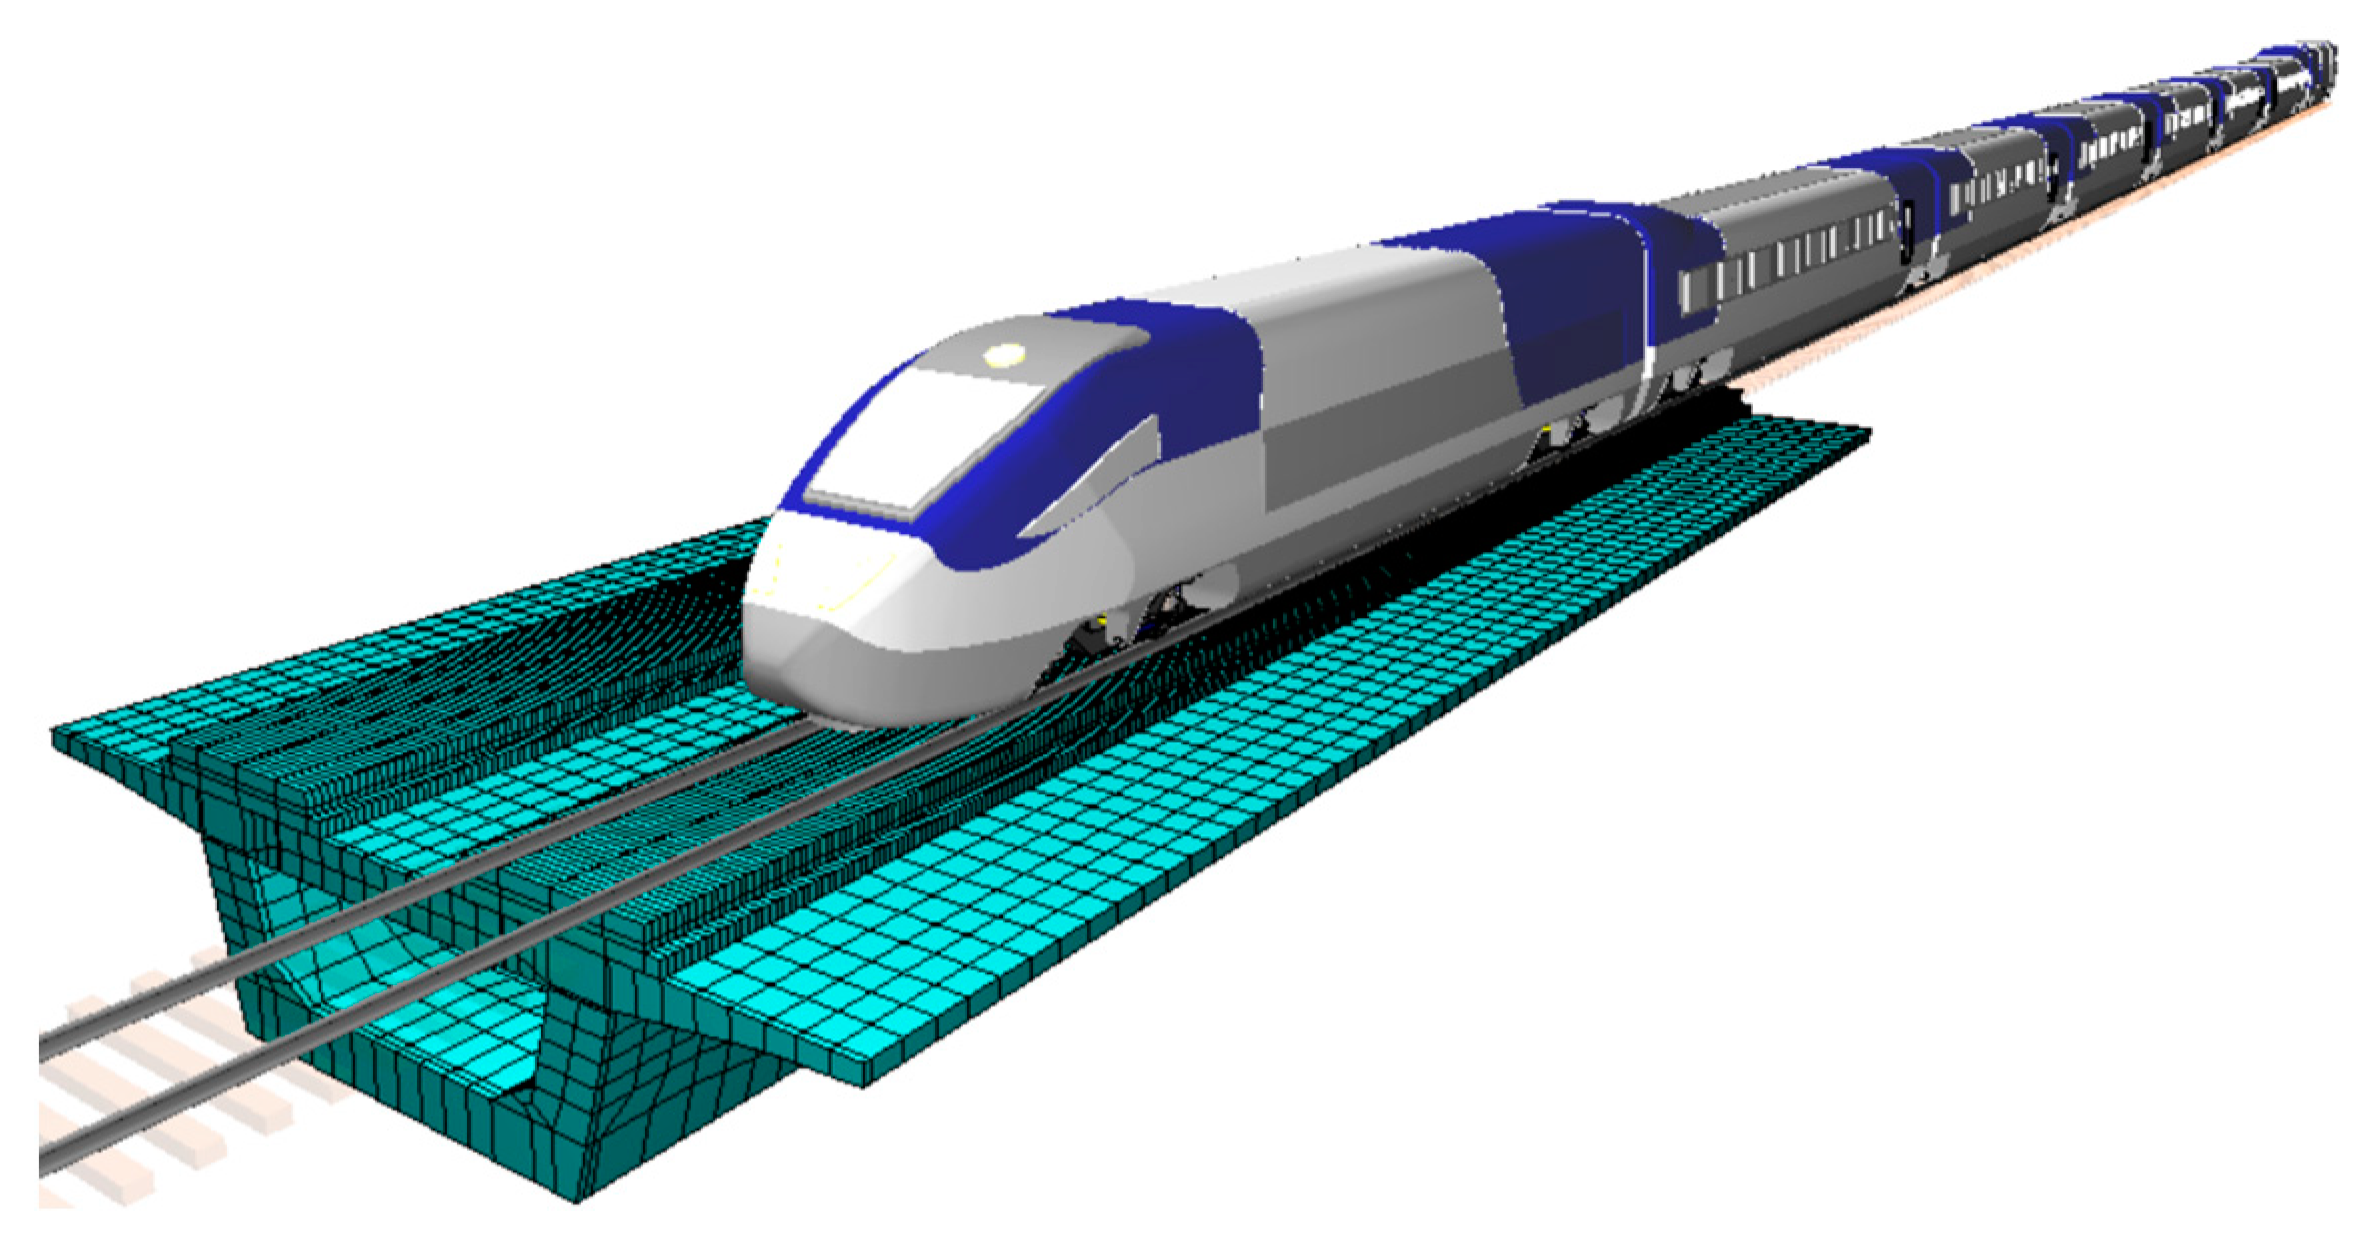
Figure 4 shows a schematic diagram of the multi-body dynamics model in UM when the CRH380 high-speed train passes through the investigated 32 m box girder. The train body, bogie, and wheelsets of the CRH380 were modeled as rigid bodies in accordance with China’s High-Speed Railway Code in UM, which were connected with each other through the primary and secondary suspension system as described by Wang et al. [1]. The high-speed train consists of four motor carriages and four trailers, which are simplified as M and T, respectively, in Figure 5. The detailed parameters of high-speed trains are shown in Table 2. Under full load conditions, the high-speed train can carry 556 passengers with a standard weight of 80 kg/person.

3.2. Realistic Simulation of Damage Conditions

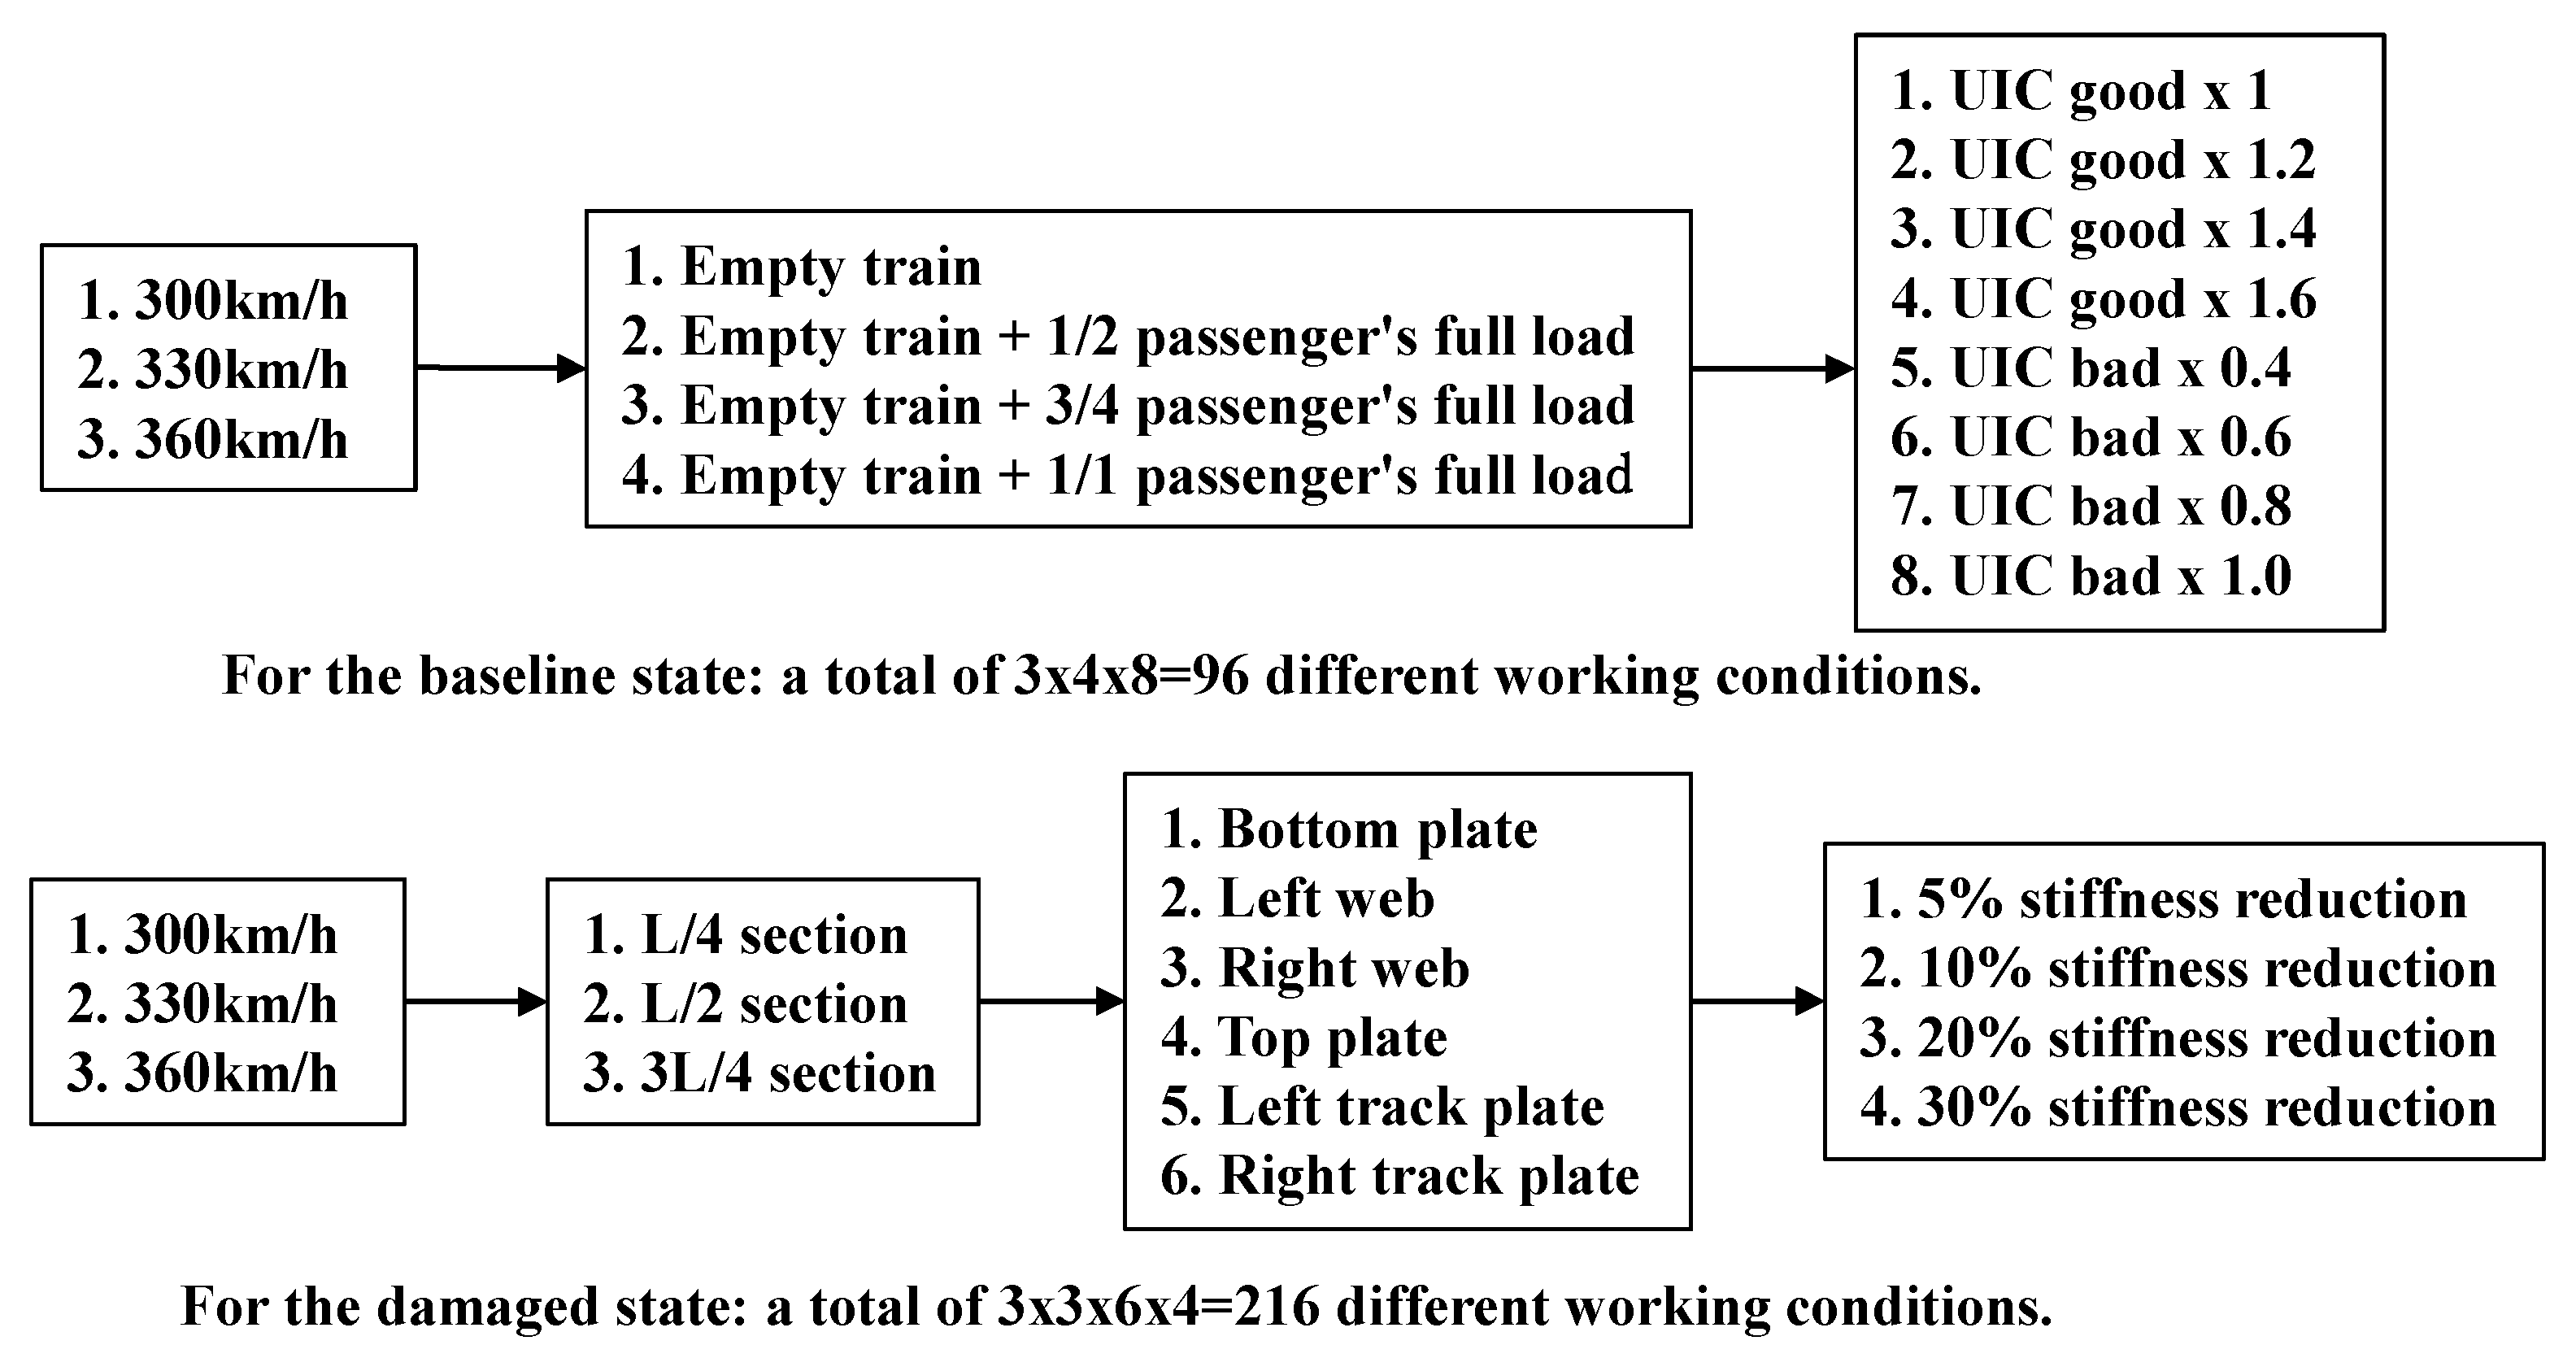
Since it is not possible to simulate damage conditions through field experiments, numerical simulations of healthy (baseline) and damage conditions were carried out to verify the proposed method in this paper. After verifying the method, it can be directly applied to the field monitoring data of high-speed railway box girder. Figure 6 shows the various combinations of conditions at baseline and damaged state.
As shown in Figure 6, supposing that CRH380 high-speed train passes through the investigated box girder at different speeds in UM software for numerical simulation. For the baseline state, four different train weights conditions are set in UM, and eight different vertical irregularity spectrums of the track are considered. The International Union of Railways abbreviated as UIC. The UIC good and UIC bad in Figure 6 represent the low-interference spectrum and high-interference spectrum, respectively, which are widely used in high-speed railways and ordinary railways in Europe [40]. In summary, a total of 3 × 4 × 8 = 96 different conditions were simulated.
Similarly, As shown in Figure 6, for the damaged state, supposing that CRH380 high-speed train passes through the box girder at three different speeds. At each speed condition, three sections, L/4, L/2, and 3L/4, were used to simulate the damaged conditions. When the damaged conditions of a section were simulated, each section was divided into six components according to the criteria of plate element analysis [1]; the damage of different components of the section corresponds to different damaged conditions. In addition, the damaged conditions of each component of the section were simulated as four different stiffness reductions. In summary, A total of 3 × 3 × 6 × 4 = 216 damage conditions were simulated. At the same time, the strain responses of points 1–18 of the box girder in Figure 2 are extracted as the data set for the subsequent damage identification, and the sampling frequency is set to 1000 Hz in the numerical simulation.
The box girder section is divided into six different components based on the plate element analysis method, as shown in Figure 7. In China, the up-and-down movements of trains are centered around Beijing; the direction near Beijing is up train side, while the direction away from Beijing is the down-train side. When using the main line of the railway as the fulcrum, the direction close to the main line is the up train side, and the direction away from the main line is the down train side.

3.3. Verification of Proposed Method

In this study, since the cumulative variance percentage of the first two principal components under different baseline data sets is greater than 80%, the first two principal components are removed in the modeling process of Section 2.1 to preprocess the data for subsequent analysis of damage identification.
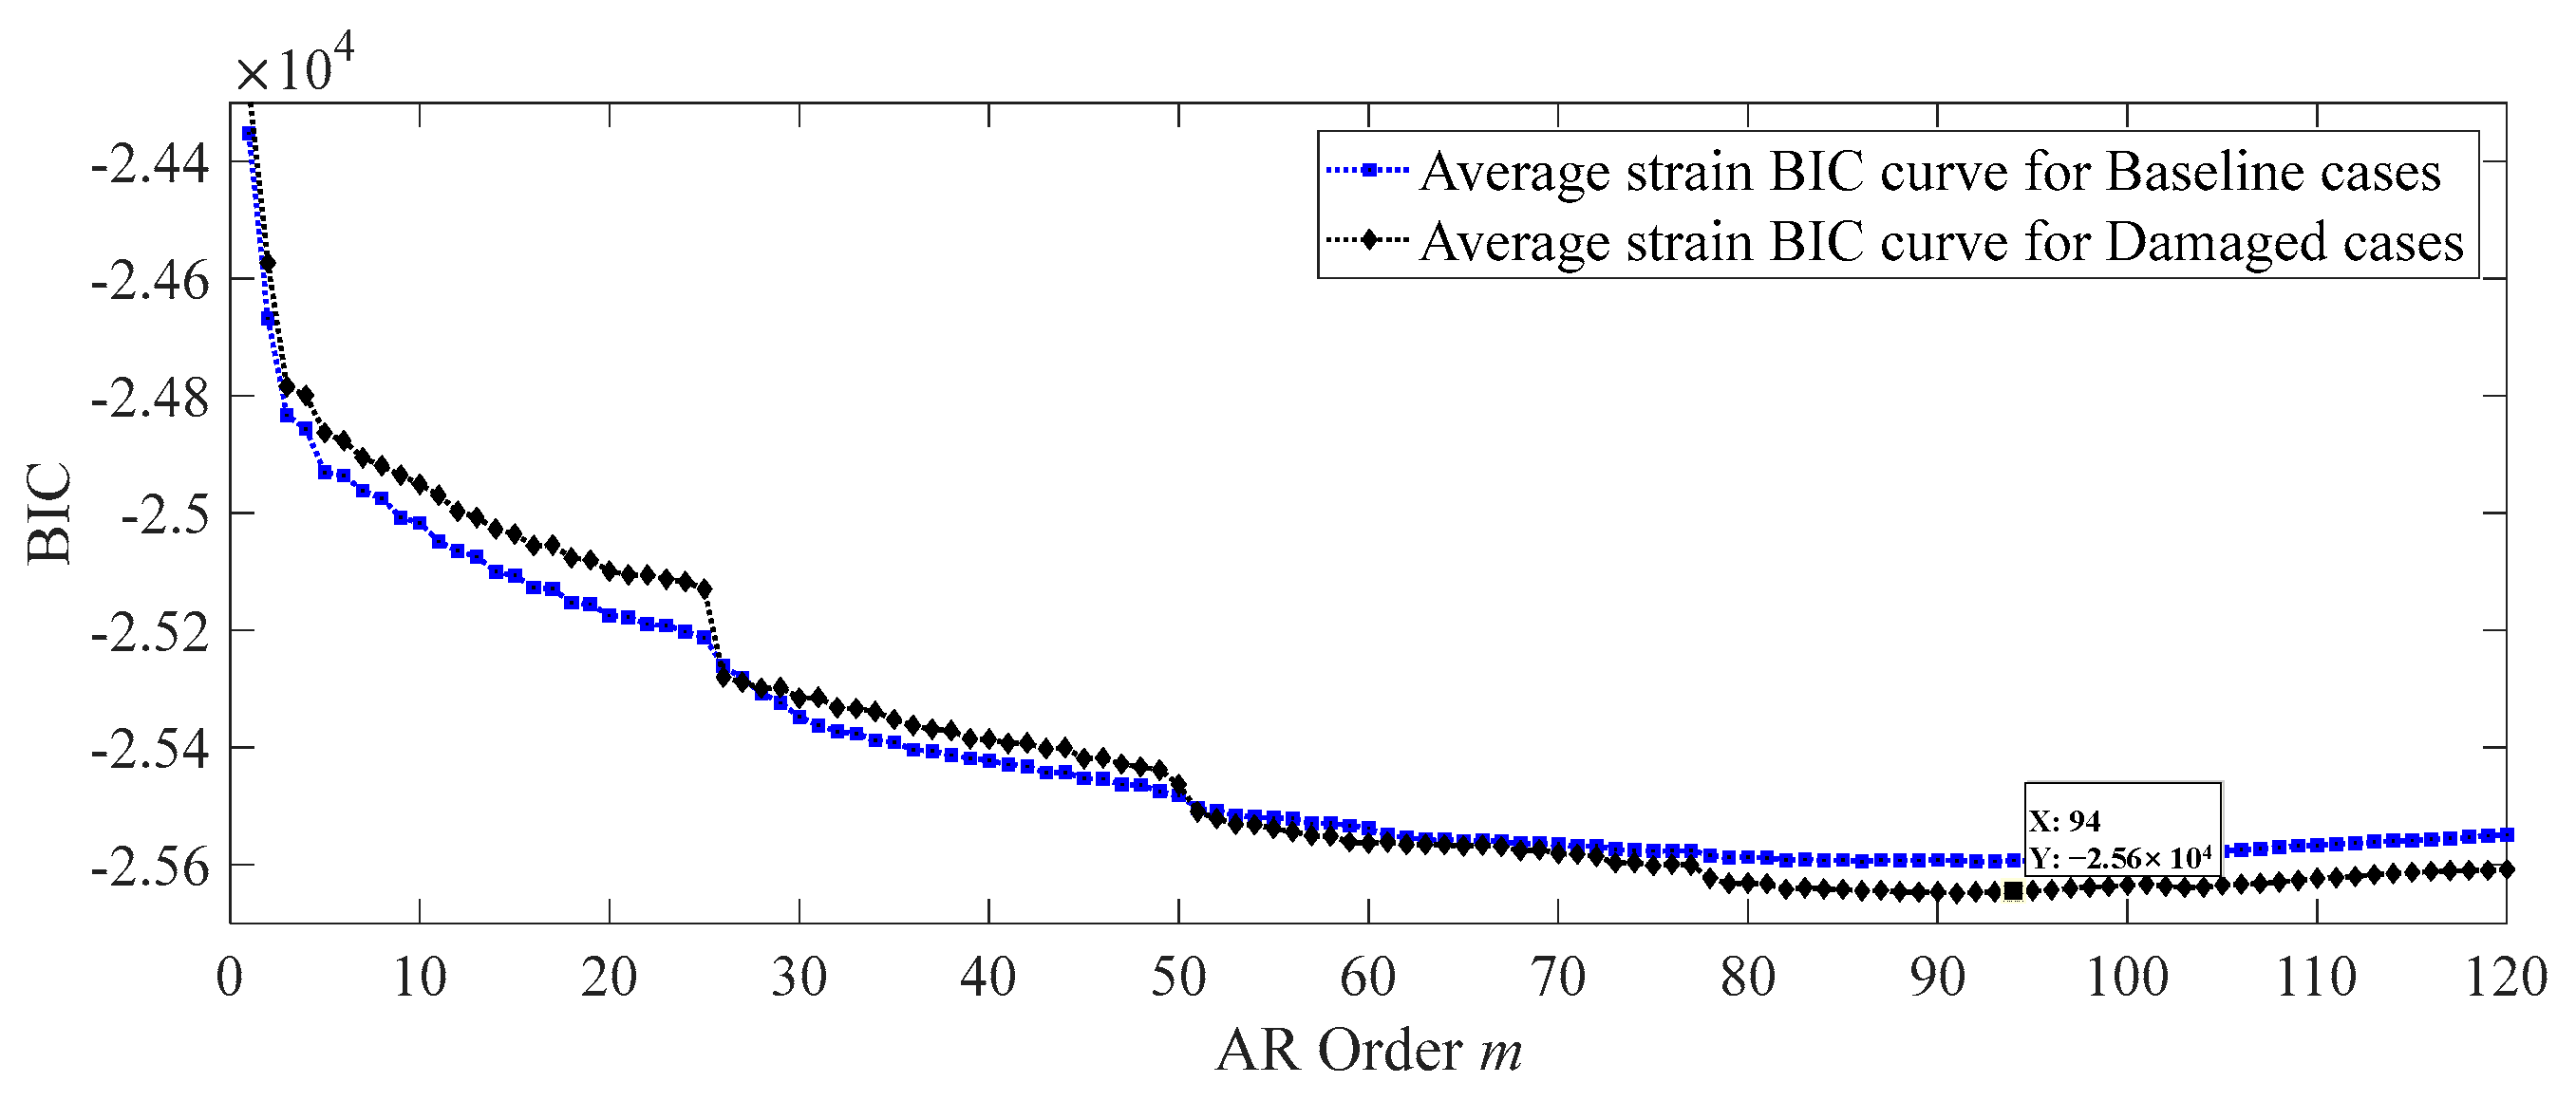
In time series analysis and feature extraction, it is very important to determine the order of the AR model. Unreasonable order will lead to insufficient or overfitting of the model. Bayesian information criteria (BIC) [41,42] is a well-known technique for determining the order of the AR model. BIC avoids overfitting the model by introducing penalty terms. In this paper, BIC is used to obtain the order of the AR model. The BIC equation can be expressed as
B I C = n ln ε ^ 2 + m ln n
where n is the number of elements in  ε ^  of Equation (7). The  m o p t  corresponding to the minimum value of BIC is used as the optimal AR order.
For the baseline and damage data sets, each sensor would get a BIC curve for each train passing condition, and the BIC curves for all train passing conditions corresponding to all sensors were averaged to obtain the two curves shown in Figure 8. The results in Figure 8 show that the optimal order of m is 94.
In this study, the CB value is finally calculated based on the Gaussian inverse cumulative distribution function (with a significance level of 1% defined) using all baseline data sets and then determining whether the structure is damaged by comparing CB and DF values. In addition, when the train speed is determined, the different train weights, vertical track irregularity, and noise level will affect the determination of the CB value. Therefore, adding the white noise to the strain response of the bridge to simulate a contaminated measurement response [41] gives:
b ~ = b + n l e v × 1 N i = 1 N b i × r a n d n ( s i z e ( b ) )
where  b ~  and  b  are the noise-contaminated and noise-free signals, respectively. N is the length of the vector  b , nlev is the noise level, and randn is the function that generates a standard normal distribution vector.
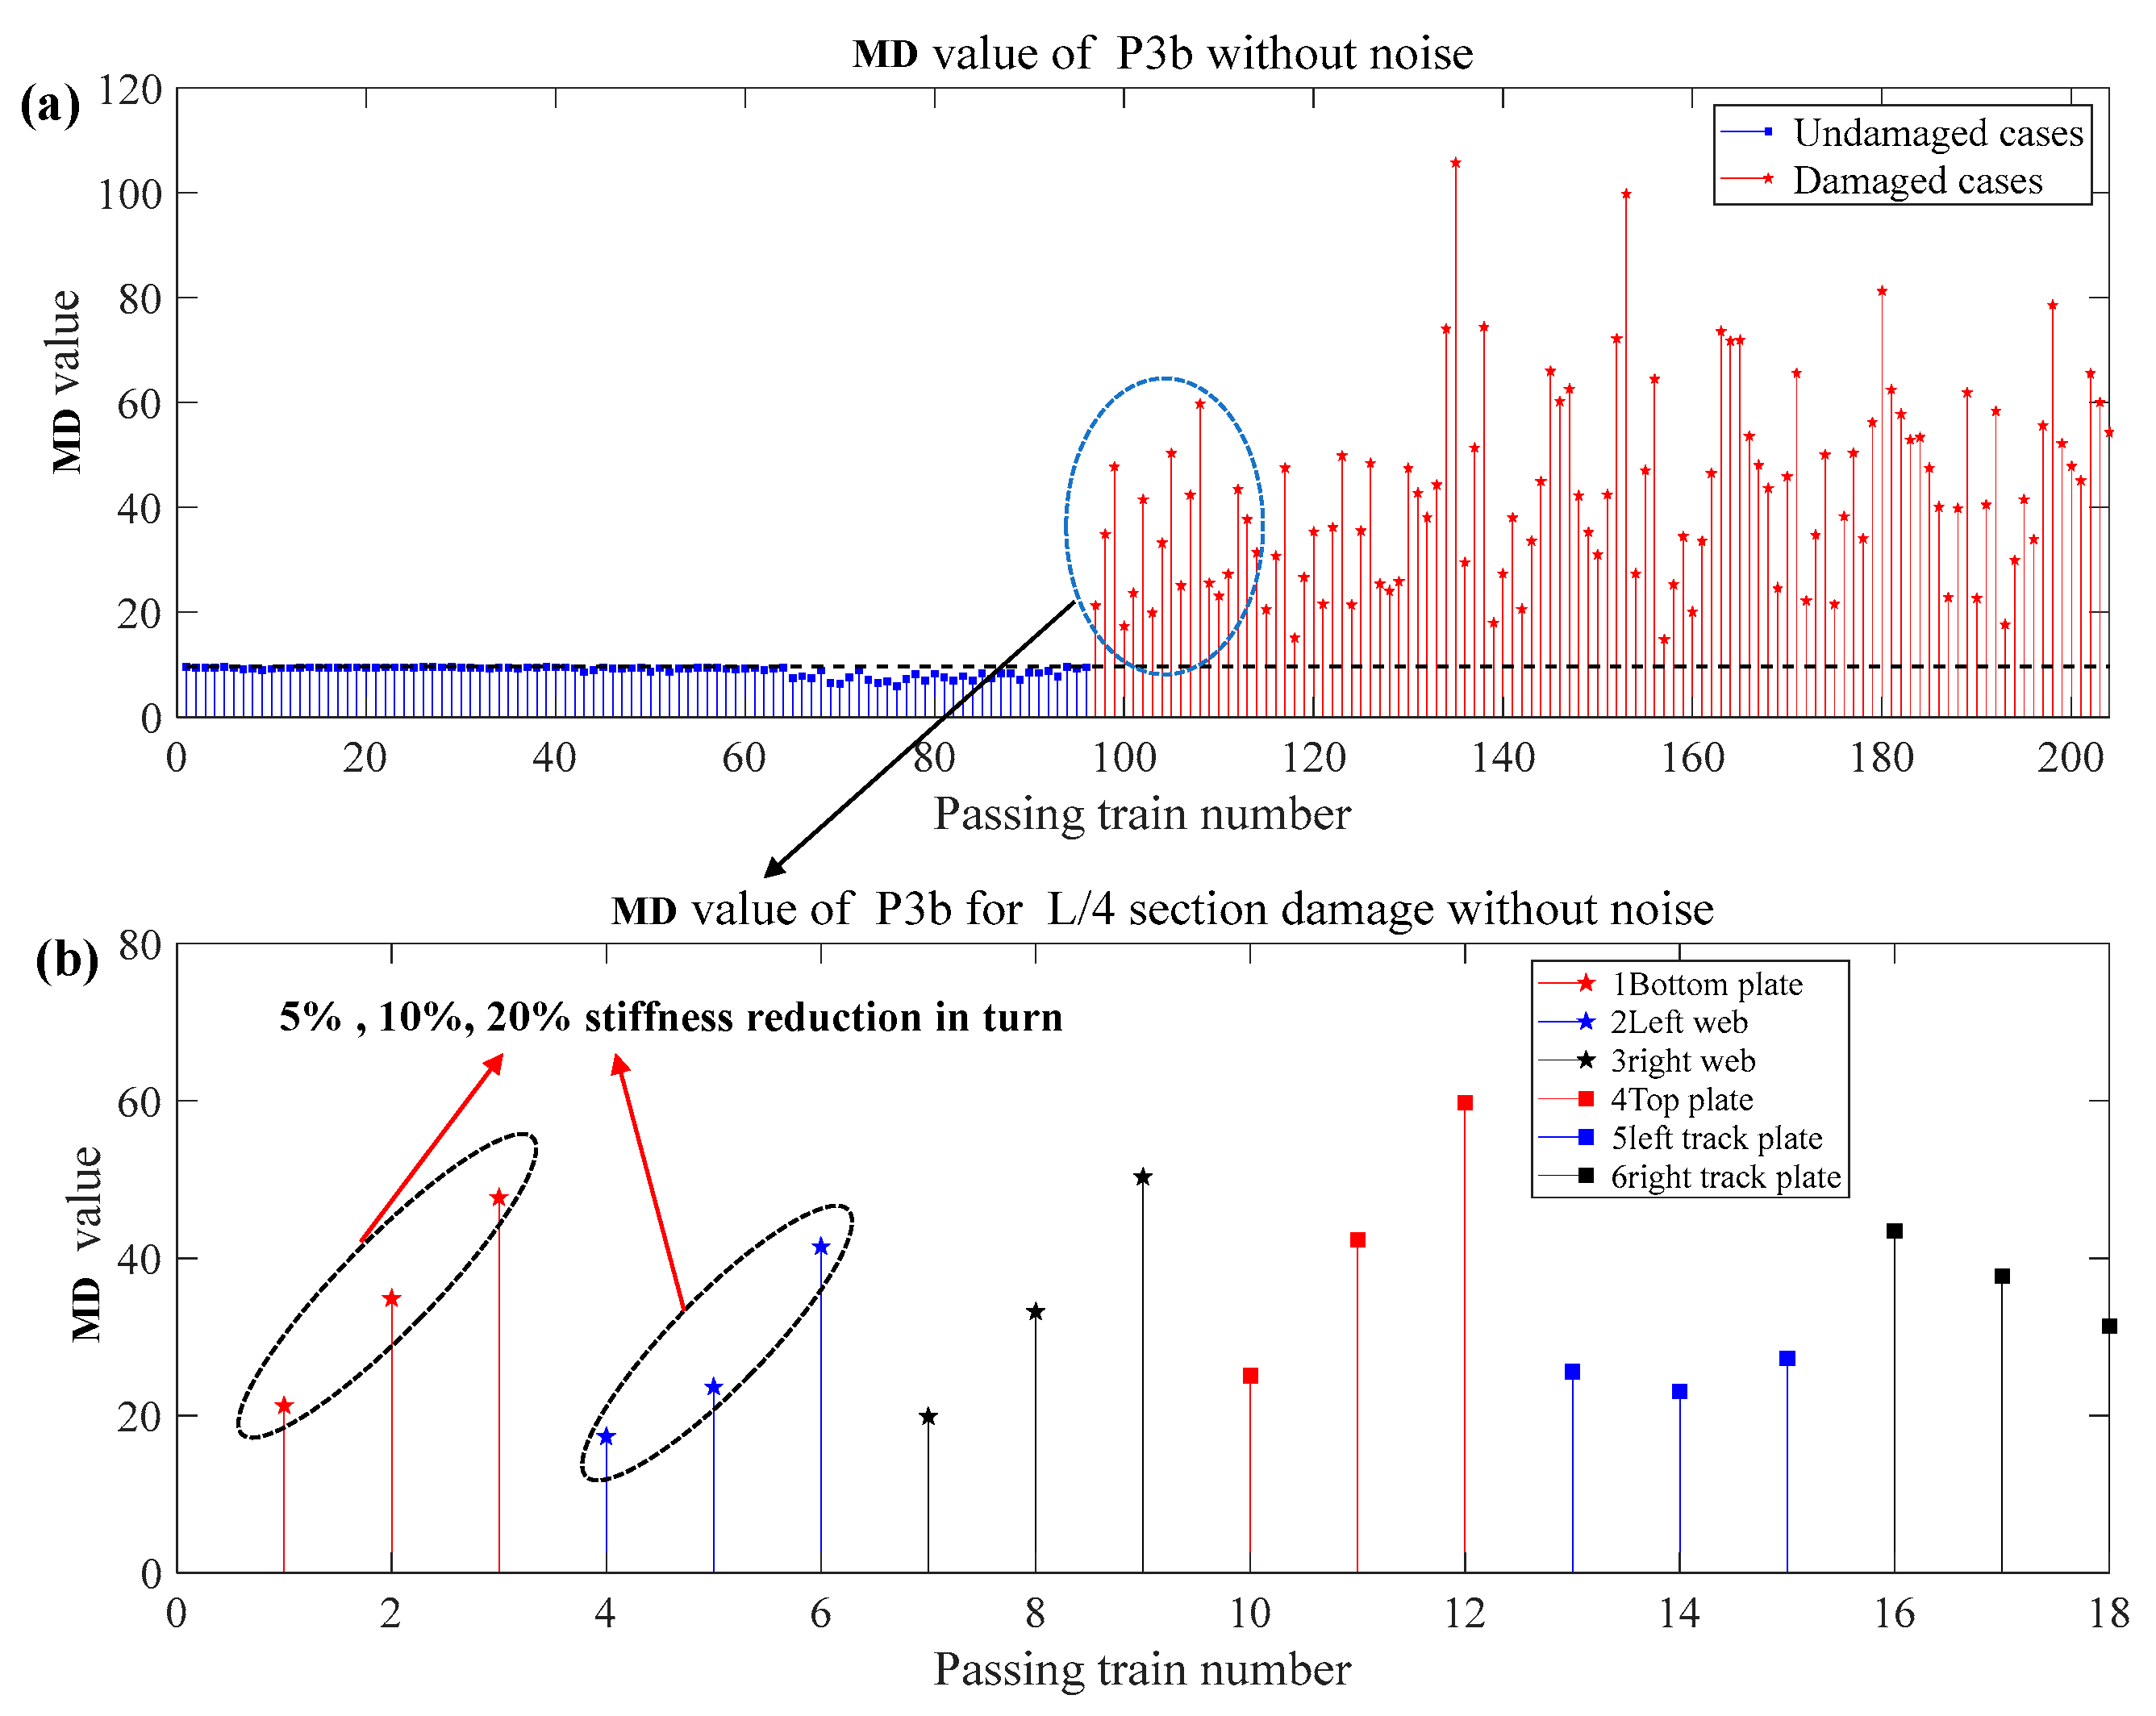
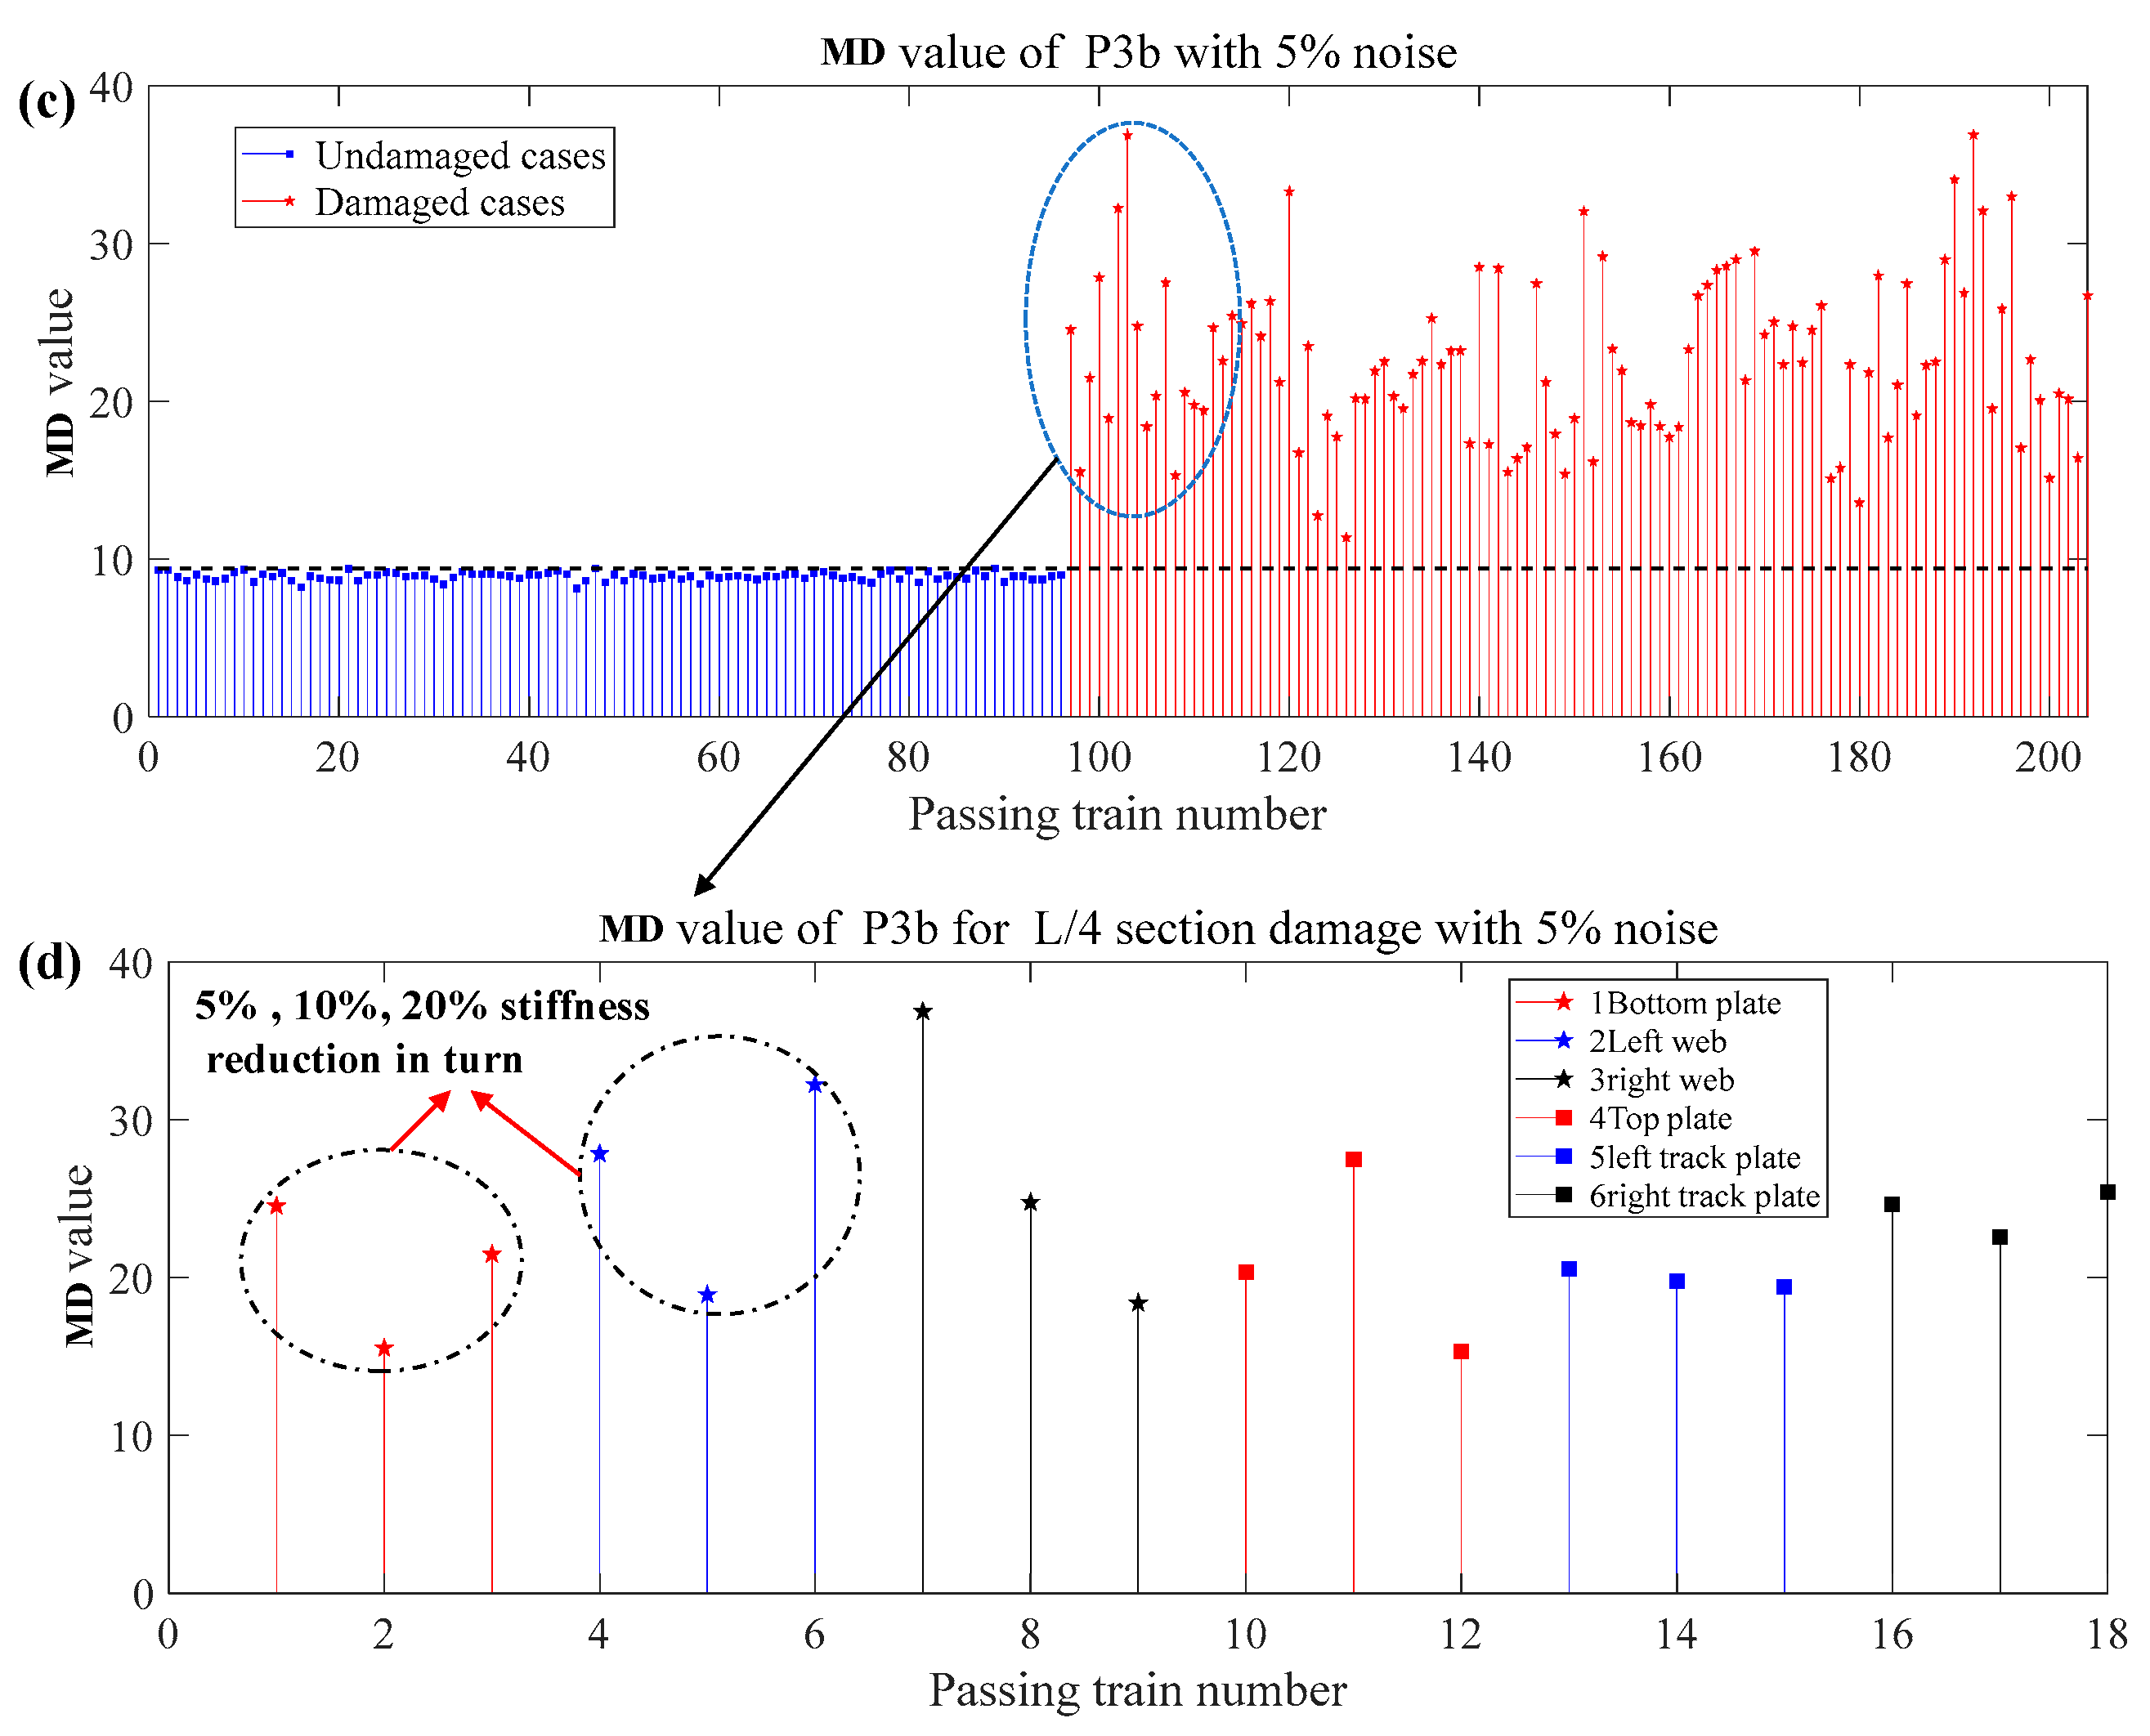
Since Mahalanobis distance (MD) is another widely used metric to perform the outlier analysis, the MD method [9] was used to identify the damage results, as shown in Figure 9. It can be seen that when there is no noise, the damage can be identified and quantified. When there is 5% noise, the quantification of the damage fails. Therefore, we hope that the method proposed in this paper can accurately identify, locate, and quantify the damage.
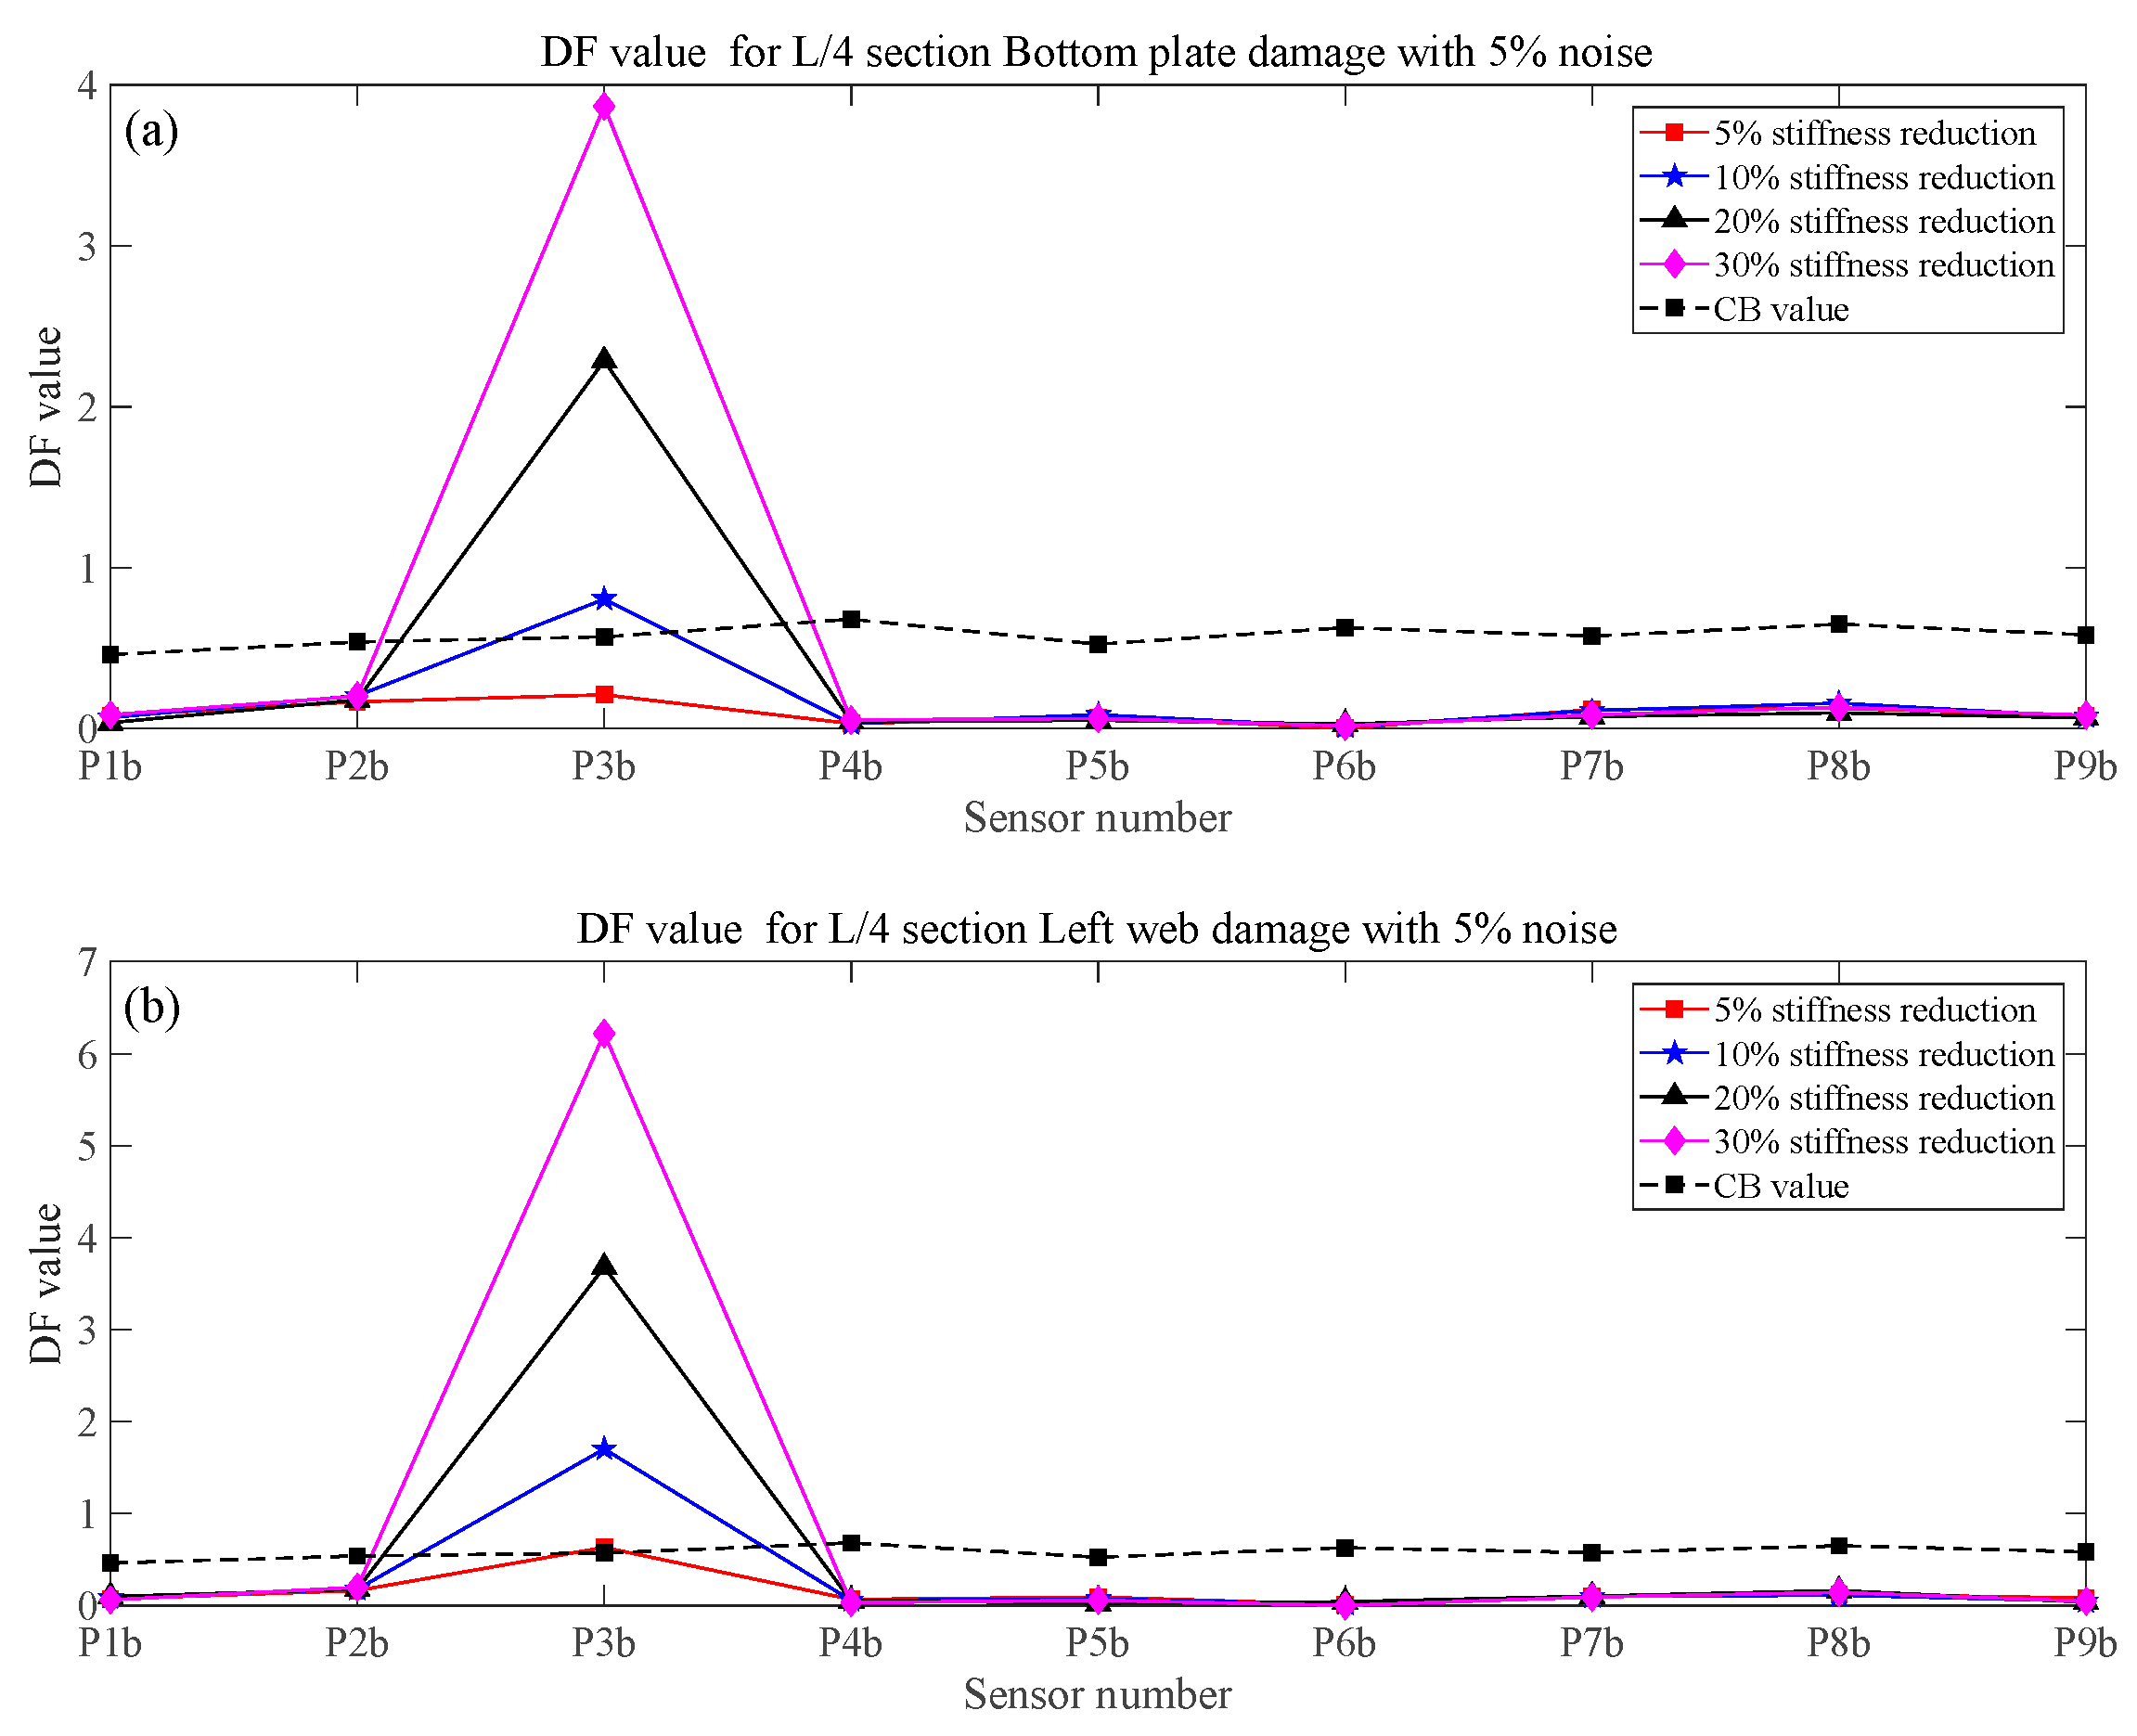
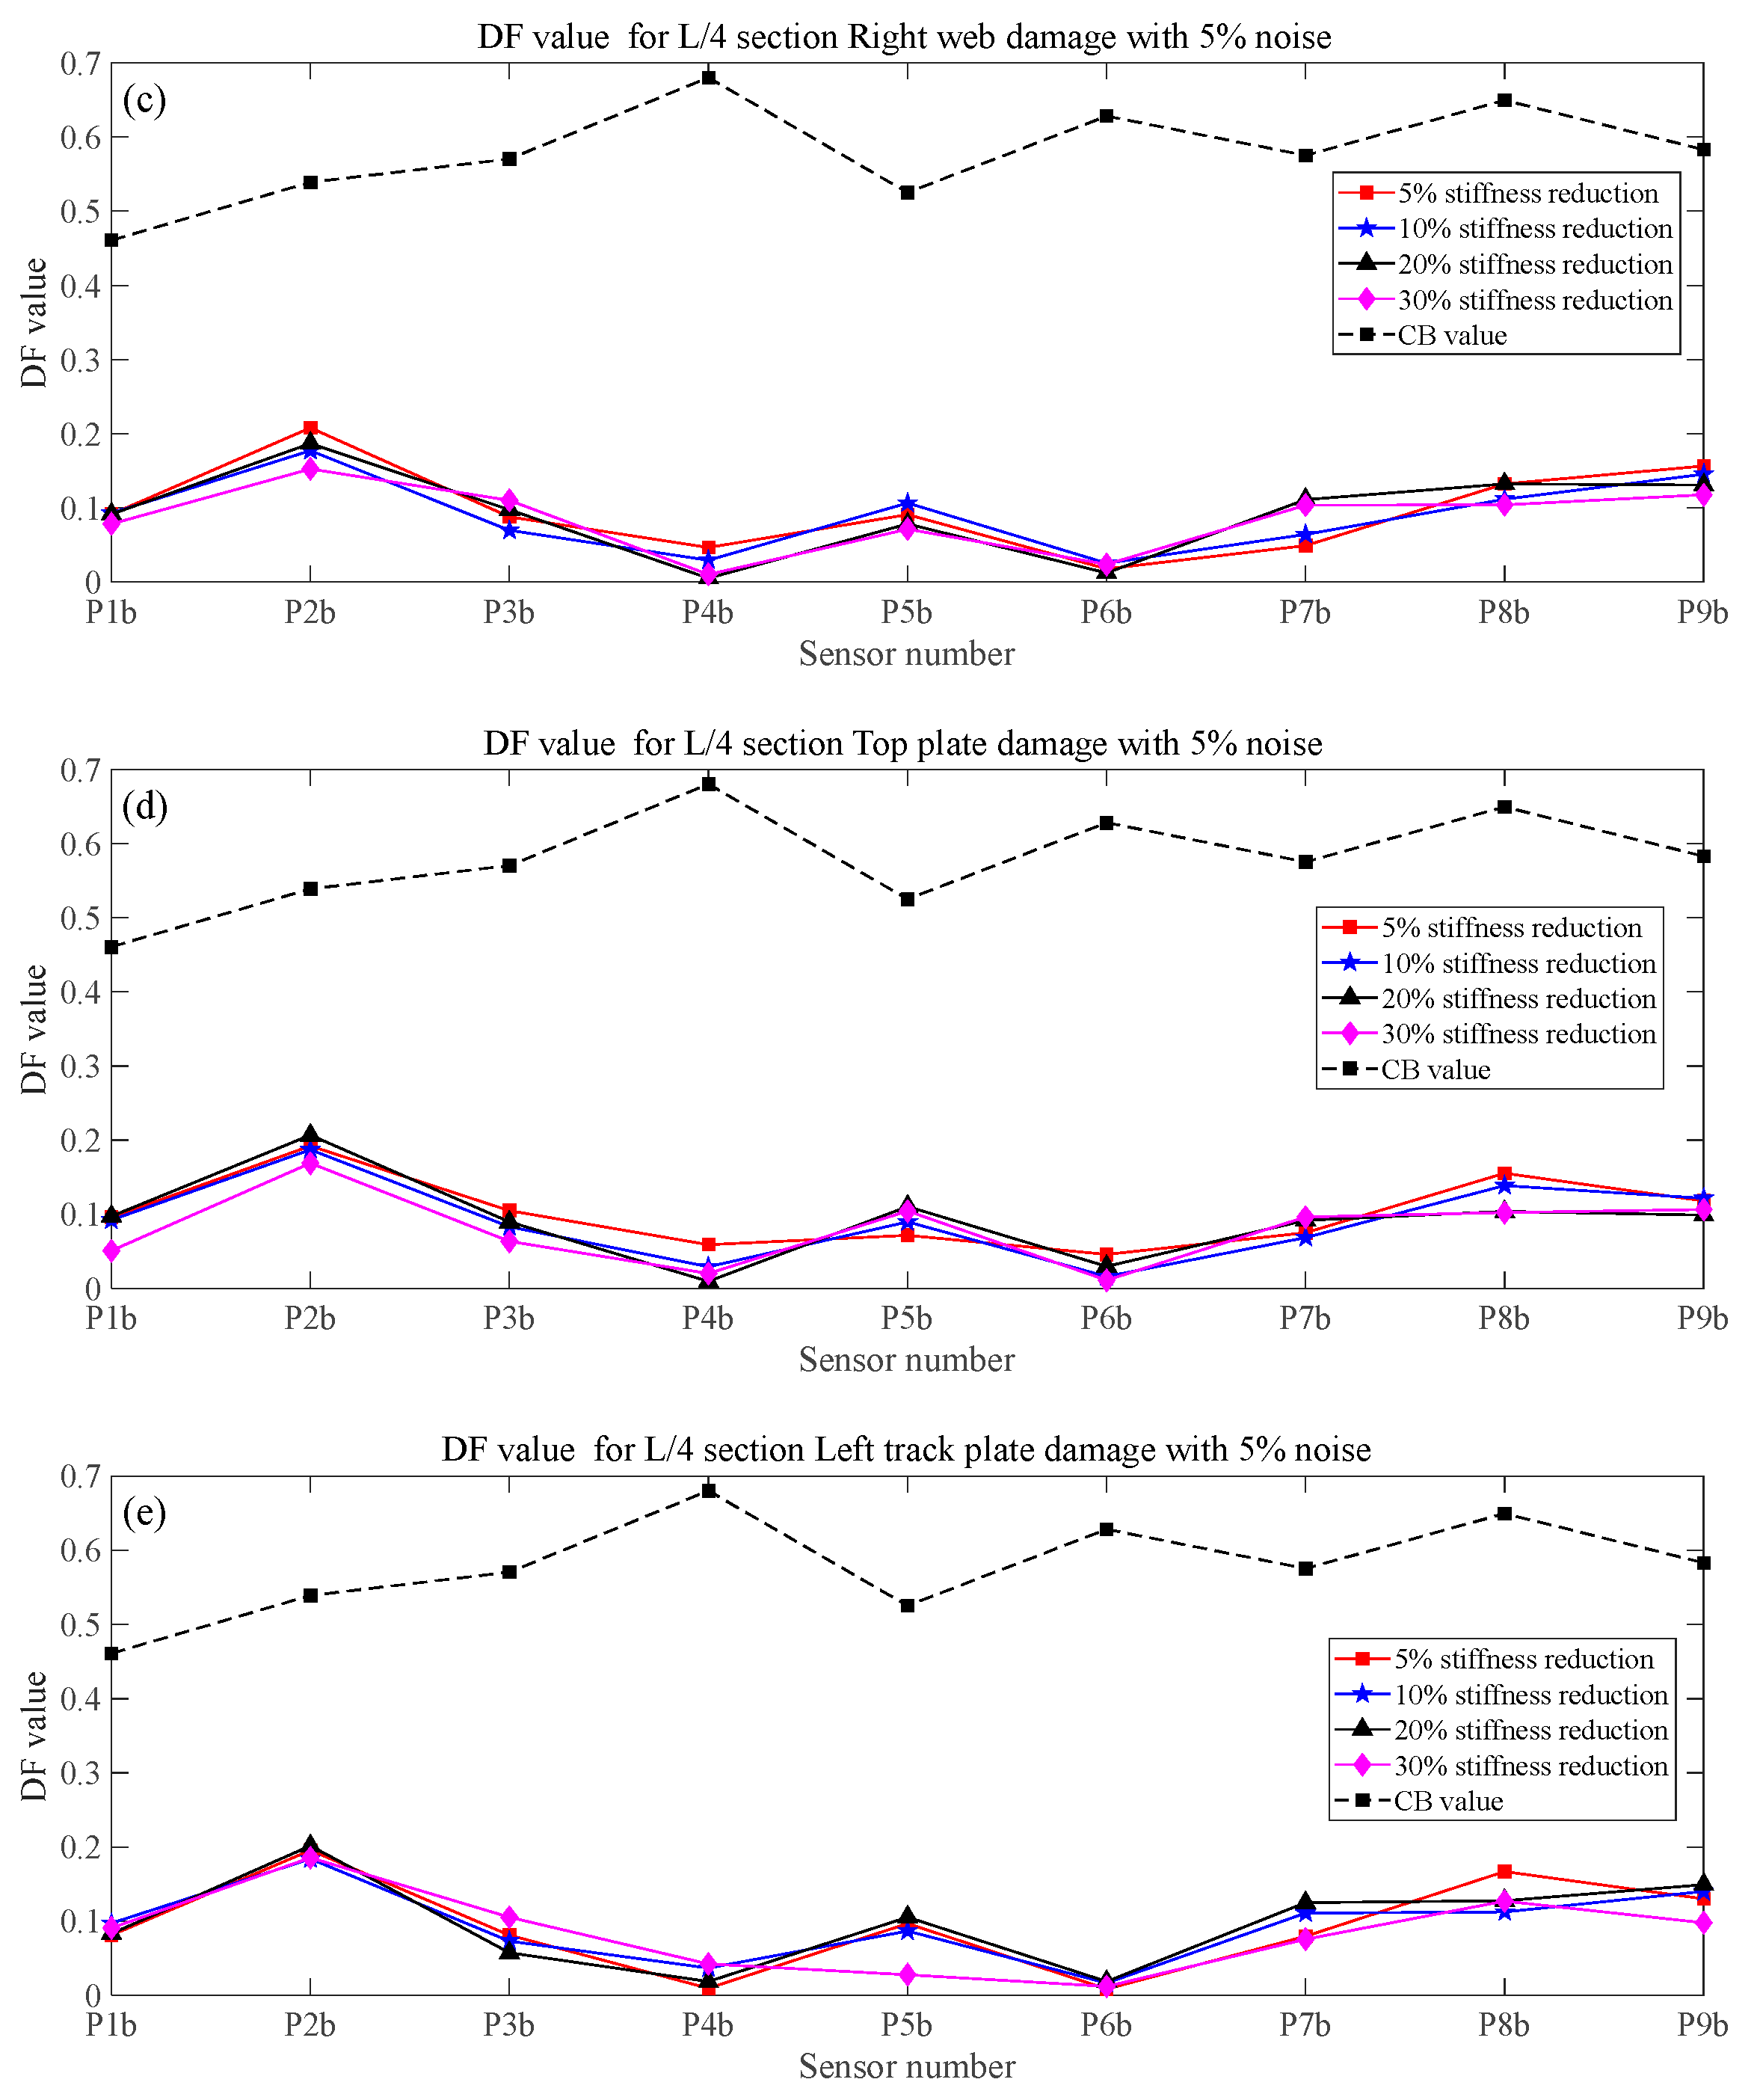
When the noise level is 5% and the passing train is on the up-side lane, as shown in Figure 2. Figure 10 shows the identification results of each component of the L/4 section when sensors P1b to P9b are used for damage detection. As can be seen from Figure 10, when the stiffness reduction coefficient reaches 10%, the damage to the bottom plate and the left web can be detected at point P3b (L/4 section). With the increase of the stiffness reduction coefficient, the DF value also increases. In addition, point P3b could not detect the damage to the right web, top plate, and track plate because it was located on the bottom plate and the left web at the same time and was far away from other components.
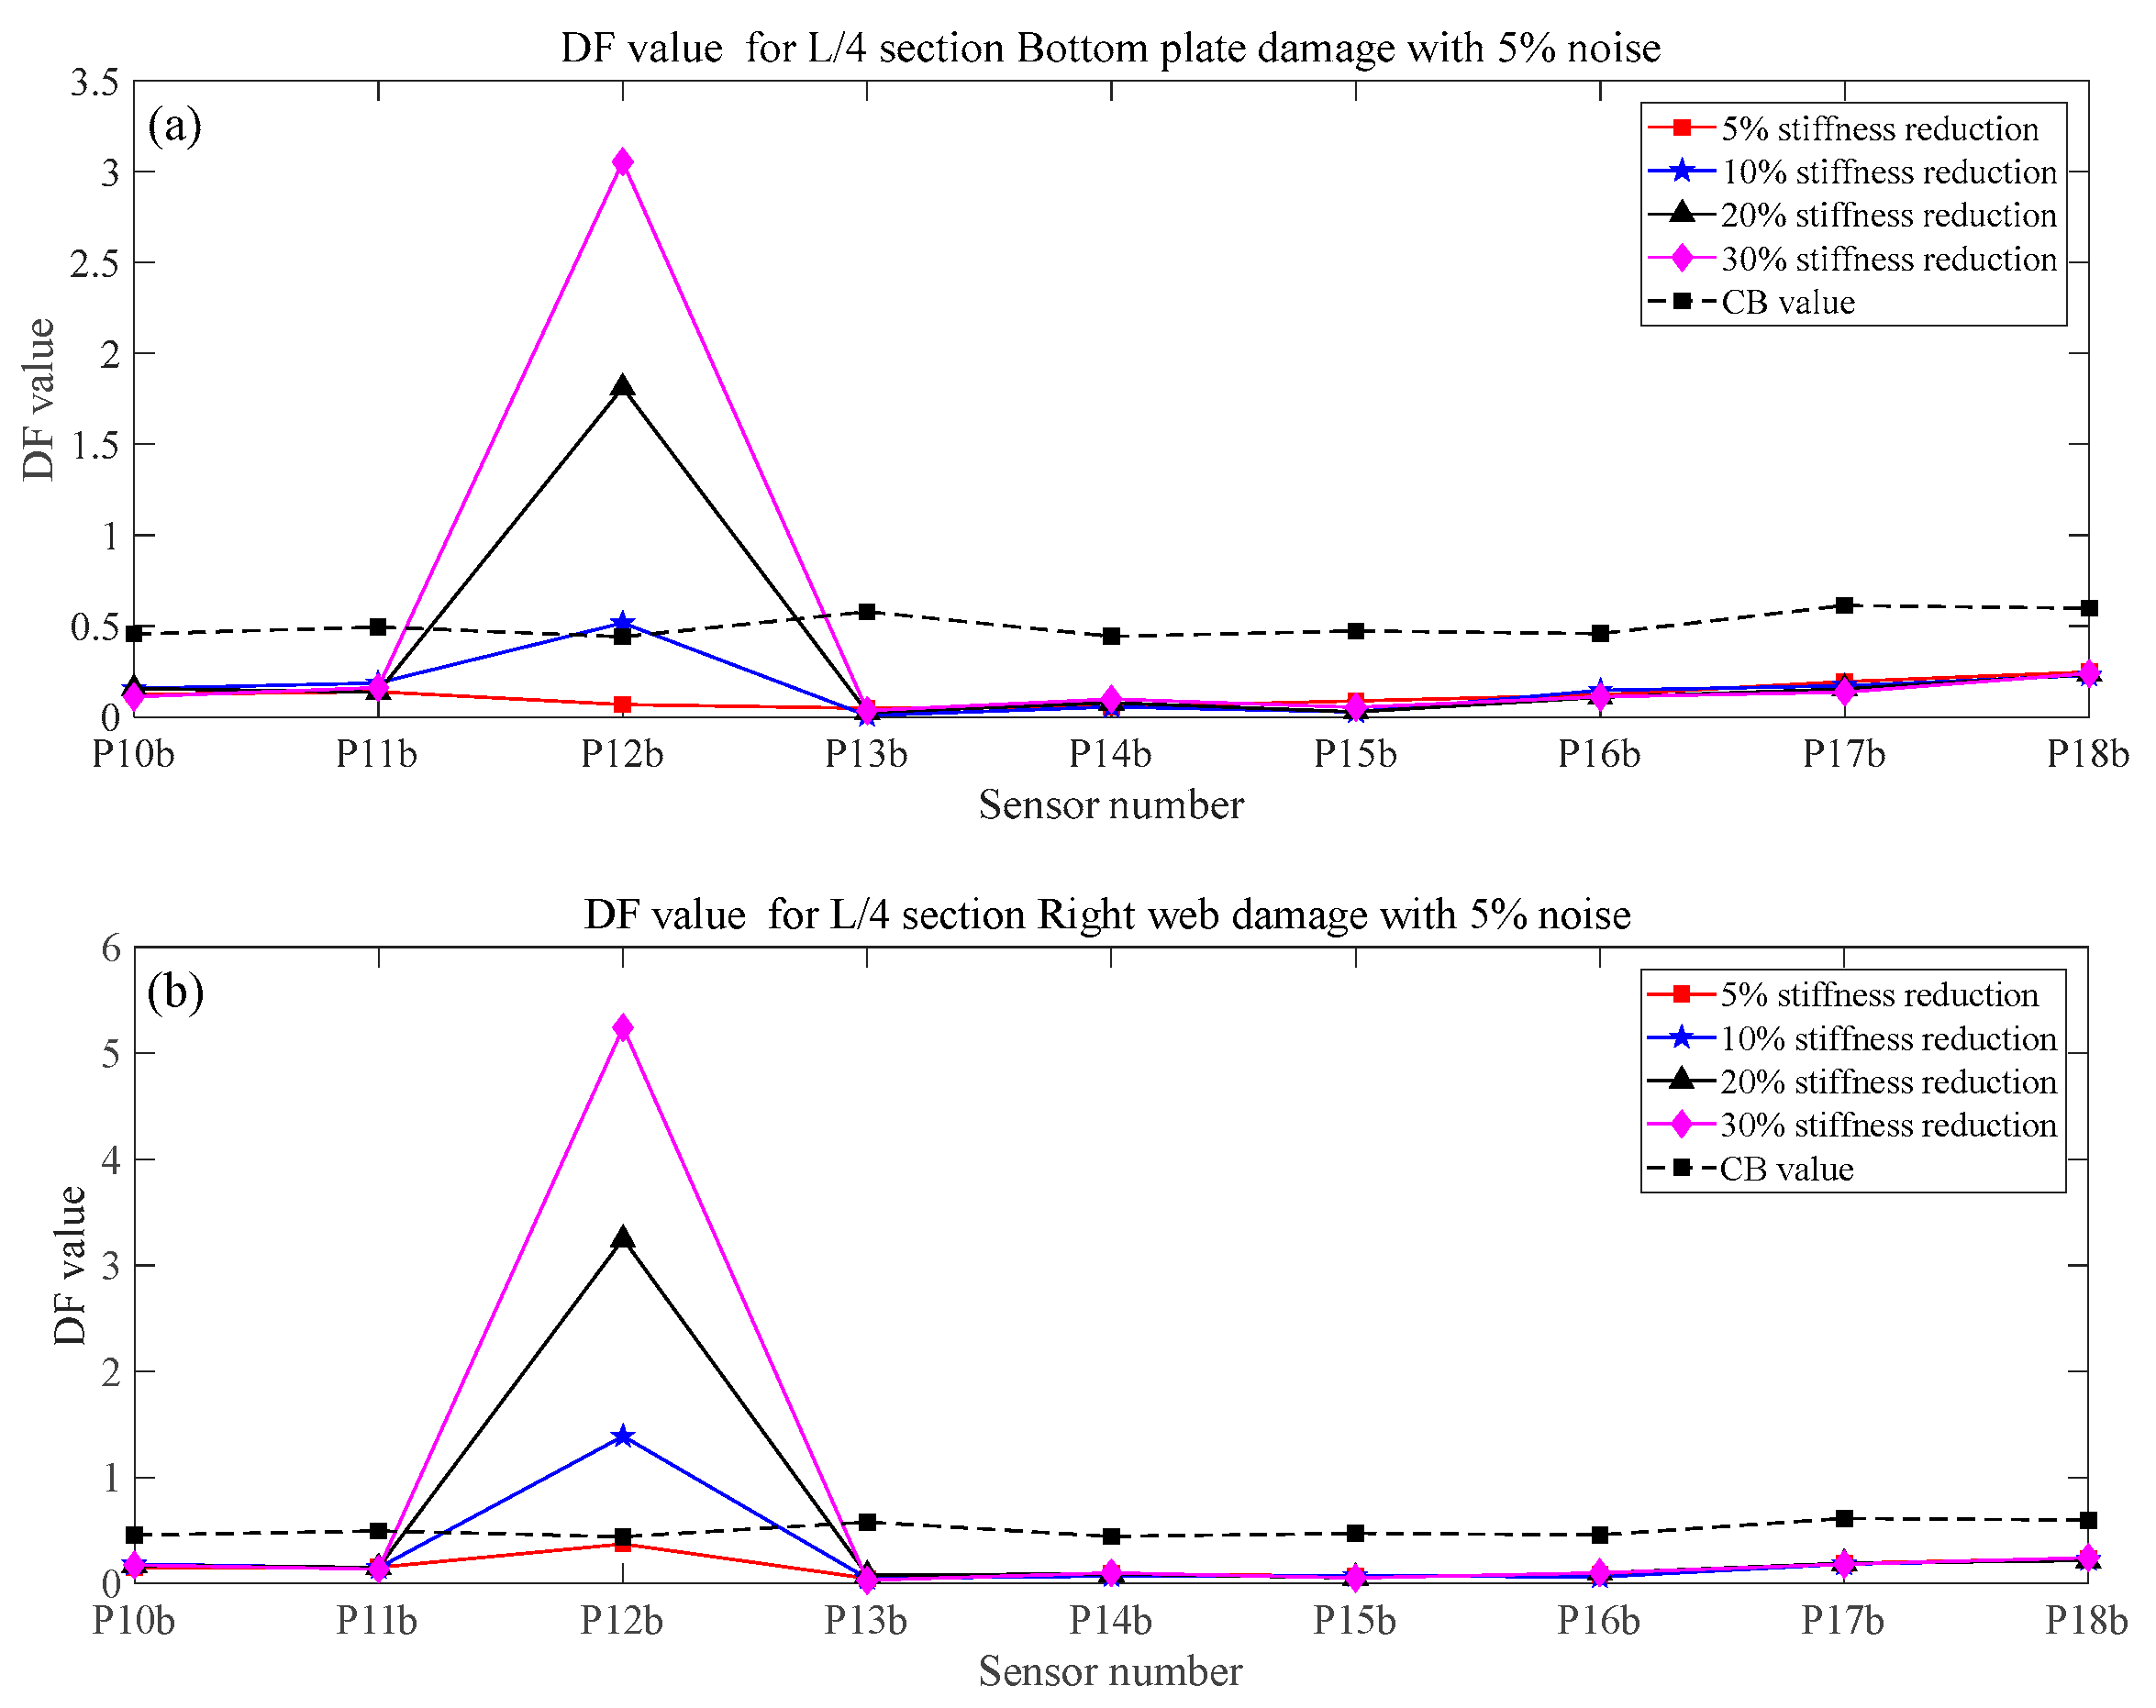
Figure 11 shows the identification results of components of the L/4 section when sensors P10b to P18b are used for damage detection. Unlike in Figure 10, P12b can detect damage to the right web because it is located below the right web. In addition, when points P3b and P12b are used to detect the damage of the bottom plate at the same time, point P3b can detect smaller damage. This is because the train is closer to point P3b when it passes through the bridge on the up-side lane, as shown in Figure 2, and point P3b has a more sensitive dynamic response under the bent-torsional coupling effect.
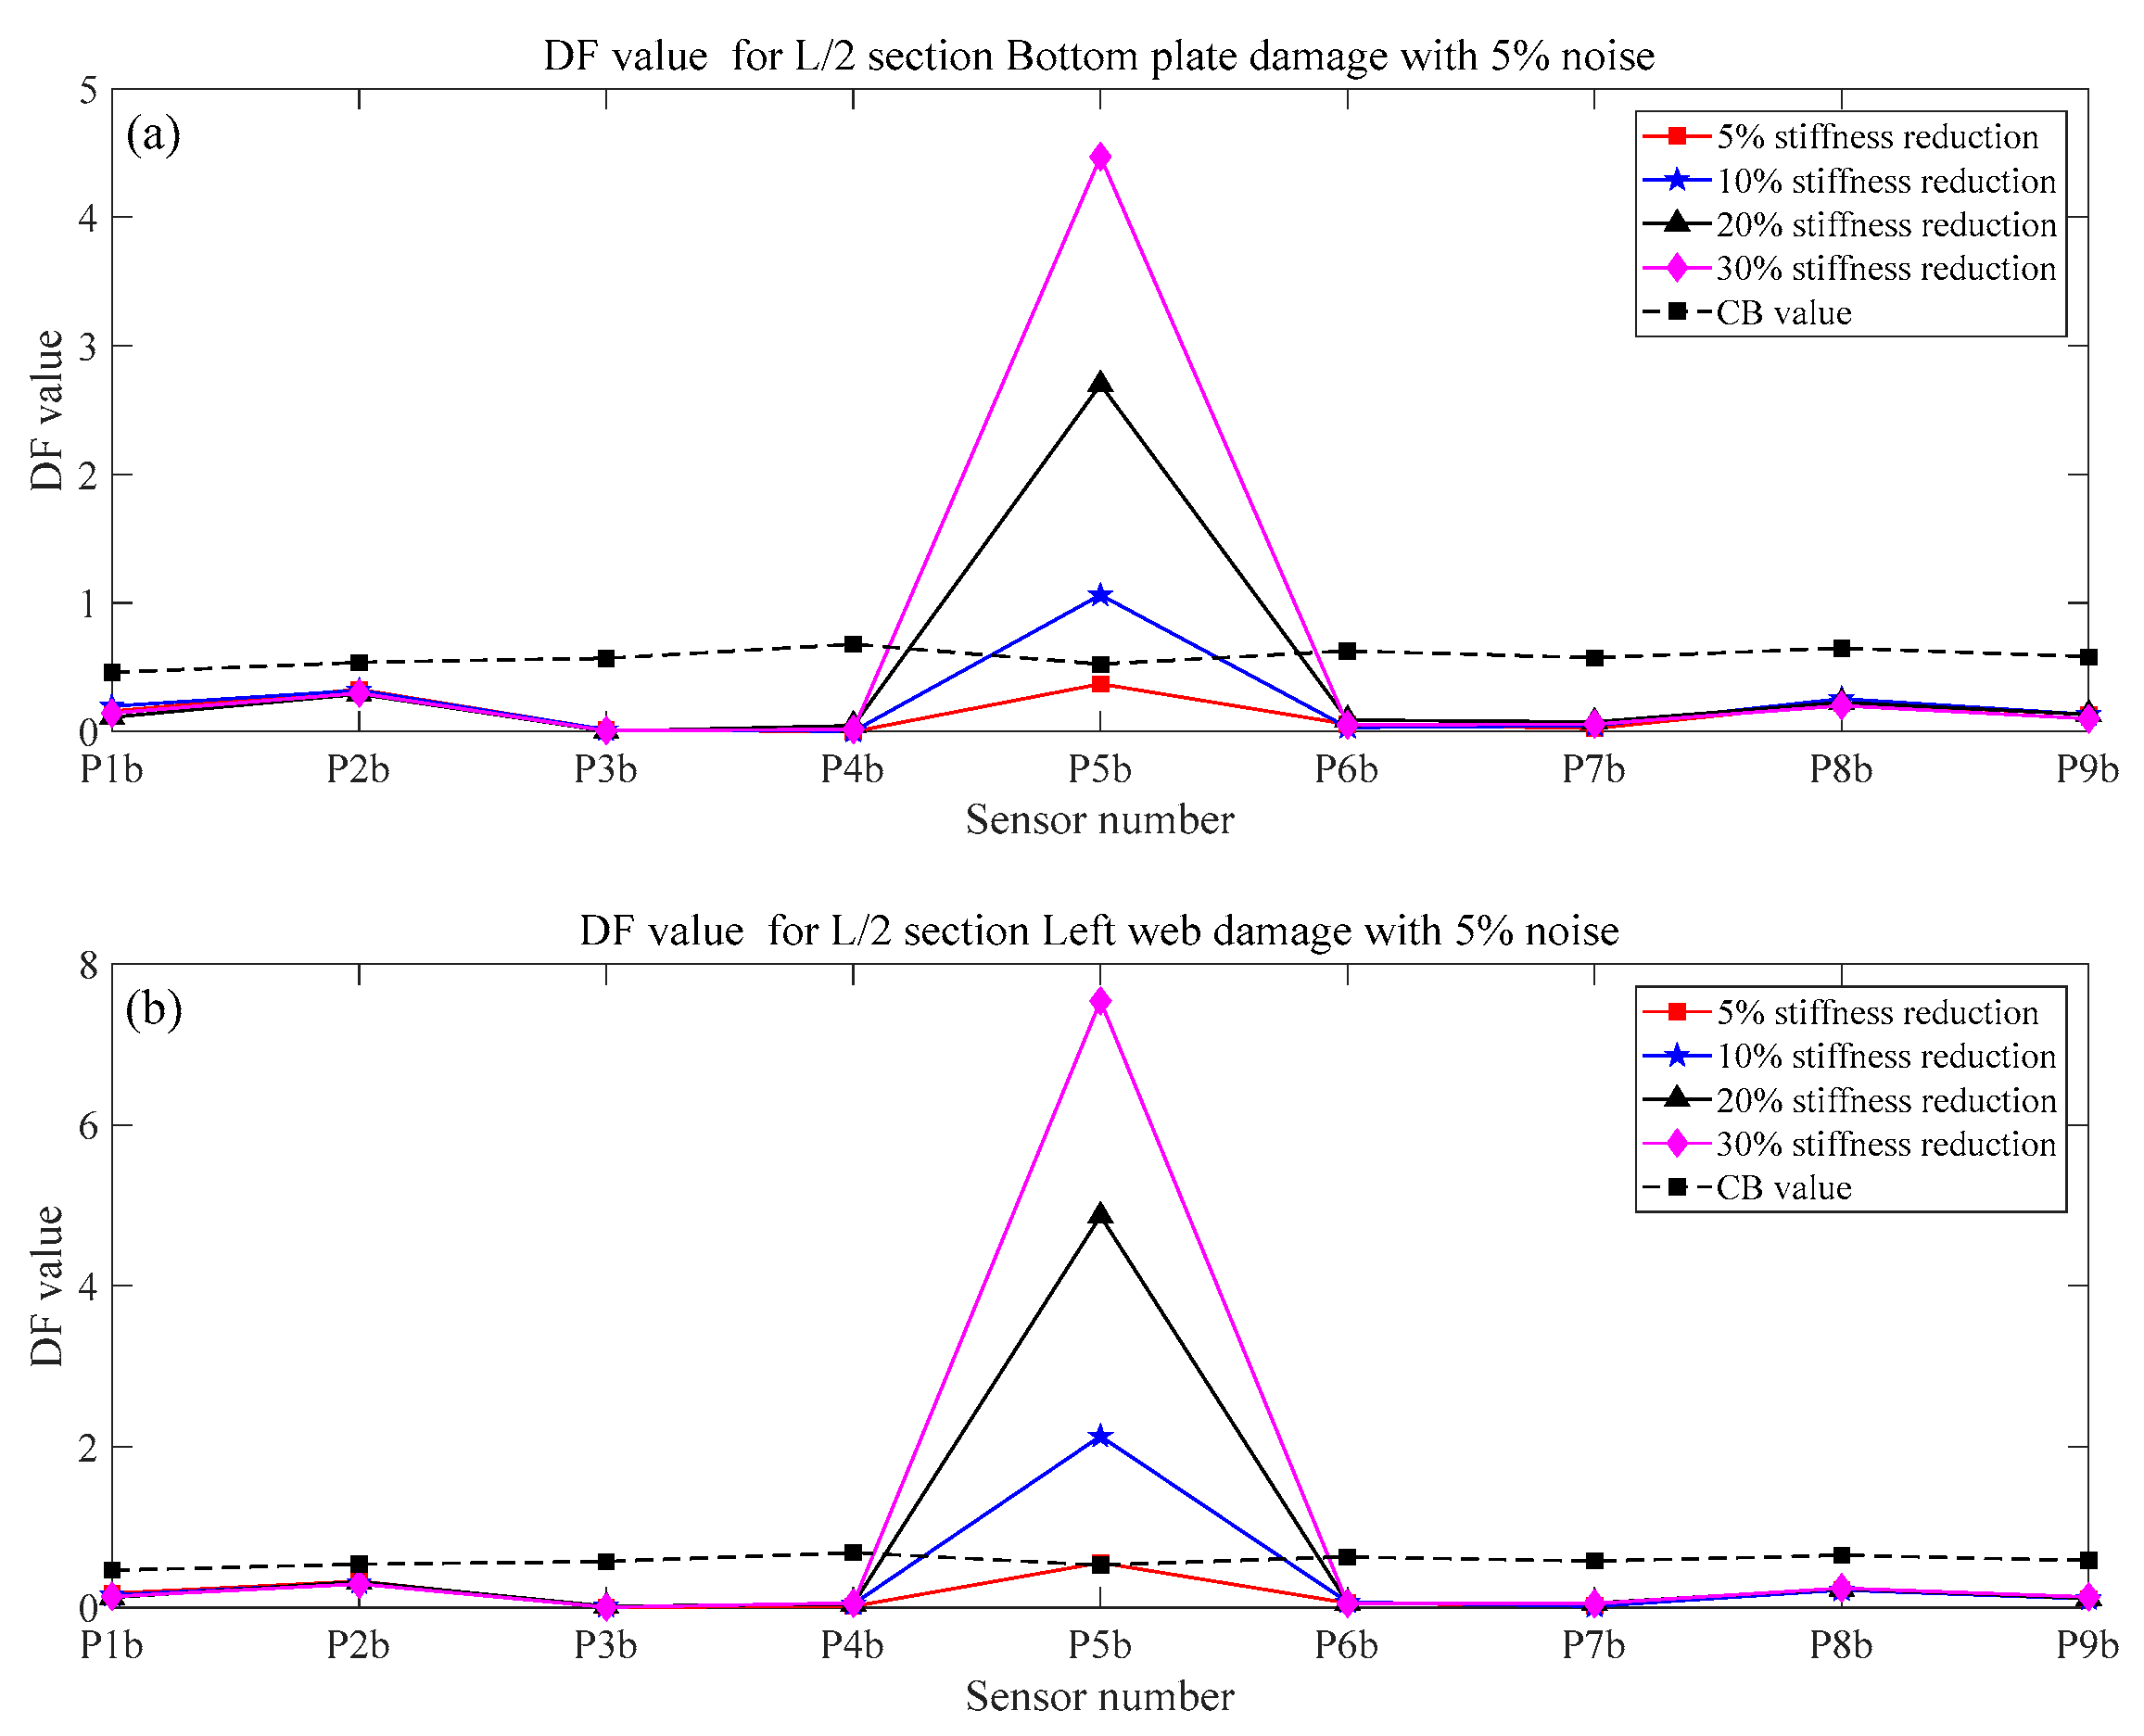
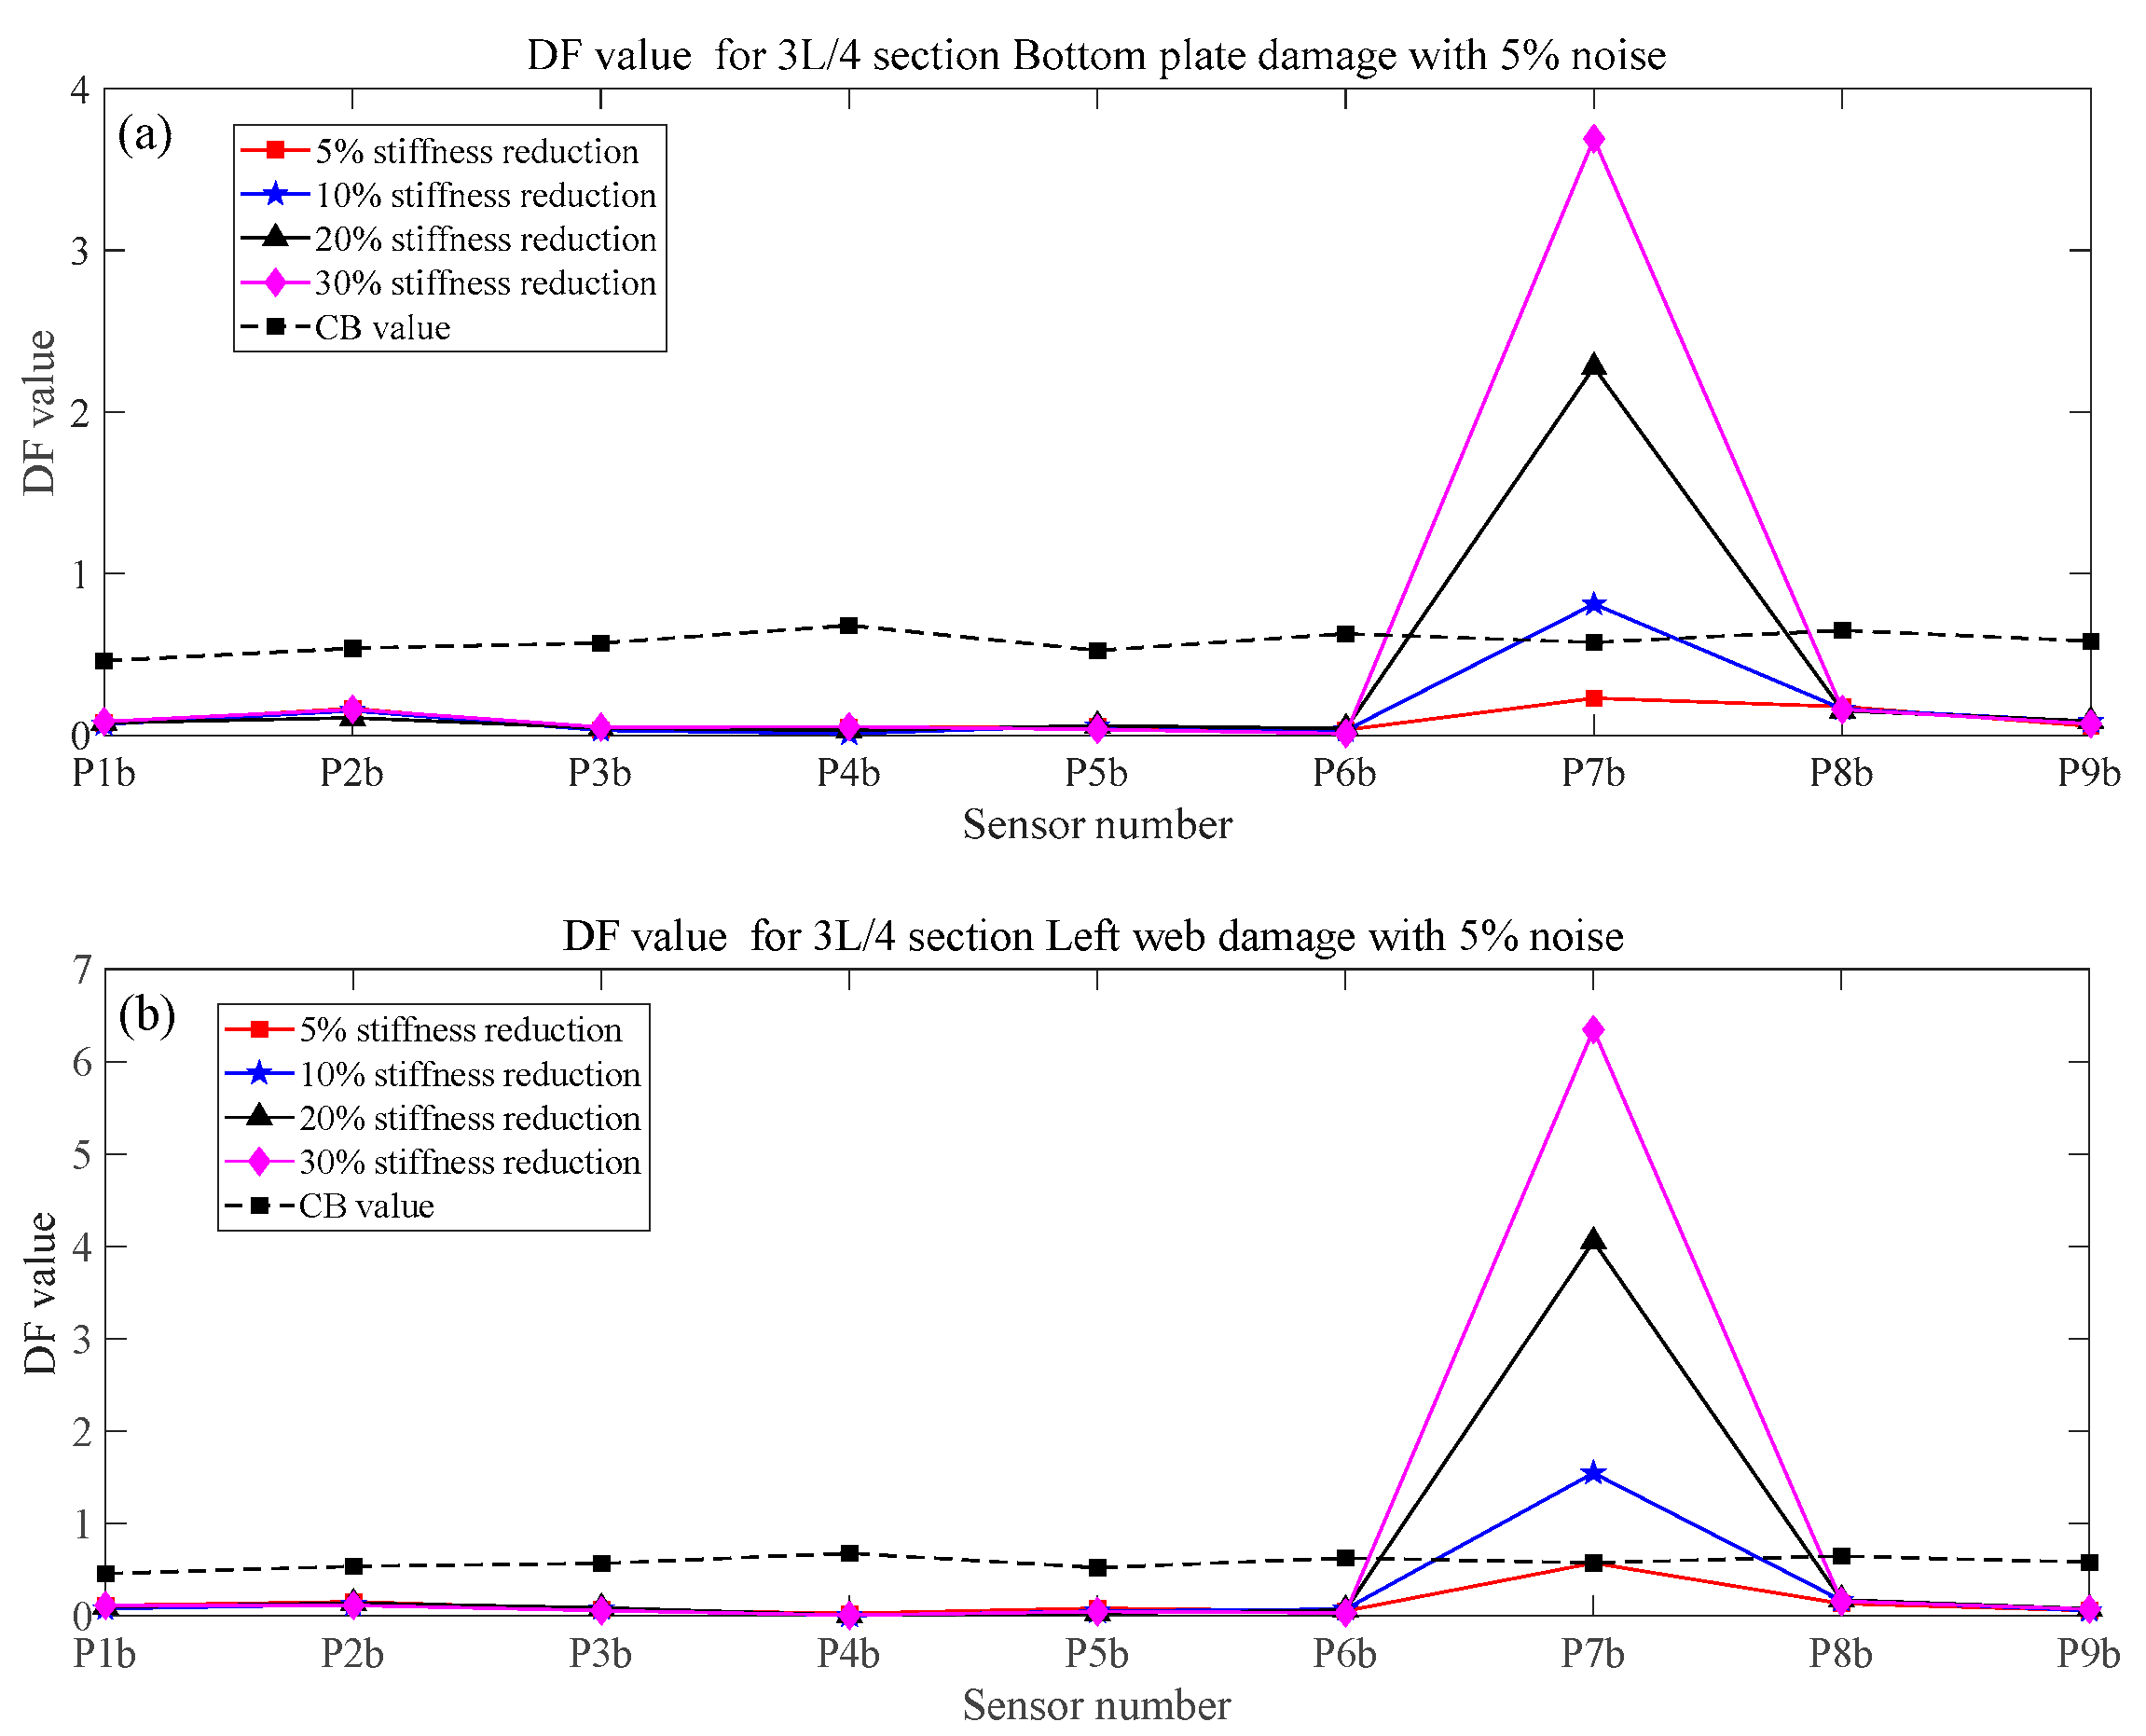
When sensors P1b to P9b are used for damage detection, Figure 12 and Figure 13 show the identification results of the L/2 and 3L/4 sections, respectively. Under the same train operating conditions, compared with Figure 10 and Figure 13, for the same stiffness reduction factor of the same component, Figure 12 has a larger DF value. The reason is that the dynamic response of the L/2 section is larger than that of L/4 and 3L/4 sections for the same component; that is, point P5b has a more sensitive dynamic response compared with P3b and P7b.
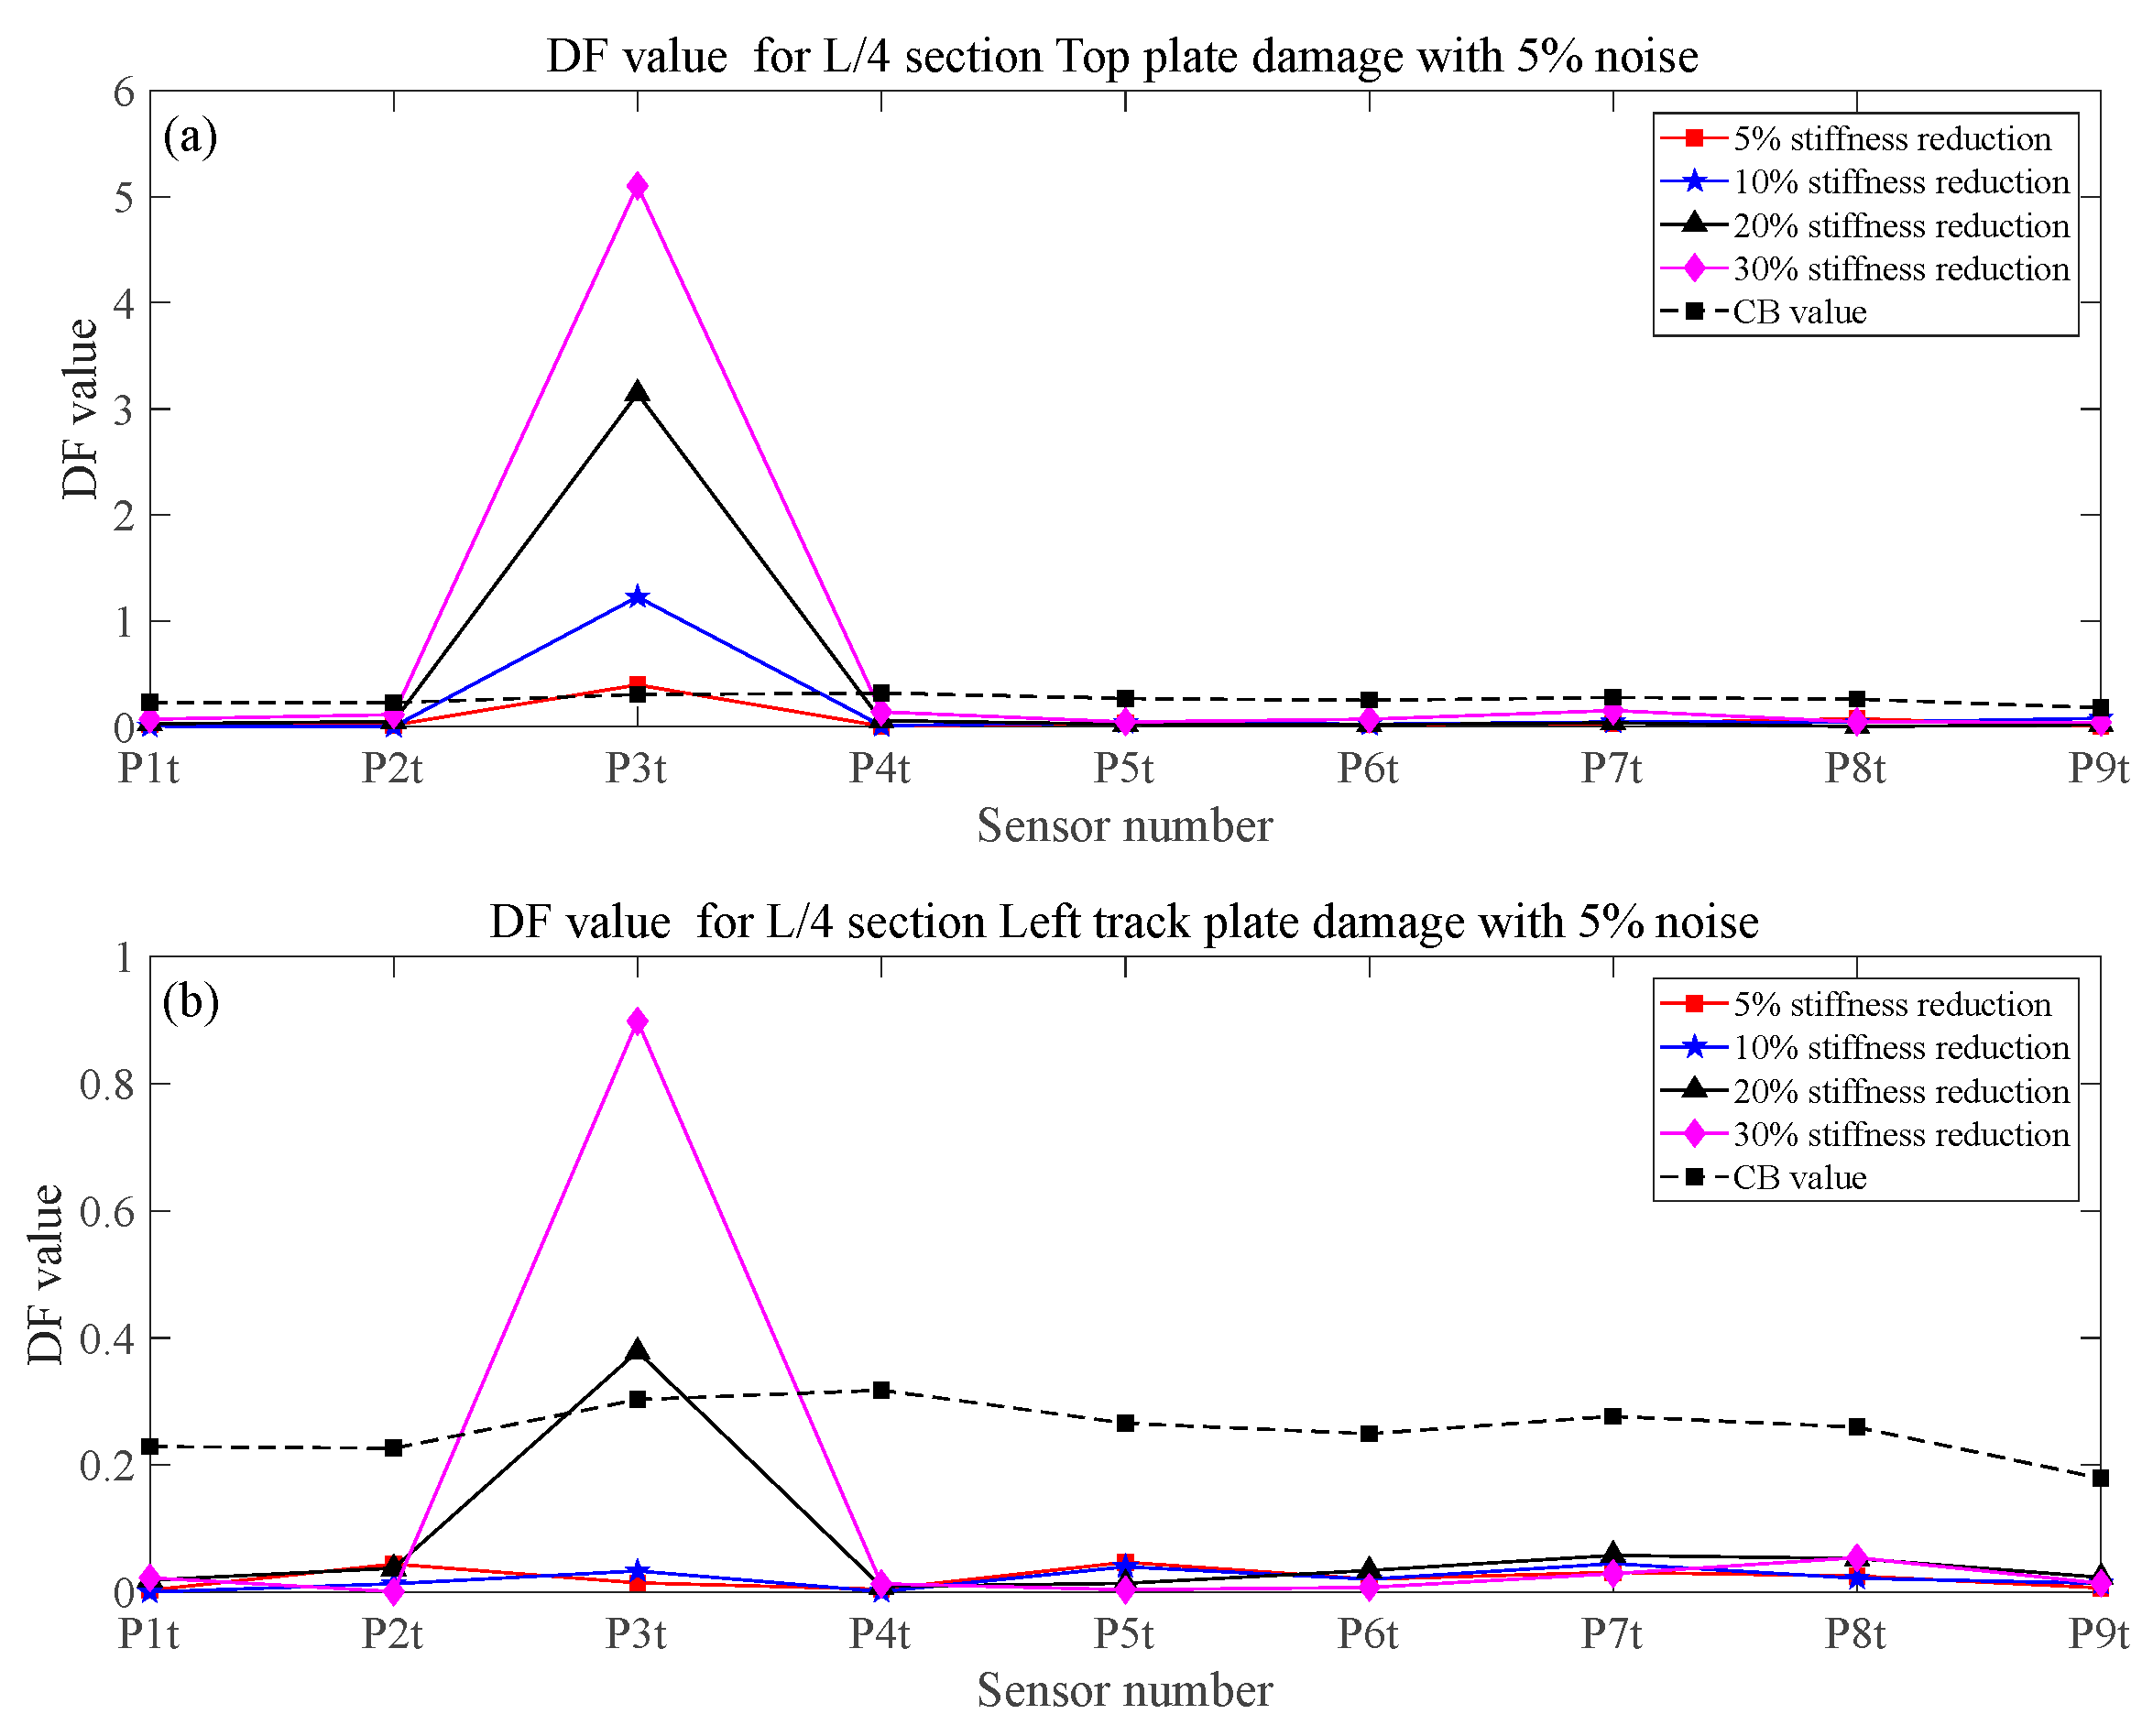
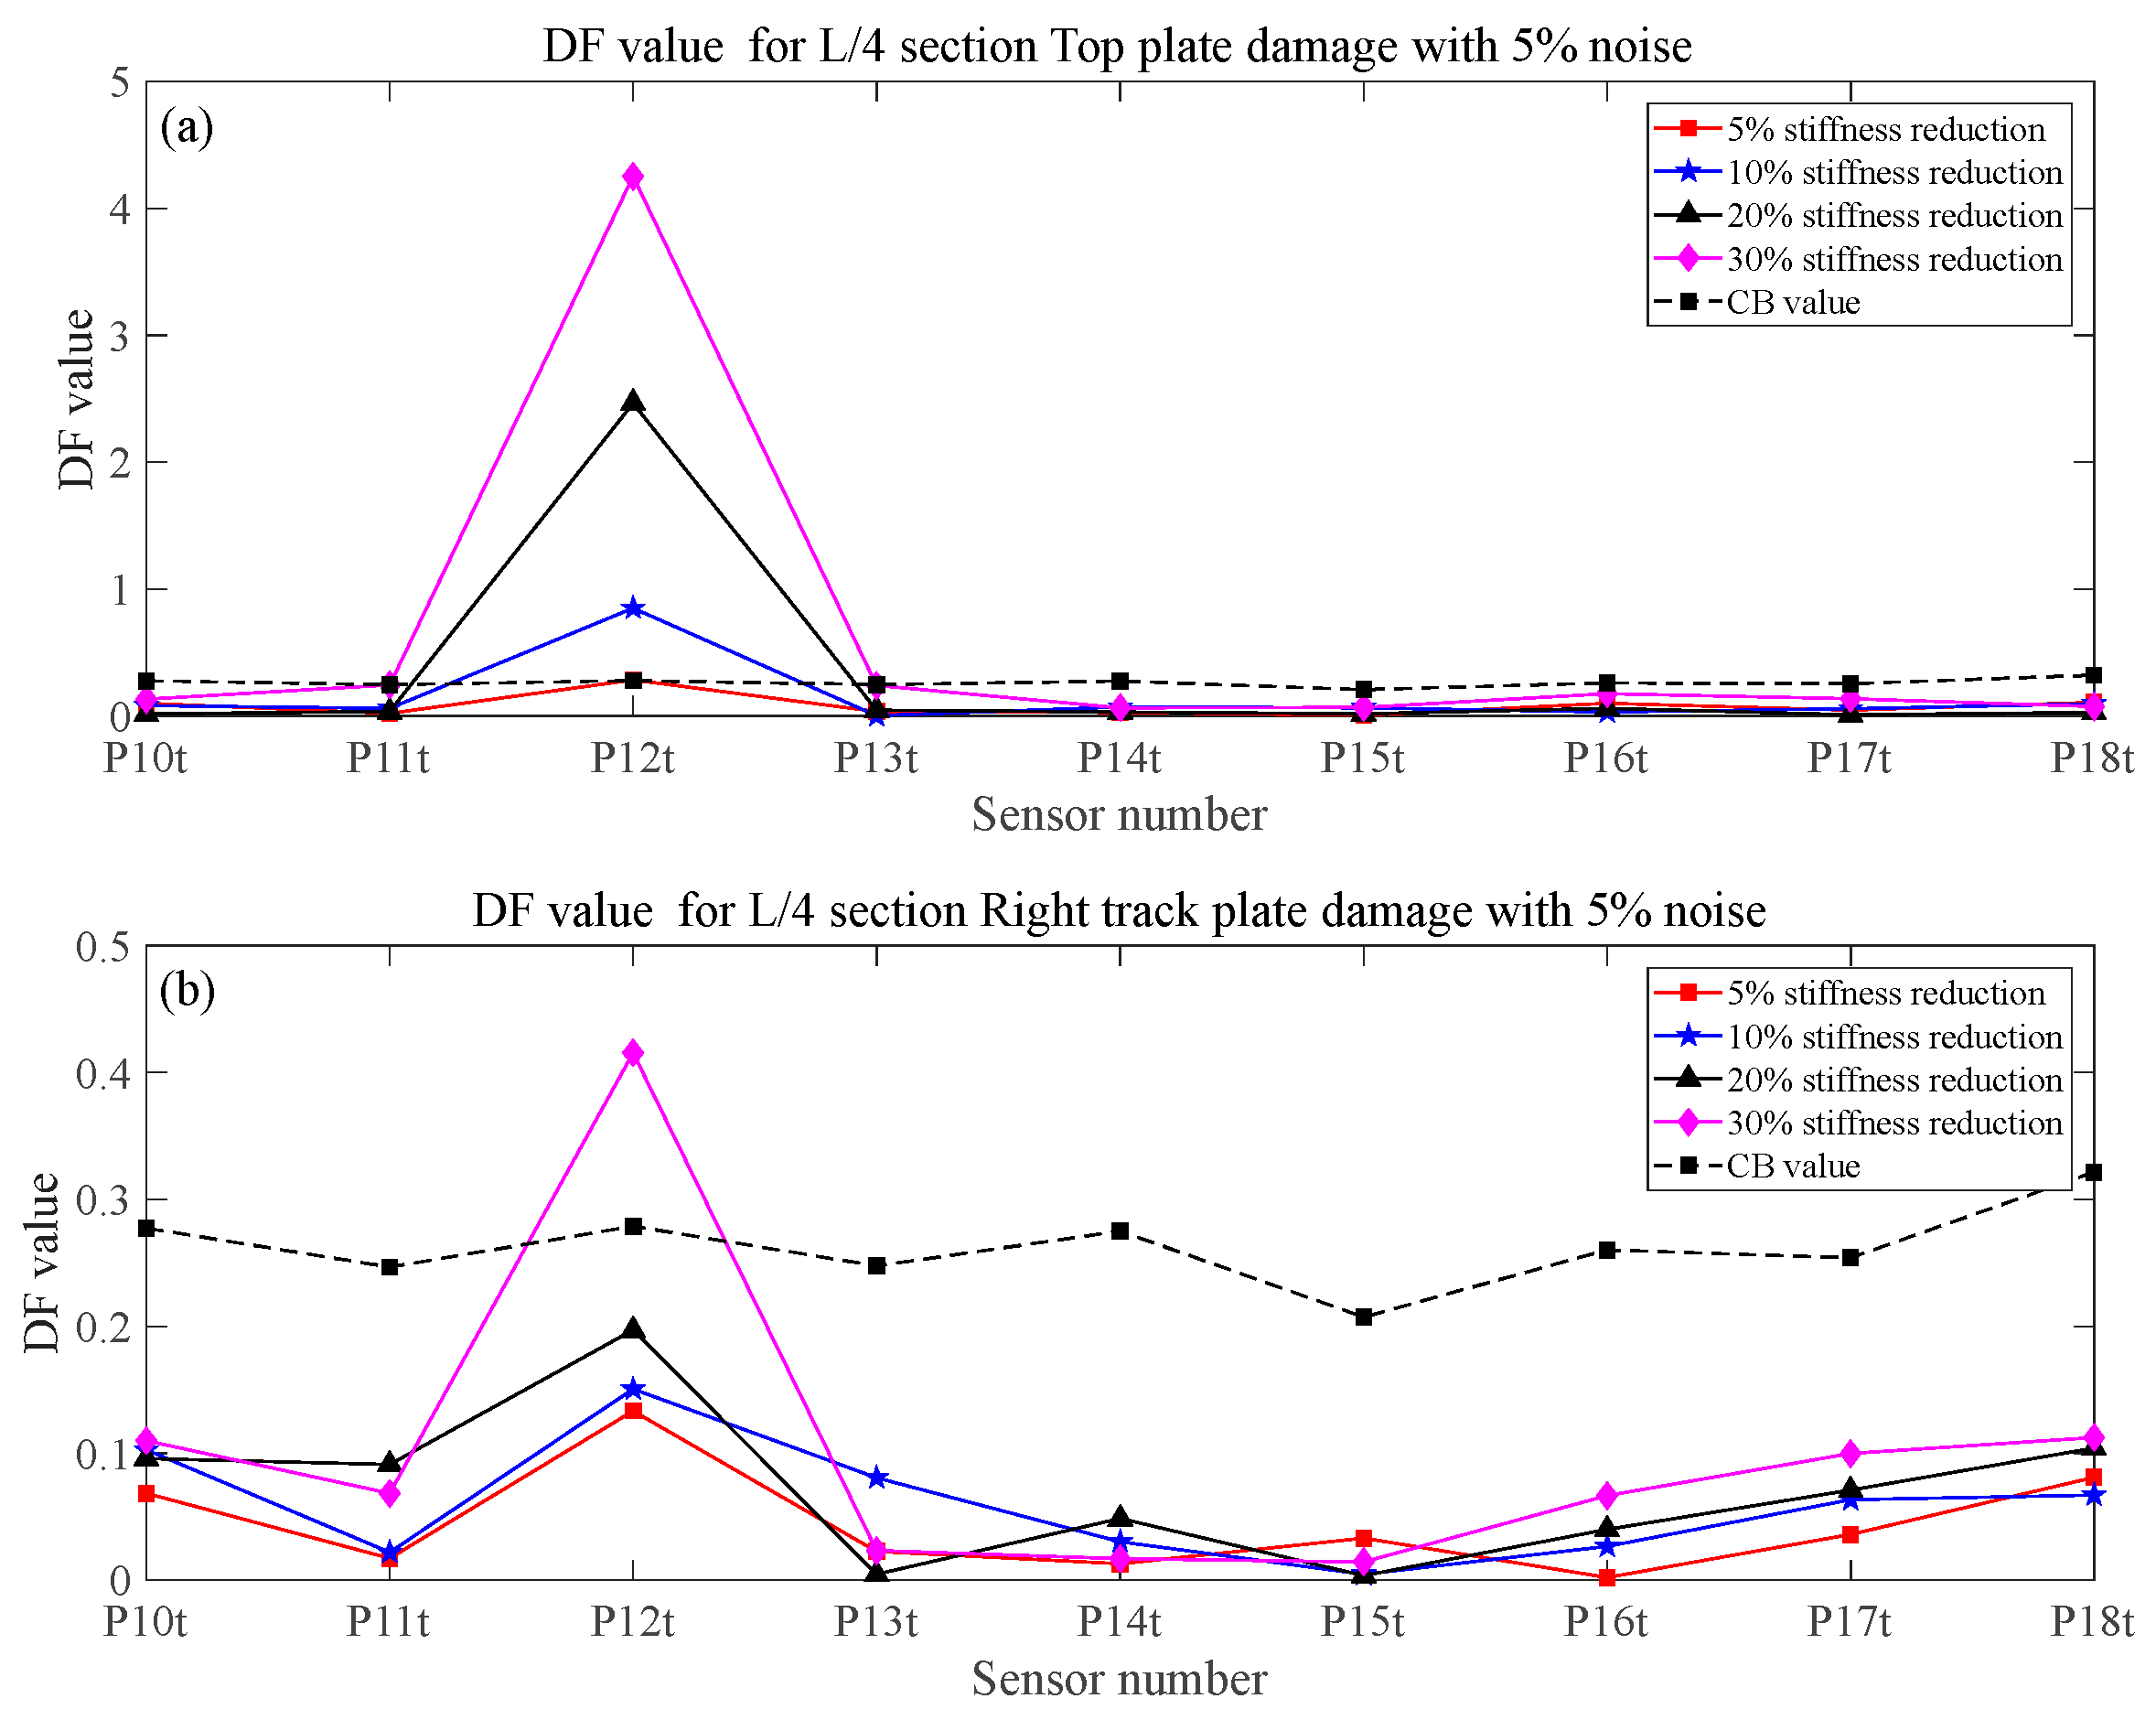
Figure 14 and Figure 15 show the identification results of some components of the L/4 section when sensors P1t to P9t and P10t to P18t are used for damage detection, respectively. As can be seen from Figure 14 and Figure 15, when the stiffness reduction coefficient reaches 10%, the damage of the top plate can be detected at the points P3t and P12t (L/4 section). Similarly, with the increase of the stiffness reduction coefficient, the DF value also increases. In addition, point P3b could not detect the damage to the right track plate, though it was located on the top plate and was far away from the right track plate in Figure 2.
In addition, although P3t and P12t are not located on the track plate, P3t and P12t are close to the left track plate and the right track plate, respectively. Therefore, when the stiffness reduction coefficient is large enough, P3t and P12t can detect the damage in the left track plate and the right track plate, respectively. Furthermore, the train is closer to point P3t when it passes through the bridge on the up-side lane, so point P3t has a more sensitive dynamic response under the bent-torsional coupling effect.
In general, when the identified section is installed with four sensors, as shown in Figure 2, the damage of the six components of this section can be successfully identified, located, and quantified using the proposed method in this paper, regardless of whether the train goes up or down through the bridge.

3.4. Effect of Different Vertical Track Irregularities, Train Weights, and Speeds

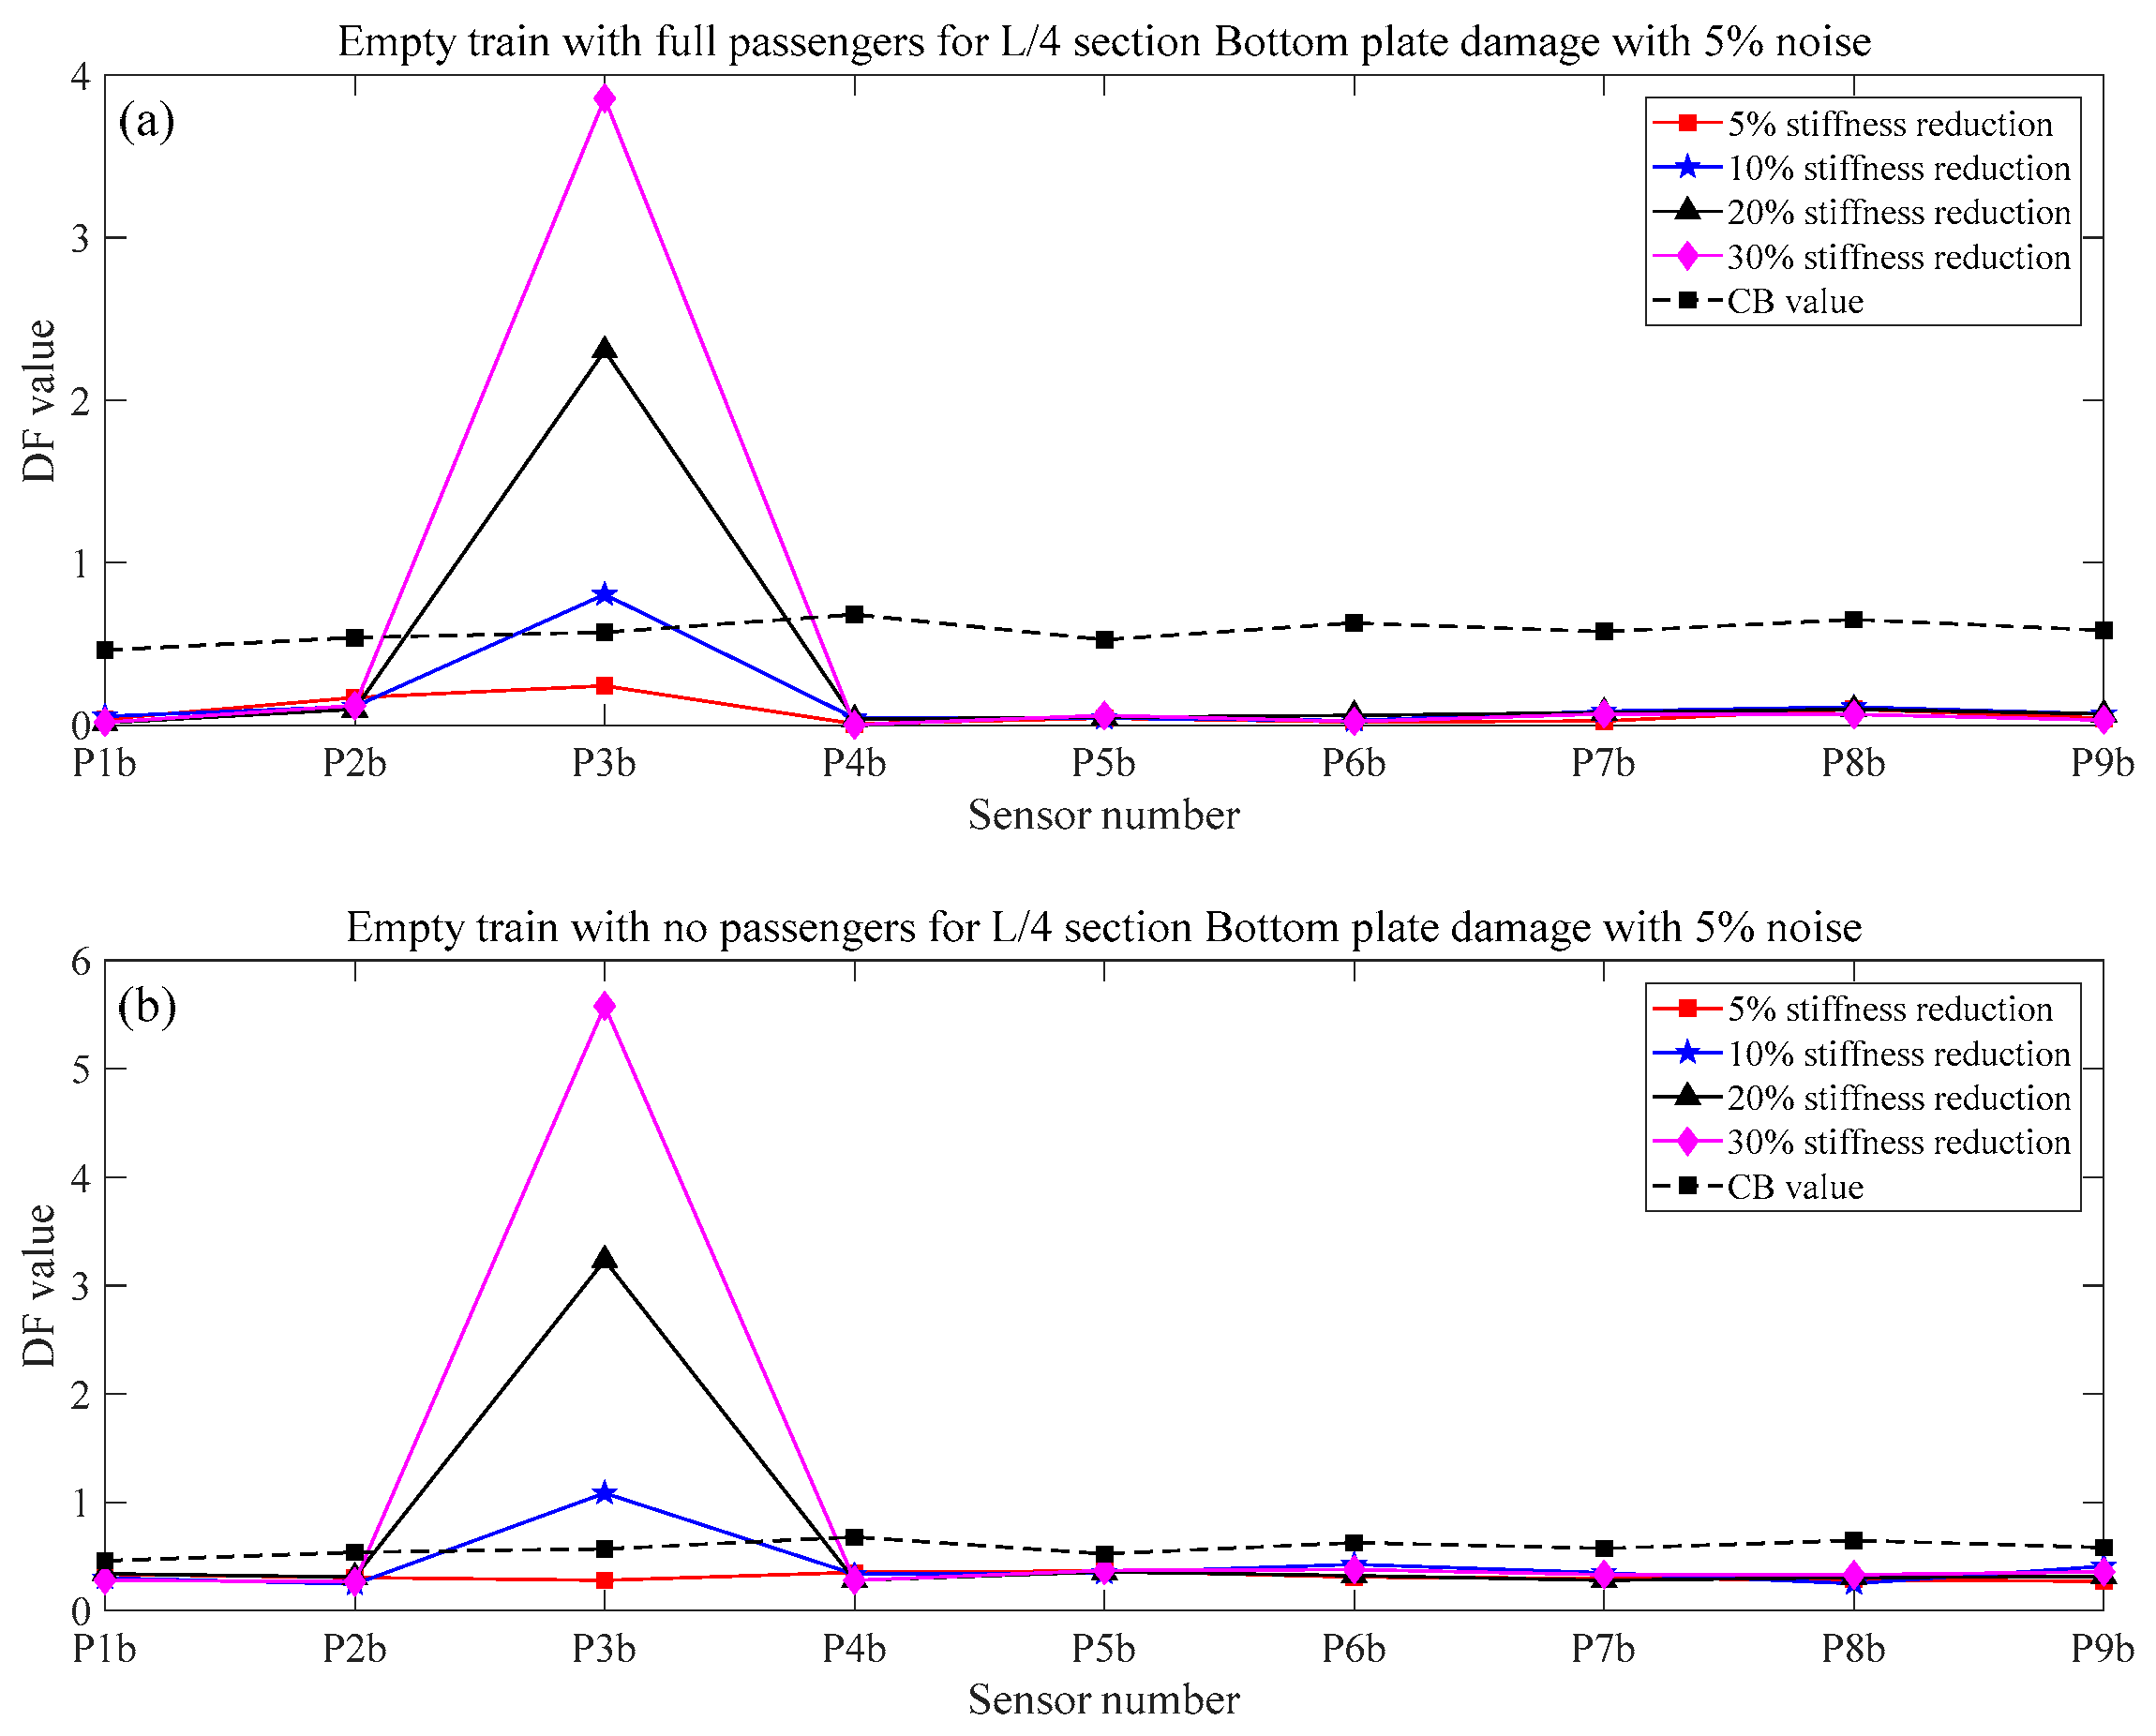
For the damage identification of the bottom plate, as shown in Figure 16 and Figure 17, when the train speed is 360 km/h, and the noise level is 5%, under different train weights and vertical track irregularity conditions, when the stiffness reduction factor of components reaches 10%, the proposed method can effectively identify, locate, and quantify the damage.
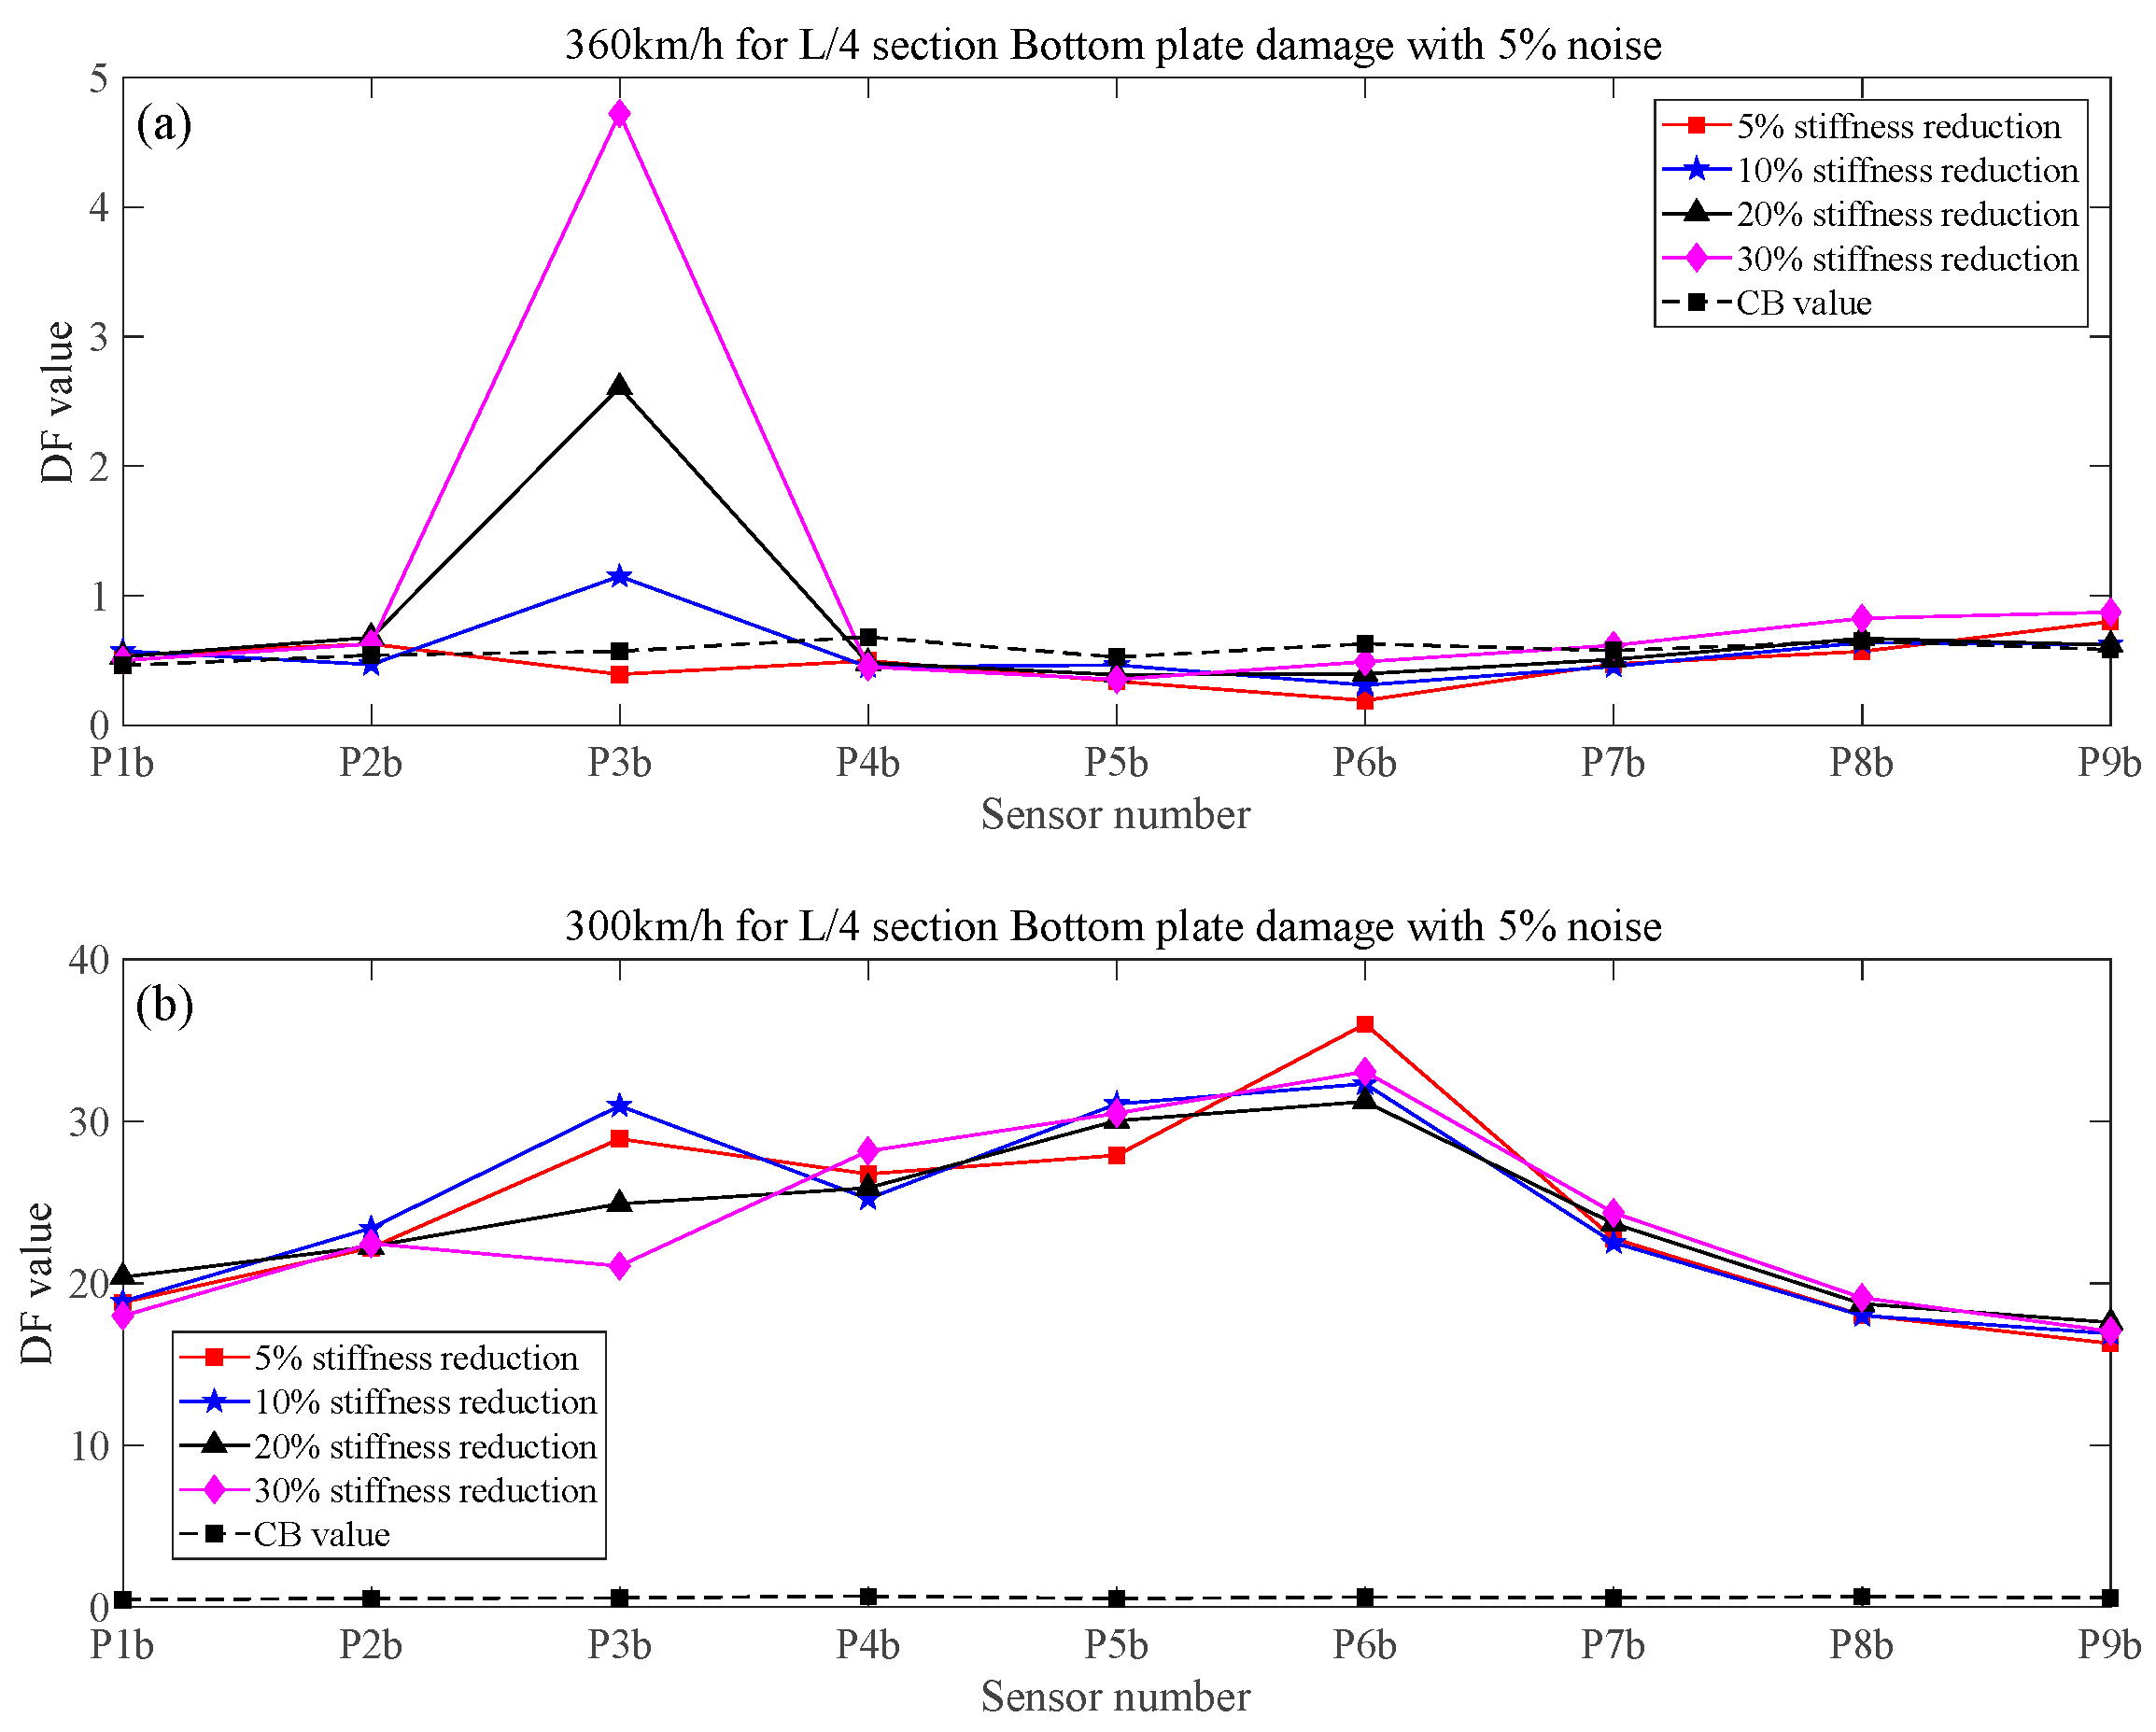
When the undamaged condition with a speed of 360 km/h is taken as the baseline data, and the damaged condition with a speed of 360 km/h and 330 km/h is taken as the test data set, respectively. Figure 18 shows that the damage detection, localization, and quantification of the condition at 360 km/h have been successfully identified, but the condition at 330 km/h has failed. The results show that the proposed method in this paper is sensitive to train speed; the prerequisite for the effectiveness of this method is that the baseline and damaged data are used at the same speed.
Fortunately, in the SHM system of high-speed railways, sensors such as radar speedometers that identify the train speed are usually installed. In addition, some algorithms for identifying the train speed based on dynamic strain response have been successfully applied [43]. Therefore, in the high-speed railway health monitoring system, when new data are obtained, the train speed can be identified first with a radar velocimeter or the speed identification algorithm in reference [43], and then the damage can be successfully identified, localized, and quantified using the proposed method.
It should be noted that for the analysis results in this paper, at present, a limited number of sensors cannot be used to identify all potential damage along the entire length of the bridge, but only a limited number of sensors can be used to identify damage in areas close enough to the concerned section (such as L/4, L/2, 3L/4 sections). From Figure 10, Figure 11, Figure 12, Figure 13, Figure 14 and Figure 15 in Section 3.3, it can be seen that the DF value only needs to be compared to the CB value to identify the damage and does not need to be compared to the DF values of other sensors. This means that we only need to install sensors on the concerned sections to identify the damage, which can save the cost of sensors.
In addition, on the cross-section of the box girder, as shown in Figure 2, P5b and P14b are the common points of the web and the bottom plate, which can simultaneously capture the stress characteristics of two different components to identify the damage. On the other hand, P5t and P14t are located directly below the center line of the track, respectively, which is more conducive to capturing the strain characteristics of the top plate and track plates caused by trains to identify the damage. In general, for the analysis of the optimal number of sensors, we only need a limited number of sensors on the concerned sections and install four sensors in different positions on each cross-section, as shown in Figure 2.

4. Conclusions

This paper proposes a damage detection method based on the high-speed railway train-induced responses considering the bending and torsion coupling effect of the box girder. The following conclusions could be drawn:
  • Under the coupling effects of bending and torsion, the deformation of the box girder does not conform to the Euler beam bending theory. The global response of the box girder cannot reflect the local damage characteristics, and the traditional damage detection method based on the Euler beam theory cannot be applied. In this paper, the box girder section is divided into different components based on the plate element analysis method. The proposed method in this paper can successfully identify the potential damage of all components for a section by using four strain sensors.
  • The numerical simulation results show that the proposed method in this paper is sensitive to train speed, so the train speed needs to be calculated first by using a radar speedometer or the related algorithm. Even under the effect of noise, different train weights, and vertical track irregularity conditions, when the stiffness reduction factor of components is large enough, the proposed method in this paper can effectively identify, locate, and quantify the damage.
The proposed method can effectively identify the potential damage of all components by using four strain sensors for the key section using train-induced responses, which is helpful for developing effective maintenance strategies for high-speed railway box girders. It is of certain practical significance for the establishment of high-speed railway health monitoring and safety early warning systems.

Author Contributions

Software, Y.Z.; Writing—original draft, X.W.; Writing—review & editing, S.L. All authors have read and agreed to the published version of the manuscript.

Funding

Financial support for this study was provided by China Railway Design Corporation R&D Program [2020YY340619, 2020YY240604] and Fundamental Research Funds for the Central Universities [FRFCU5710051018].

Institutional Review Board Statement

Not applicable.

Informed Consent Statement

Not applicable.

Data Availability Statement

Not applicable.

Conflicts of Interest

The authors declare no conflict of interest.

References

  1. Wang, X.; Li, Z.; Zhuo, Y.; Di, H.; Wei, J.; Li, Y.; Li, S. Indirect displacement monitoring of high-speed railway box girders consider bending and torsion coupling effects. Smart Struct. Syst. 2021, 28, 827–838. [Google Scholar] [CrossRef]
  2. Azim, M.R.; Gul, M. Damage detection framework for truss railway bridges utilizing statistical analysis of operational strain response. Struct. Control. Health Monit. 2020, 27, e2573. [Google Scholar] [CrossRef]
  3. Huang, Y.; Beck, J.L.; Li, H. Bayesian system identification based on hierarchical sparse Bayesian learning and Gibbs sampling with application to structural damage assessment. Comput. Methods Appl. Mech. Eng. 2017, 318, 382–411. [Google Scholar] [CrossRef]
  4. Li, H.; Mao, C.-X.; Ou, J.-P. Experimental and theoretical study on two types of shape memory alloy devices. Earthq. Eng. Struct. Dyn. 2008, 37, 407–426. [Google Scholar] [CrossRef]
  5. Li, S.; Zhu, S.; Xu, Y.-L.; Chen, Z.-W.; Li, H. Long-term condition assessment of suspenders under traffic loads based on structural monitoring system: Application to the Tsing Ma Bridge. Struct. Control. Health Monit. 2012, 19, 82–101. [Google Scholar] [CrossRef]
  6. Li, S.; Wei, S.; Bao, Y.; Li, H. Condition assessment of cables by pattern recognition of vehicle-induced cable tension ratio. Eng. Struct. 2018, 155, 1–15. [Google Scholar] [CrossRef]
  7. Bao, Y.; Shi, Z.; Beck, J.L.; Li, H.; Hou, T.Y. Identification of time-varying cable tension forces based on adaptive sparse time-frequency analysis of cable vibrations. Struct. Control. Health Monit. 2017, 24, e1889. [Google Scholar] [CrossRef]
  8. Li, H.; Lan, C.M.; Ju, Y.; Li, D.S. Experimental and Numerical Study of the Fatigue Properties of Corroded Parallel Wire Cables. J. Bridge Eng. 2012, 17, 211–220. [Google Scholar] [CrossRef]
  9. Meixedo, A.; Santos, J.; Ribeiro, D.; Calcada, R.; Todd, M. Damage detection in railway bridges using traffic-induced dynamic responses. Eng. Struct. 2021, 238, 112189. [Google Scholar] [CrossRef]
  10. Zhang, S.; Wang, Y.; Yu, K. Steady-State Data Baseline Model for Nonstationary Monitoring Data of Urban Girder Bridges. Sustainability 2022, 14, 12134. [Google Scholar] [CrossRef]
  11. Zhou, Z.; Dong, K.; Fang, Z.; Liu, Y. A Two-Stage Approach for Damage Diagnosis of Structures Based on a Fully Distributed Strain Mode under Multigain Feedback Control. Sustainability 2022, 14, 10019. [Google Scholar] [CrossRef]
  12. He, X.; Tan, G.; Chu, W.; Zhang, S.; Wei, X. Reliability Assessment Method for Simply Supported Bridge Based on Structural Health Monitoring of Frequency with Temperature and Humidity Effect Eliminated. Sustainability 2022, 14, 9600. [Google Scholar] [CrossRef]
  13. Gao, X.; Duan, G.; Lan, C. Bayesian Updates for an Extreme Value Distribution Model of Bridge Traffic Load Effect Based on SHM Data. Sustainability 2021, 13, 8631. [Google Scholar] [CrossRef]
  14. Li, Z.; Ji, W.; Zhang, Y.; Ge, S.; Bing, H.; Zhang, M.; Ye, Z.; Lv, B. Study on the Reliability Evaluation Method and Diagnosis of Bridges in Cold Regions Based on the Theory of MCS and Bayesian Networks. Sustainability 2022, 14, 13786. [Google Scholar] [CrossRef]
  15. Glaser, S.D.; Tolman, A. Sense of Sensing: From Data to Informed Decisions for the Built Environment. J. Infrastruct. Syst. 2008, 14, 4–14. [Google Scholar] [CrossRef]
  16. Posenato, D.; Lanata, F.; Inaudi, D.; Smith, I.F.C. Model-free data interpretation for continuous monitoring of complex structures. Adv. Eng. Inform. 2008, 22, 135–144. [Google Scholar] [CrossRef]
  17. Yan, A.M.; Kerschen, G.; De Boe, P.; Golinval, J.C. Structural damage diagnosis under varying environmental conditions—Part I: A linear analysis. Mech. Syst. Signal Process. 2005, 19, 847–864. [Google Scholar] [CrossRef]
  18. Alvandi, A.; Cremona, C. Assessment of vibration-based damage identification techniques. J. Sound Vib. 2006, 292, 179–202. [Google Scholar] [CrossRef]
  19. Alves, V.; Meixedo, A.; Ribeiro, D.; Calcada, R.; Cury, A. Evaluation of the performance of different damage indicators in railway bridges. In Proceedings of the 1st International Conference on Structural Integrity (ICSI), Funchal, Portugal, l–4 September 2015; Volume 114, pp. 746–753. [Google Scholar]
  20. Santos, J.P.; Cremona, C.; Orcesi, A.D.; Silveira, P. Multivariate statistical analysis for early damage detection. Eng. Struct. 2013, 56, 273–285. [Google Scholar] [CrossRef]
  21. Cury, A.; Cremona, C. Assignment of structural behaviours in long-term monitoring: Application to a strengthened railway bridge. Struct. Health Monit. Int. J. 2012, 11, 422–441. [Google Scholar] [CrossRef]
  22. Posenato, D.; Kripakaran, P.; Inaudi, D.; Smith, I.F.C. Methodologies for model-free data interpretation of civil engineering structures. Comput. Struct. 2010, 88, 467–482. [Google Scholar] [CrossRef]
  23. Entezami, A.; Shariatmadar, H. An unsupervised learning approach by novel damage indices in structural health monitoring for damage localization and quantification. Struct. Health Monit. Int. J. 2018, 17, 325–345. [Google Scholar] [CrossRef]
  24. Adams, D.E.; Farrar, C.R. Classifying Linear and Nonlinear Structural Damage Using Frequency Domain ARX Models. Struct. Health Monit. Int. J. 2002, 1, 185–201. [Google Scholar] [CrossRef]
  25. Sohn, H.; Allen, D.W.; Worden, K.; Farrar, C.R. Statistical Damage Classification Using Sequential Probability Ratio Tests. Struct. Health Monit. 2003, 2, 57–74. [Google Scholar] [CrossRef]
  26. Bao, C.; Hao, H.; Li, Z. Vibration-based structural health monitoring of offshore pipelines: Numerical and experimental study. Struct. Control. Health Monit. 2013, 20, 769–788. [Google Scholar] [CrossRef]
  27. Ay, A.M.; Wang, Y. Structural damage identification based on self-fitting ARMAX model and multi-sensor data fusion. Struct. Health Monit. Int. J. 2014, 13, 445–460. [Google Scholar] [CrossRef]
  28. Mujica, L.E.; Gharibnezhad, F.; Rodellar, J.; Todd, M. Considering temperature effect on robust principal component analysis orthogonal distance as a damage detector. Struct. Health Monit. Int. J. 2020, 19, 781–795. [Google Scholar] [CrossRef]
  29. Cavadas, F.; Smith, I.F.C.; Figueiras, J. Damage detection using data-driven methods applied to moving-load responses. Mech. Syst. Signal Process. 2013, 39, 409–425. [Google Scholar] [CrossRef]
  30. Peeters, B.; De Roeck, G. One-year monitoring of the Z24-Bridge: Environmental effects versus damage events. Earthq. Eng. Struct. Dyn. 2001, 30, 149–171. [Google Scholar] [CrossRef]
  31. de Lautour, O.R.; Omenzetter, P. Damage classification and estimation in experimental structures using time series analysis and pattern recognition. Mech. Syst. Signal Process. 2010, 24, 1556–1569. [Google Scholar] [CrossRef]
  32. Farrar, C.R.; Worden, K. An introduction to structural health monitoring. Philos. Trans. R. Soc. A Math. Phys. Eng. Sci. 2007, 365, 303–315. [Google Scholar] [CrossRef]
  33. Gonzalez, I.; Karoumi, R. BWIM aided damage detection in bridges using machine learning. J. Civ. Struct. Health Monit. 2015, 5, 715–725. [Google Scholar] [CrossRef]
  34. Nie, Z.; Lin, J.; Li, J.; Hao, H.; Ma, H. Bridge condition monitoring under moving loads using two sensor measurements. Struct. Health Monit. Int. J. 2020, 19, 917–937. [Google Scholar] [CrossRef]
  35. Magalhaes, F.; Cunha, A.; Caetano, E. Vibration based structural health monitoring of an arch bridge: From automated OMA to damage detection. Mech. Syst. Signal Process. 2012, 28, 212–228. [Google Scholar] [CrossRef]
  36. Ribeiro, D.; Leite, J.; Meixedo, A.; Pinto, N.; Calcada, R.; Todd, M. Statistical methodologies for removing the operational effects from the dynamic responses of a high-rise telecommunications tower. Struct. Control. Health Monit. 2021, 28, e2700. [Google Scholar] [CrossRef]
  37. Entezami, A.; Shariatmadar, H.; Karamodin, A. Data-driven damage diagnosis under environmental and operational variability by novel statistical pattern recognition methods. Struct. Health Monit. Int. J. 2019, 18, 1416–1443. [Google Scholar] [CrossRef]
  38. Datteo, A.; Busca, G.; Quattromani, G.; Cigada, A. On the use of AR models for SHM: A global sensitivity and uncertainty analysis framework. Reliab. Eng. Syst. Saf. 2018, 170, 99–115. [Google Scholar] [CrossRef]
  39. Yeager, M.; Gregory, B.; Key, C.; Todd, M. On using robust Mahalanobis distance estimations for feature discrimination in a damage detection scenario. Struct. Health Monit. Int. J. 2019, 18, 245–253. [Google Scholar] [CrossRef]
  40. Zhai, W.; Xia, H. Train-Track-Bridge Dynamic Interaction: Theory and Engineering Application, 1st ed.; Science Press: Beijing, China, 2011. [Google Scholar]
  41. Pan, C.-D.; Yu, L.; Liu, H.-L.; Chen, Z.-P.; Luo, W.-F. Moving force identification based on redundant concatenated dictionary and weighted l(1)-norm regularization. Mech. Syst. Signal Process. 2018, 98, 32–49. [Google Scholar] [CrossRef]
  42. Hou, R.; Xia, Y.; Bao, Y.; Zhou, X. Selection of regularization parameter for l(1)-regularized damage detection. J. Sound Vib. 2018, 423, 141–160. [Google Scholar] [CrossRef]
  43. Wang, H.; Zhu, Q.; Li, J.; Mao, J.; Hu, S.; Zhao, X. Identification of moving train loads on railway bridge based on strain monitoring. Smart Struct. Syst. 2019, 23, 263–278. [Google Scholar] [CrossRef]
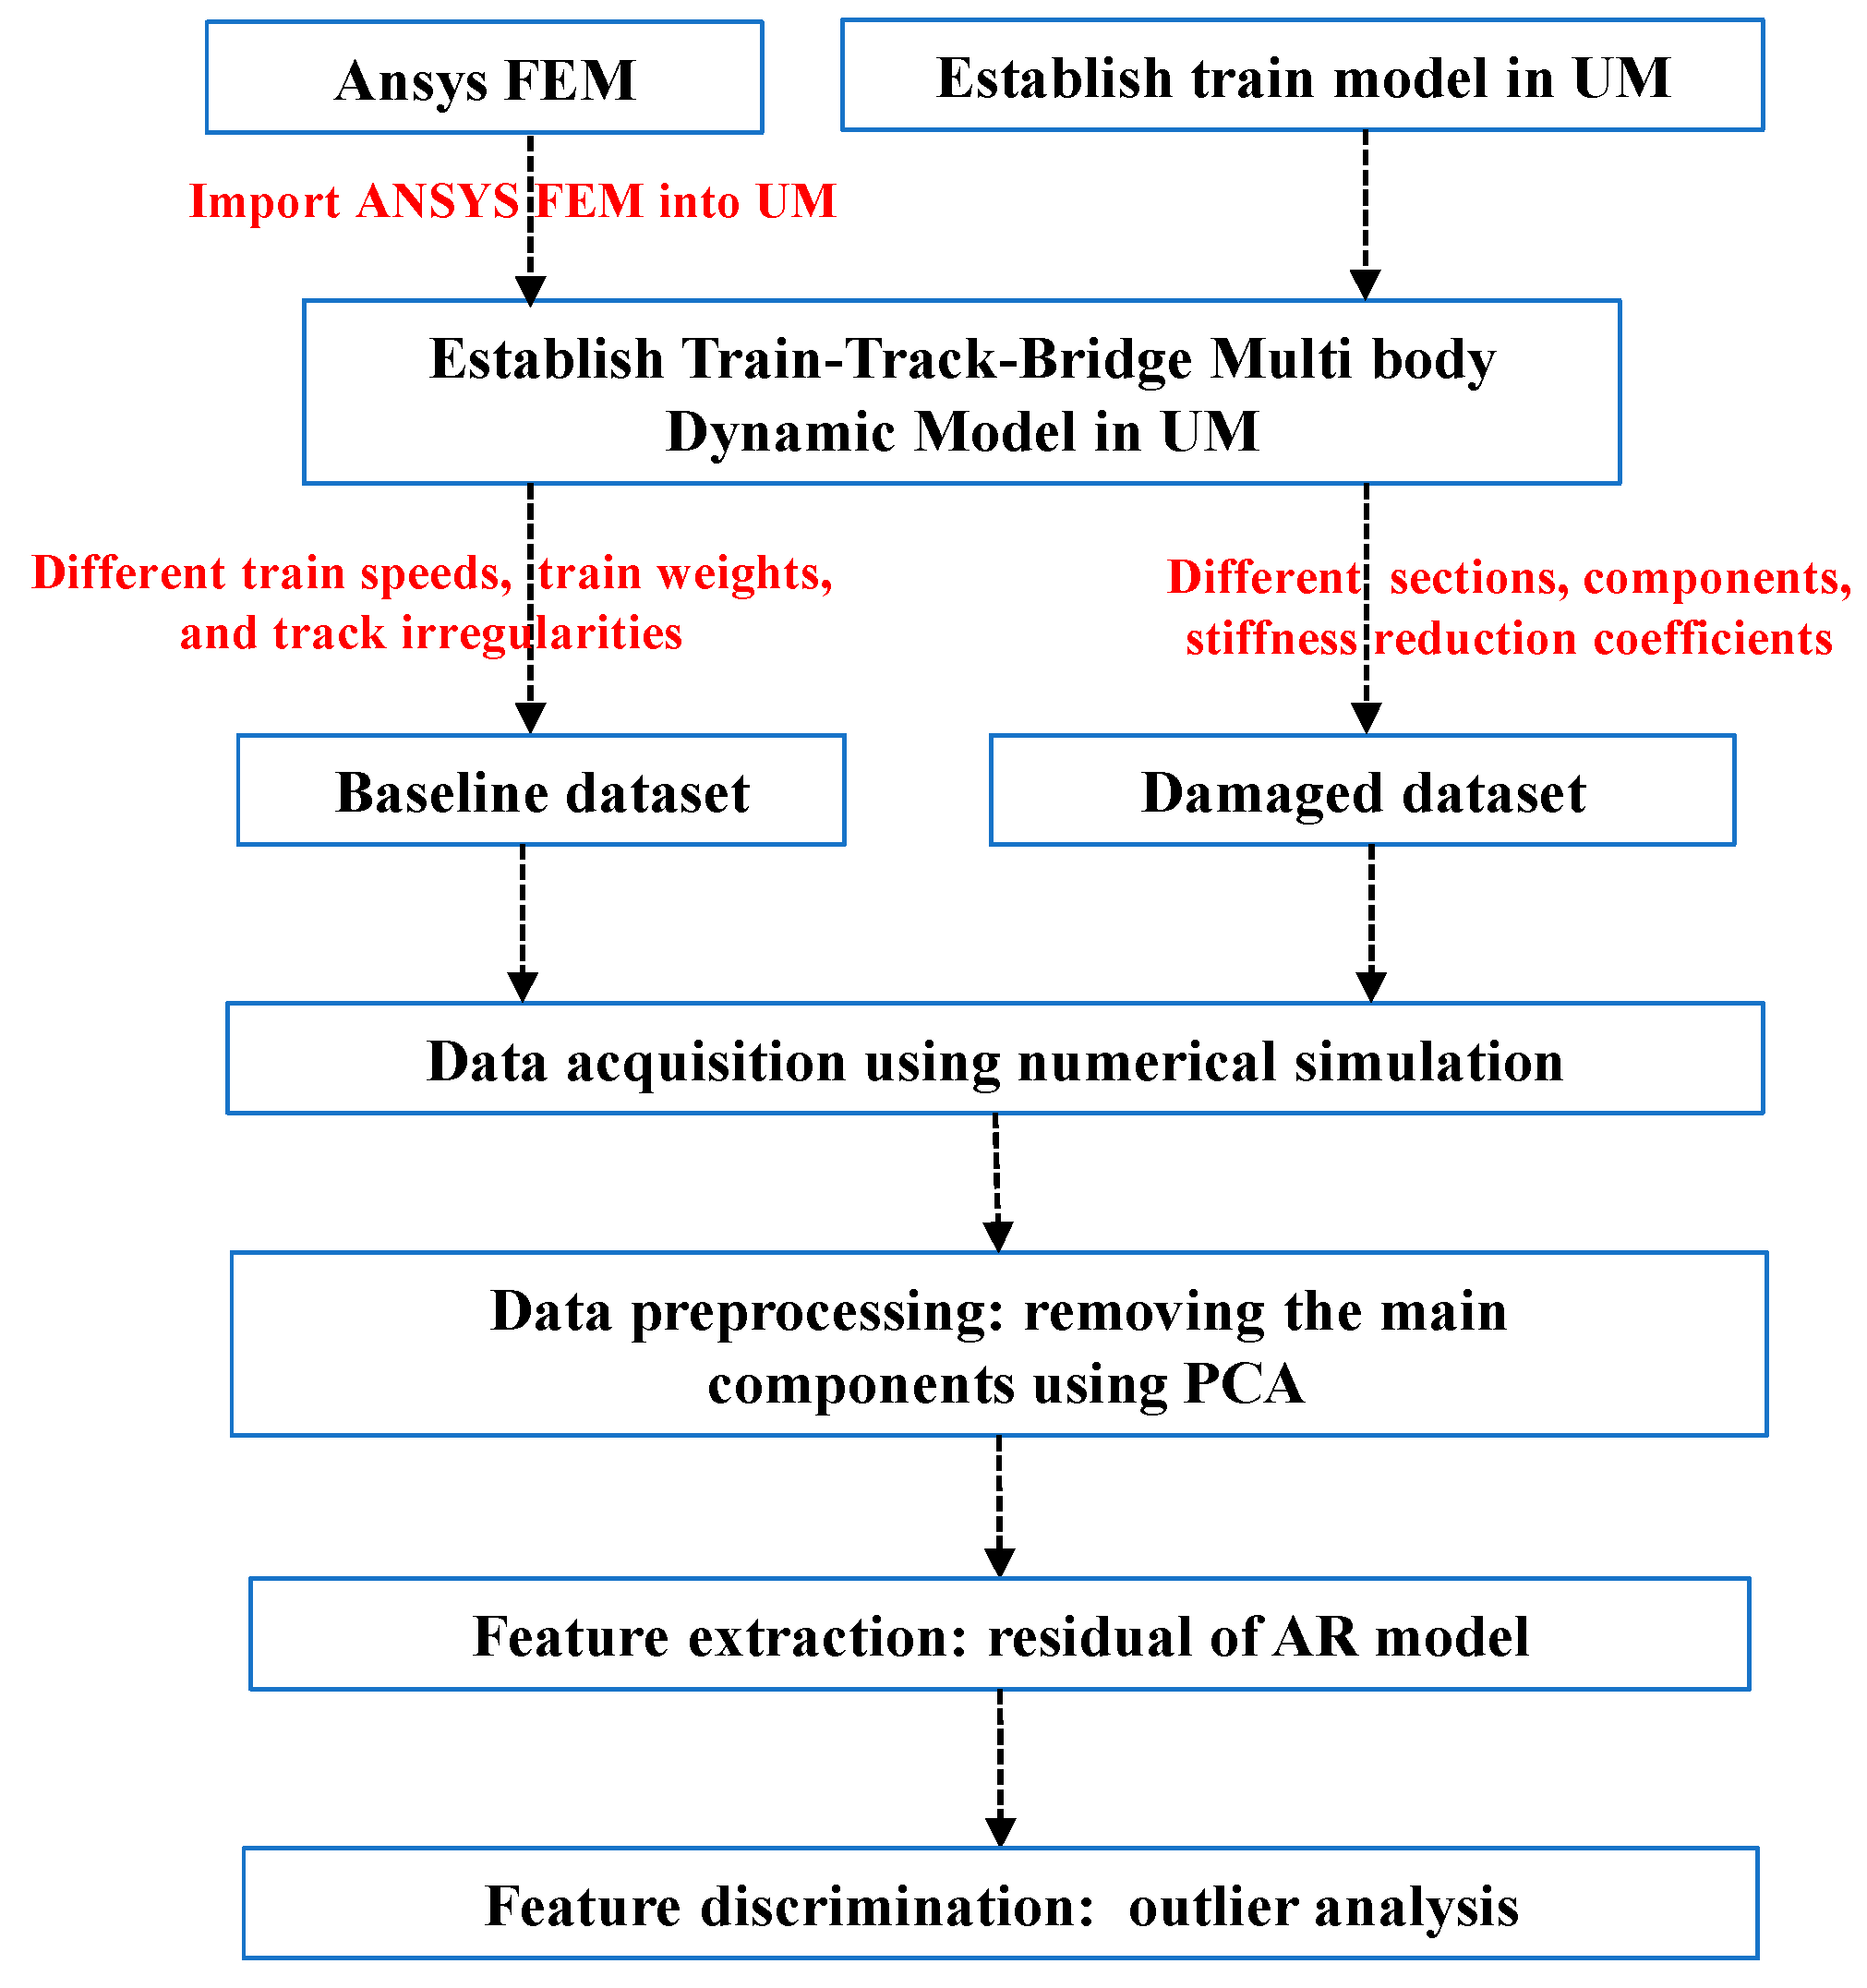
Figure 1. Flowchart of the damage detection methodology.
Sustainability 15 08552 g001
Figure 2. Design drawings and sensor layout of the investigated 32 m box girder.
Sustainability 15 08552 g002
Figure 3. Various views of three-dimensional FEM in ANSYS.
Sustainability 15 08552 g003
Figure 4. Schematic diagram of multi-body dynamics model in UM.
Sustainability 15 08552 g004
Figure 5. Schematic diagram of the rigid body model of the CRH380 high-speed train.
Sustainability 15 08552 g005
Figure 6. Various combinations of conditions at baseline and damaged state.
Sustainability 15 08552 g006
Figure 7. The section is divided into different components based on.
Sustainability 15 08552 g007
Figure 8. Average strain BIC curve for all cases.
Sustainability 15 08552 g008
Figure 9. Identification results of MD method for damage detection: (a) MD value of P3b without noise; (b) MD value of P3b for L/4 section damage without noise; (c) MD value of P3b with 5% noise; (d) MD value of P3b for L/4 section damage with 5% noise.
Sustainability 15 08552 g009aSustainability 15 08552 g009b
Figure 10. Identification results of L/4 section when P1b to P9b are used for damage detection: (a) DF value for L/4 section Bottom plate damage with 5% noise; (b) DF value for L/4 section Left web damage with 5% noise; (c) DF value for L/4 section Right web damage with 5% noise; (d) DF value for L/4 section Top plate damage with 5% noise; (e) DF value for L/4 section Left track plate damage with 5% noise.
Sustainability 15 08552 g010aSustainability 15 08552 g010b
Figure 11. Identification results of L/4 section when P10b to P18b are used for damage detection: (a) DF value for L/4 section Bottom plate damage with 5% noise; (b) DF value for L/4 section Right web damage with 5% noise.
Sustainability 15 08552 g011
Figure 12. Identification results of L/2 section when P1b to P9b are used for damage detection: (a) DF value for L/2 section Bottom plate damage with 5% noise; (b) DF value for L/2 section Left web damage with 5% noise.
Sustainability 15 08552 g012
Figure 13. Identification results of 3L/4 section when P1b to P9b are used for damage detection: (a) DF value for 3L/4 section Bottom plate damage with 5% noise; (b) DF value for 3L/4 section Left web damage with 5% noise.
Sustainability 15 08552 g013
Figure 14. Identification results of L/4 section when P1t to P9t are used for damage detection: (a) DF value for L/4 section Top plate damage with 5% noise; (b) DF value for L/4 section Left track plate damage with 5% noise; (c) DF value for L/4 section Right track plate damage with 5% noise.
Sustainability 15 08552 g014aSustainability 15 08552 g014b
Figure 15. Identification results of L/4 section when P10t to P18t are used for damage detection: (a) DF value for L/4 section Top plate damage with 5% noise; (b) DF value for L/4 section Right track plate damage with 5% noise.
Sustainability 15 08552 g015
Figure 16. Damaged cases for L/4 section with different train weights: (a) Empty train with full passengers for L/4 section Bottom plate damage with 5% noise; (b) Empty train with no passengers for L/4 section Bottom plate damage with 5% noise.
Sustainability 15 08552 g016
Figure 17. Damaged cases for L/4 section with different vertical track irregularity: (a) UIC good vertical irregularity for L/4 section Bottom plate damage with 5% noise; (b) UIC bad vertical irregularity for L/4 section Bottom plate damage with 5% noise.
Sustainability 15 08552 g017
Figure 18. Damaged cases for L/4 section with different train speeds: (a) 360 km/h for L/4 section Bottom plate damage with 5% noise; (b) 300 km/h for L/4 section Bottom plate damage with 5% noise.
Sustainability 15 08552 g018
Table 1. Detailed parameters of FEM.
ItemElement TypeDensity (kg/m3)Poisson’s RatioElastic Modulus (N/m2)
Main girderSolid6526810.2024.29 × 1010
self-compacting concrete filling layer3.79 × 1010
Track plate4.06 × 1010
Other
secondary
dead loads
Element
type
Value (N/m)Elastic modulus(N/m2)
Mass216.702 × 104/
Prestressed
steel
Element typeDensity
(kg/m3)
Poisson’s ratioElastic
modulus (N/m2)
Coefficient of linear expansion
Link880050.31.95 × 10111.2 × 10−5
Rail Element typeDensity
(kg/m3)
Poisson’s ratioElastic modulus (N/m2)
Beam 18878000.32.06 × 1011
Spring
fasteners
ItemElement
type
VerticalLongitudinal Transverse
Elastic stiffness
(N/m)
Combin145 × 1073 × 1073 × 107
Damping coefficient
(N/(m/s))
6 × 1046 × 1047.5 × 104
Table 2. Detailed parameters of high-speed trains.
Train NumberEmpty Train
Weight (kN)
Number of
Passengers
Total
Weight (kN)
Average Axle Weight (kN)
M1548.833574.3143.6
T2599.885666.4166.6
M3585.185651.7162.9
T4541.075599.8149.9
T5563.563612.5153.1
M6599.885666.4166.6
T7588.085654.6163.7
M8536.145571.3142.8
Disclaimer/Publisher’s Note: The statements, opinions and data contained in all publications are solely those of the individual author(s) and contributor(s) and not of MDPI and/or the editor(s). MDPI and/or the editor(s) disclaim responsibility for any injury to people or property resulting from any ideas, methods, instructions or products referred to in the content.