
Optimal Preventive Maintenance, Repair, and Replacement Program for Catch Basins to Reduce Urban Flooding: Integrating Agent-Based Modeling and Monte Carlo Simulation


Abstract
1. Introduction
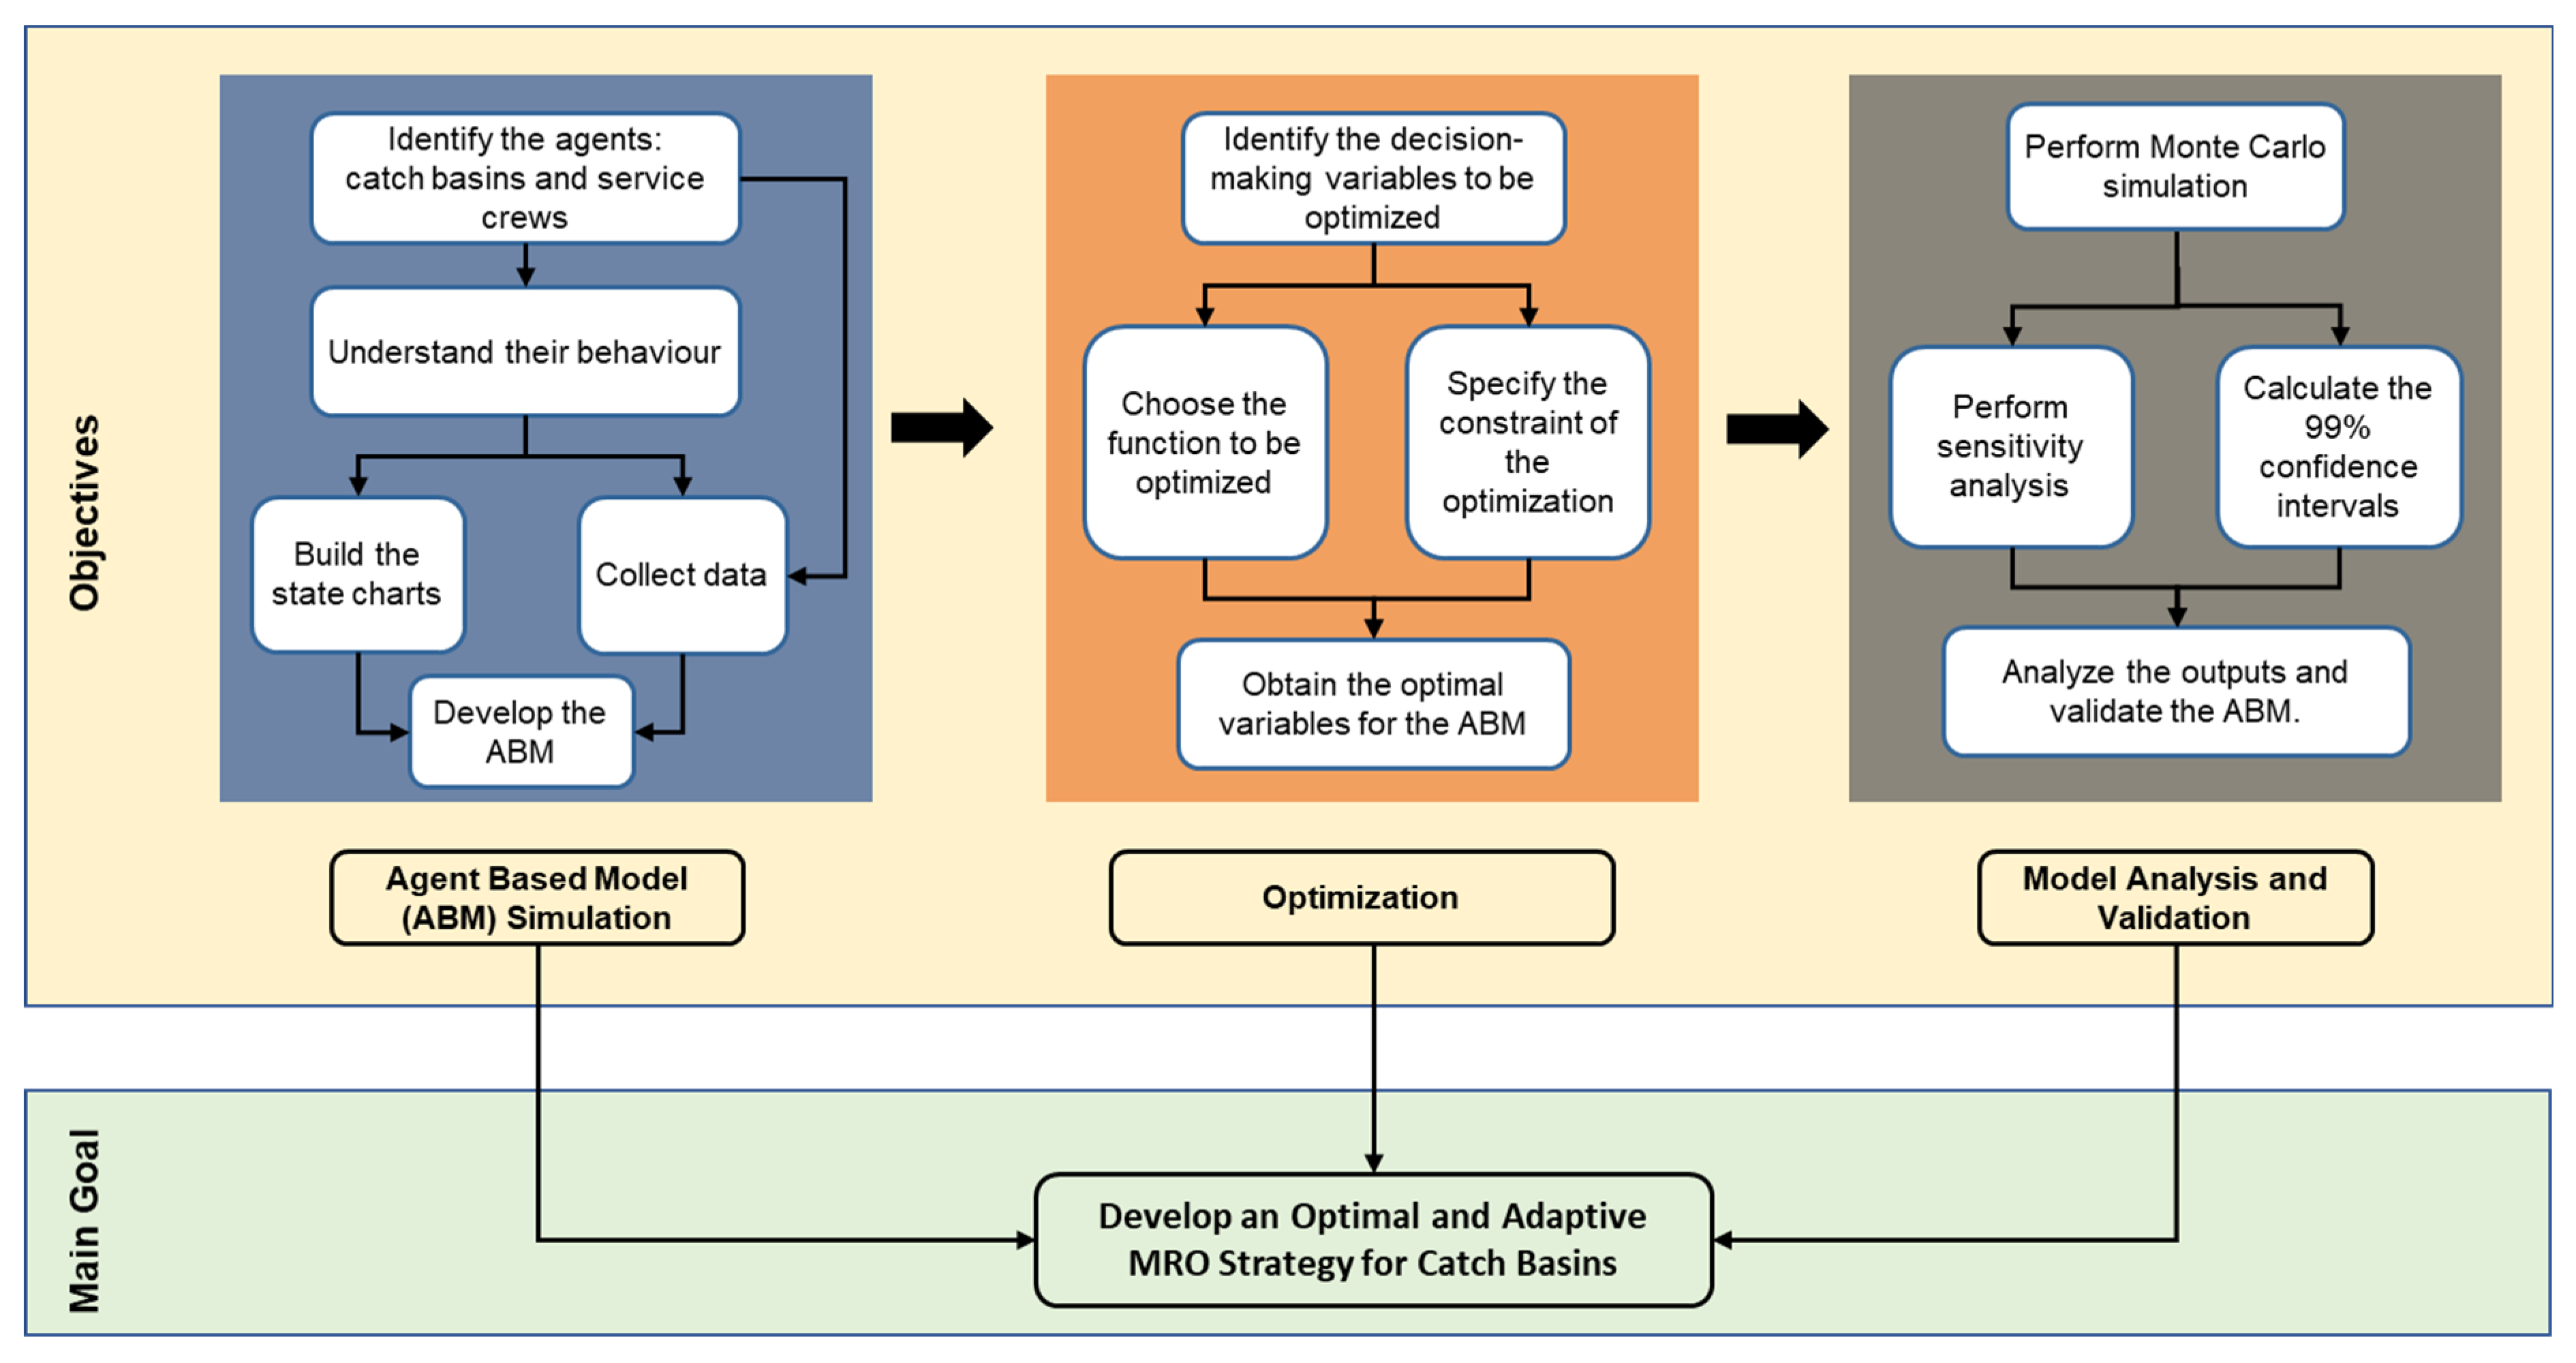
2. Goal and Objectives
3. Literature Review
3.1. CBs-Related Research Efforts
3.2. Agent-Based Modelling (ABM)
3.3. Knowledge Gap
4. Methodology
4.1. Step 1: Development of the Agent-Based Model
4.1.1. Agent Types
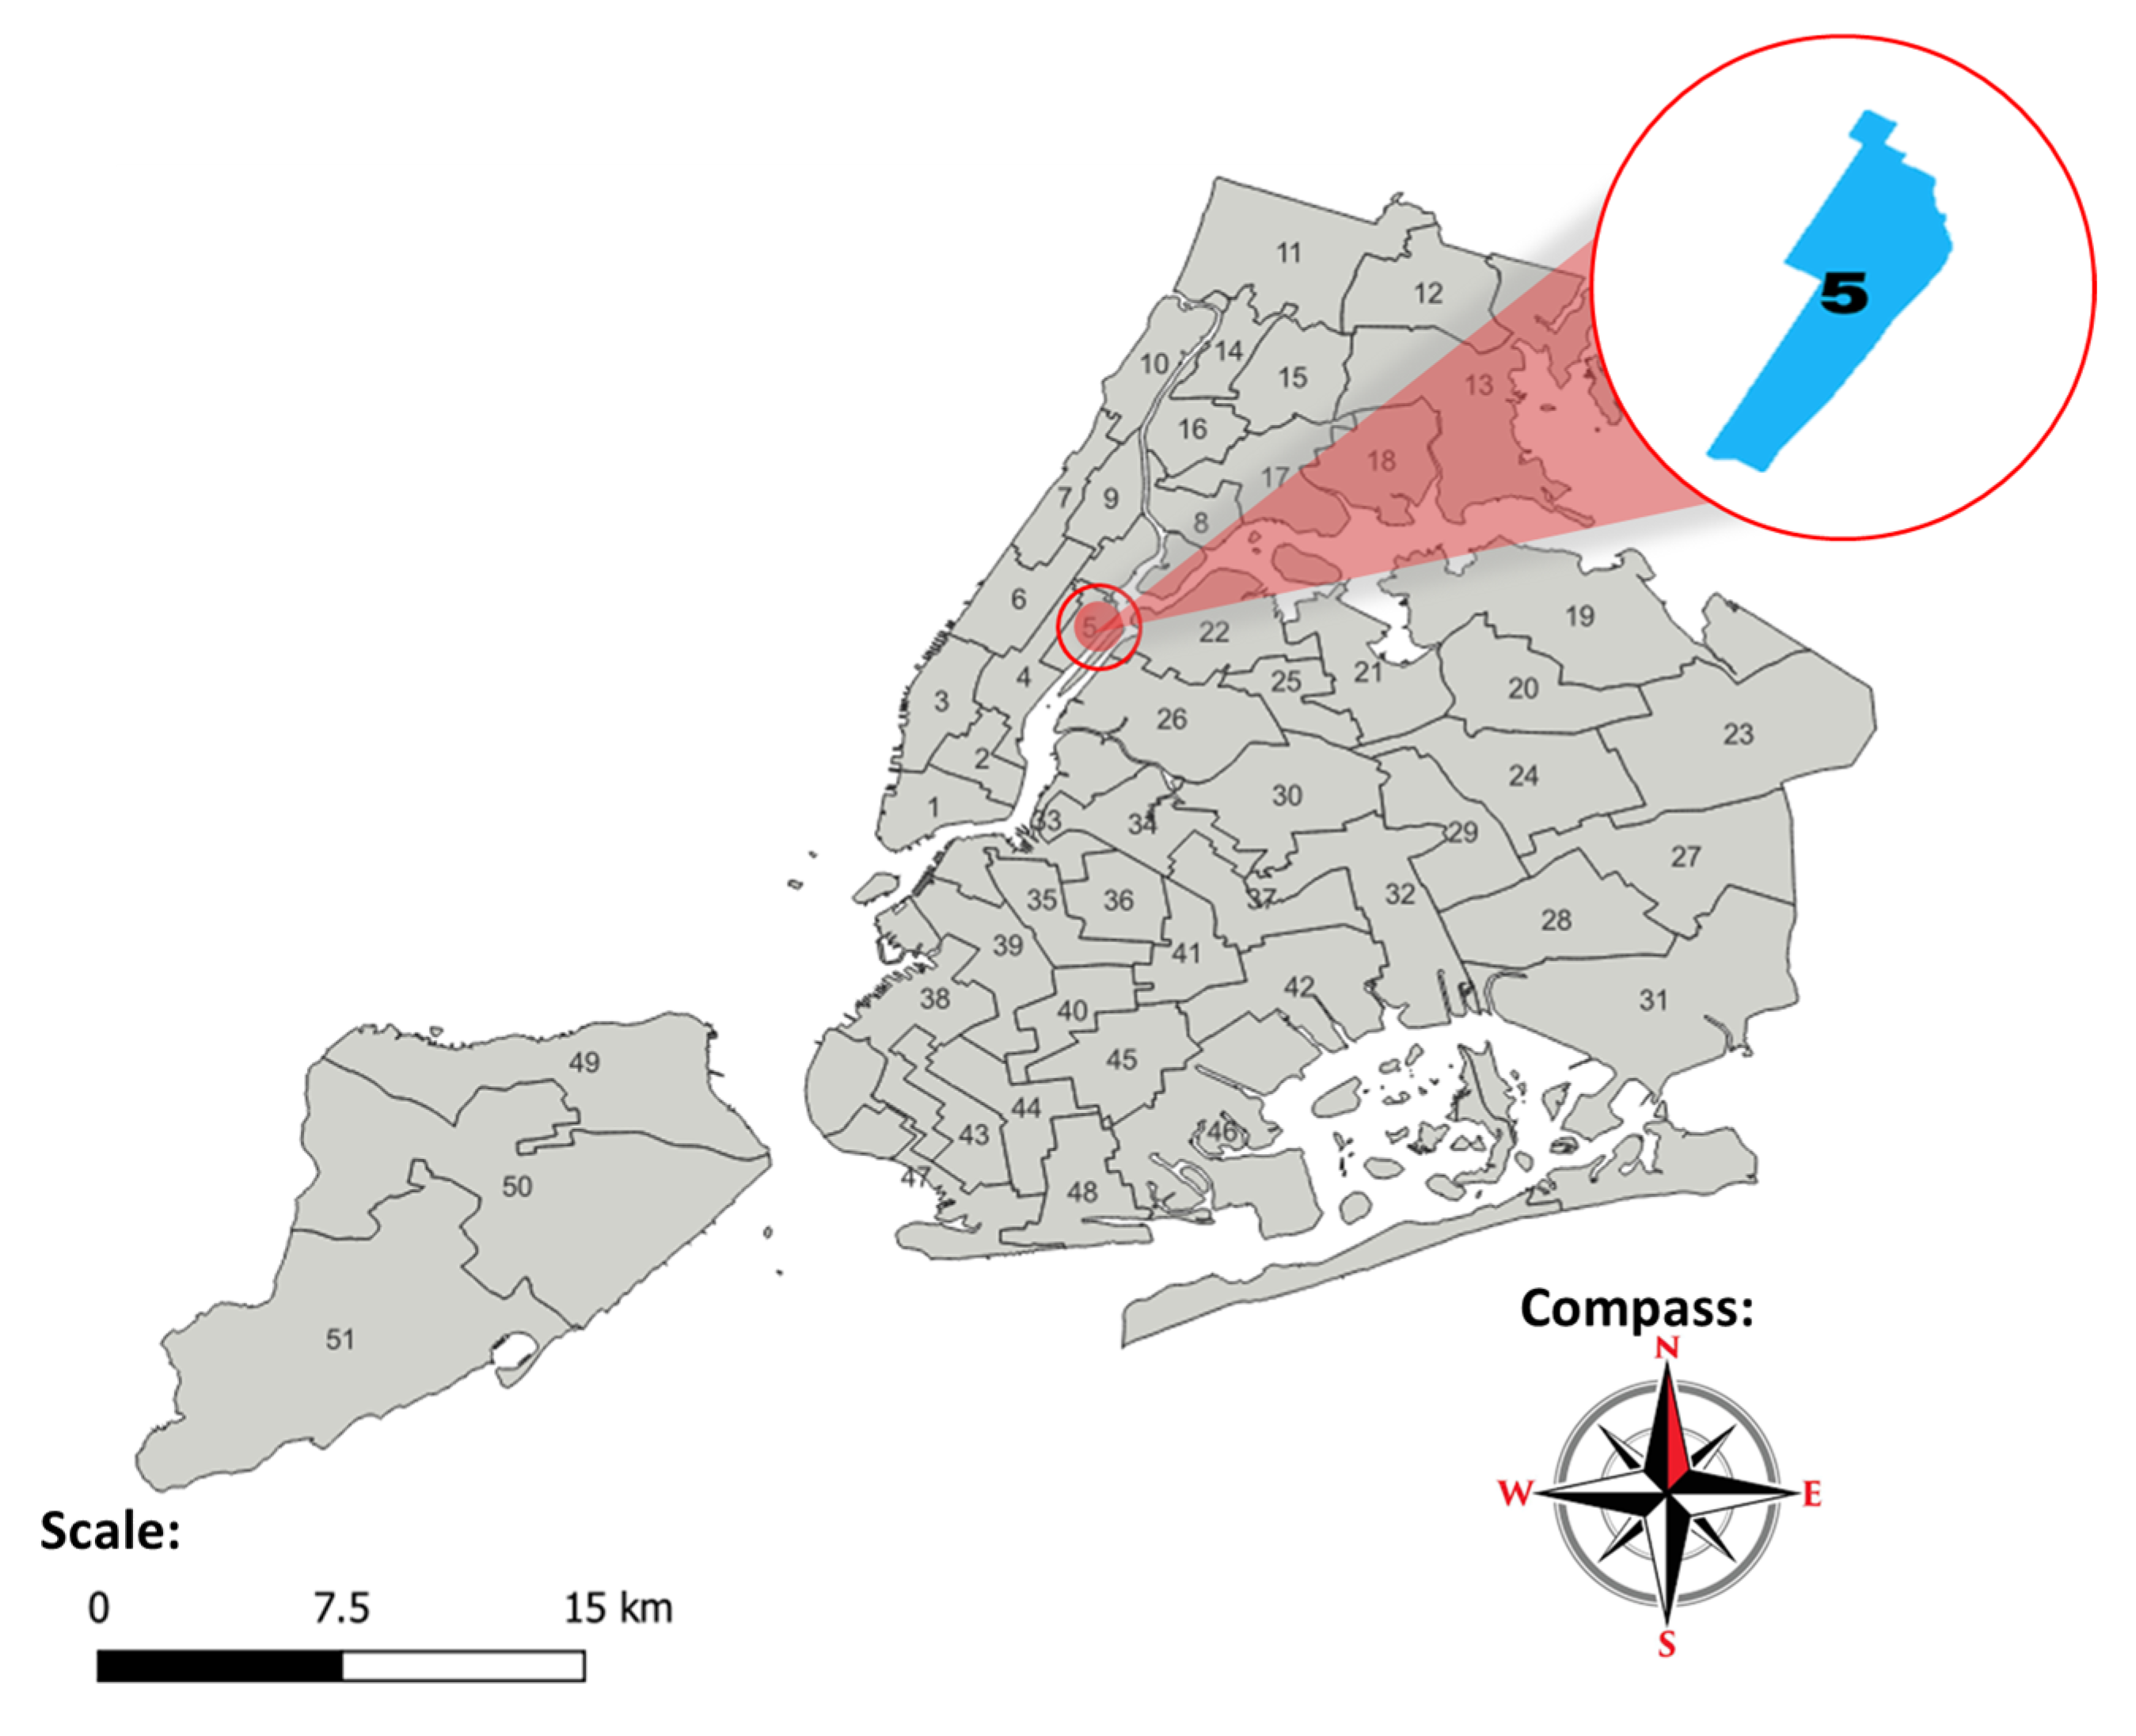
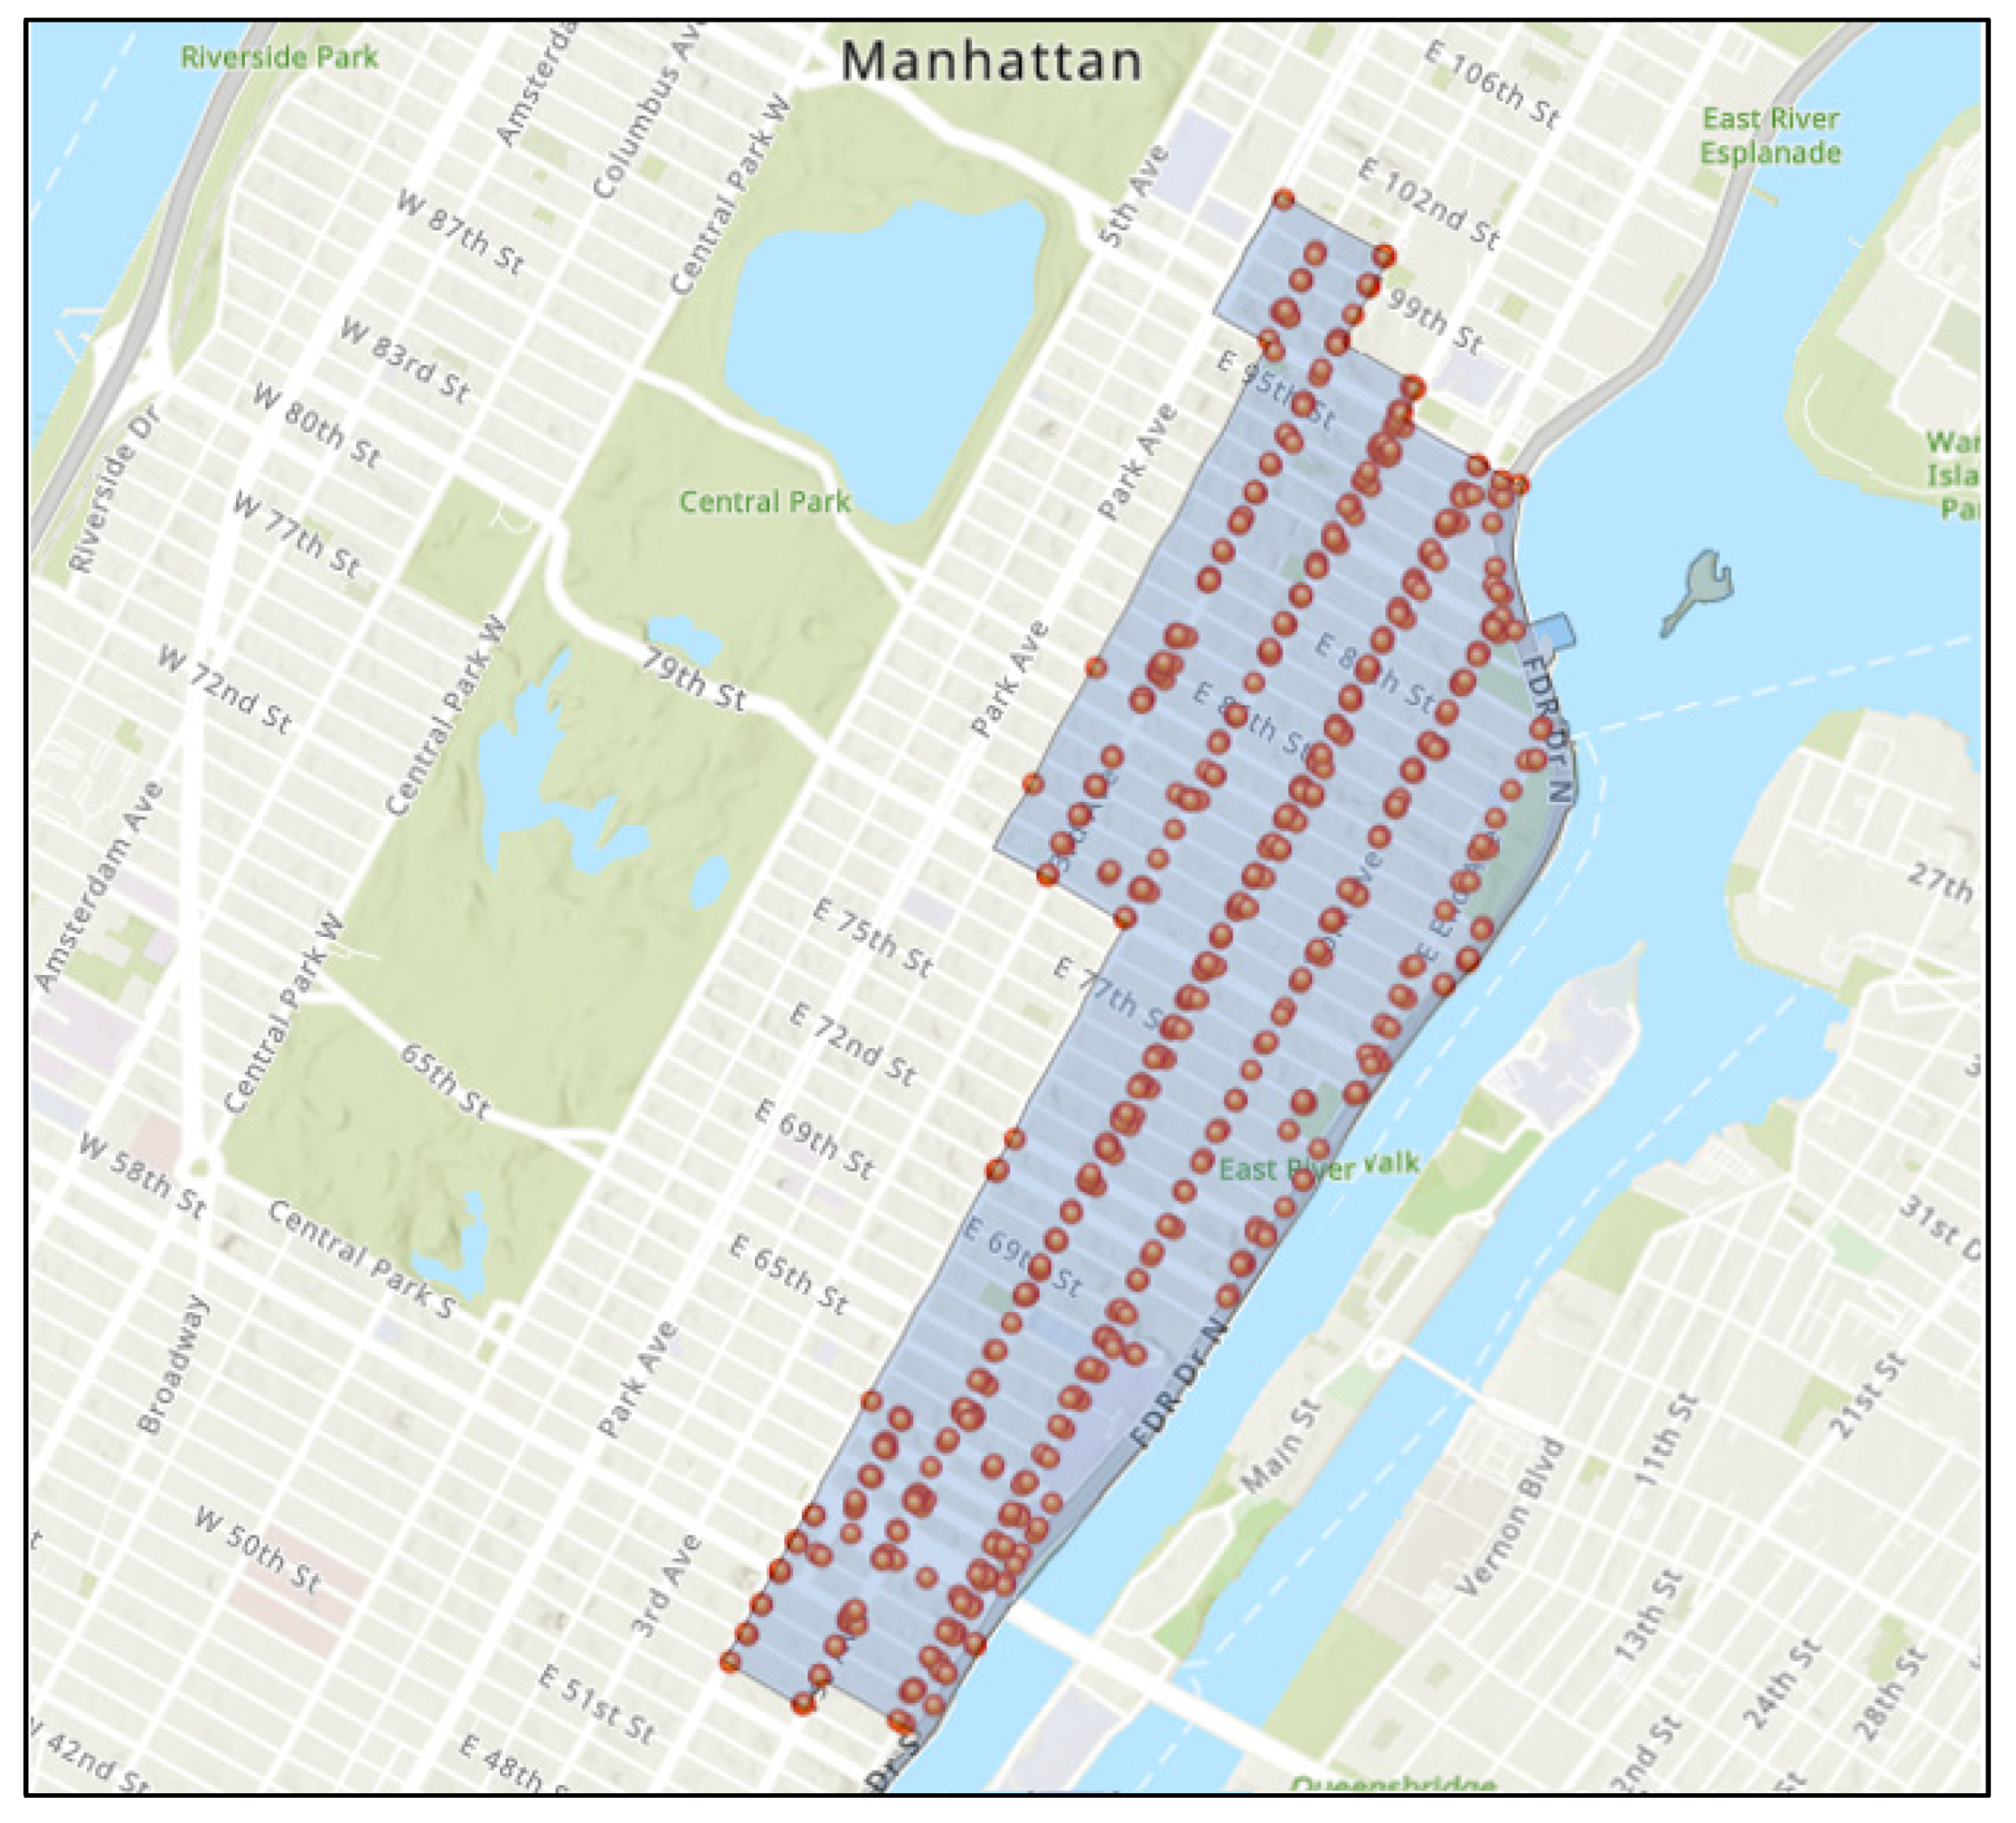
4.1.2. Study Area and Data Collection
Study Area
Data Collection
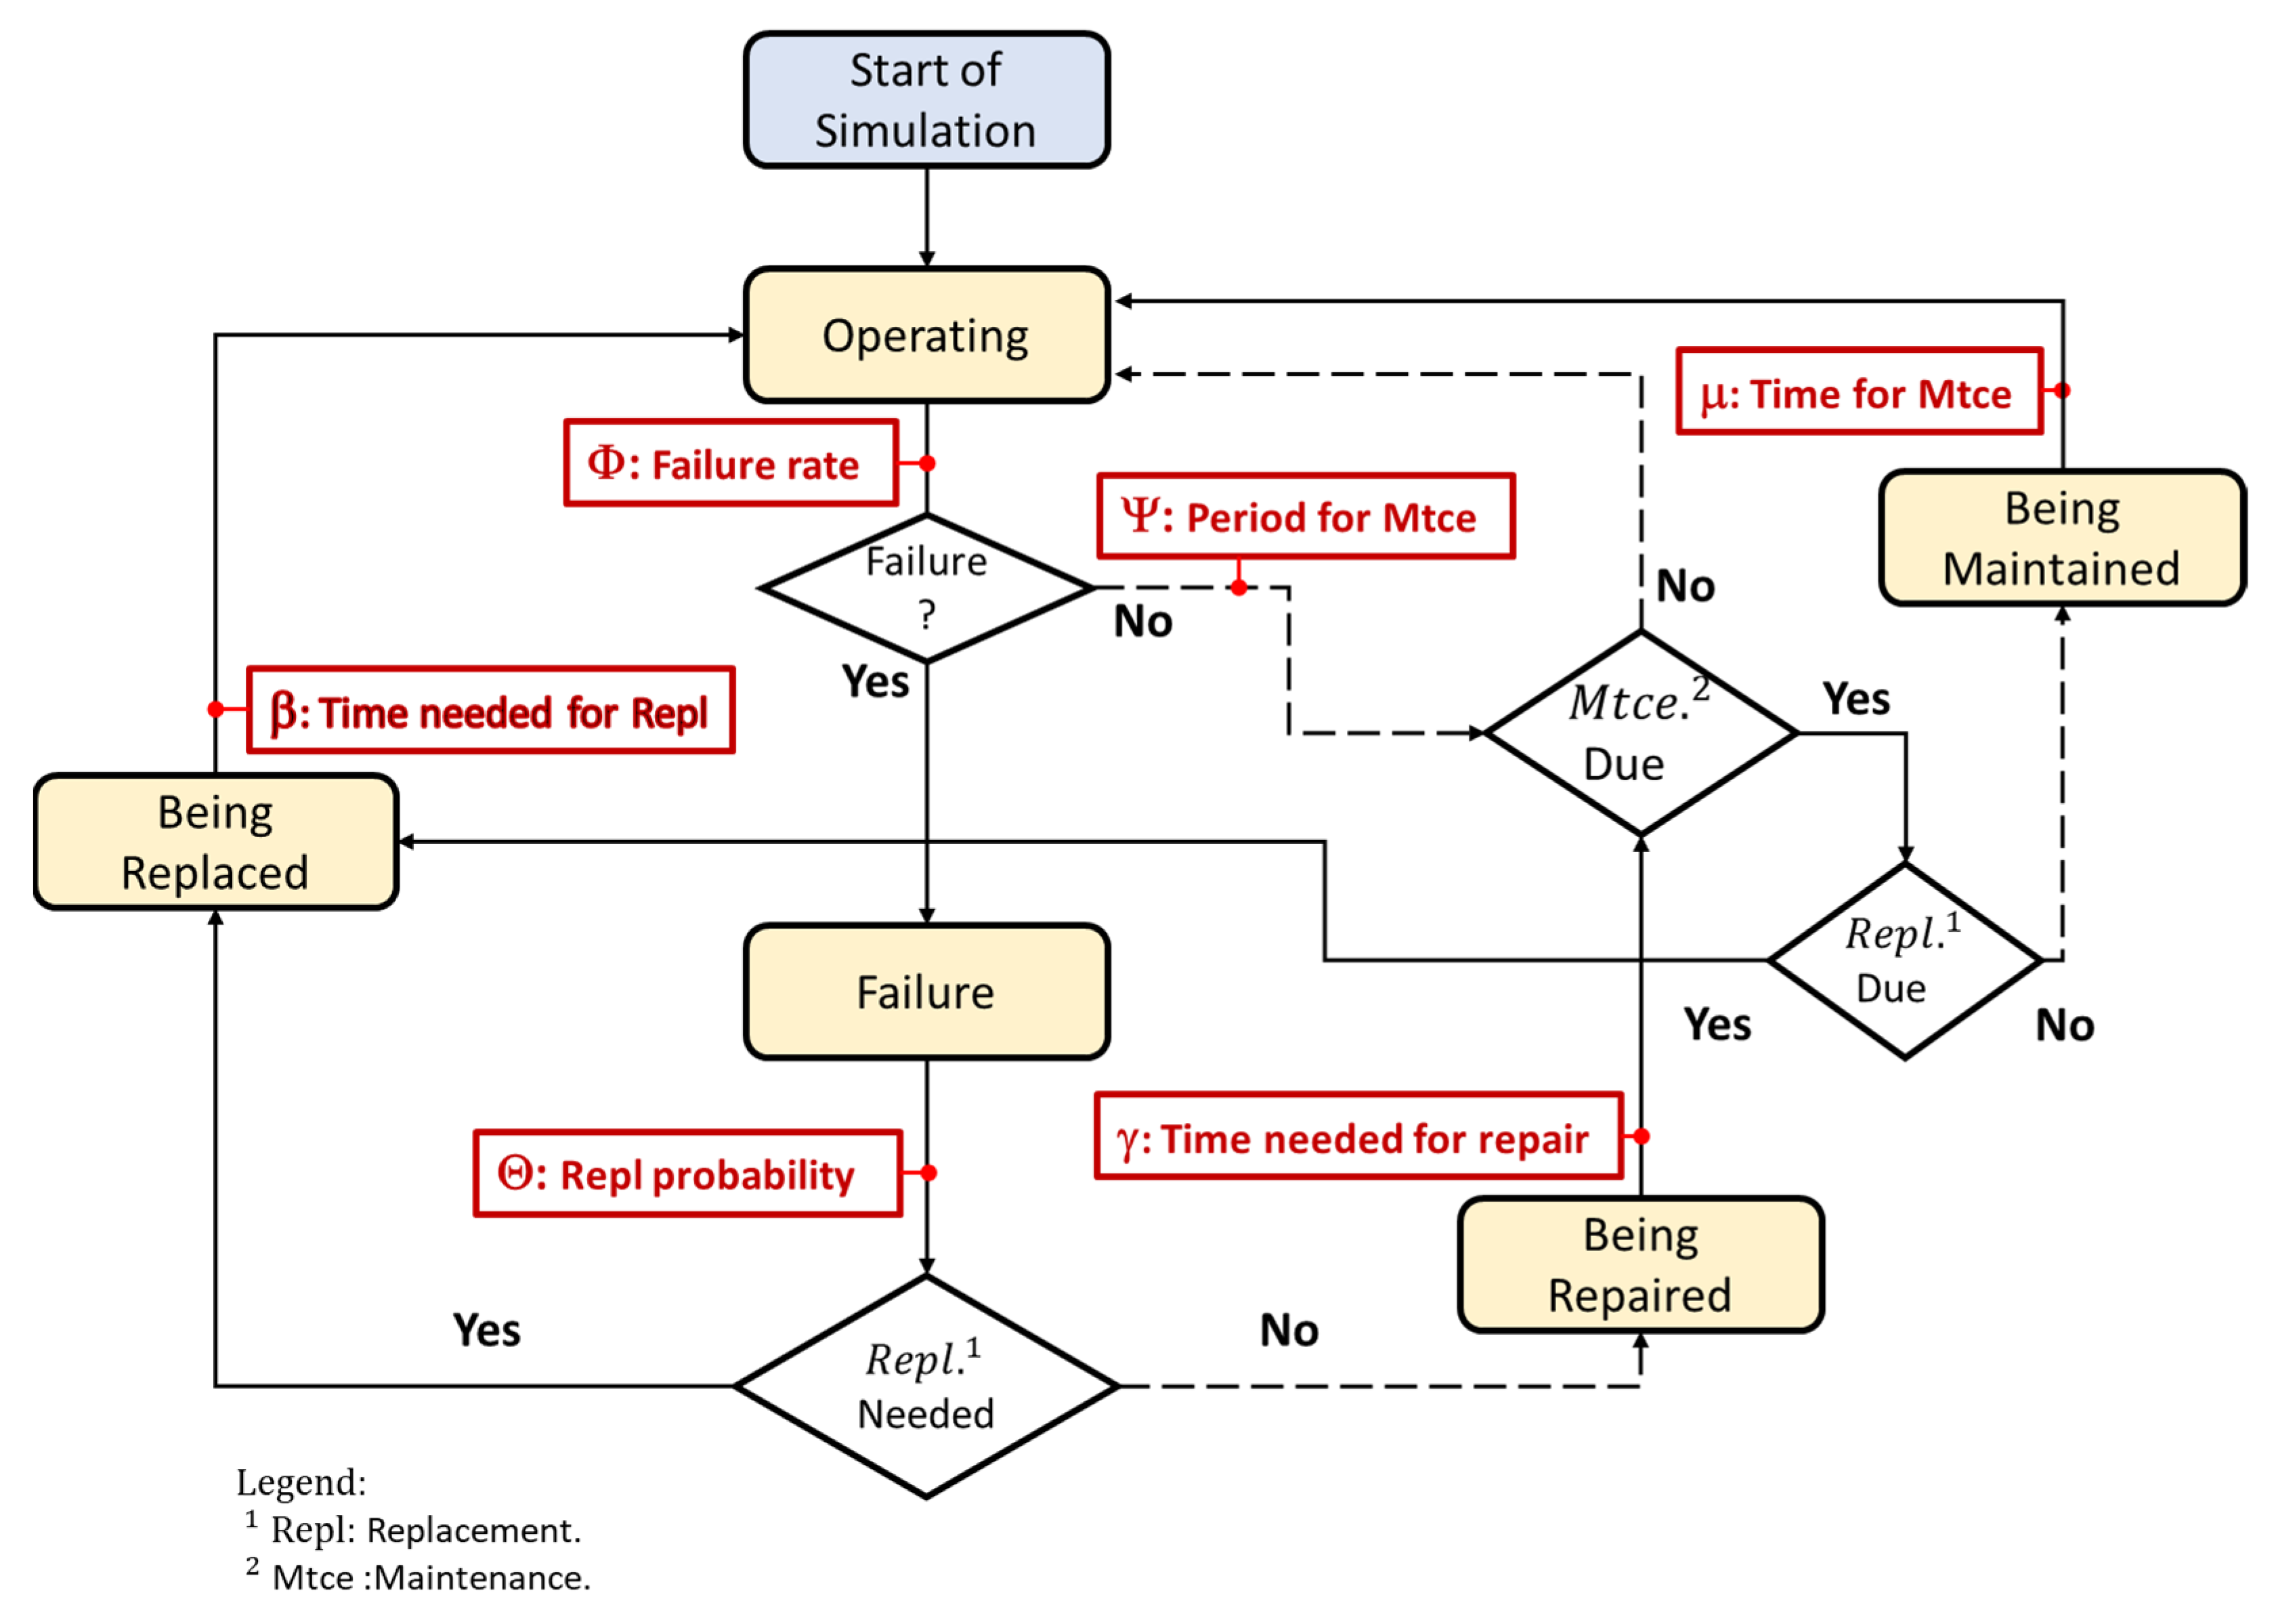
4.1.3. Agents’ State Charts
4.1.4. CBs
- Operating: All CBs enter the simulation process through this state in order to consider all the CBs as normally operating basins at the beginning of the simulation.
- Being maintained: The CB can be maintained in two cases:
- If the period for maintenance, ψ (in days), is due and if the need for replacement is not due yet.
- If the CB has been repaired and if maintaining the CB is due.
- 3.
- Failure: The CB reaches its failure state according to the failure rate (unitless). The failure rate is defined by three parameters (as shown in Equation (3)): the base failing rate ε (unitless), the lifetime factor LF (represented in Equation (1)), and the factor of maintenance FM (as shown in Equation (2)). The failure of a CB is defined in this paper to be when either water begins to infiltrate from outside the concrete casting or percolates between the asphalt and steel frame of the CB, which then causes the frame and grate to sink under the traffic stress load, resulting in a shifting grate that moves vertically or a complete failure and the formation of a sink hole. Moreover, a CB is considered to be a failed CB that needs replacement if repair is no longer capable of fixing the CB.where LF refers to the lifetime factor, AF represents the age factor, and ψ is the period for maintenance and is expressed in days.where FM is the factor of maintenance and ψ is the period for maintenance (in days).where is the rate of failure, LF is the lifetime factor, ε is the base failing rate, and FM is the factor of maintenance.
- 4.
- Being repaired: If a CB has failed but replacement is not needed, repair is done. The CB departs its “Being Repaired” state after γ (in days), where γ is defined as the time required for the service crews to repair a CB. After the crew has finished repairing the CB, they check if maintenance is due; if not, the CB goes back to its operating state. The CB repairs considered in this study are structural and range from a simple patching of the asphalt around the perimeter with a quick mortar repair to major or complete structural repairs.
- 5.
- Being Replaced: Under the following two cases, a CB enters the “Being Repaired” state:
- If the CB has failed and, according to the replacement probability θ (unitless), replacing the CB is required or the age of the CB is greater than the time for replacing the CB (as shown in Equation (4)).
- If maintenance is due and the age of the CB is greater than the time for replacement.
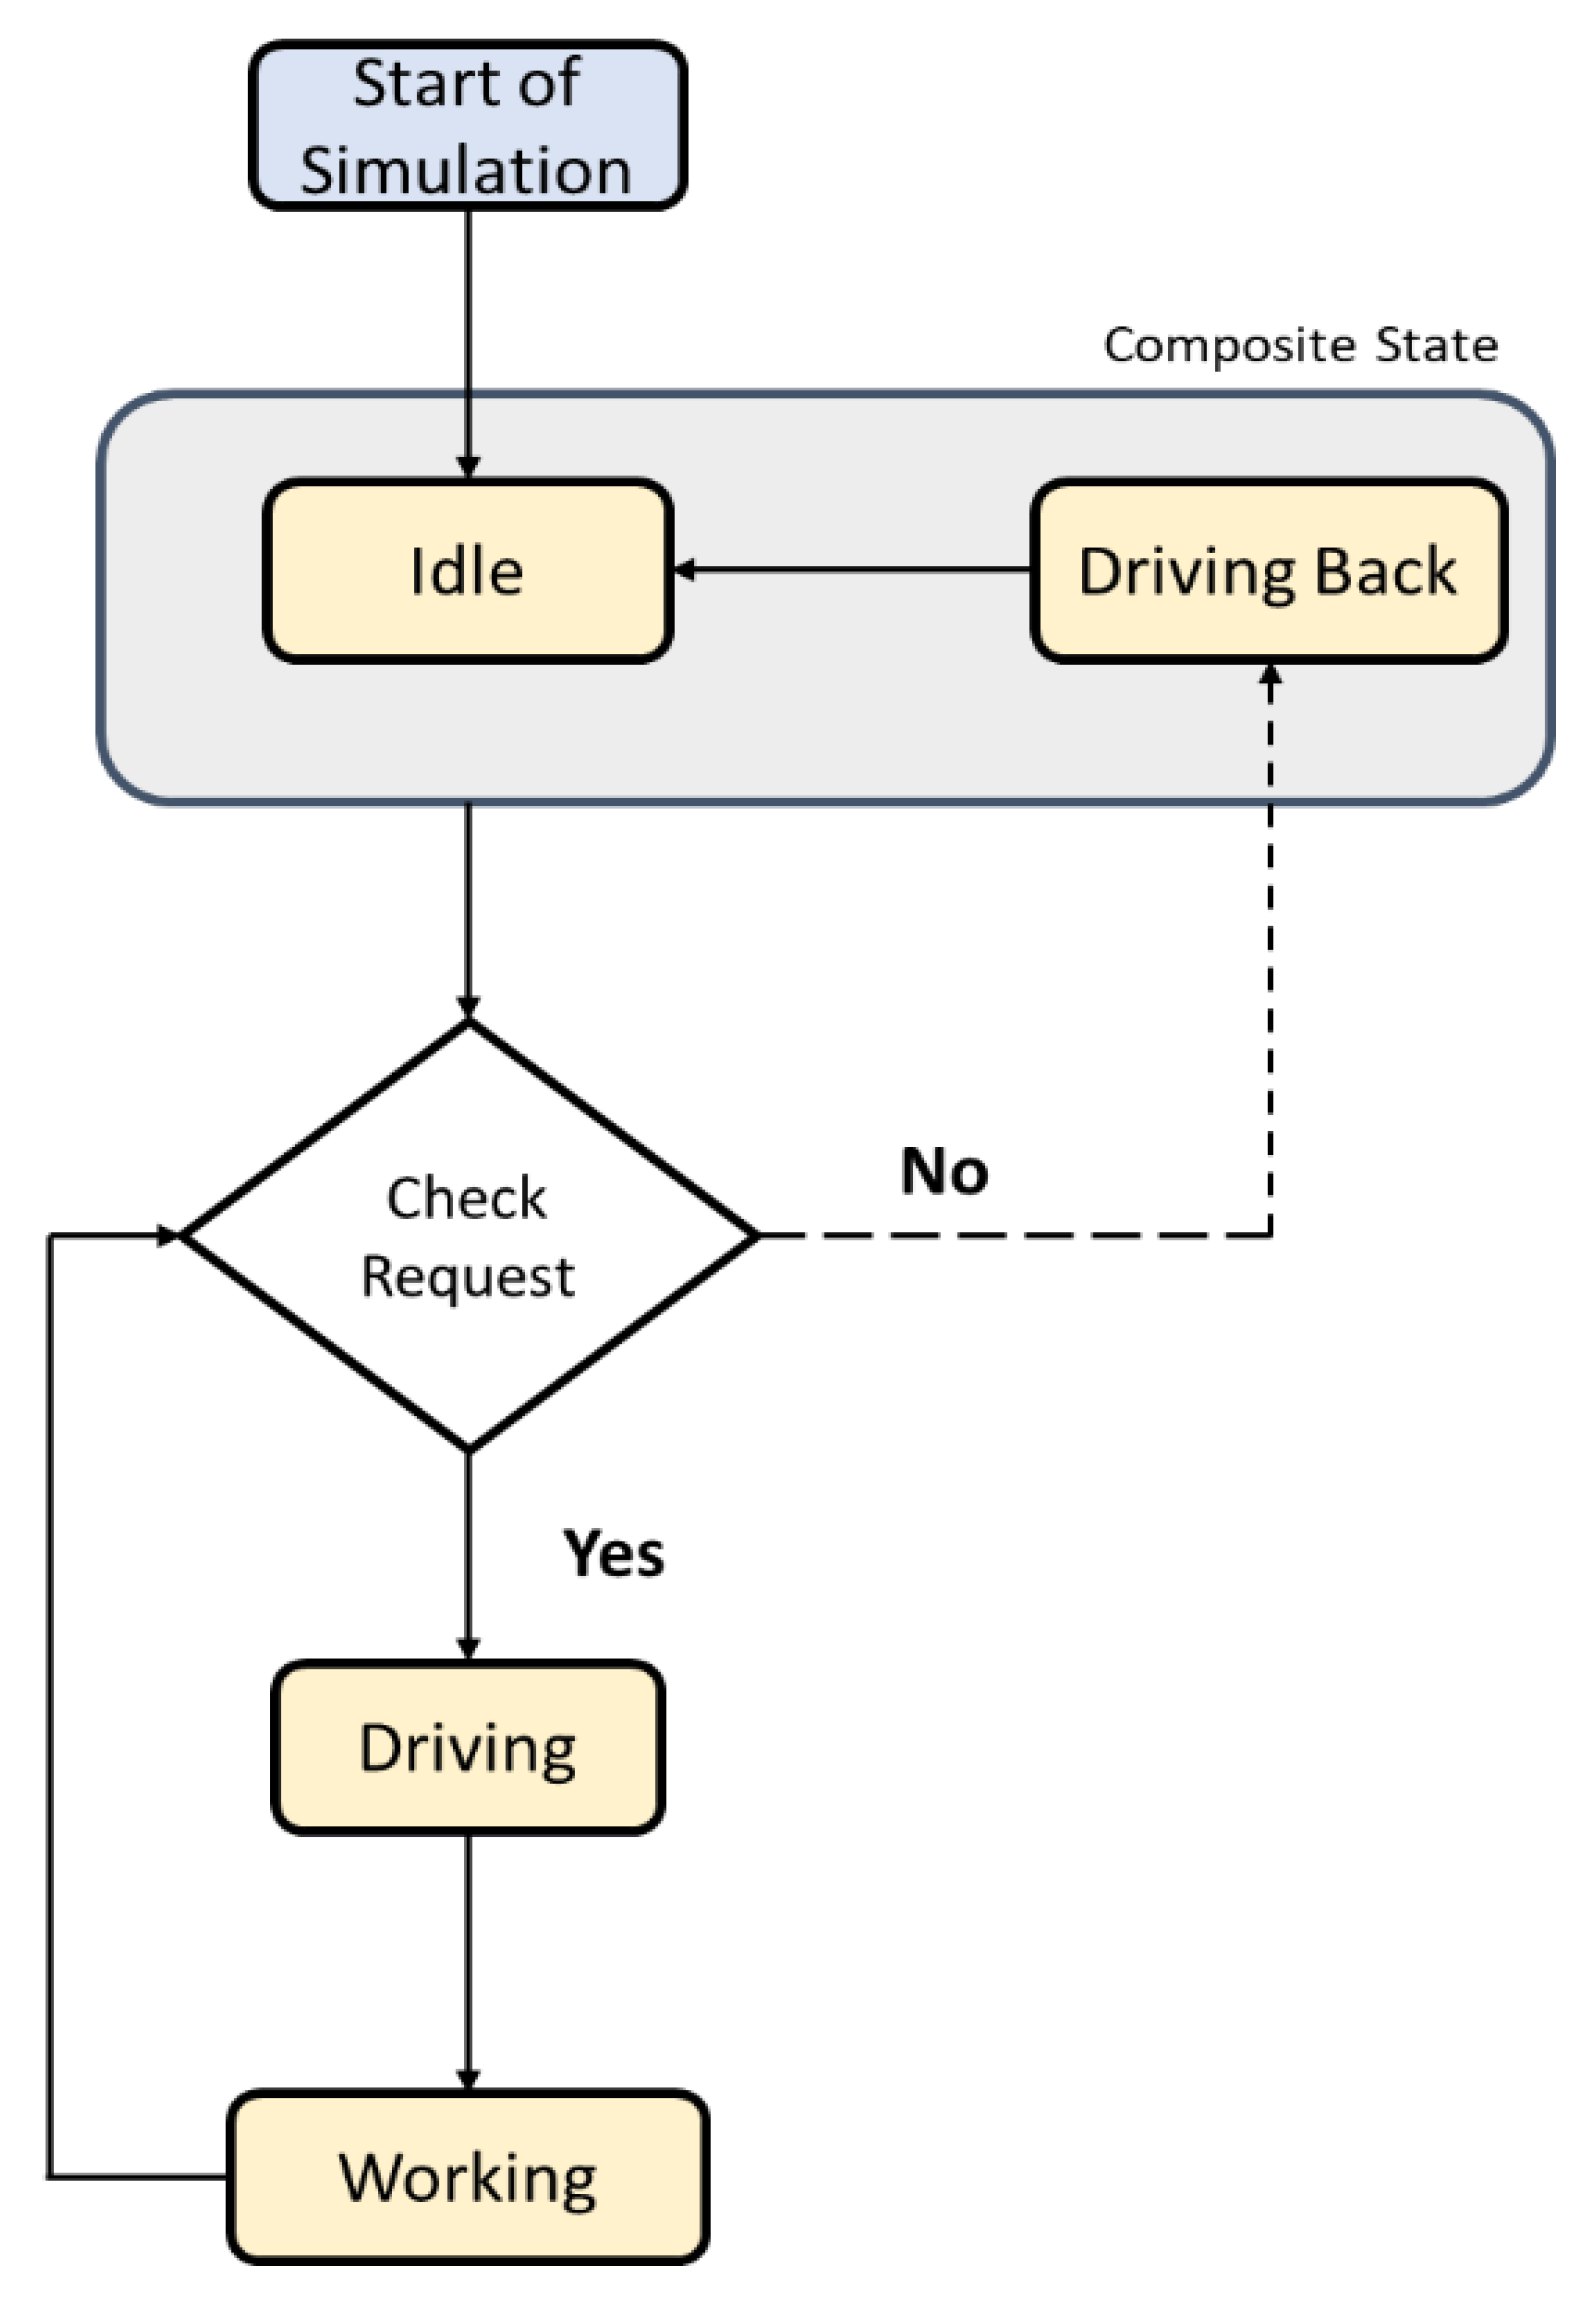
4.1.5. Service Crews
4.2. Step 2: Optimization
4.3. Step 3: Model Analysis and Validation
4.3.1. Sensitivity Analysis
4.3.2. Monte Carlo Simulation
4.3.3. Validation of the Model
5. Results
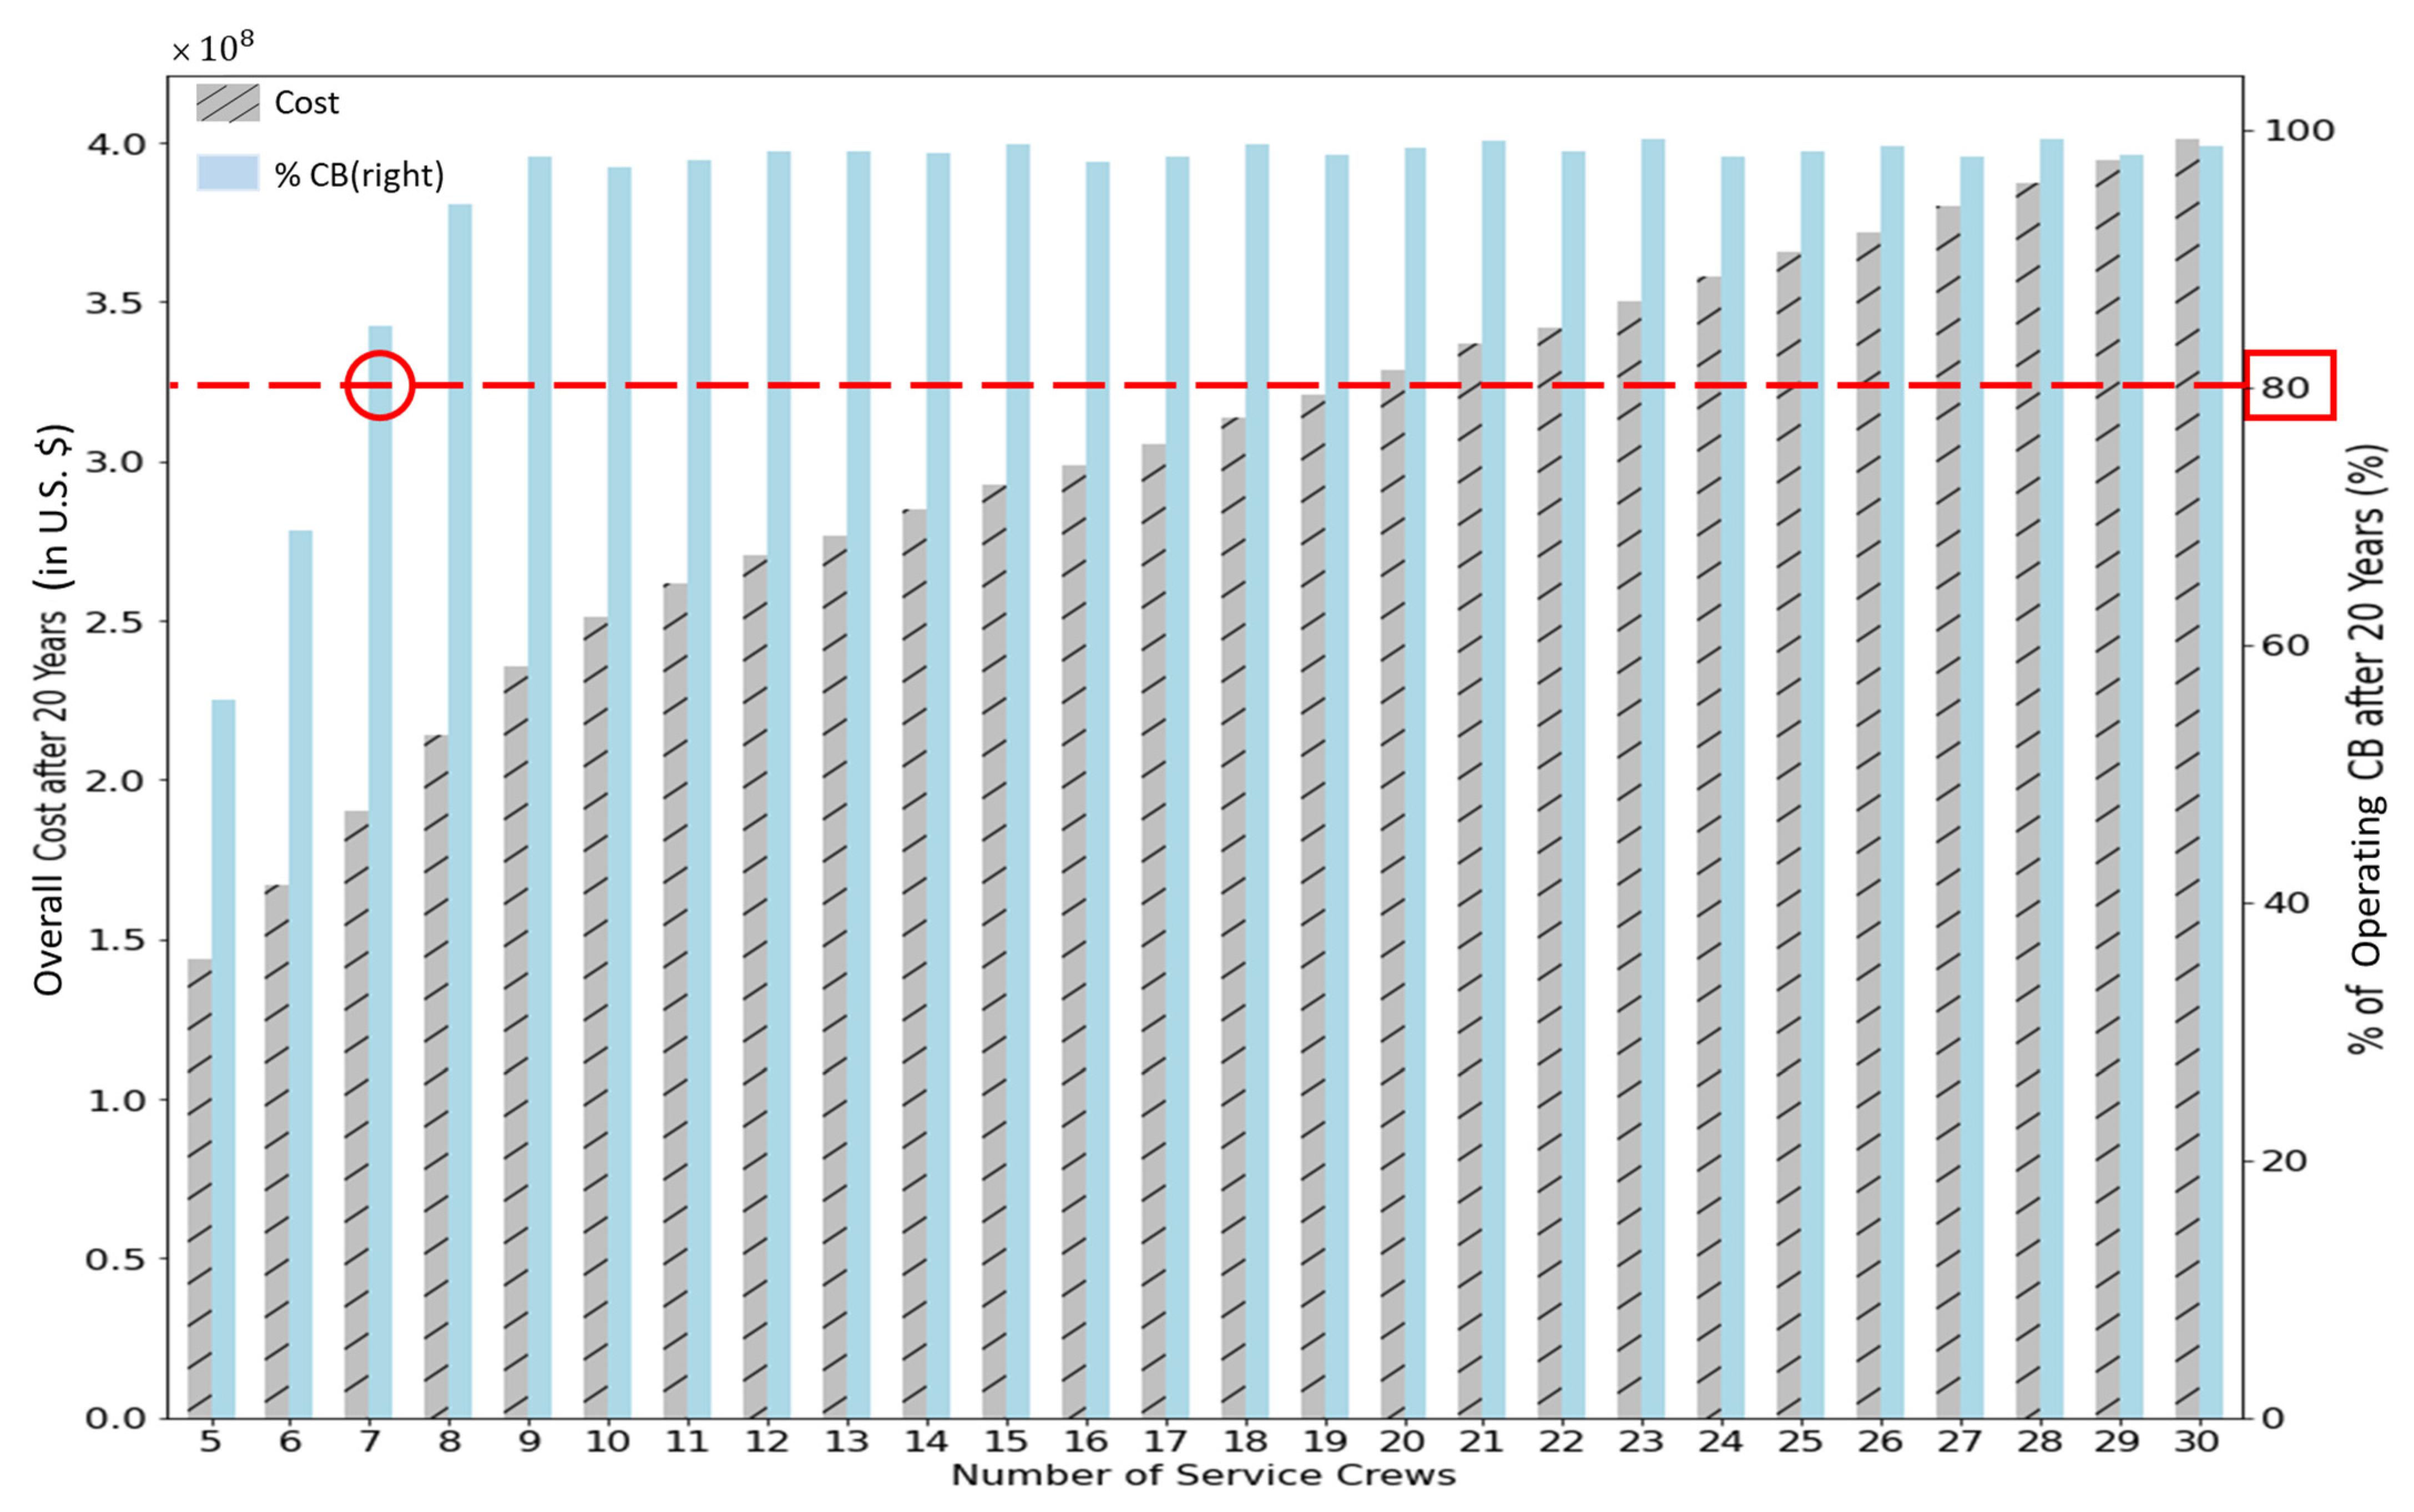
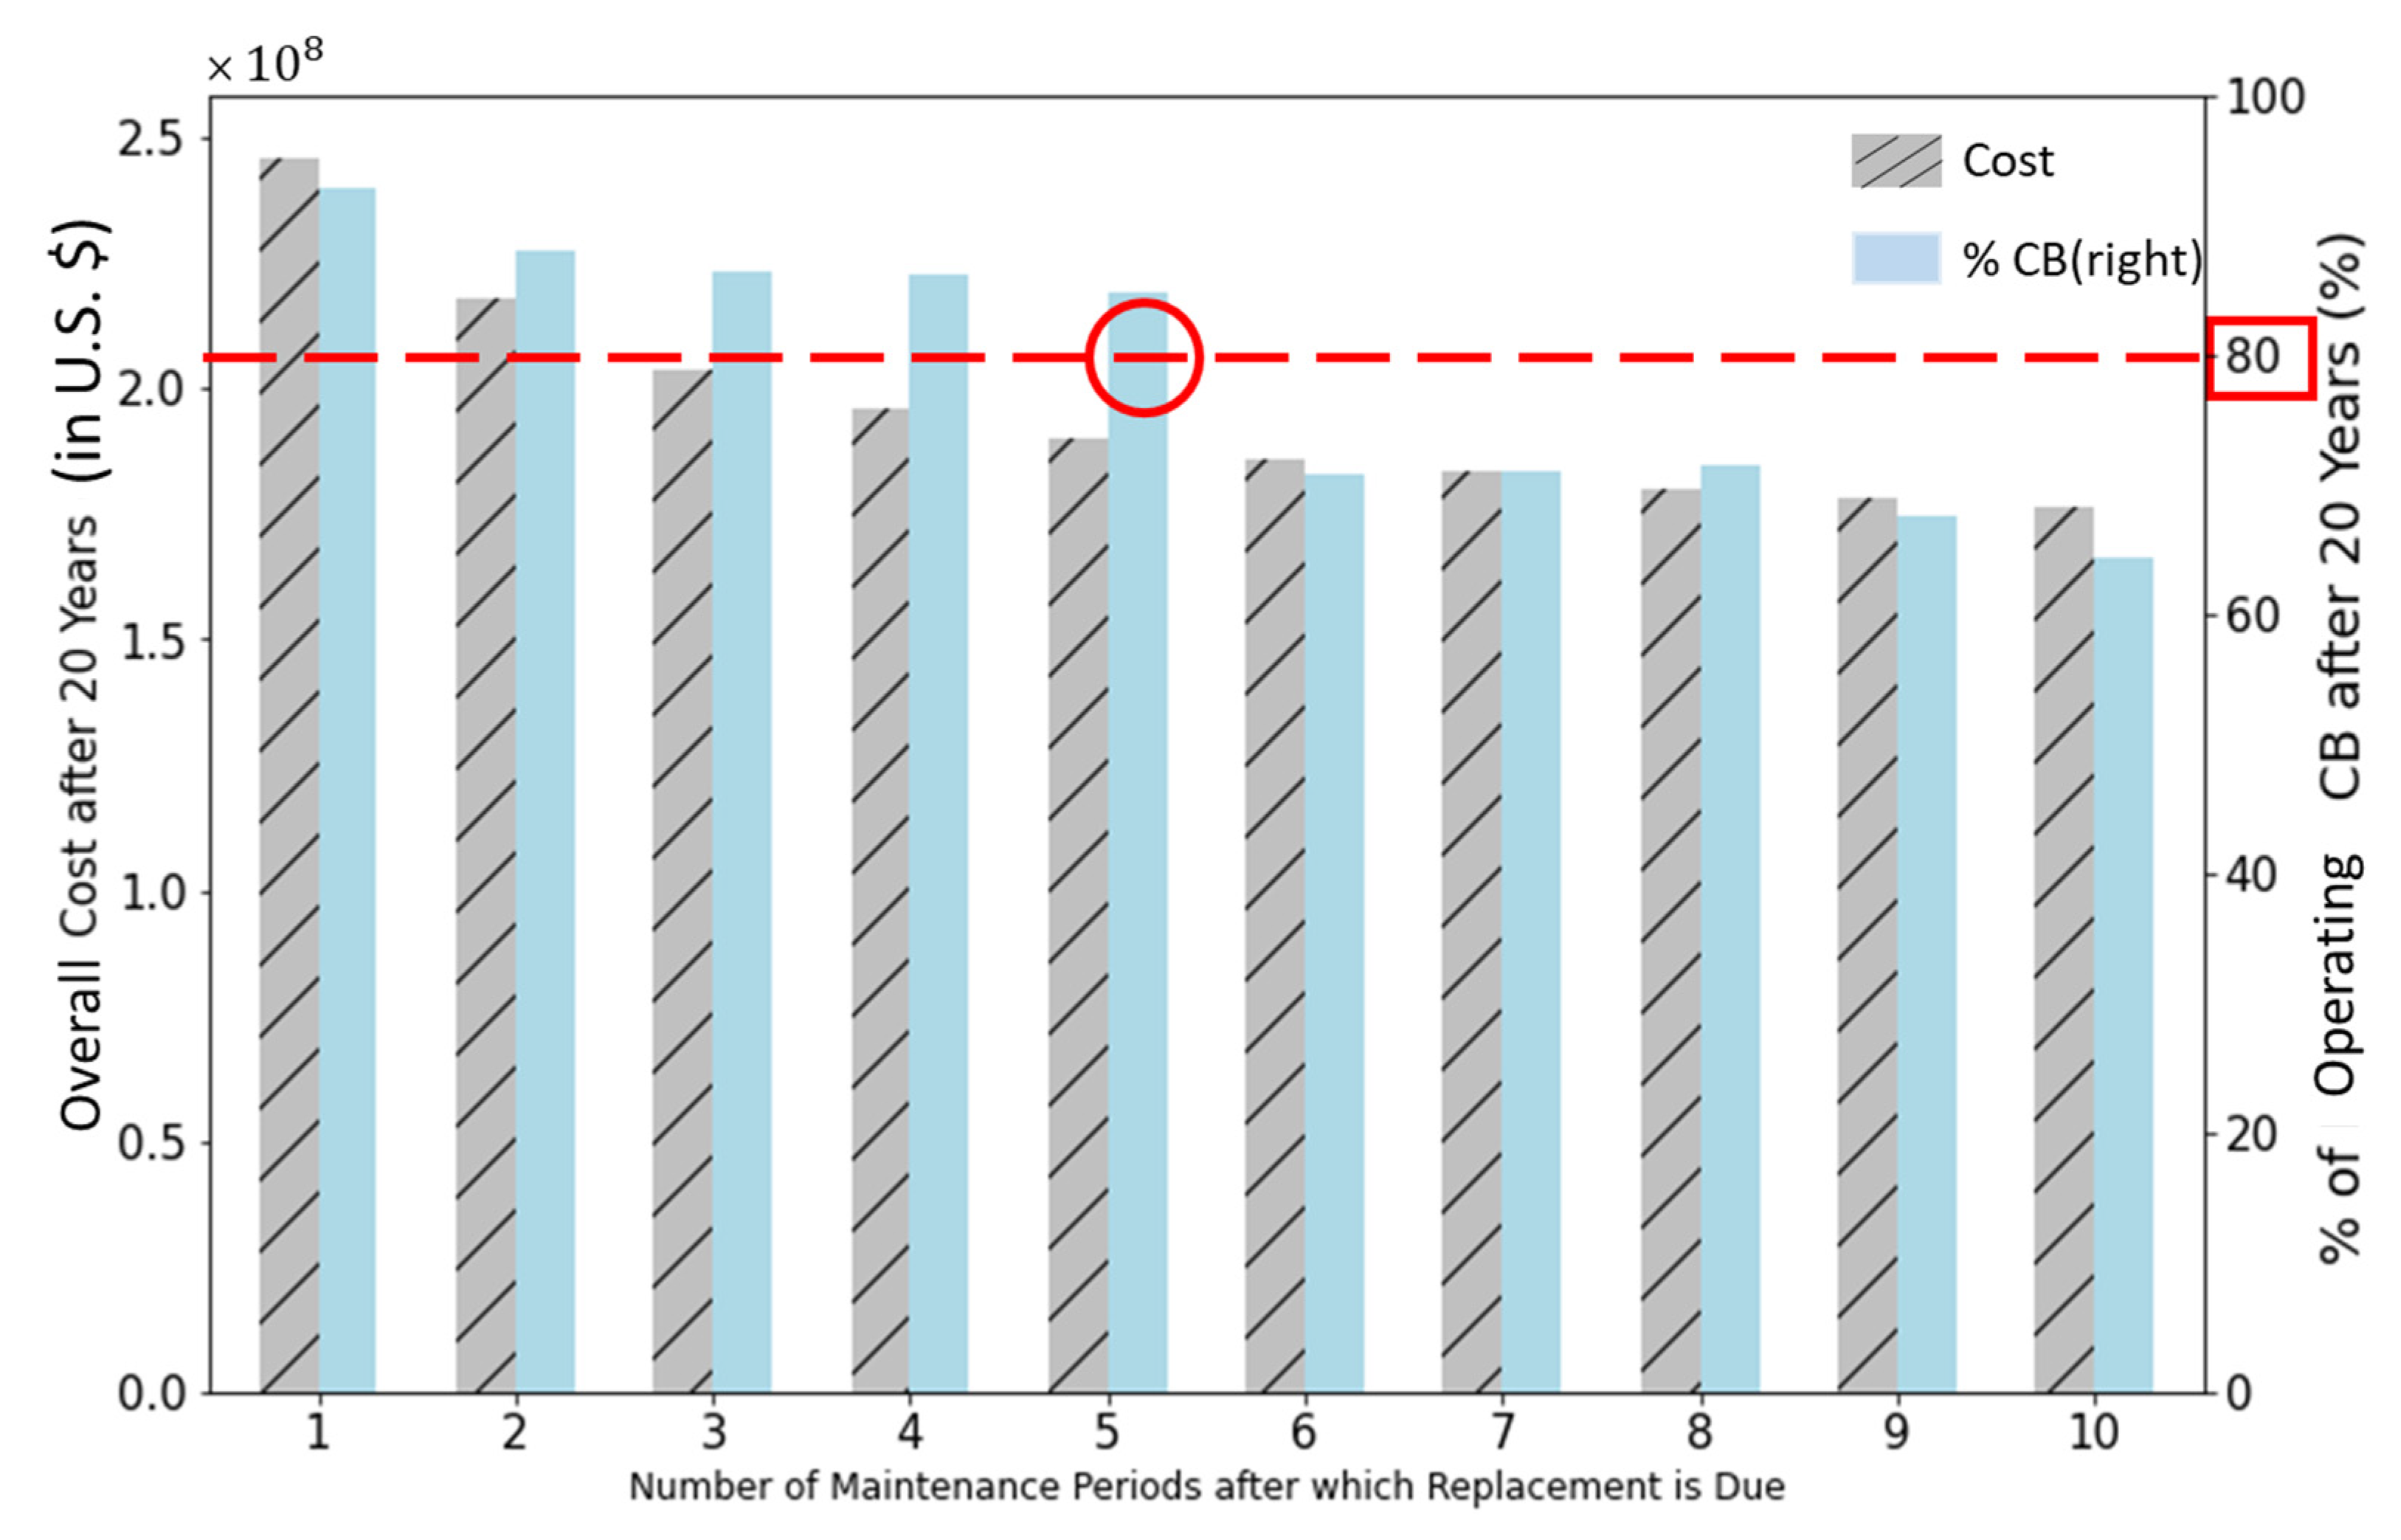
5.1. Sensitivity Analysis
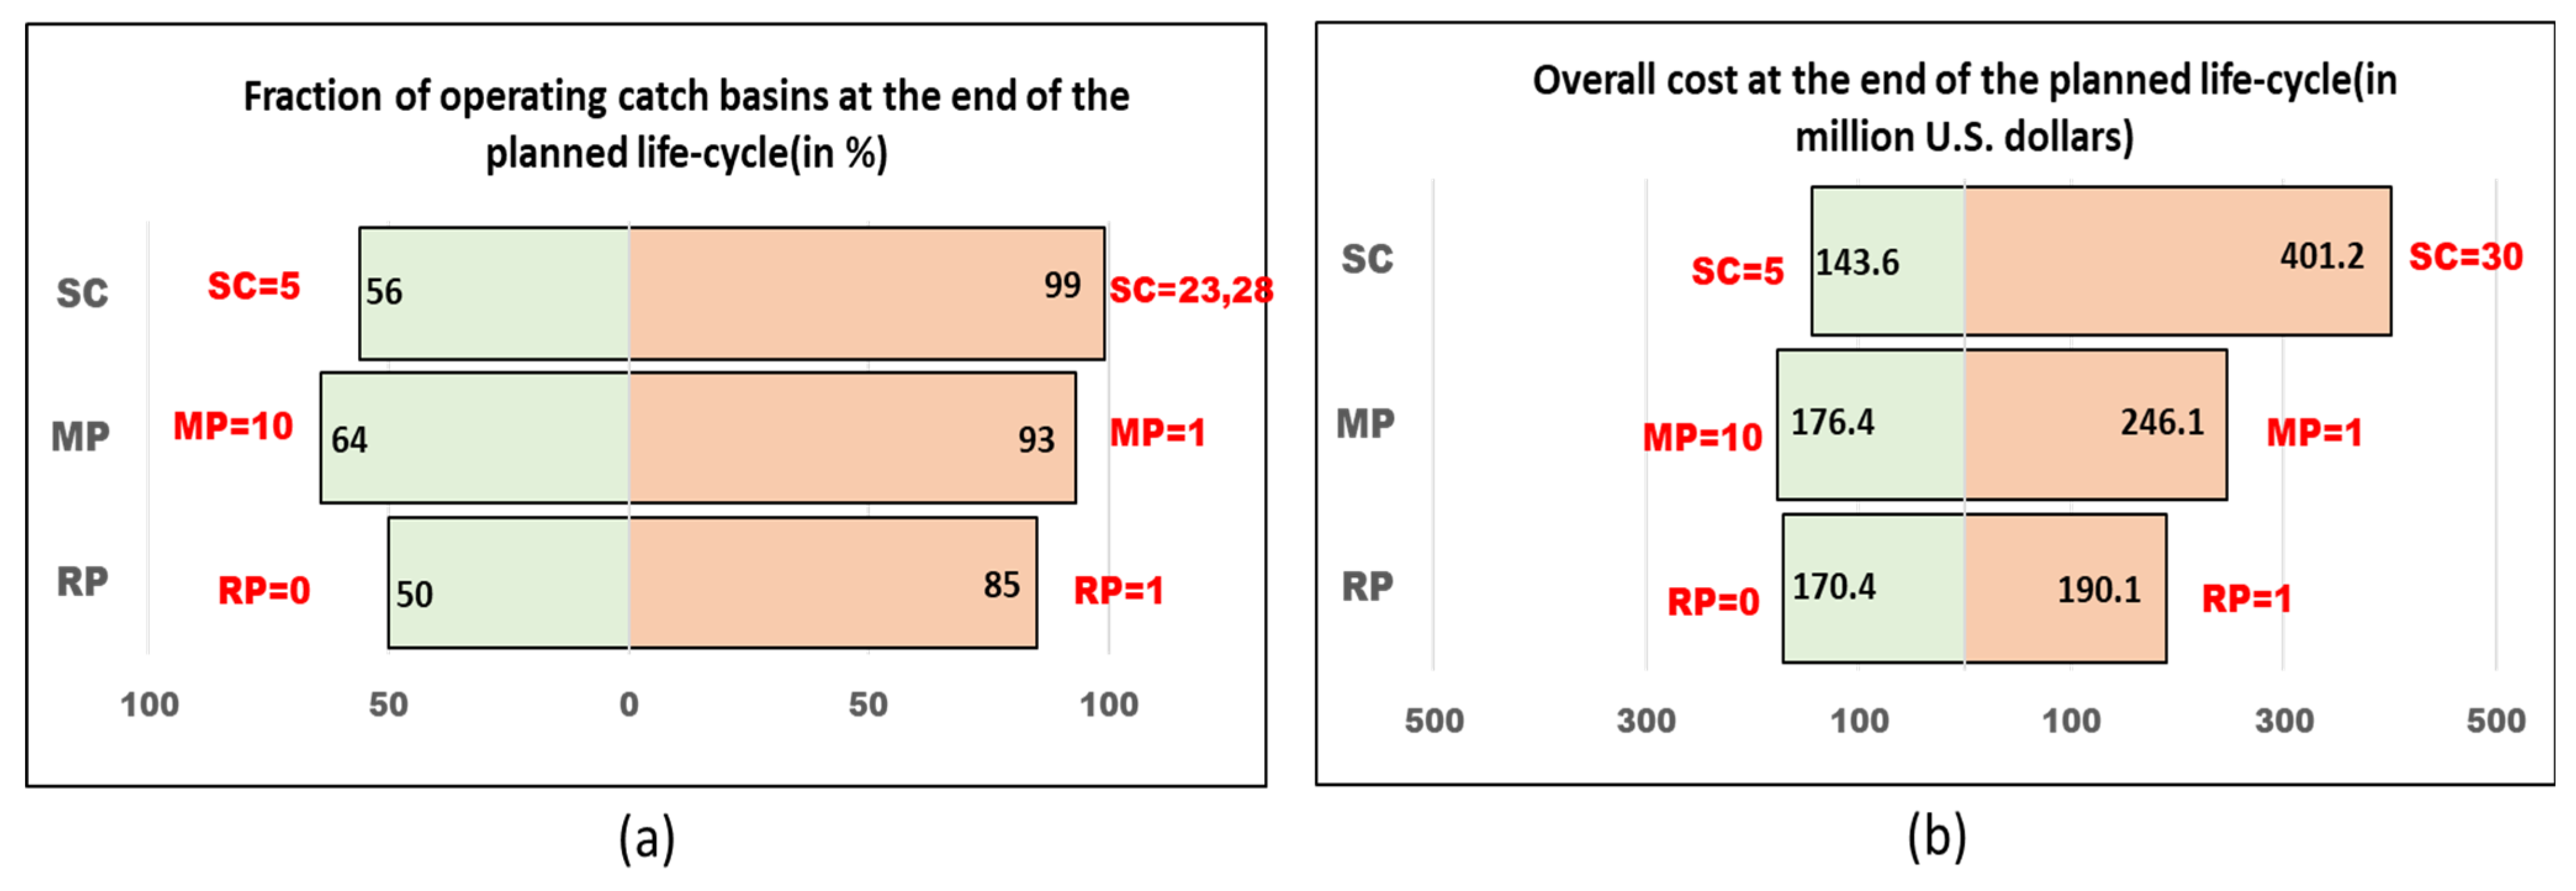
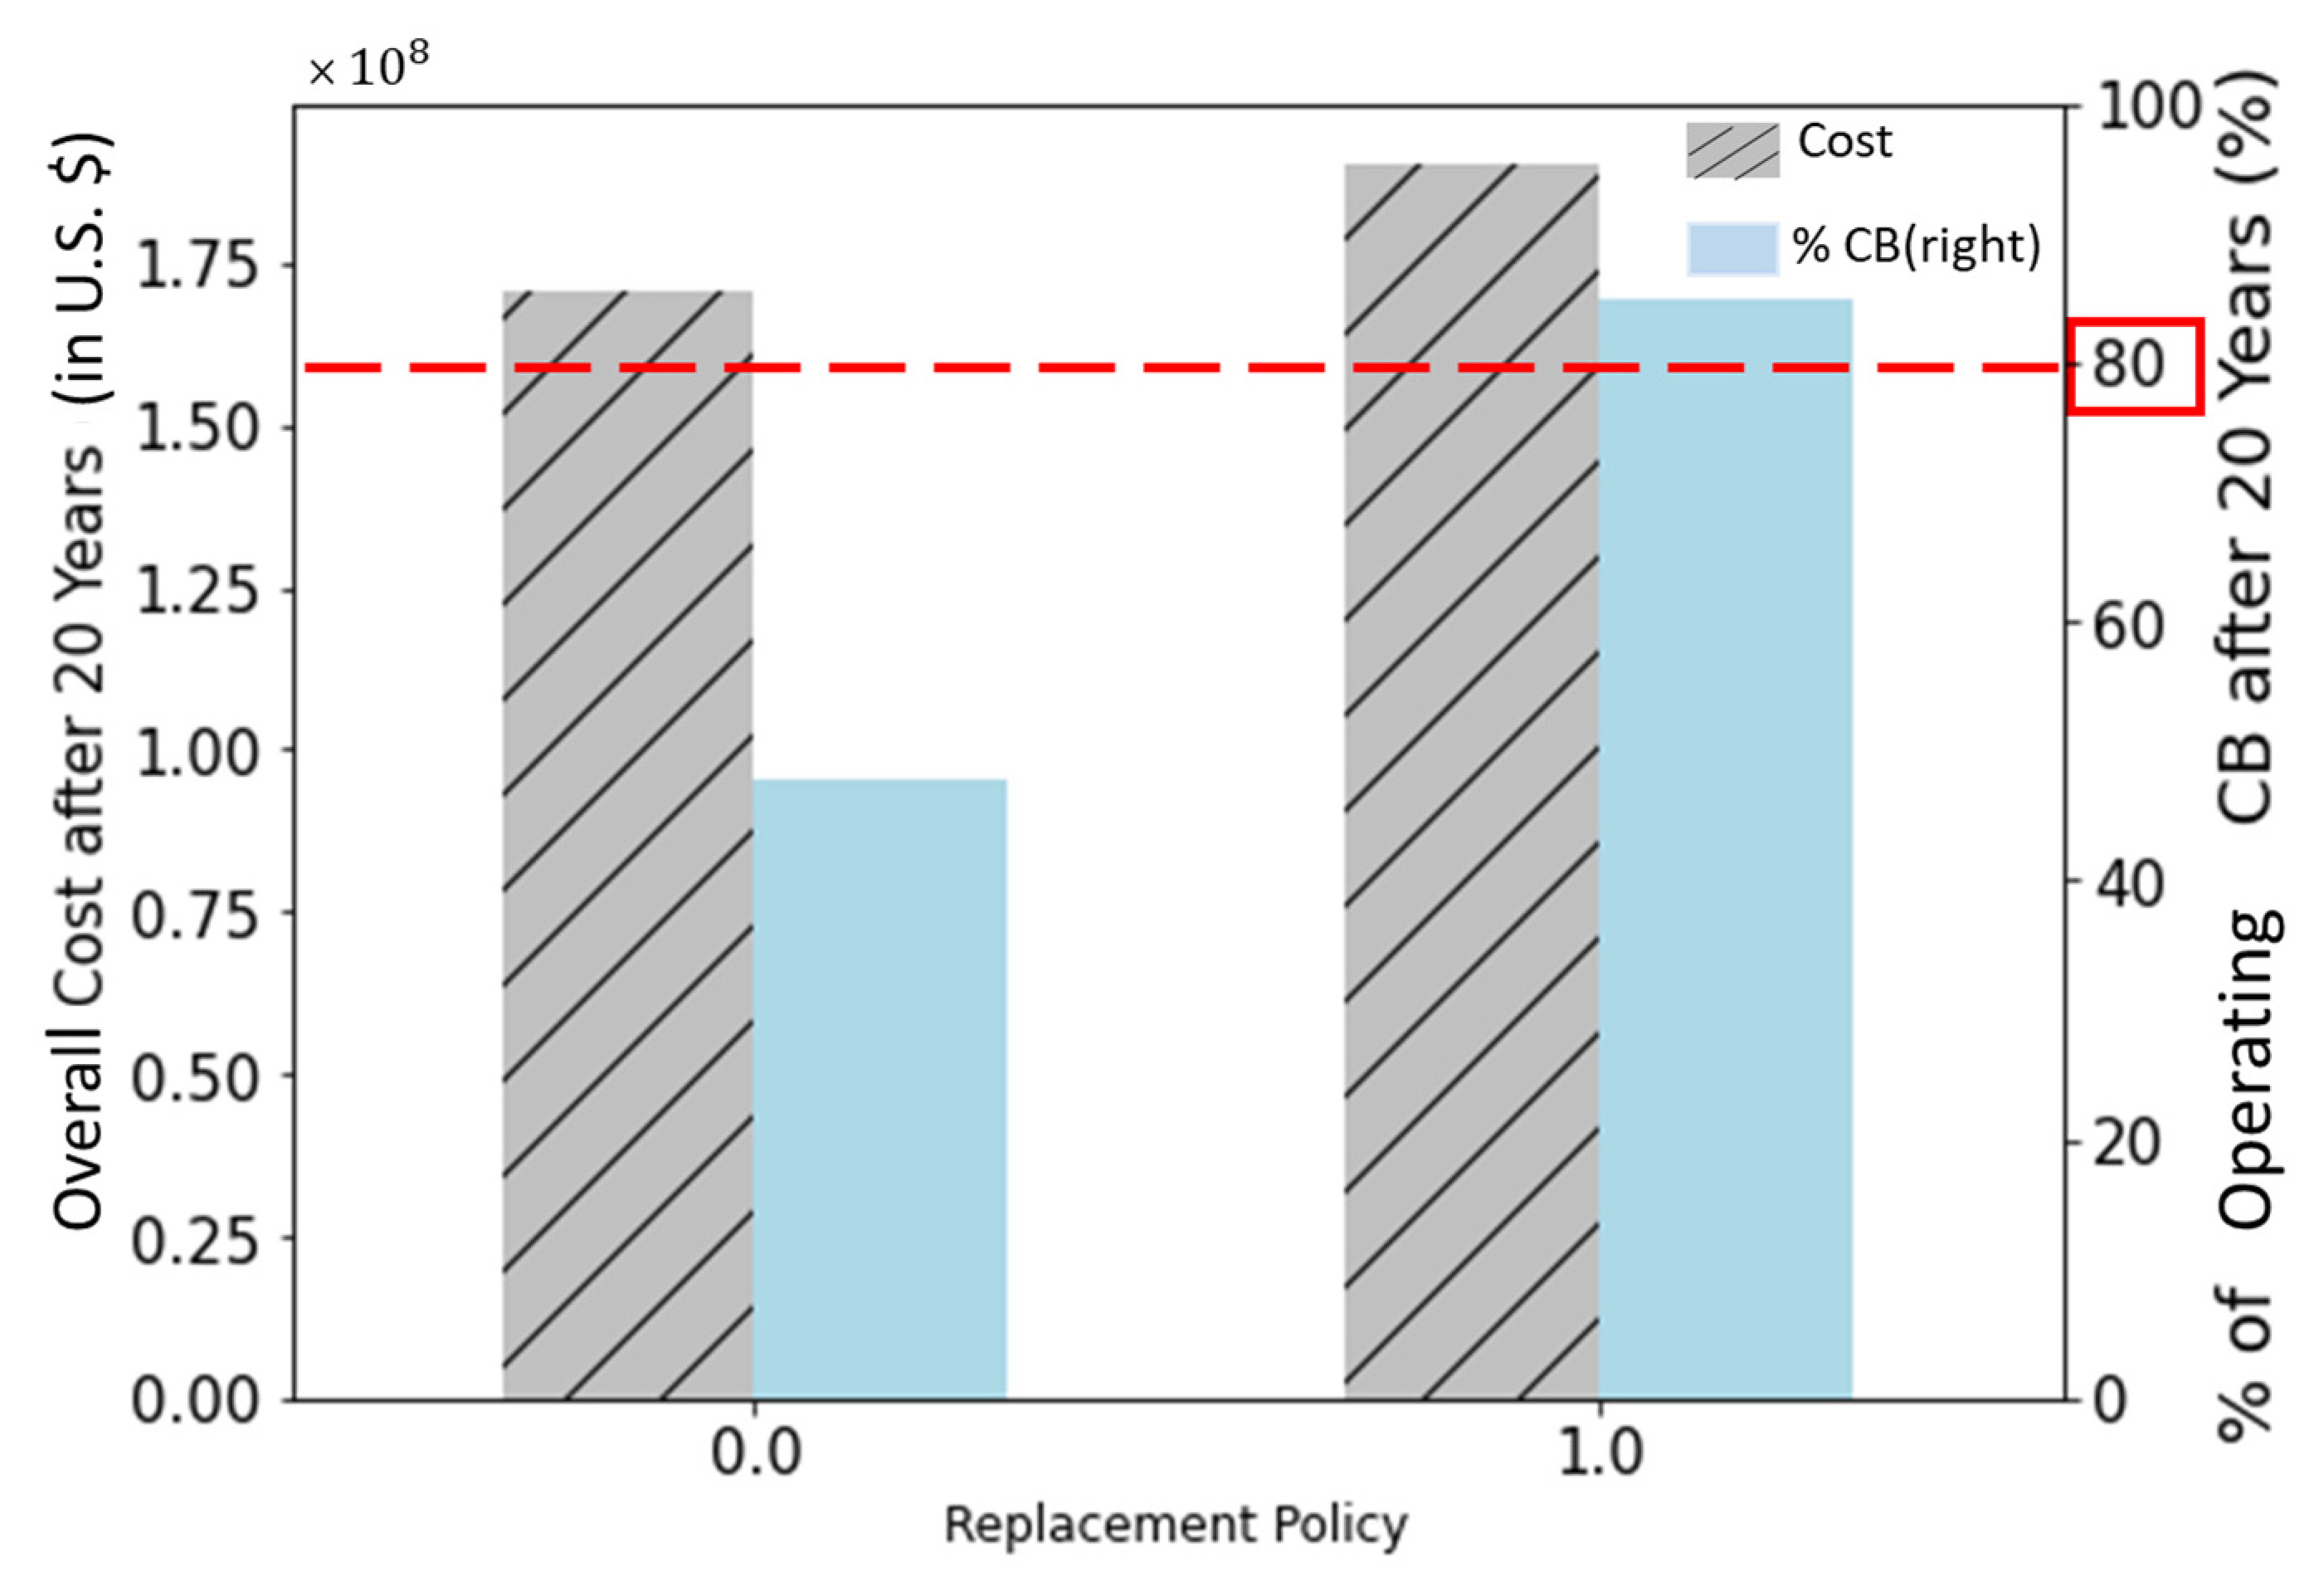
5.2. Optimal Model Variables
5.3. Monte Carlo Simulation
5.4. Model Validation
6. Discussion and Contributions
7. Conclusions and Future Work
Author Contributions
Funding
Institutional Review Board Statement
Informed Consent Statement
Data Availability Statement
Conflicts of Interest
References
- United Nations. Policies on Spatial Distribution and Urbanization Have Broad Impacts on Sustainable Development. 2020. Available online: https://www.un.org/development/desa/pd/sites/www.un.org.development.desa.pd/files/undes_pd_2020_popfacts_urbanization_policies.pdf (accessed on 15 May 2023).
- Assaf, G.; Assaad, R.H. Key Decision-Making Factors Influencing Bundling Strategies: Analysis of Bundled Infrastructure Projects. J. Infrastruct. Syst. 2023, 29, 04023006. [Google Scholar] [CrossRef]
- Rose, S.; Peters, N.E. Effects of urbanization on streamflow in the Atlanta area (Georgia, USA): A comparative hydrological approach. Hydrol. Process. 2001, 15, 1441–1457. [Google Scholar] [CrossRef]
- Hollis, G.E. The effect of urbanization on floods of different recurrence interval. Water Resour. Res. 1975, 11, 431–435. [Google Scholar] [CrossRef]
- Suriya, S.; Mudgal, B.V. Impact of urbanization on flooding: The Thirusoolam sub watershed—A case study. J. Hydrol. 2012, 412, 210–219. [Google Scholar] [CrossRef]
- Jezzini, Y.; Assaf, G.; Assaad, R.H. Models and Methods for Quantifying the Environmental, Economic, and Social Benefits and Challenges of Green Infrastructure: A Critical Review. Sustainability 2023, 15, 7544. [Google Scholar] [CrossRef]
- Assaf, G.; Assaad, R.H. Using Data-Driven Feature Engineering Algorithms to Determine the Most Critical Factors Contributing to the Urban Heat Island Effect Associated with Global Warming. In Computing in Civil Engineering 2023; American Society of Civil Engineers: Reston, VA, USA, 2023. [Google Scholar]
- Assaf, G.; Assaad, R.H. Assessing the Vulnerability of Communities Exposed to Climate Change-Related Challenges Caused by the Urban Heat Island Effect Using Machine Learning. In Computing in Civil Engineering 2023; American Society of Civil Engineers: Reston, VA, USA, 2023. [Google Scholar]
- Zhang, W.; Villarini, G.; Vecchi, G.A.; Smith, J.A. Urbanization exacerbated the rainfall and flooding caused by hurricane Harvey in Houston. Nature 2018, 563, 384–388. [Google Scholar] [CrossRef] [PubMed]
- Jacobson, C.R. Identification and quantification of the hydrological impacts of imperviousness in urban catchments: A review. J. Environ. Manag. 2011, 92, 1438–1448. [Google Scholar] [CrossRef]
- Huong, H.T.L.; Pathirana, A. Urbanization and climate change impacts on future urban flooding in Can Tho city, Vietnam. Hydrol. Earth Syst. Sci. 2013, 17, 379–394. [Google Scholar] [CrossRef]
- Basham, D.L.; Zech, W.C.; Donald, W.N.; Perez, M.A. Design and Construction of Full-Scale Testing Apparatus for Evaluating Performance of Catch BasinCB Inserts. J. Sustain. Water Built Environ. 2019, 5, 04018013. [Google Scholar] [CrossRef]
- William, R.; Garg, J.; Stillwell, A.S. game theory analysis of green infrastructure stormwater management policies. Water Resour. Res. 2017, 53, 8003–8019. [Google Scholar] [CrossRef]
- Baker, L.A.; Brazel, A.J.; Selover, N.; Martin, C.; McIntyre, N.; Steiner, F.R.; Nelson, A.; Musacchio, L. Urbanization and warming of Phoenix (Arizona, USA): Impacts, feedbacks and mitigation. Urban Ecosyst. 2002, 6, 183–203. [Google Scholar] [CrossRef]
- Anderson, A. Media, politics and climate change: Towards a new research agenda. Sociol. Compass 2009, 3, 166–182. [Google Scholar] [CrossRef]
- Kellstedt, P.M.; Zahran, S.; Vedlitz, A. Personal efficacy, the information environment, and attitudes toward global warming and climate change in the United States. Risk Anal. Int. J. 2008, 28, 113–126. [Google Scholar] [CrossRef] [PubMed]
- Yang, H.; Zhu, D.Z.; Li, L. Numerical modeling on sediment capture in catch basinsCBs. Water Sci. Technol. 2018, 77, 1346–1354. [Google Scholar] [CrossRef]
- Yamaguchi, K. Trends in extreme weather events induced by global climate change. Electr. Eng. Jpn. 2021, 214, e23306. [Google Scholar] [CrossRef]
- Jiang, Y.; Zevenbergen, C.; Ma, Y. Urban pluvial flooding and stormwater management: A contemporary review of China’s challenges and “sponge cities” strategy. Environ. Sci. Policy 2018, 80, 132–143. [Google Scholar] [CrossRef]
- Cheng, C.; Brabec, E.; Yang, Y.; Ryan, R. Rethinking stormwater management in a changing world: Effects of detention for flooding hazard mitigation under climate change scenarios in the Charles River Watershed. In Proceedings of the 2013 CELA Conference, Austin, TX, USA, 27–30 March 2013; pp. 27–30. [Google Scholar]
- Agonafir, C.; Pabon, A.R.; Lakhankar, T.; Khanbilvardi, R.; Devineni, N. Understanding New York City street flooding through 311 complaints. J. Hydrol. 2022, 605, 127300. [Google Scholar] [CrossRef]
- Webber, J.L.; Balbi, M.; Lallemant, D.; Gibson, M.J.; Fu, G.; Butler, D.; Hamel, P. Towards regional scale stormwater flood management strategies through rapid preliminary intervention screening. Water 2021, 13, 2027. [Google Scholar] [CrossRef]
- Bibi, T.S.; Kara, K.G. Evaluation of climate change, urbanization, and low-impact development practices on urban flooding. Heliyon 2023, 9, e12955. [Google Scholar] [CrossRef]
- Bibi, T.S.; Kara, K.G.; Bedada, H.J.; Bededa, R.D. Application of PCSWMM for assessing the impacts of urbanization and climate changes on the efficiency of stormwater drainage systems in managing urban flooding in Robe town, Ethiopia. J. Hydrol. Reg. Stud. 2023, 45, 101291. [Google Scholar] [CrossRef]
- Pitt, R.; Clark, S. Emerging stormwater controls for critical source areas. In Management of Wet-Weather Flow in the Watershed; Field, R., Sullivan, D., Eds.; CRC Press: Boca Raton, FL, USA, 2002; Volume 1, pp. 103–140. [Google Scholar]
- Jefferson, A.J.; Bhaskar, A.S.; Hopkins, K.G.; Fanelli, R.; Avellaneda, P.M.; McMillan, S.K. Stormwater management network effectiveness and implications for urban watershed function: A critical review. Hydrol. Process. 2017, 31, 4056–4080. [Google Scholar] [CrossRef]
- EPA. Stormwater Management Practices at EPA Facilities. 2023. Available online: https://www.epa.gov/greeningepa/stormwater-management-practices-epa-facilities#Seven (accessed on 11 May 2023).
- NPDES. Stormwater Best Management Practices. 2023. Available online: https://www.epa.gov/system/files/documents/2021-11/bmp-stormwater-inlet-bmps.pdf (accessed on 11 May 2023).
- EPA. Overcoming Barriers to Green Infrastructure. 2023. Available online: https://www.epa.gov/green-infrastructure/overcoming-barriers-green-infrastructure-documents (accessed on 11 May 2023).
- Aronson, G.; Watson, D.; Pisano, W. Evaluation of Catch BasinCB Performance for Urban Stormwater Pollution Control; Grant No. R-804578. EPA-600/2-83-043; US EPA: Cincinnati, OH, USA, 1983.
- Lau, S.L.; Khan, E.; Stenstrom, M.K. Catch basinCB inserts to reduce pollution from stormwater. Water Sci. Technol. 2001, 44, 23–34. [Google Scholar] [CrossRef]
- Brafford, C. CBs: What Are They and How Do They Work? 2022. Available online: https://abtdrains.com/catch-basin-what-are-they-and-how-do-they-work/ (accessed on 15 May 2023).
- Moghadas, H.; Mirzavand, R.; Mousavi, P. Early detection of flood in urban CBs using radio frequency slot line array. Measurement 2019, 134, 515–518. [Google Scholar] [CrossRef]
- Nagara, V.N.; Sarkar, D.; Barrett, K.; Datta, R. Greening the gray infrastructure: Green adsorbent media for catch basin inserts to remove stormwater pollutants. Environ. Technol. Innov. 2021, 21, 101334. [Google Scholar] [CrossRef]
- Jang, Y.C.; Jain, P.; Tolaymat, T.; Dubey, B.; Singh, S.; Townsend, T. Characterization of roadway stormwater system residuals for reuse and disposal options. Sci. Total Environ. 2010, 408, 1878–1887. [Google Scholar] [CrossRef] [PubMed]
- NYC. Flood Prevention. 2023. Available online: https://www.nyc.gov/site/dep/environment/flood-prevention.page (accessed on 16 May 2023).
- USEPA (United States Environmental Protection Agency). Catch BasinCB Inserts BMP Fact Sheet; USEPA: Washington, DC, USA, 2006.
- Sadeghi, K.M.; Kharaghani, S.; Tam, W.; Gaerlan, N.; Loáiciga, H. Green stormwater infrastructure (GSI) for stormwater management in the city of Los Angeles: Avalon Green Alleys Network. Environ. Process. 2019, 6, 265–281. [Google Scholar] [CrossRef]
- Pekarek, K.A.; Shelton, D.P.; Feehan, K.; Holm, B.A. Stormwater Management: Terminology. 2011. Available online: https://digitalcommons.unl.edu/natrespapers/1338/ (accessed on 15 May 2023).
- Pitt, R.; Field, R. Catchbasins and inserts for the control of gross solids and conventional stormwater pollutants. In Critical Transitions in Water and Environmental Resources Management; American Society of Civil Engineers: Reston, VA, USA, 2004; pp. 1–10. [Google Scholar]
- Howard, A.K.; Mohseni, O.; Gulliver, J.S.; Stefan, H.G. Hydraulic analysis of suspended sediment removal from storm water in a standard sump. J. Hydraul. Eng. 2012, 138, 491–502. [Google Scholar] [CrossRef]
- Wilson, M.A.; Mohseni, O.; Gulliver, J.S.; Hozalski, R.M.; Stefan, H.G. Assessment of hydrodynamic separators for storm-water treatment. J. Hydraul. Eng. 2009, 135, 383–392. [Google Scholar] [CrossRef]
- Tang, Y.; Zhu, D.Z.; Rajaratnam, N.; van Duin, B. Experimental study of hydraulics and sediment capture efficiency in catchbasins. Water Sci. Technol. 2016, 74, 2717–2726. [Google Scholar] [CrossRef]
- Bong, C.H.J.; Lau, T.L.; Ghani, A.A. Sediment size and deposition characteristics in Malaysian urban concrete drains—A case study of Kuching City. Urban Water J. 2014, 11, 74–89. [Google Scholar] [CrossRef]
- Clegg, S.; Forster, C.F.; Crabtree, R.W. Sewer sediment characteristics and their variation with time. Environ. Technol. 1992, 13, 561–569. [Google Scholar] [CrossRef]
- Avila, H.; Pitt, R.E. Scour in Stormwater Catchbasin Devices–Experimental Results from a Full-Scale Physical Model. J. Water Manag. Model. 2009, R235-19, 323–347. [Google Scholar] [CrossRef]
- Avila, H.; Pitt, R.E.; Durrans, S.R. Factors affecting scour of previously captured sediment from stormwater catchbasin sumps. J. Water Manag. Model. 2008, R228-13, 197–218. [Google Scholar] [CrossRef]
- Avila, H.; Pitt, R.; Clark, S.E. Development of effluent concentration models for sediment scoured from catchbasin sumps. J. Irrig. Drain. Eng. 2011, 137, 114–120. [Google Scholar] [CrossRef]
- Harbison, J.E.; Nasci, R.; Runde, A.; Henry, M.; Binnall, J.; Hulsebosch, B.; Rutkowski, N.; Johnson, H.; Uelmen, J.; Bradley, M.; et al. Standardized operational evaluations of catch basinCB larvicides from seven mosquito control programs in the midwestern United States during 2017. J. Am. Mosq. Control Assoc. 2018, 34, 107–116. [Google Scholar] [CrossRef]
- Cleanings, C.B. Reuse of Street Sweepings and Catch BasinCB Cleanings. 1999. Available online: https://p2infohouse.org/ref/18/17801.pdf (accessed on 30 August 2022).
- Alam, M.Z.; Anwar, A.F.; Sarker, D.C.; Heitz, A.; Rothleitner, C. Characterising stormwater gross pollutants captured in catch basin inserts. Sci. Total Environ. 2017, 586, 76–86. [Google Scholar] [CrossRef]
- Edwards, F.G.; Morgan, R.A.; Brye, K.R.; Burian, S.J. Evaluation of storm water catch basinCB inserts for transportation facilities. Transp. Res. Rec. 2004, 1890, 123–128. [Google Scholar] [CrossRef]
- Alam, M.Z. Catch Basin Insert: Characterization and Modelling of Stormwater Treatment at Source. Doctoral Dissertation, Curtin University, Perth, Australia, 2018. [Google Scholar]
- Kostarelos, K.; Khan, E.; Callipo, N.; Velasquez, J.; Graves, D. Field study of catch basinCB inserts for the removal of pollutants from urban runoff. Water Resour. Manag. 2011, 25, 1205–1217. [Google Scholar] [CrossRef]
- Walch, M.; Cole, R.; Polasko, W.; Walters, D.; Frost, W.; DiNicola, P.; Gneo, R. Evaluation of the Performance of Four Catch BasinCB Inserts in Delaware Urban Applications; Delaware Department of Transportation: Dover, DE, USA, 2004.
- Morgan, R.A.; Edwards, F.G.; Brye, K.R.; Burian, S.J. An evaluation of the urban stormwater pollutant removal efficiency of catch basinCB inserts. Water Environ. Res. 2005, 77, 500–510. [Google Scholar] [CrossRef]
- Milesi, C.B. Operation and Maintenance. 2013. Available online: https://citeseerx.ist.psu.edu/document?repid=rep1&type=pdf&doi=91a194eefb62dd3d0c1e8c63eb9a1fd1e989f657 (accessed on 15 May 2023).
- Glass, C.C.; Holloway, E. Life-cycle cost analysis and effectiveness comparison between catch basinCB inlet screens and a floating trash trap for municipal solid removal from stormwater. Trans. Built Environ. 2012, 122, 137–148. [Google Scholar]
- Pitt, R.; Clark, S. Coarse Solids Management. In BMP Technology in Urban Watersheds: Current and Future Directions, Proceedings of the 2004 World Water and Environmental Congress, Salt Lake City, UT, USA, 28 June–1 July 2004; American Society of Civil Engineers: Reston, VA, USA, 2006; pp. 93–125. [Google Scholar]
- Glass, C.R. Water Quality Monitoring of Catch Basins. 2009. Available online: https://rosap.ntl.bts.gov/view/dot/61750 (accessed on 23 May 2023).
- Nitsch Engineering Long Term Pollution Prevention Plan Stormwater Operation and Maintenance Plan. 2022. Available online: https://braintreema.gov/DocumentCenter/View/9222/March-23-2022-OM_LTPPP_REV (accessed on 15 May 2023).
- Horsley Witten Group. Stormwater Maintenance Best Practices. 2023. Available online: https://mvpc.org/wp-content/uploads/150410_MVPC-Maintenance-2-Best-Practices.pdf (accessed on 15 May 2023).
- State of New Jersey, Department of Environmental Protection. Bureau of NJPDES Stormwater Permitting and Water Quality Management. Available online: https://www.nj.gov/dep/dwq/pdf/tier_a_Full_Permit_No_ReponsetoComments.pdf (accessed on 11 May 2023).
- Municipal Separate Sewer Systems of New York City NYC. Control of Floatable and Settleable Trash and Debris. 2020. Available online: https://www.nyc.gov/assets/dep/downloads/pdf/water/stormwater/ms4/nyc-swmp-report-ch9.pdf (accessed on 11 May 2023).
- NYC New York City, Stormwater Resiliency Plan. Helping New Yorkers Understand and Manage Vulnerabilities from Extreme Rain. Available online: https://www.nyc.gov/assets/orr/pdf/publications/stormwater-resiliency-plan.pdf (accessed on 11 May 2023).
- Chan, W.K.V.; Son, Y.J.; Macal, C.M. Agent-based simulation tutorial-simulation of emergent behavior and differences between agent-based simulation and discrete-event simulation. In Proceedings of the 2010 Winter Simulation Conference, Baltimore, MD, USA, 5–8 December 2010; pp. 135–150. [Google Scholar]
- Bonabeau, E. Agent-based modeling: Methods and techniques for simulating human systems. Proc. Natl. Acad. Sci. USA 2002, 99 (Suppl. S3), 7280–7287. [Google Scholar] [CrossRef] [PubMed]
- Hamill, L.; Gilbert, N. Agent-Based Modelling in Economics; John Wiley Sons: Hoboken, NJ, USA, 2015. [Google Scholar]
- Borshchev, A. The Big Book of Simulation Modeling: Multimethod Modeling with AnyLogic 6; AnyLogic North America: Oakbrook Terrace, IL, USA, 2013. [Google Scholar]
- Shi, Z.Z.; Wu, C.H.; Ben-Arieh, D. Agent-based model: A surging tool to simulate infectious diseases in the immune system. Open J. Model. Simul. 2014, 2, 12–22. [Google Scholar] [CrossRef]
- Liang, X.; Yu, T.; Hong, J.; Shen, G.Q. Making incentive policies more effective: An agent-based model for energy-efficiency retrofit in China. Energy Policy 2019, 126, 177–189. [Google Scholar] [CrossRef]
- Weimer, C.W.; Miller, J.O.; Hill, R.R. Agent-based modeling: An introduction and primer. In Proceedings of the 2016 Winter Simulation Conference (WSC), Arlington, VA, USA, 11–14 December 2016; pp. 65–79. [Google Scholar]
- Chen, Y.; Li, X.; Liu, X.; Liu, Y. An agent-based model for optimal land allocation (AgentLA) with a contiguity constraint. Int. J. Geogr. Inf. Sci. 2010, 24, 1269–1288. [Google Scholar] [CrossRef]
- Hunter, E.; Kelleher, J.D. Validating and testing an agent-based model for the spread of COVID-19 in Ireland. Algorithms 2022, 15, 270. [Google Scholar] [CrossRef]
- Kieu, L.M.; Malleson, N.; Heppenstall, A. Dealing with uncertainty in agent-based models for short-term predictions. R. Soc. Open Sci. 2020, 7, 191074. [Google Scholar] [CrossRef]
- Johnstone, W.M.; Sakamoto, D.; Assaf, H.; Bourban, S. Architecture, modelling framework and validation of BC Hydro’s virtual reality life safety model. In Proceedings of the International Symposium on Stochastic Hydraulics 2005, Nijmegen, The Netherlands, 23–24 May 2005. [Google Scholar]
- Dubbelboer, J.; Nikolic, I.; Jenkins, K.; Hall, J. An agent-based model of flood risk and insurance. J. Artif. Soc. Soc. Simul. 2017, 20, 6. [Google Scholar] [CrossRef]
- Bernardini, G.; Camilli, S.; Quagliarini, E.; D’Orazio, M. Flooding risk in existing urban environment: From human behavioral patterns to a microscopic simulation model. Energy Procedia 2017, 134, 131–140. [Google Scholar] [CrossRef]
- Assaad, R.H.; Assaf, G.; Boufadel, M. Optimizing the maintenance strategies for a network of green infrastructure: An agent-based model for stormwater detention basins. J. Environ. Manag. 2023, 330, 117179. [Google Scholar] [CrossRef]
- Tonn, G.L.; Guikema, S.D. An agent-based model of evolving community flood risk. Risk Anal. 2018, 38, 1258–1278. [Google Scholar] [CrossRef]
- Choi, B.; Lee, S. An empirically based agent-based model of the sociocognitive process of construction workers’ safety behavior. J. Constr. Eng. Manag. 2018, 144, 04017102. [Google Scholar] [CrossRef]
- Assaad, R.H.; Abdul Nabi, M.; Assaf, G.; El-adaway, I. An Agent-Based Cellular Automaton Simulation Model to Study the Worker Safety Behavior on Construction Sites: The Impacts of Different Social Influence Rules. In Computing in Civil Engineering 2023; American Society of Civil Engineers: Reston, VA, USA, 2023. [Google Scholar]
- Kedir, N.S.; Raoufi, M.; Fayek, A.R. Fuzzy agent-based multicriteria decision-making model for analyzing construction crew performance. J. Manag. Eng. 2020, 36, 04020053. [Google Scholar] [CrossRef]
- Kiomjian, D.; Srour, I.; Srour, F.J. Knowledge sharing and productivity improvement: An agent-based modeling approach. J. Constr. Eng. Manag. 2020, 146, 04020076. [Google Scholar] [CrossRef]
- Hosseinian, S.M.; Younesi, S.; Razini, S.; Carmichael, D.G. Intelligent Stochastic Agent-Based Model for Predicting Truck Production in Construction Sites by Considering Learning Effect. J. Constr. Eng. Manag. 2022, 148, 04022018. [Google Scholar] [CrossRef]
- Min, J.U.; Bjornsson, H.C. Agent-based construction supply chain simulator (CS 2) for measuring the value of real-time information sharing in construction. J. Manag. Eng. 2008, 24, 245–254. [Google Scholar] [CrossRef]
- Du, J.; El-Gafy, M. Using agent-based modeling to investigate goal incongruence issues in proposal development: Case study of an EPC project. J. Manag. Eng. 2015, 31, 05014025. [Google Scholar] [CrossRef]
- El-Adaway, I.H.; Sims, C.; Eid, M.S.; Liu, Y.; Ali, G.G. Preliminary attempt toward better understanding the impact of distributed energy generation: An agent-based computational economics approach. J. Infrastruct. Syst. 2020, 26, 04020002. [Google Scholar] [CrossRef]
- Eid, M.S.; El-Adaway, I.H. Decision-making framework for holistic sustainable disaster recovery: Agent-based approach for decreasing vulnerabilities of the associated communities. J. Infrastruct. Syst. 2018, 24, 04018009. [Google Scholar] [CrossRef]
- Wang, Y.; Hao, H.; Wang, C. Preparing Urban Curbside for Increasing Mobility-on-Demand Using Data-Driven Agent-Based Simulation: Case Study of City of Gainesville, Florida. J. Manag. Eng. 2022, 38, 05022004. [Google Scholar] [CrossRef]
- Mostafavi, A.; Abraham, D.; DeLaurentis, D.; Sinfield, J.; Kandil, A.; Queiroz, C. Agent-based simulation model for assessment of financing scenarios in highway transportation infrastructure systems. J. Comput. Civ. Eng. 2016, 30, 04015012. [Google Scholar] [CrossRef]
- Fagnant, D.J.; Kockelman, K.M. The travel and environmental implications of shared autonomous vehicles, using agent-based model scenarios. Transp. Res. Part C Emerg. Technol. 2014, 40, 1–13. [Google Scholar] [CrossRef]
- Feng, K.; Li, Q.; Ellingwood, B.R. Post-earthquake modelling of transportation networks using an agent-based model. Struct. Infrastruct. Eng. 2020, 16, 1578–1592. [Google Scholar] [CrossRef]
- Osman, H. Agent-based simulation of urban infrastructure asset management activities. Autom. Constr. 2012, 28, 45–57. [Google Scholar] [CrossRef]
- Kadinski, L.; Berglund, E.; Ostfeld, A. An Agent-Based Model for Contamination Response in Water Distribution Systems during the COVID-19 Pandemic. J. Water Resour. Plan. Manag. 2022, 148, 04022042. [Google Scholar] [CrossRef]
- Butler, D.; Memon, F.A. Dynamic modelling of roadside gully pots during wet weather. Water Res. 1999, 33, 3364–3372. [Google Scholar] [CrossRef]
- Deletic, A.; Ashley, R.; Rest, D. Modelling input of fine granular sediment into drainage systems via gully-pots. Water Res. 2000, 34, 3836–3844. [Google Scholar] [CrossRef]
- Garofalo, G.; Carbone, M.; Piro, P. Sampling, testing and modeling particle size distribution in urban catch basinsCBs. Water Sci. Technol. 2014, 70, 1873–1879. [Google Scholar] [CrossRef]
- Li, J.; Alinaghian, S.; Joksimovic, D.; Chen, L. An integrated hydraulic and hydrologic modeling approach for roadside bio-retention facilities. Water 2020, 12, 1248. [Google Scholar] [CrossRef]
- Memon, F.A.; Butler, D. Assessment of gully pot management strategies for runoff quality control using a dynamic model. Sci. Total Environ. 2002, 295, 115–129. [Google Scholar] [CrossRef]
- Post, J.A.B.; Pothof, I.W.M.; Dirksen, J.; Baars, E.J.; Langeveld, J.G.; Clemens, F.H.L.R. Monitoring and statistical modelling of sedimentation in gully pots. Water Res. 2016, 88, 245–256. [Google Scholar] [CrossRef]
- Remde, S. Exploring Techniques to Improve Large-Scale Drainage System Maintenance Scheduling Using a Risk Driven Model. In Proceedings of the Operations Research and Enterprise Systems: 5th International Conference, ICORES 2016, Rome, Italy, 23–25 February 2016; Revised Selected Papers; Springer: Cham, Switzerland, 2017; Volume 695, p. 161. [Google Scholar]
- Senior, M.; Scheckenberger, R.; Bishop, B. Modeling catchbasins and inlets in SWMM. J. Water Manag. Model. 2018, 26, C435. [Google Scholar] [CrossRef]
- Wei, H.; Muthanna, T.M.; Lundy, L.; Viklander, M. An assessment of gully pot sediment scour behaviour under current and potential future rainfall conditions. J. Environ. Manag. 2021, 282, 111911. [Google Scholar] [CrossRef] [PubMed]
- Merkuryeva, G.; Bolshakovs, V. Vehicle schedule simulation with AnyLogic. In Proceedings of the 2010 12th International Conference on Computer Modelling and Simulation, Cambridge, UK, 24–26 March 2010; pp. 169–174. [Google Scholar]
- Crooks, A.; Malleson, N.; Manley, E.; Heppenstall, A. Agent-Based Modeling and Geographical Information Systems; SAGE Publications Ltd.: Thousand Oaks, CA, USA, 2015; pp. 63–77. [Google Scholar]
- Macal, C.M.; North, M.J. Agent-based modeling and simulation: Desktop ABMS. In Proceedings of the 2007 Winter Simulation Conference, Washington, DC, USA, 9–12 December 2007; pp. 95–106. [Google Scholar]
- NYC New York City. Overview of New York City. 2023. Available online: https://www.nymtc.org/portals/0/pdf/CPT-HSP/NYMTC%20coord%20plan%20NYC%20CH03.pdf (accessed on 11 May 2023).
- United States Census Bureau. Largest Urbanized Areas with Selected Cities and Metro Areas. 2012. Available online: https://www.census.gov/dataviz/visualizations/026/ (accessed on 11 May 2023).
- United States Census Bureau. U.S. Census Bureau QuickFacts: New York City, New York; Bronx County (Bronx Borough), New York; Kings County (Brooklyn Borough), New York; New York County (Manhattan Borough), New York; Queens County (Queens Borough), New York; Richmond County (Staten Island). Available online: https://www.census.gov/quickfacts/fact/table/newyorkcitynewyork/PST045222 (accessed on 10 May 2023).
- NWS. NWS JetStream MAX. 2023—Addition Köppen Climate Subdivisions. Available online: https://www.weather.gov/jetstream/climate_max (accessed on 11 May 2023).
- NWS. Monthly Annual Precipitation at Central Park. 2023. Available online: https://www.weather.gov/media/okx/Climate/CentralPark/monthlyannualprecip.pdf (accessed on 11 May 2023).
- National Oceanic and Atmospheric Administration. Comparative Climatic Data. 2023. Available online: https://www.ncdc.noaa.gov/ghcn/comparative-climatic-data (accessed on 11 May 2023).
- State of New York. New York State Climate Hazards Profile. 2023. Available online: https://ap.buffalo.edu/content/dam/ap/PDFs/NYSERDA/New-York-State-Climate-Hazards-Profile.pdf (accessed on 11 May 2023).
- City of New York. Impact of NYW Bonds. 2023. Available online: https://www1.nyc.gov/site/nyw/investing-in-nyw-bonds/the-impact-of-investing.page (accessed on 11 May 2023).
- New York City Council. Report on the Fiscal 2023 Preliminary Plan and the Fiscal 2022 Mayor’s Management Report for the Department of Environmental Protection. 2022. Available online: https://council.nyc.gov/budget/wp-content/uploads/sites/54/2022/03/DEP.pdf (accessed on 11 May 2023).
- Figueredo, G.P.; Siebers, P.O.; Aickelin, U. Investigating mathematical models of immuno-interactions with early-stage cancer under an agent-based modelling perspective. BMC Bioinform. 2013, 14, S6. [Google Scholar] [CrossRef]
- Pianosi, F.; Beven, K.; Freer, J.; Hall, J.W.; Rougier, J.; Stephenson, D.B.; Wagener, T. Sensitivity analysis of environmental models: A systematic review with practical workflow. Environ. Model. Softw. 2016, 79, 214–232. [Google Scholar] [CrossRef]
- James, F. Monte Carlo theory and practice. Rep. Prog. Phys. 1980, 43, 1145. [Google Scholar] [CrossRef]
- Raychaudhuri, S. Introduction to monte Carlo simulation. In Proceedings of the 2008 Winter Simulation Conference, Miami, FL, USA, 7–10 December 2008; pp. 91–100. [Google Scholar]
- Hurtado, J.E.; Barbat, A. Monte Carlo techniques in computational stochastic mechanics. Arch. Comput. Methods Eng. 1998, 5, 3–29. [Google Scholar] [CrossRef]
- Janssen, H. Monte-Carlo based uncertainty analysis: Sampling efficiency and sampling convergence. Reliab. Eng. Syst. Saf. 2013, 109, 123–132. [Google Scholar] [CrossRef]
- Heijungs, R. On the number of Monte Carlo runs in comparative probabilistic LCA. Int. J. Life Cycle Assess. 2020, 25, 394–402. [Google Scholar] [CrossRef]
- Feng, S.-Y.; Wang, H.-Q.; Cui, Y.; Ye, Y.-J.; Li, X.-Y.; Xie, D.; He, Z.-Z.; Yang, R. Monte Carlo method for determining radon diffusion coefficients in porous media. Radiat. Meas. 2019, 126, 106130. [Google Scholar] [CrossRef]
- Liu, X. Uncertainty and Sensitivity Analysis of a Simplified ORWARE Model for Jakarta. 2006. Available online: https://www.diva-portal.org/smash/record.jsf?pid=diva2%3A411539&dswid=-3929 (accessed on 15 May 2023).
- Back, W.E.; Boles, W.W.; Fry, G.T. Defining triangular probability distributions from historical cost data. J. Constr. Eng. Manag. 2000, 126, 29–37. [Google Scholar] [CrossRef]
- Keyser, V. Artifacts and artefacts: A methodological classification of context-specific regularities. In Perspectives on Classification in Synthetic Sciences; Routledge: Oxford, UK, 2019; pp. 63–77. [Google Scholar]
- Ghaderi, M. Public health interventions in the face of pandemics: Network structure, social distancing, and heterogeneity. Eur. J. Oper. Res. 2022, 298, 1016–1031. [Google Scholar] [CrossRef]
- AIST. Achieved High Operating Rate Operation of Optical Lattice Clock: For Half a Year. 2020. Available online: http://tokiox.com/wp/aist-high-operating-rate-operation-of-optical-lattice/?lang=en (accessed on 10 May 2023).
- Zacks. US Raw Steel Output Jumps Y/Y on Higher Capacity Utilization. 2018. Available online: https://www.yahoo.com/now/us-raw-steel-output-jumps-124412243.html (accessed on 10 May 2023).
- Williamson, C.A.; Rickman, J.M.; Freeman, D.A.; Manka, M.A.; McLin, L.N. Measuring the contribution of atmospheric scatter to laser eye dazzle. Appl. Opt. 2015, 54, 7567–7574. [Google Scholar] [CrossRef] [PubMed]
- City of New Orleans. 2017. Available online: https://bloximages.newyork1.vip.townnews.com/theadvocate.com/content/tncms/assets/v3/editorial/d/6d/d6d6ca68-838f-11e7-a491-9bb241c4f25d/5996055ec2777.pdf.pdf (accessed on 11 May 2023).
- Alduk, W.; Marenjak, S. Maintenance in the Life Cycle of Railway Infrastructure. In Proceedings of the Road and Rail Infrastructure III, 3rd International Conference on Road and Rail Infrastructure, Split, Croatia, 28–30 April 2014. [Google Scholar]
- Abd Rani, N.A.; Baharum, M.R.; Akbar, A.R.N.; Nawawi, A.H. Perception of maintenance management strategy on healthcare facilities. Procedia-Soc. Behav. Sci. 2015, 170, 272–281. [Google Scholar] [CrossRef]
- Horner, R.M.W.; El-Haram, M.A.; Munns, A.K. Building maintenance strategy: A new management approach. J. Qual. Maint. Eng. 1997, 3, 273–280. [Google Scholar] [CrossRef]
- Greeley, D. “The Water Systems that Support New York City”. NY Water Environment Association. 2018. Available online: https://www.nywea.org/Clearwater%20Article%20Documents/WaterSystems7Sp18.pdf (accessed on 16 May 2023).
- NYC. Flood Risk in NYC. 2016. Available online: https://www.nyc.gov/assets/planning/download/pdf/plans-studies/climate-resiliency/flood-risk-nyc-info-brief.pdf (accessed on 16 May 2023).


| Variable | Symbol |
|---|---|
| Number of service crews | SC |
| Replacement policy (binary) a | RP |
| Maintenance periods until the CB has to be replaced | MP |
| Parameter’s Name | Parameter’s Symbol | Parameter’s Value |
|---|---|---|
| Time needed for the maintenance of a CB | μ | 1.2 h |
| Time needed for the repair of a CB | γ | 1 day |
| Time needed for the replacement of a CB | β | 1 day |
| Daily crew cost 1 | λ | USD 1000 |
| Maintenance period 2 | ψ | 121 days |
| Replacement probability 3 | θ | 0.12 |
| Base failing rate | ε | ~Exp (0.009) |
| Fraction of functioning CBs (in percentage) | η | 80% |
| Maintenance cost | τ | ~triangular (USD 200, USD 250, USD 300) |
| Repair cost | ~triangular (USD 1000, USD 3000, USD 5000) | |
| Replacement cost | α | ~triangular (USD 2300, USD 7500, USD 15,000) |
| Speed of service crews | V | 50 kph |
| Age factor 4 | AF | 3 |
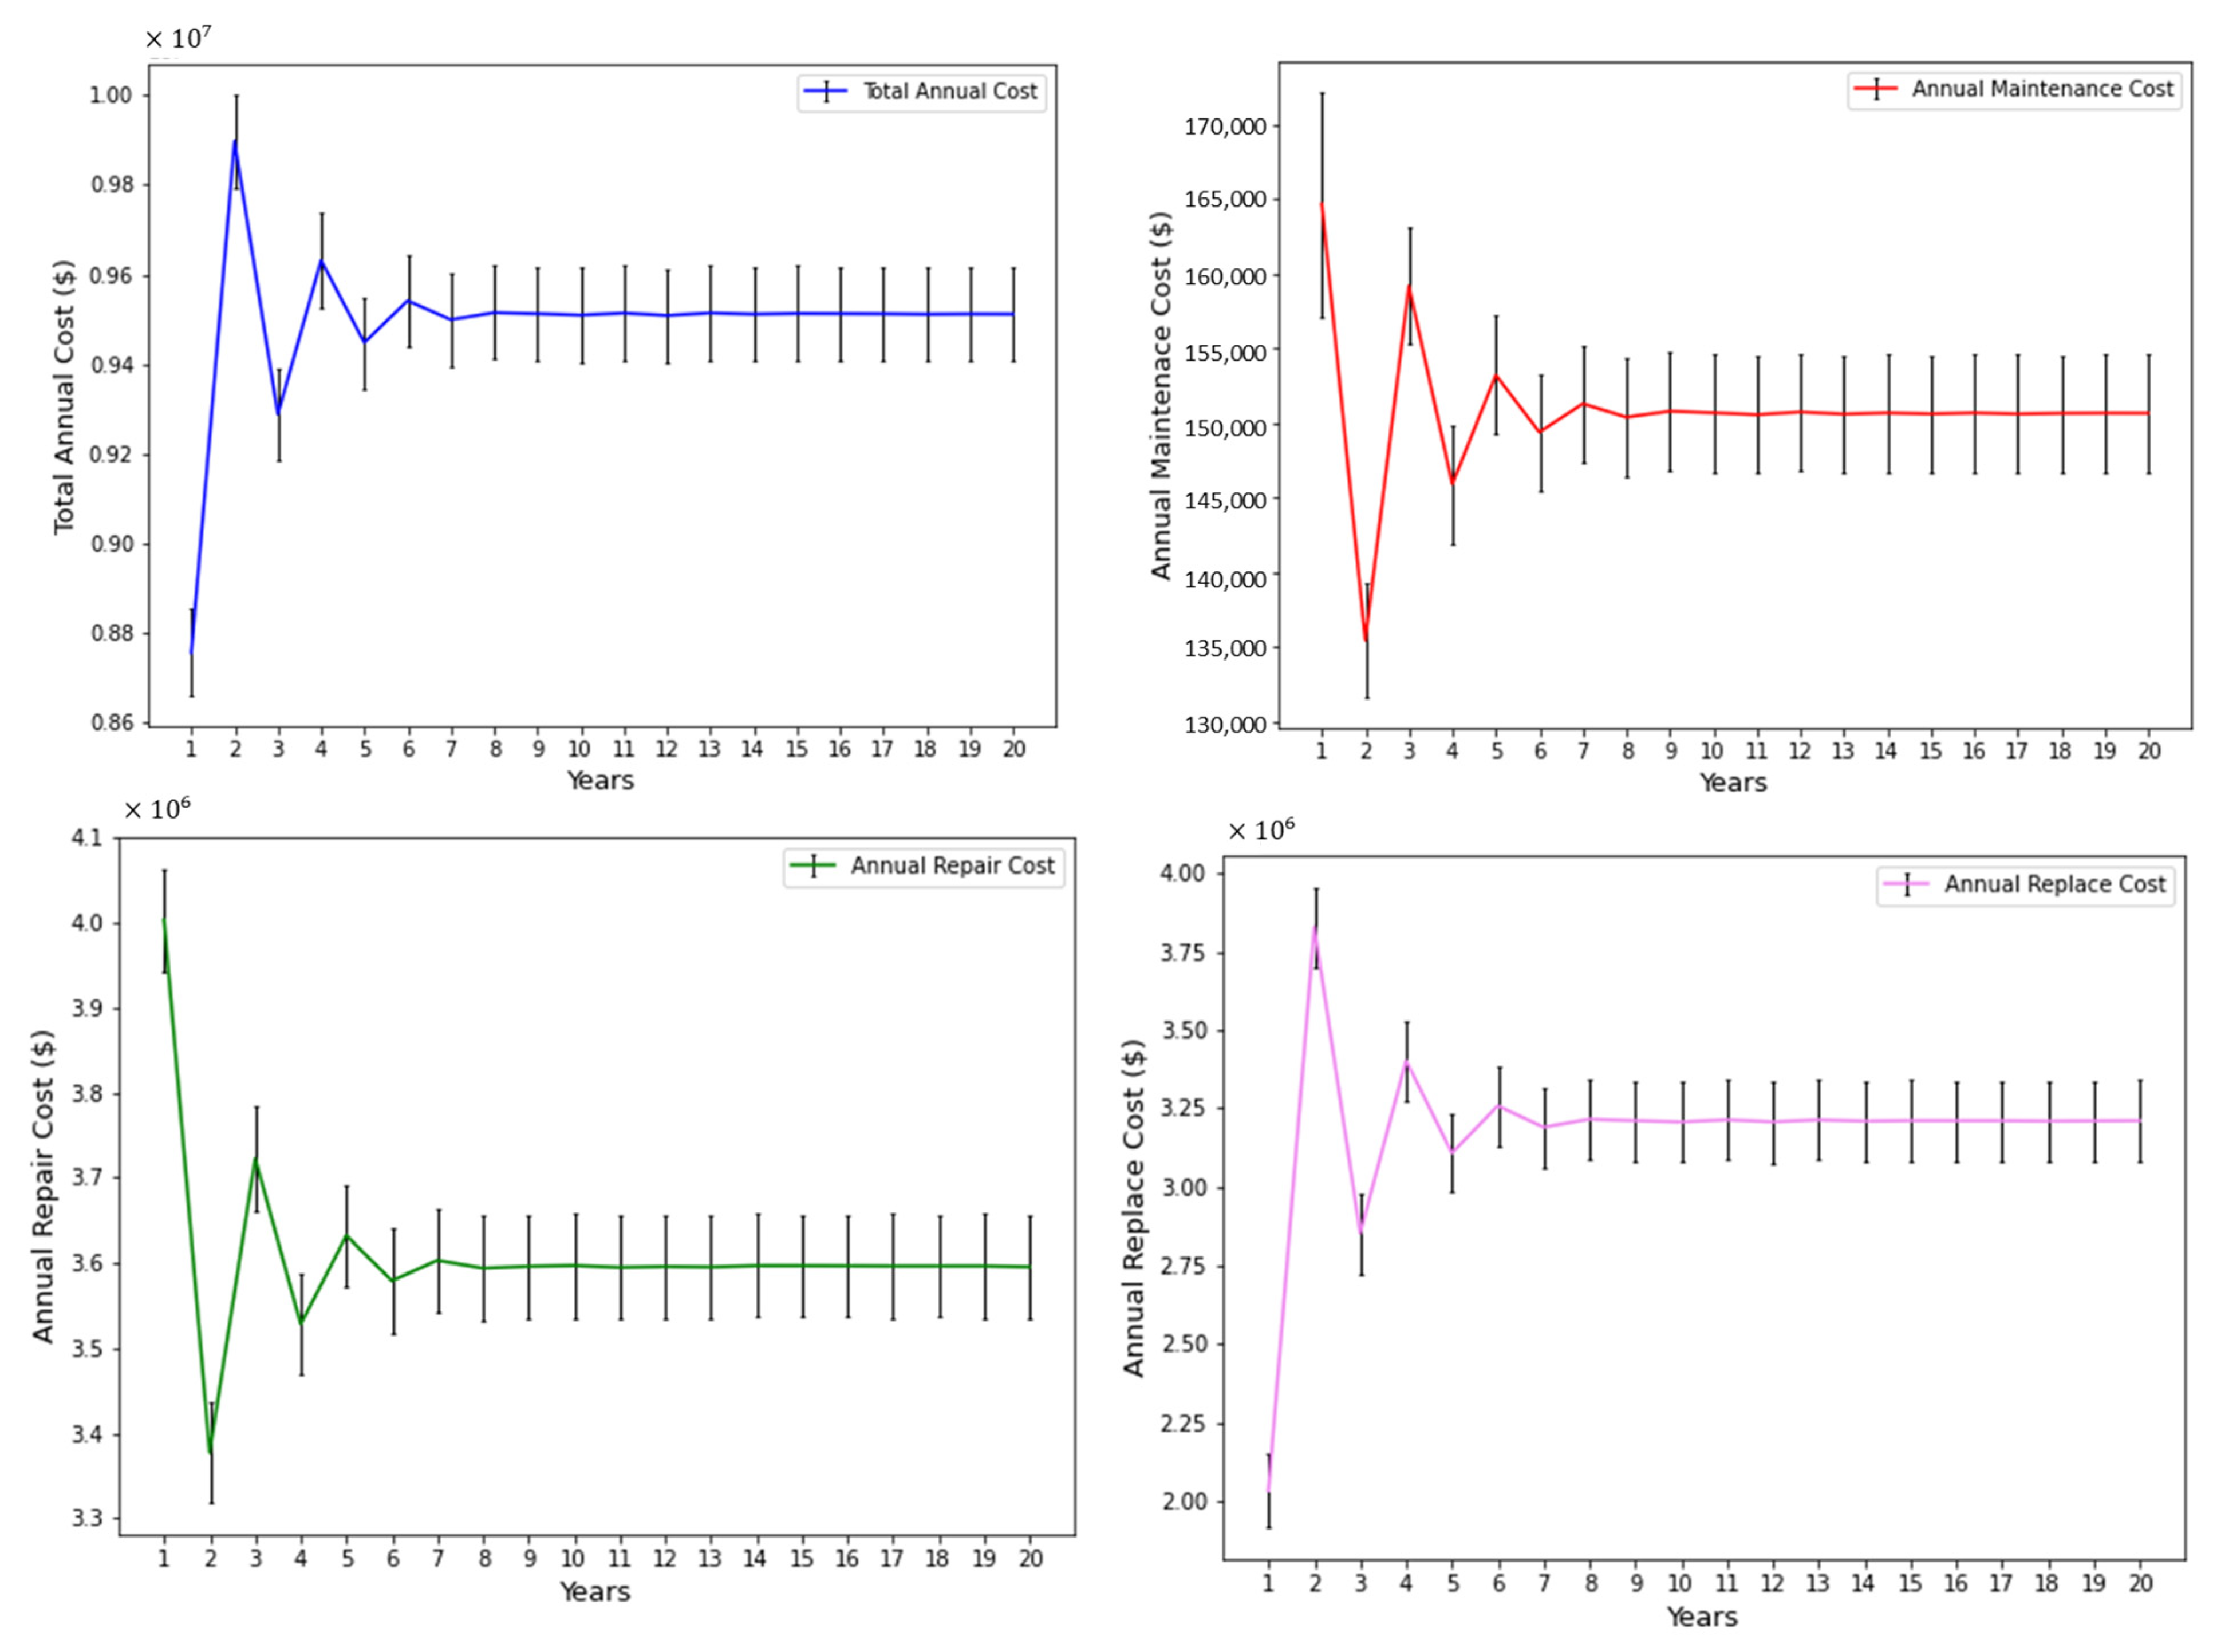
| Year | Overall Cost | Maintenance Cost | Repair Cost | Replace Cost |
|---|---|---|---|---|
| 1 | 96,910.5 | 7528.0 | 60,316.5 | 116,860.6 |
| 2 | 105,196.9 | 3834.5 | 59,057.9 | 127,310.7 |
| 3 | 103,877.1 | 3918.6 | 60,999.8 | 127,502.9 |
| 4 | 106,626.1 | 3971.8 | 59,727.3 | 129,165.9 |
| 5 | 102,477.8 | 3949.7 | 60,053.1 | 126,555.9 |
| 6 | 103,500.7 | 3931.0 | 61,116.0 | 128,350.6 |
| 7 | 103,888.3 | 3873.4 | 60,178.7 | 127,243.7 |
| 8 | 104,698.7 | 3931.3 | 61,029.3 | 128,601.6 |
| 9 | 104,960.3 | 3947.2 | 60,229.5 | 128,339.0 |
| 10 | 104,722.7 | 3950.4 | 61,361.8 | 128,433.9 |
| 11 | 105,230.8 | 3911.9 | 60,790.4 | 129,091.4 |
| 12 | 104,264.4 | 3923.2 | 60,263.6 | 129,545.5 |
| 13 | 104,275.7 | 3928.1 | 60,663.5 | 127,937.2 |
| 14 | 104,754.7 | 3931.2 | 60,376.0 | 128,548.2 |
| 15 | 105,478.4 | 3936.3 | 59,748.7 | 128,545.5 |
| 16 | 104,084.0 | 3929.4 | 59,973.1 | 127,827.1 |
| 17 | 104,884.1 | 3956.0 | 60,747.2 | 128,093.4 |
| 18 | 105,563.5 | 3897.5 | 59,907.0 | 129,071.9 |
| 19 | 103,809.4 | 3935.4 | 61,358.2 | 129,150.5 |
| 20 | 104,873.9 | 3920.2 | 60,237.1 | 128,617.2 |
| Parameter | Results of the Agent-Based Model | 99% Confidence Interval |
|---|---|---|
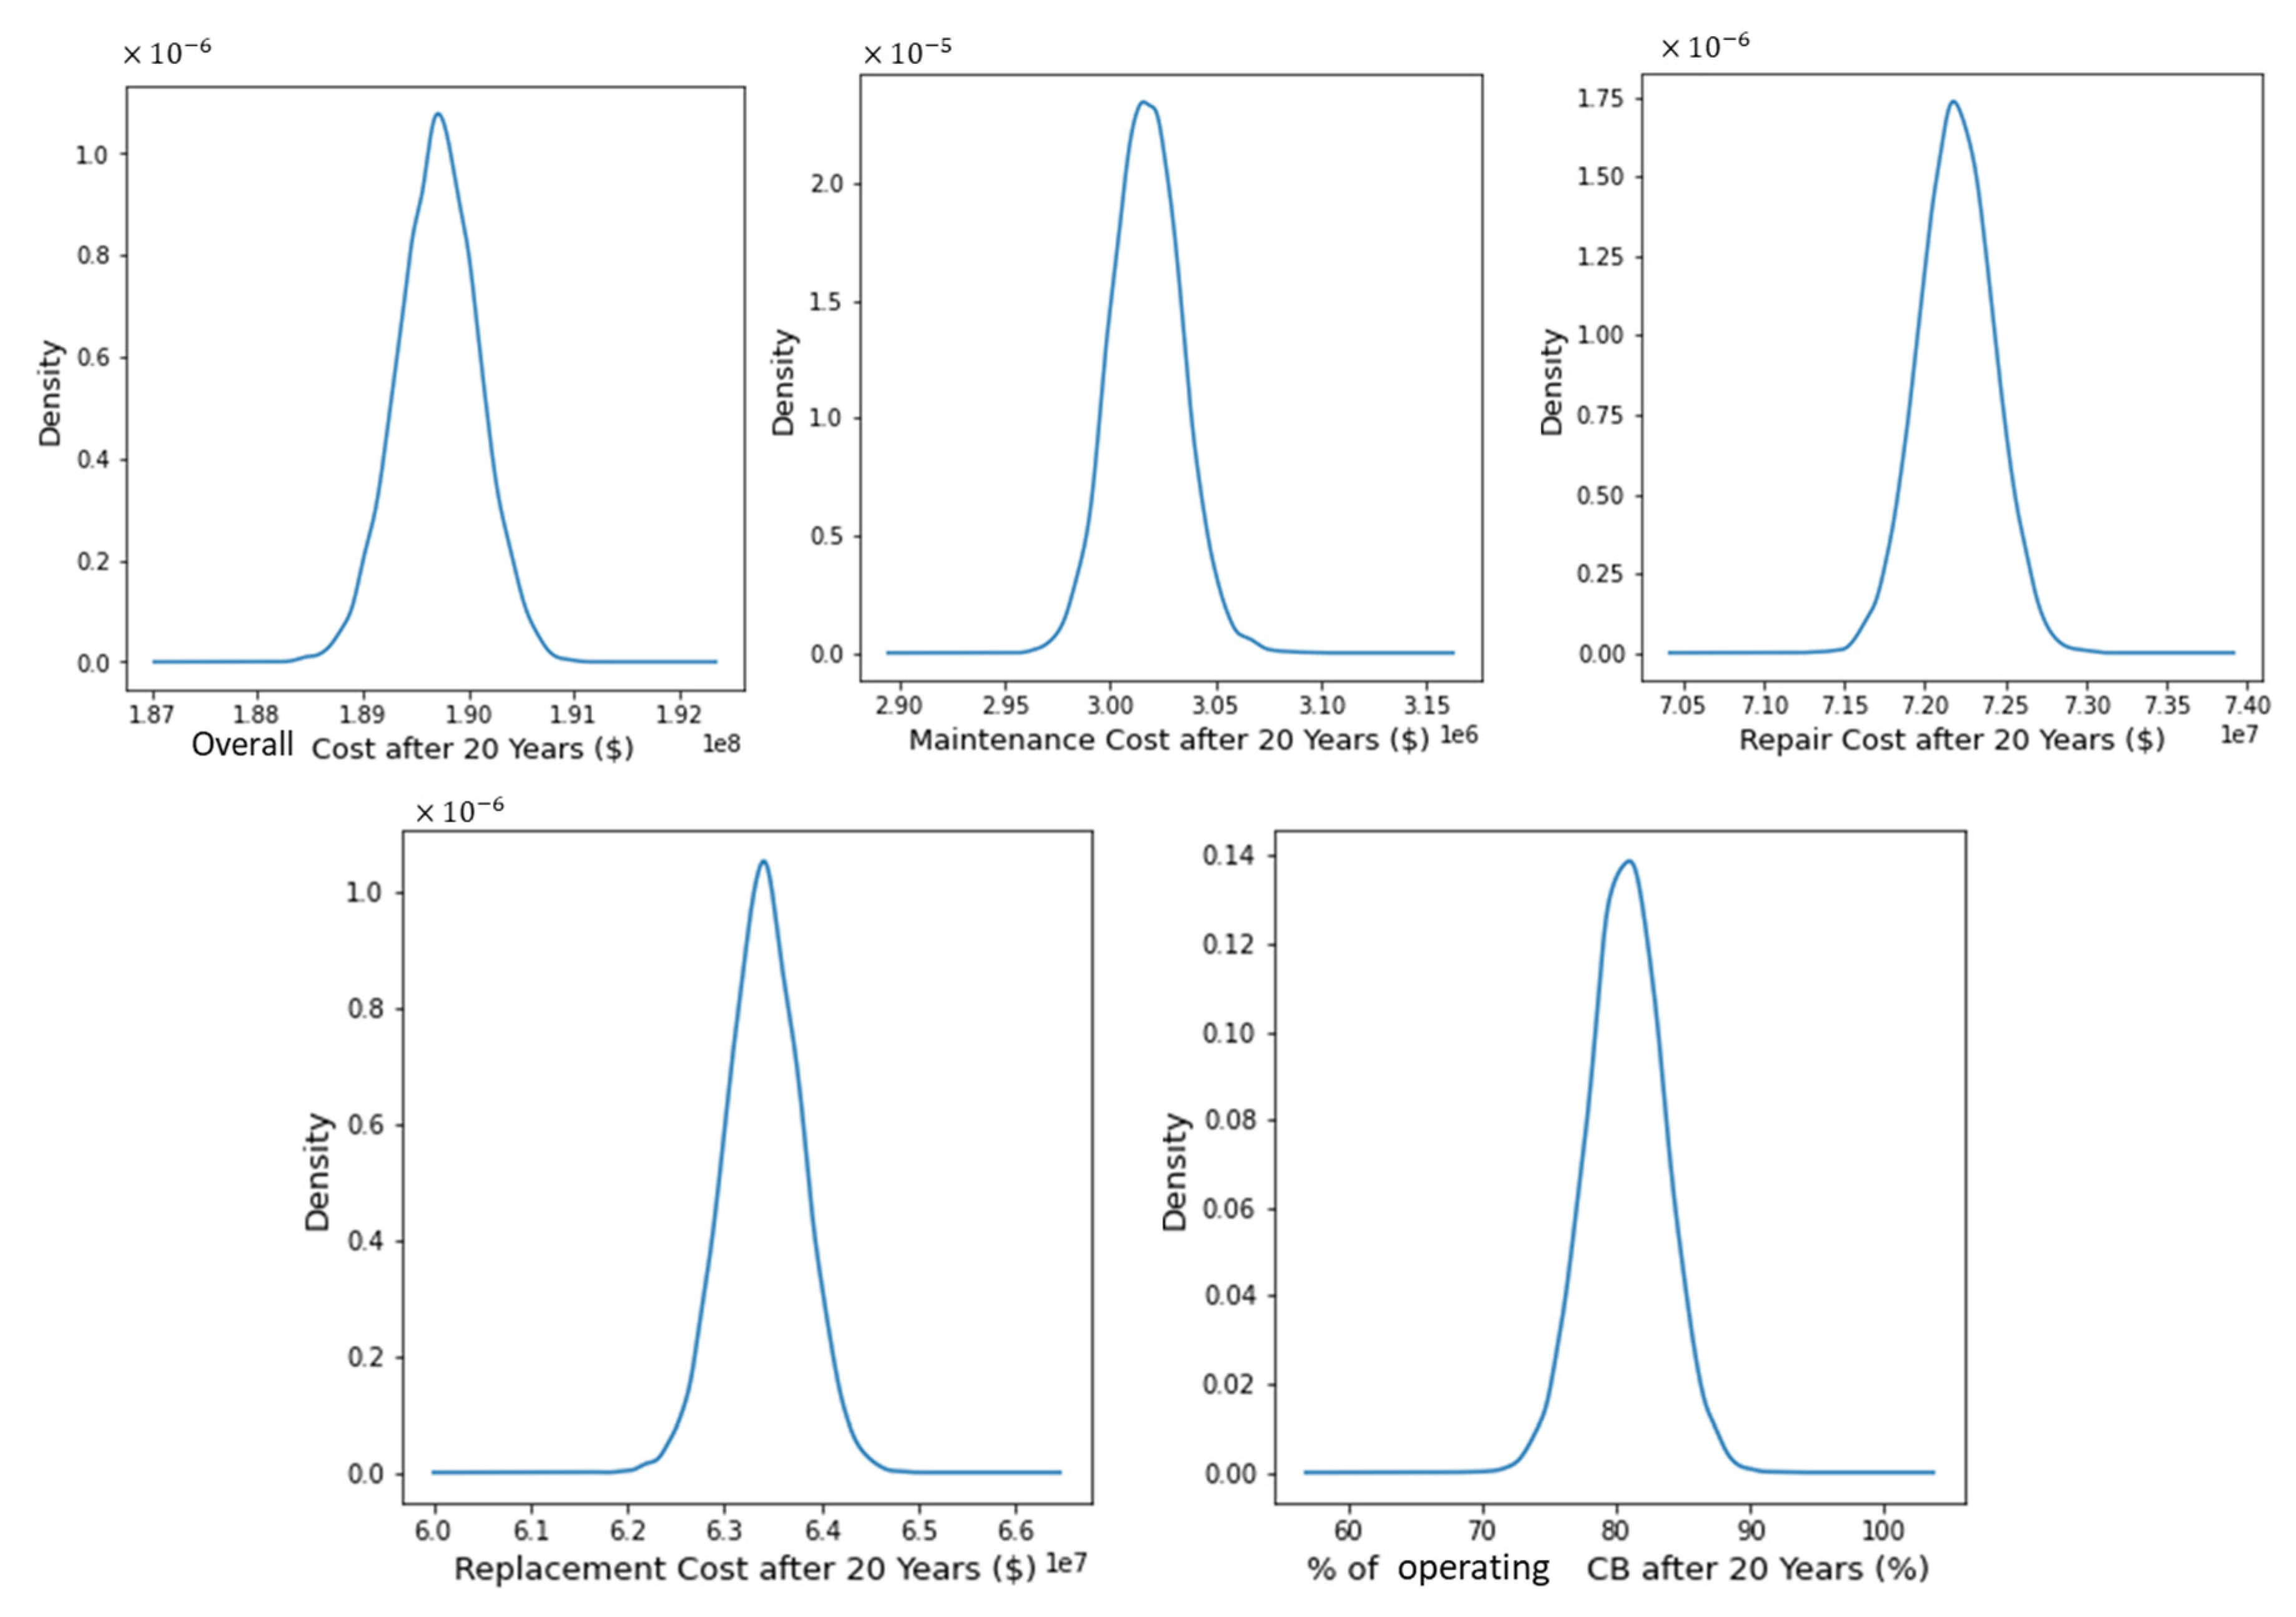
| Overall cost after 20 years | USD 190,100,000 | [USD 188,706,728; USD 190,669,288] |
| Maintenance cost after 20 years | USD 3,017,199 | [USD 2,975,766; USD 3,064,700] |
| Repair cost after 20 years | USD 72,388,368 | [USD 71,616,093; USD 72,781,261] |
| Replace cost after 20 years | USD 63,594,929 | [USD 62,371,475; USD 64,414,078] |
| Fraction of operating CB after 20 years | 84.8% | [73.4%; 88%] |
Disclaimer/Publisher’s Note: The statements, opinions and data contained in all publications are solely those of the individual author(s) and contributor(s) and not of MDPI and/or the editor(s). MDPI and/or the editor(s) disclaim responsibility for any injury to people or property resulting from any ideas, methods, instructions or products referred to in the content. |
© 2023 by the authors. Licensee MDPI, Basel, Switzerland. This article is an open access article distributed under the terms and conditions of the Creative Commons Attribution (CC BY) license (https://creativecommons.org/licenses/by/4.0/).
Share and Cite
Assaf, G.; Assaad, R.H. Optimal Preventive Maintenance, Repair, and Replacement Program for Catch Basins to Reduce Urban Flooding: Integrating Agent-Based Modeling and Monte Carlo Simulation. Sustainability 2023, 15, 8527. https://doi.org/10.3390/su15118527
Assaf G, Assaad RH. Optimal Preventive Maintenance, Repair, and Replacement Program for Catch Basins to Reduce Urban Flooding: Integrating Agent-Based Modeling and Monte Carlo Simulation. Sustainability. 2023; 15(11):8527. https://doi.org/10.3390/su15118527
Chicago/Turabian StyleAssaf, Ghiwa, and Rayan H. Assaad. 2023. "Optimal Preventive Maintenance, Repair, and Replacement Program for Catch Basins to Reduce Urban Flooding: Integrating Agent-Based Modeling and Monte Carlo Simulation" Sustainability 15, no. 11: 8527. https://doi.org/10.3390/su15118527
APA StyleAssaf, G., & Assaad, R. H. (2023). Optimal Preventive Maintenance, Repair, and Replacement Program for Catch Basins to Reduce Urban Flooding: Integrating Agent-Based Modeling and Monte Carlo Simulation. Sustainability, 15(11), 8527. https://doi.org/10.3390/su15118527