

Mobility-as-a-Service (MaaS) and High-Speed Rail Operators: Do Not Let the Train Pass!


Abstract
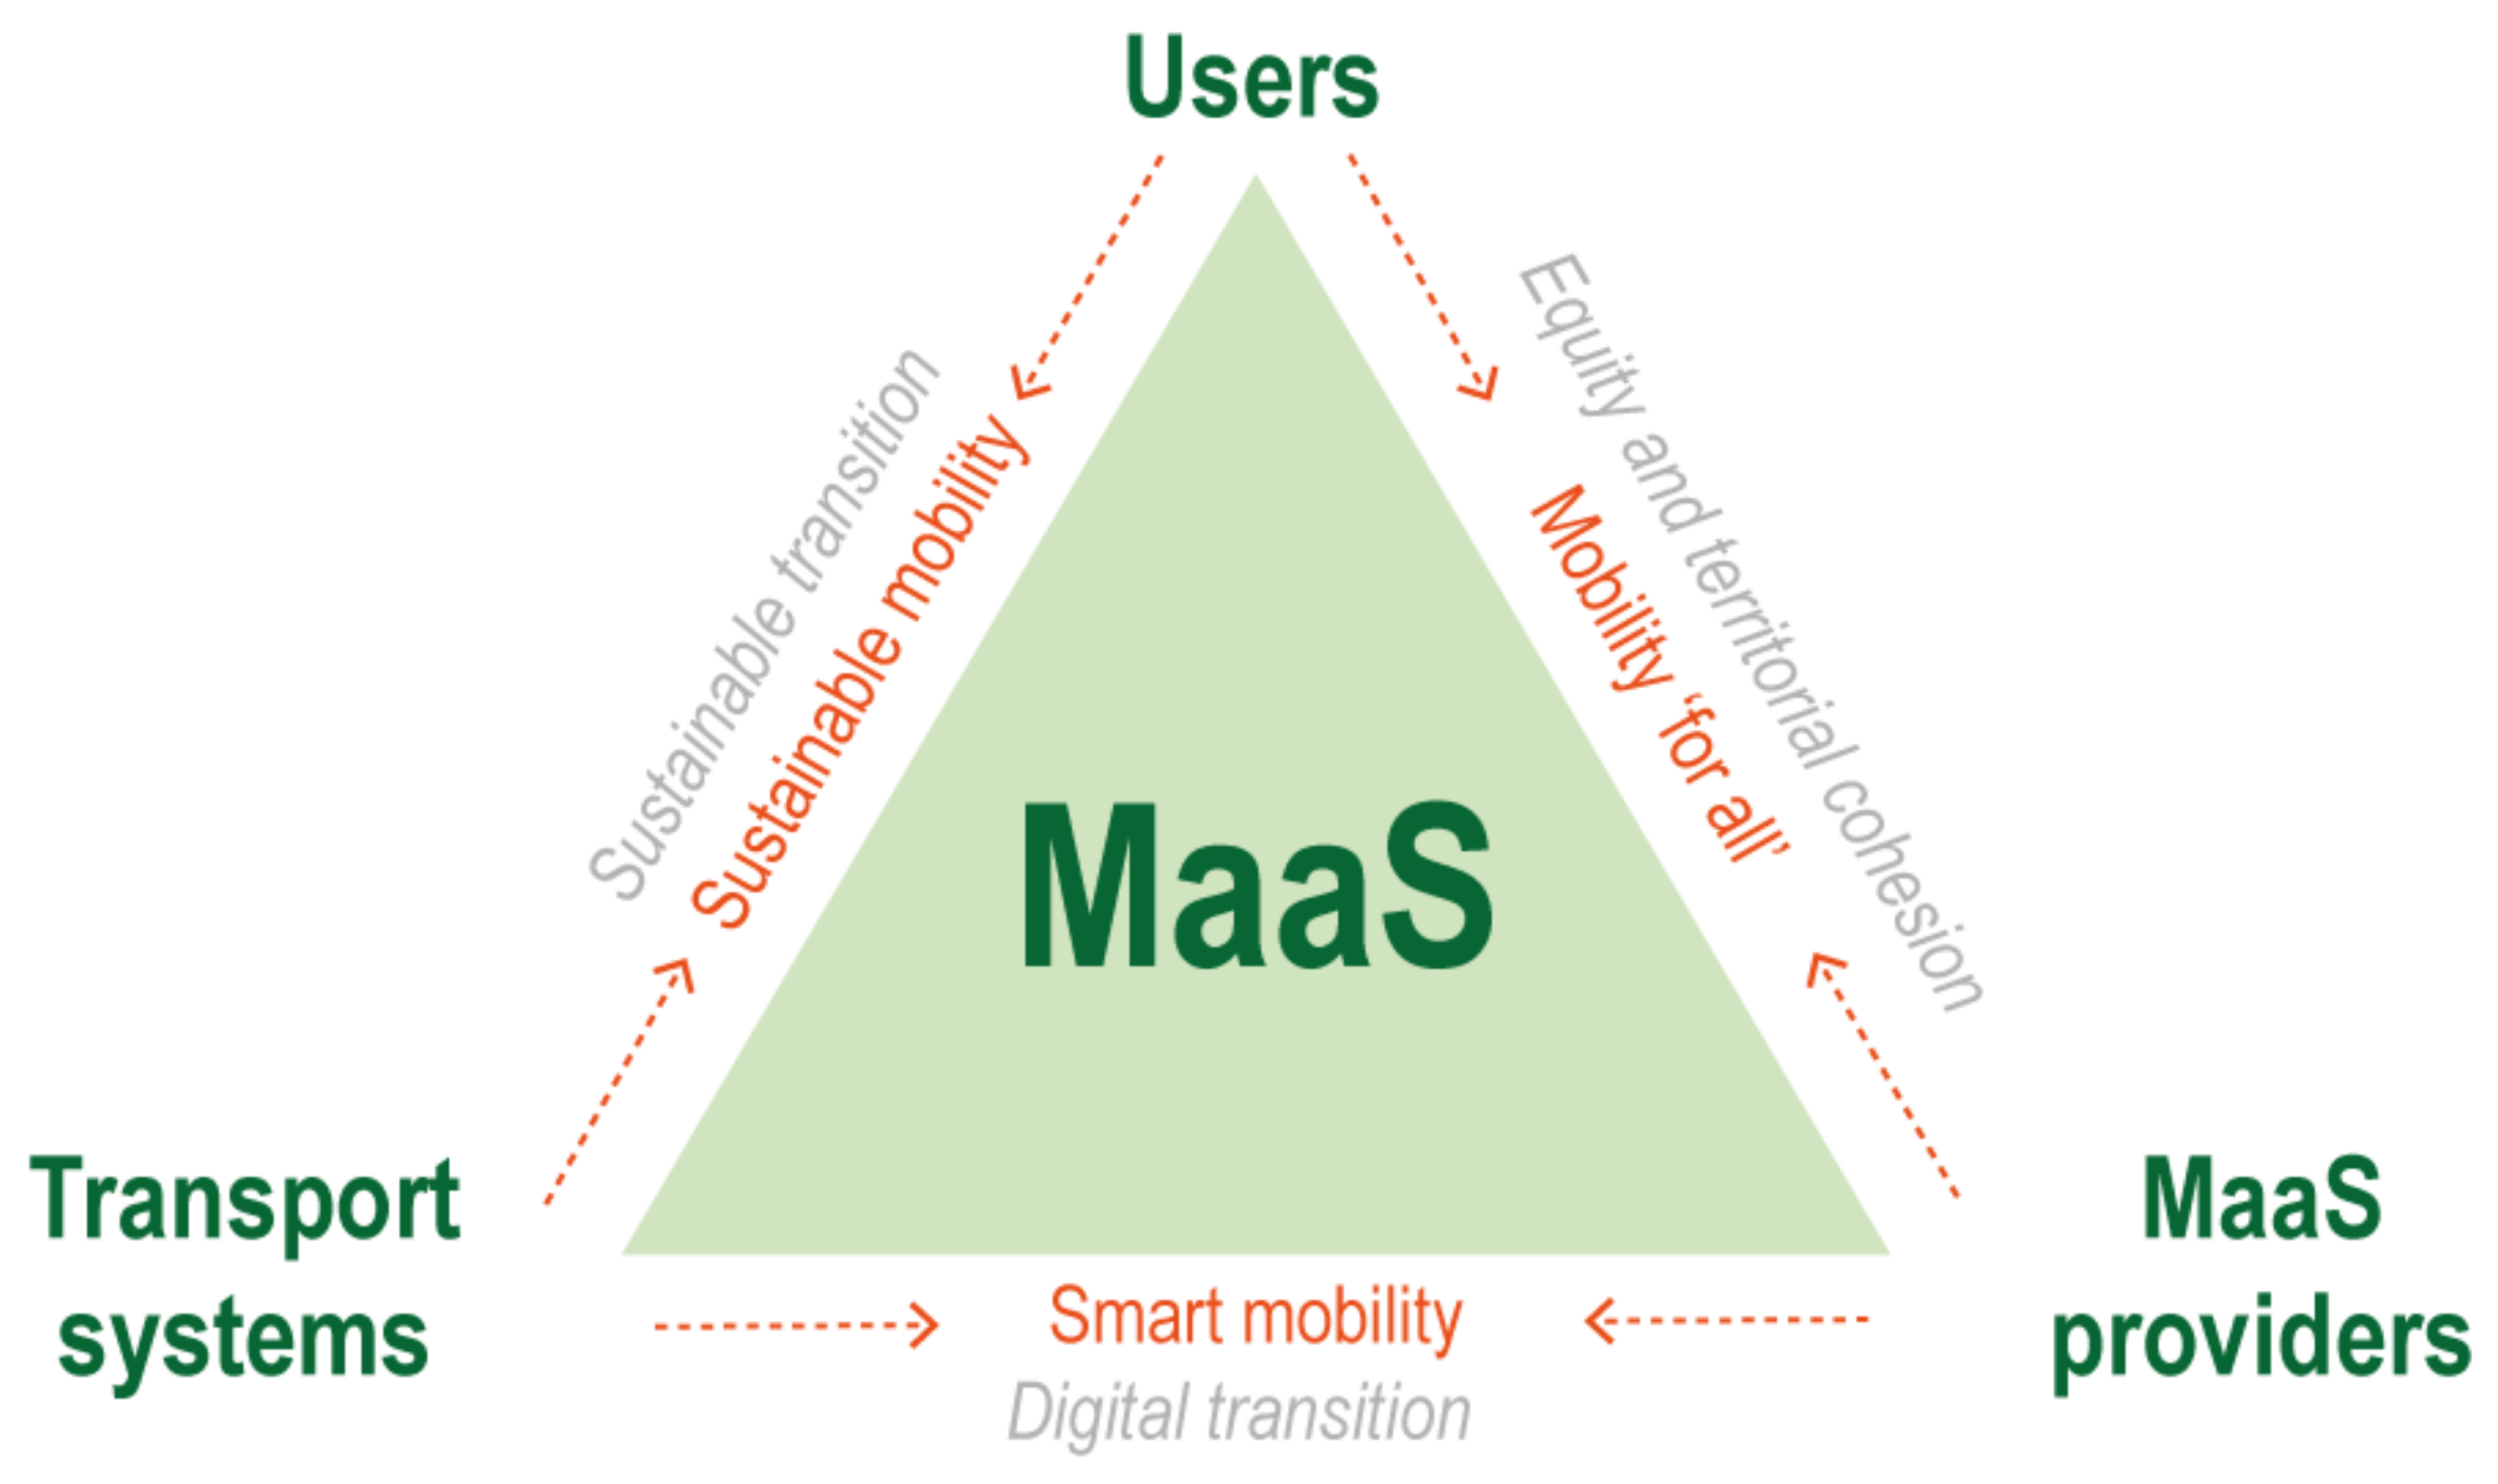
1. Introduction
“We are convinced that to offer more trains, we need to offer more than trains. We need to be able to offer our travellers the possibility to go from departure point to destination, by combining sustainable modes of transport with a railway backbone”.
“We need to offer a solution that takes our customers from point A to point B as easily and seamlessly as a car. That’s our goal for Assistant SNCF”
2. MaaS in Different Travelling Scales: From Urban to Long-Distance Mobility
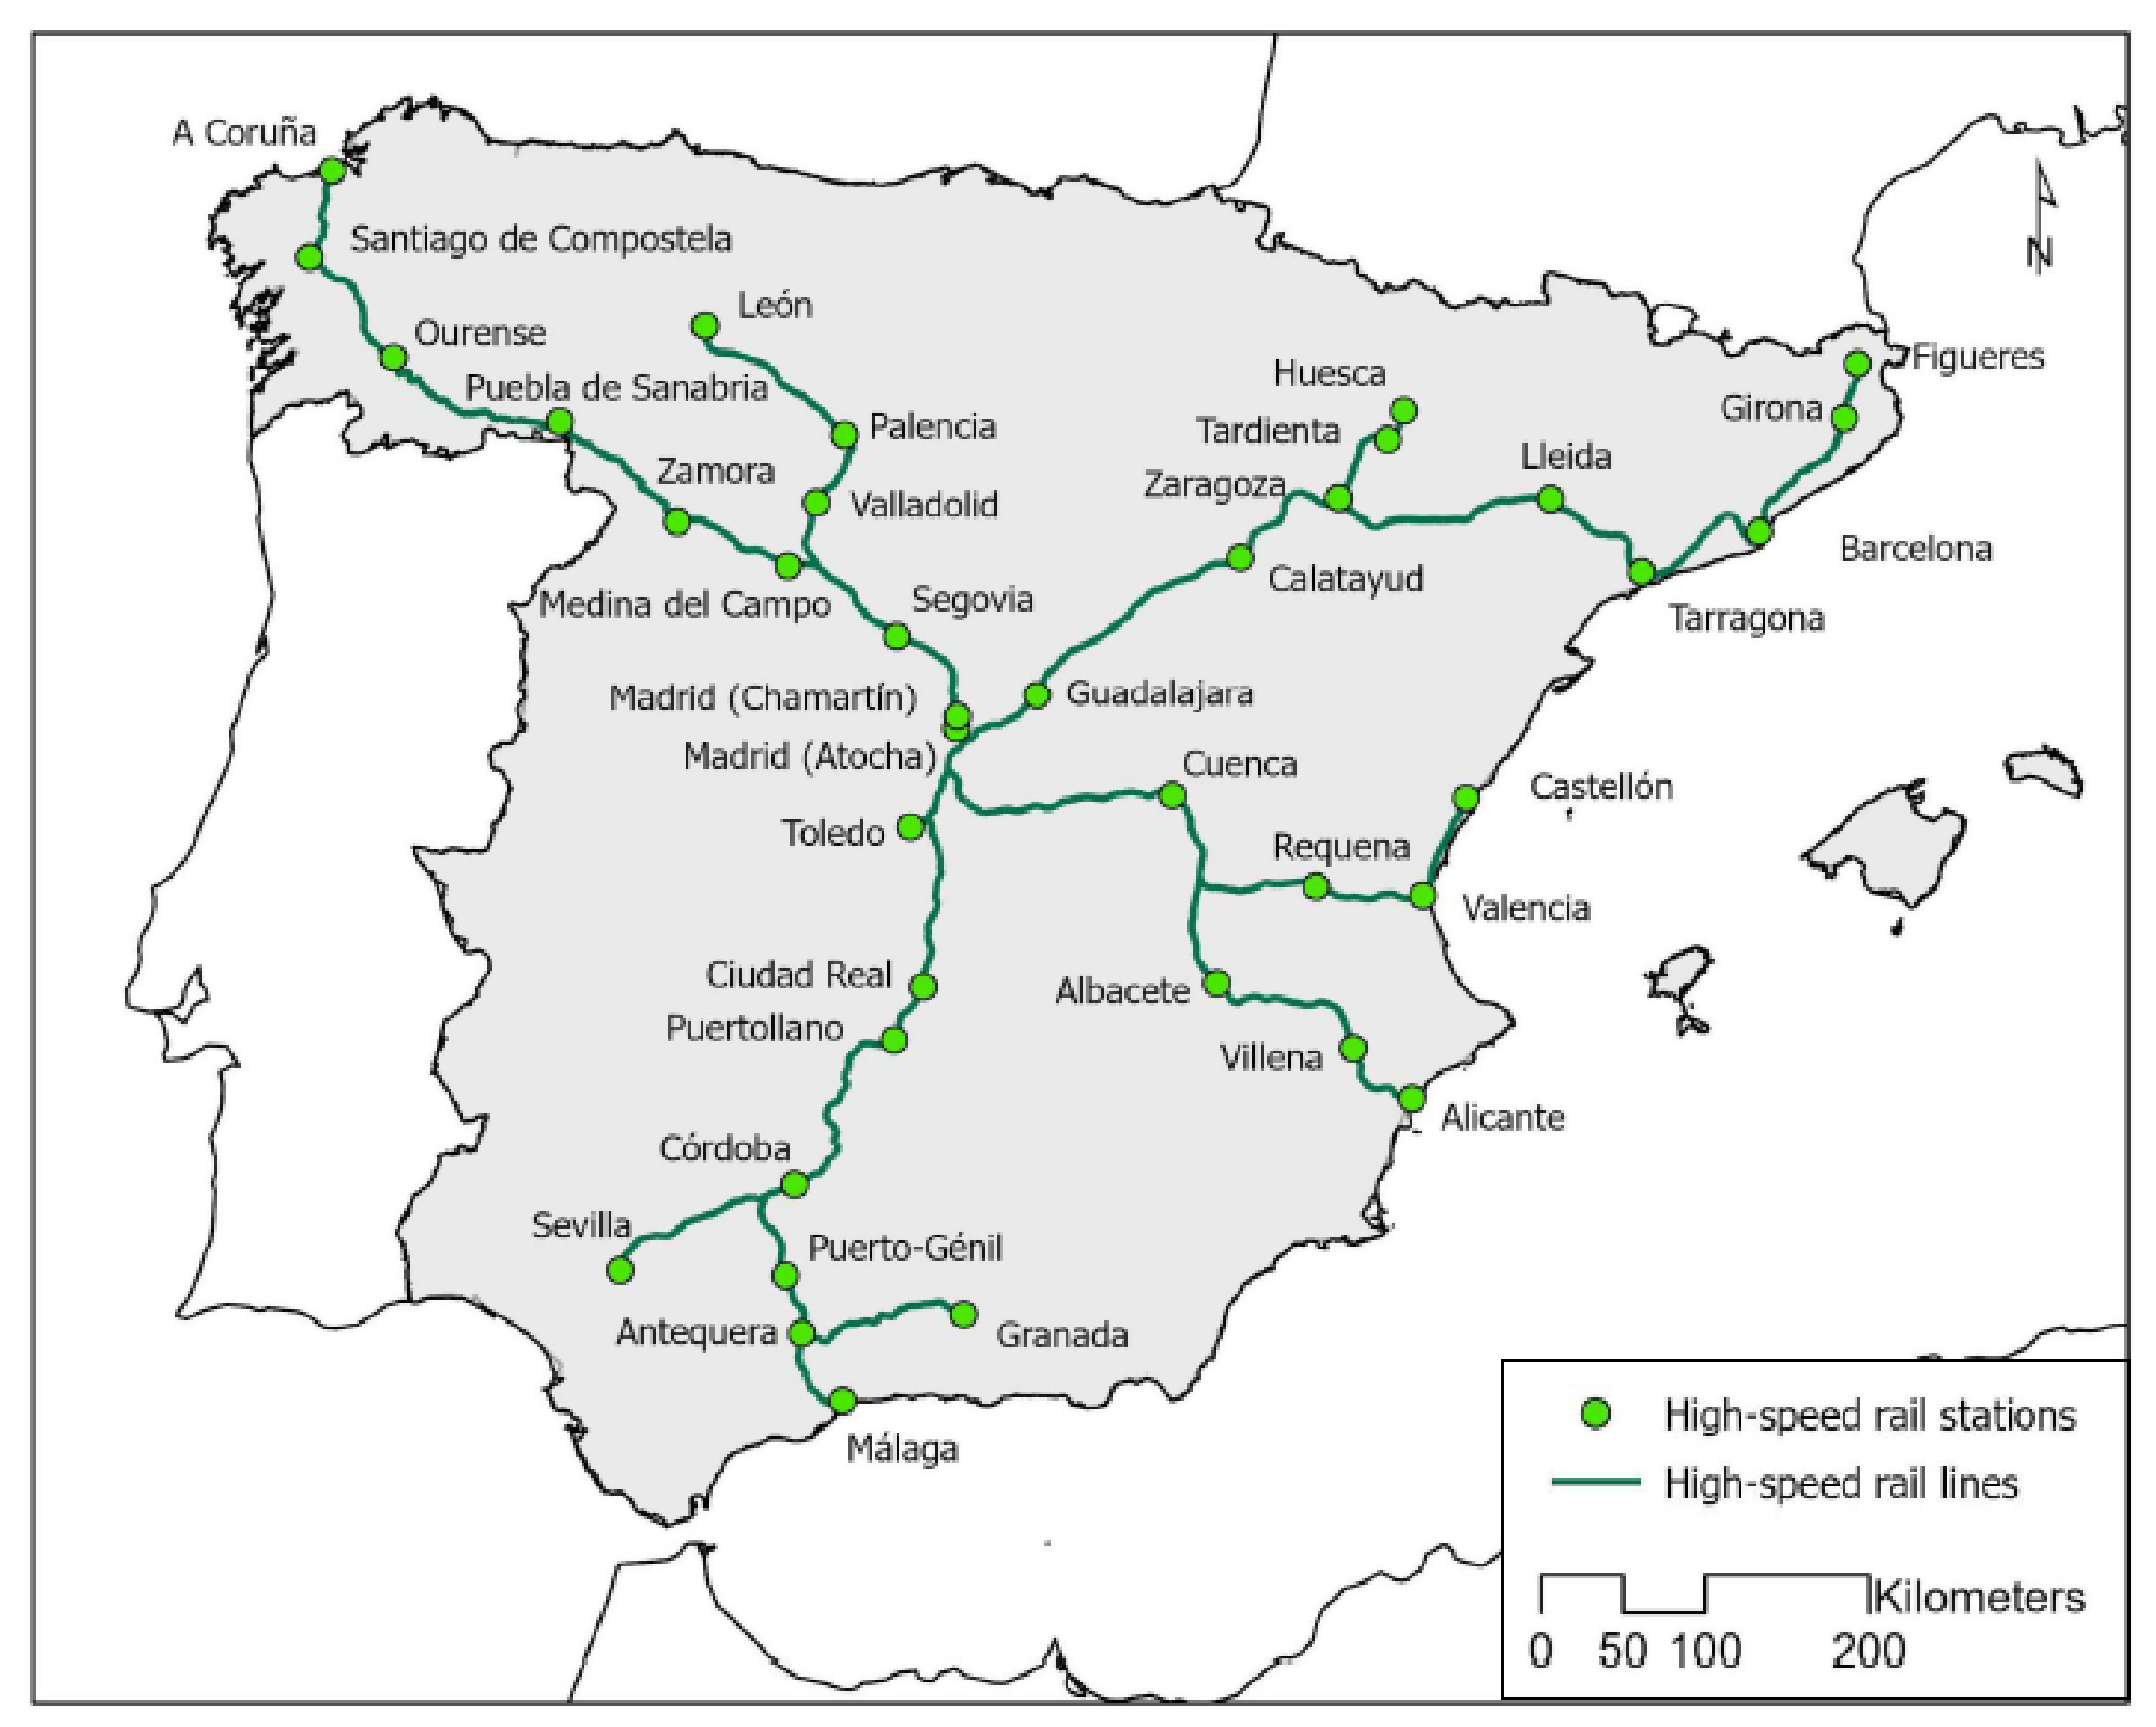
3. Case Study: The Spanish HSR System
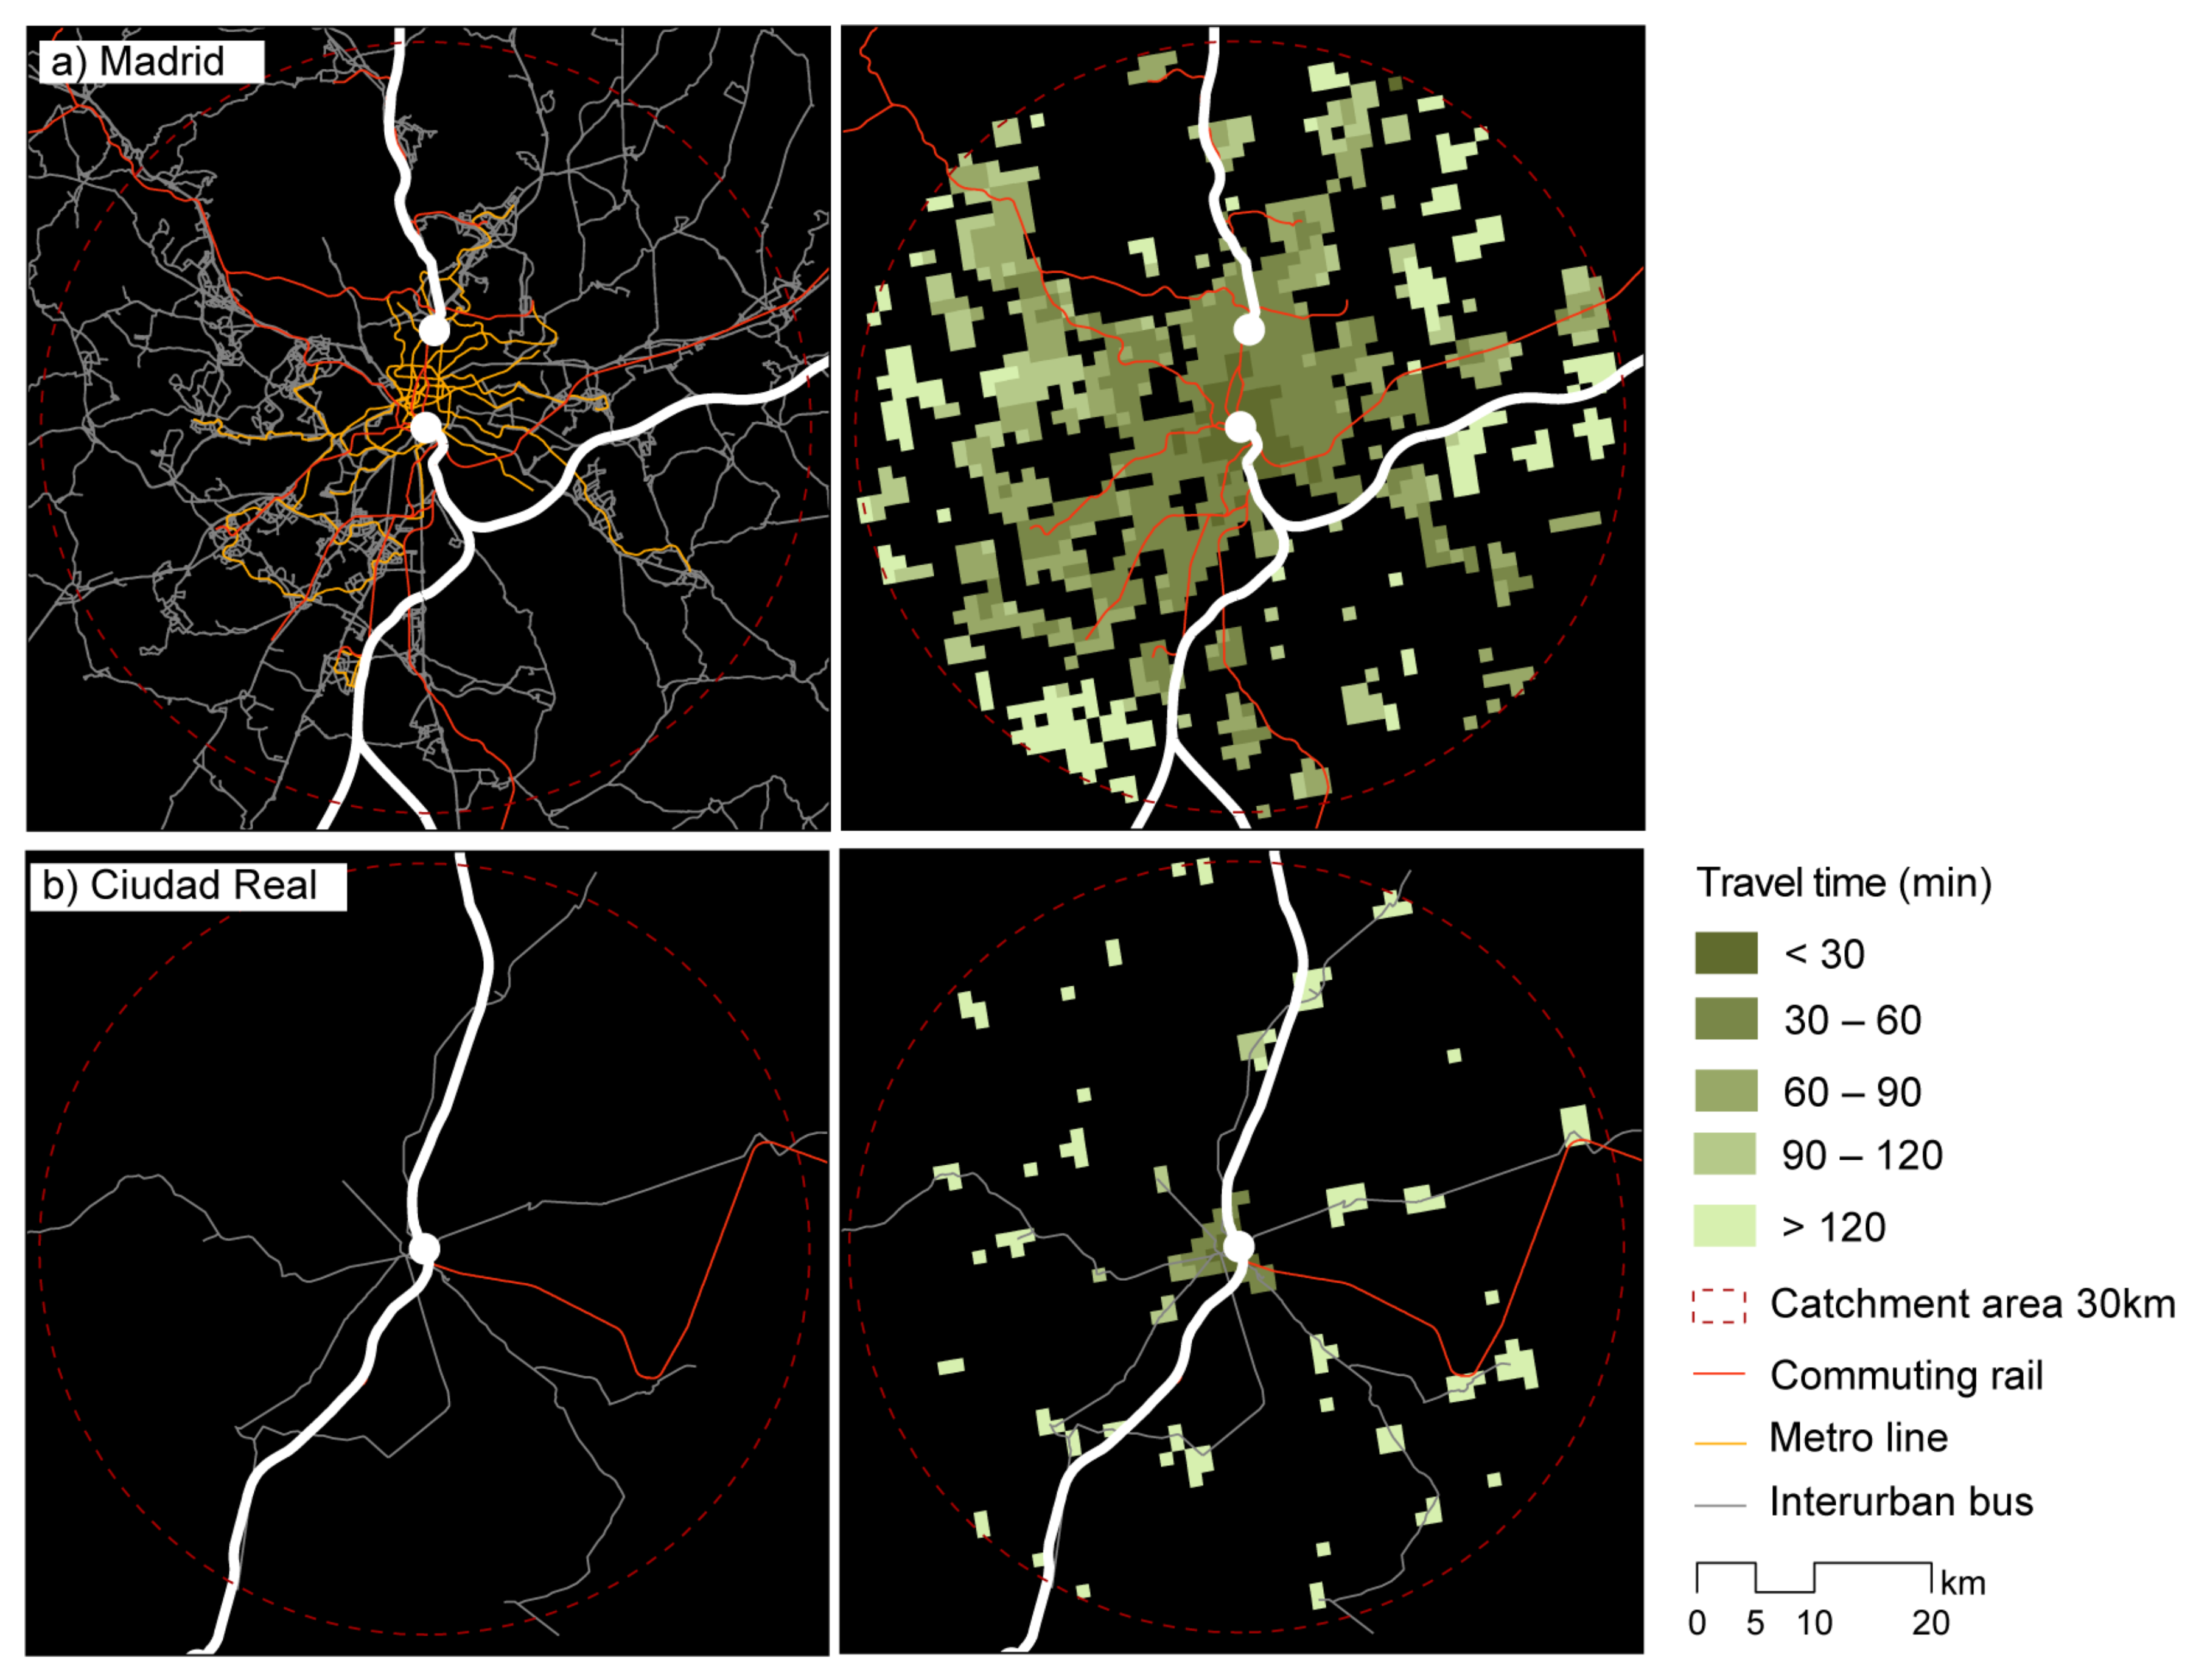
4. Methodology: Empirical Procedures and Critical Analysis
- Socioeconomic analysis: Methodologically, this analysis is carried out considering first, the near catchment area (up to 5 km from the station), and second, the far catchment area (from 5 to 30 km from the station). In assessing these areas, this paper tries to distinguish between urban and suburban/rural environments. Considering this approach, the variables analysed are: (1) The ‘total population’ which is the total number of inhabitants living in the area included in each of the catchment areas; (2) the population over 64 years old, which is represented as a percentage of the total population; (3) the population with no studies resulting from the sum of uneducated and illiterate people living in these areas, and also represented as a percentage of the total population; (4) the income value, referred to as the average net income per inhabitant; (5) the average density of dwellings, considering the number of dwellings per area of the cells of the populated grid included in each catchment area extension; (6) the ‘dwellings with internet’, represented as a percentage and calculated according to the weighted average of percentages of dwellings with internet of all the cells of the grid included in each catchment area extension. These socioeconomic variables are obtained from the data of INE (National Institute of Statistics of Spain), disaggregated for the 1 km × 1 km grid, and then processed using a GIS environment to obtain the values for each catchment area. The variables related to dwellings are calculated using Spanish Census data information, 2011.
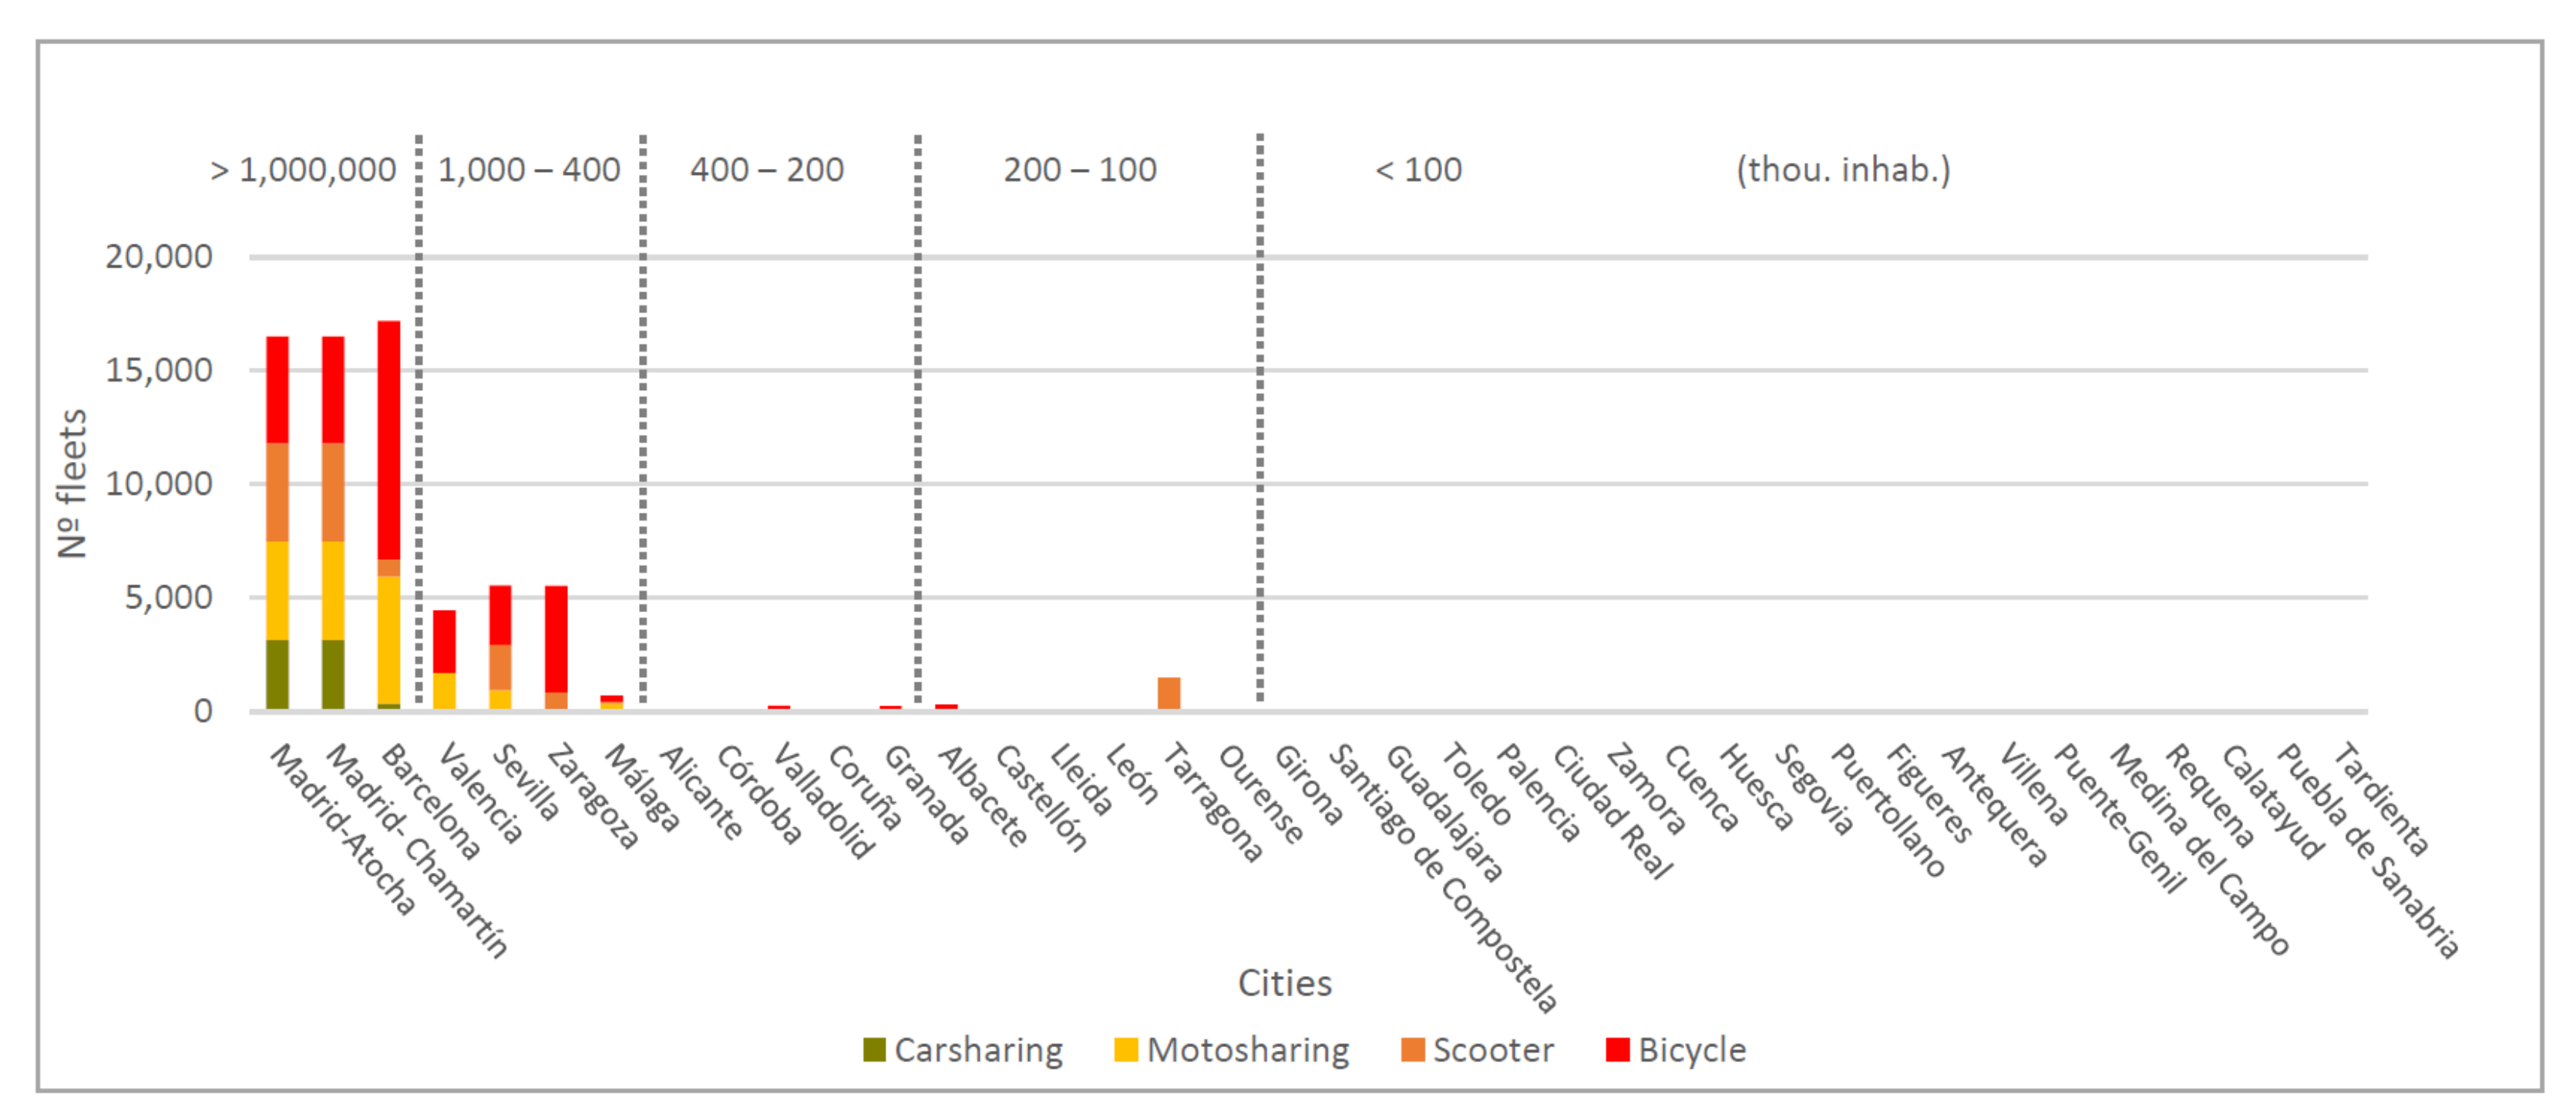
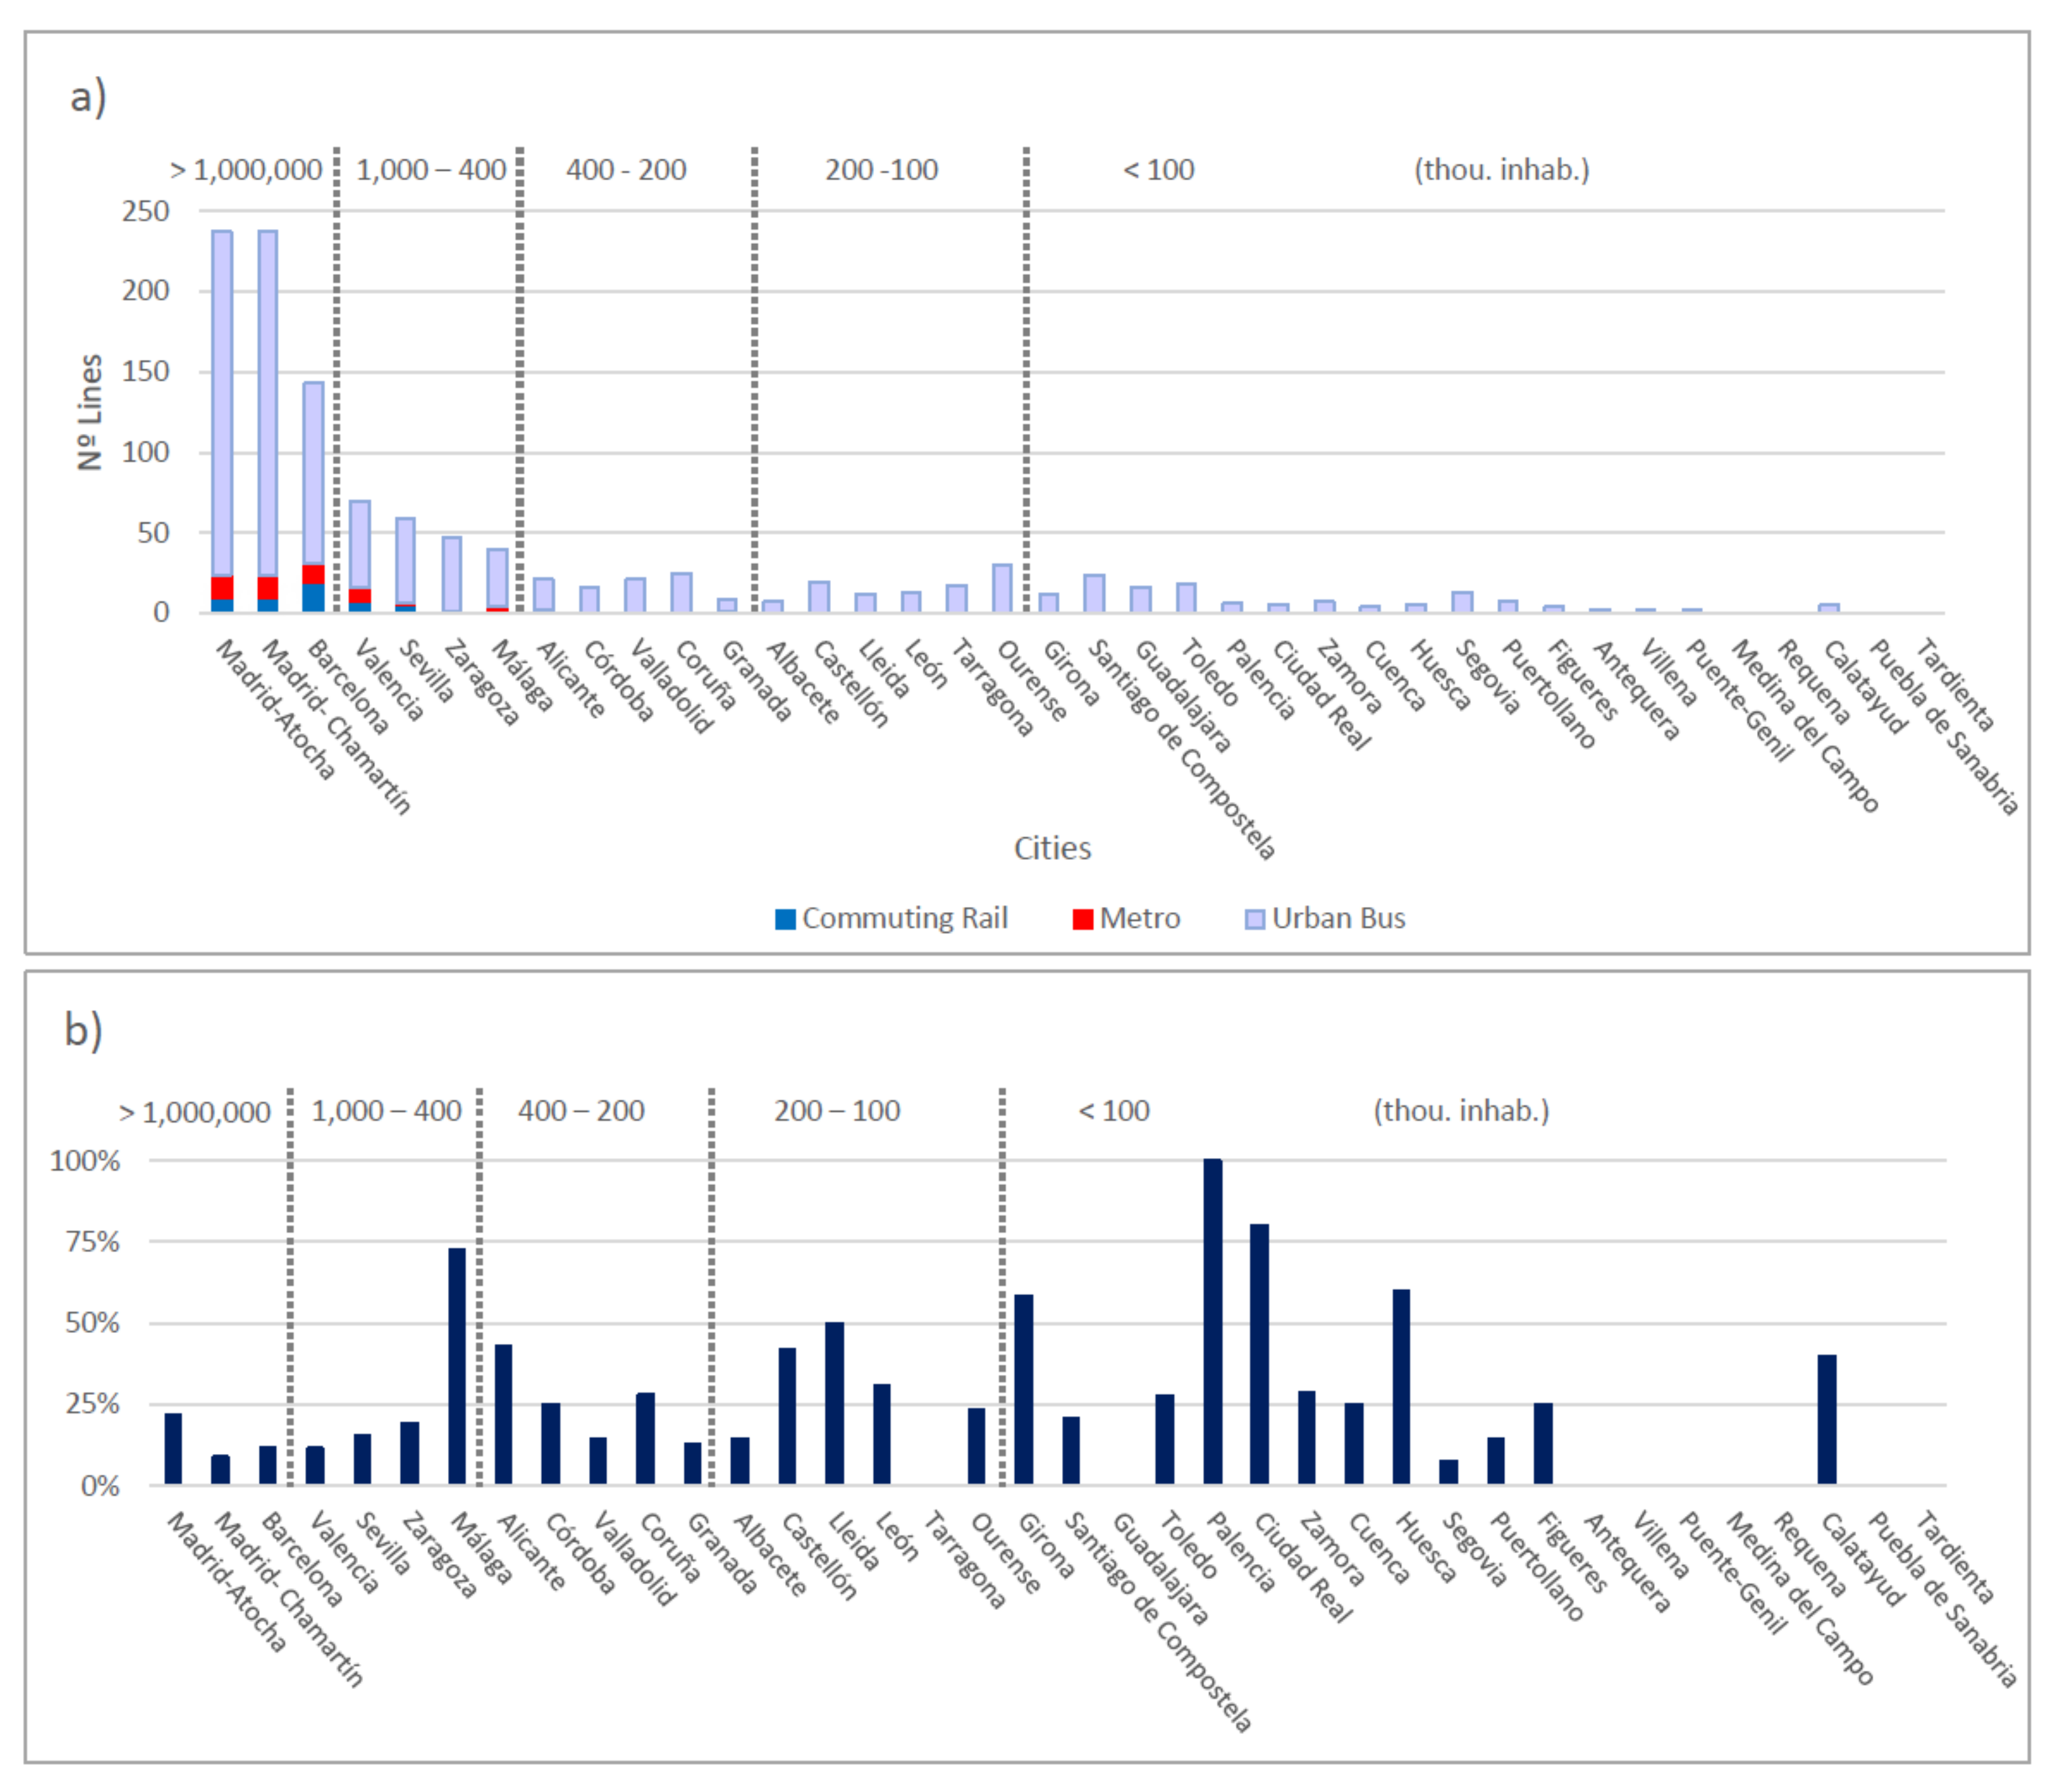
- Local/regional transport systems’ analysis: Both public transport systems and shared mobility are analysed. In the case of traditional public transport, the transport modes evaluated are regional railway, commuting rail, metro, interurban bus and urban bus. For all of them, the variables analysed are: (1) the number of lines available in each city; (2) the number of direct lines connecting to each HSR station (possibilities for intermodality; a distance of less than 200 m between modes is considered a direct link). In the case of shared mobility, the transport modes analysed are: carsharing, motosharing, scooter and bicycle (both systems with and without fixed anchors), for which (3) the number of enterprises operating in each city, and (4) the total fleet are assessed.
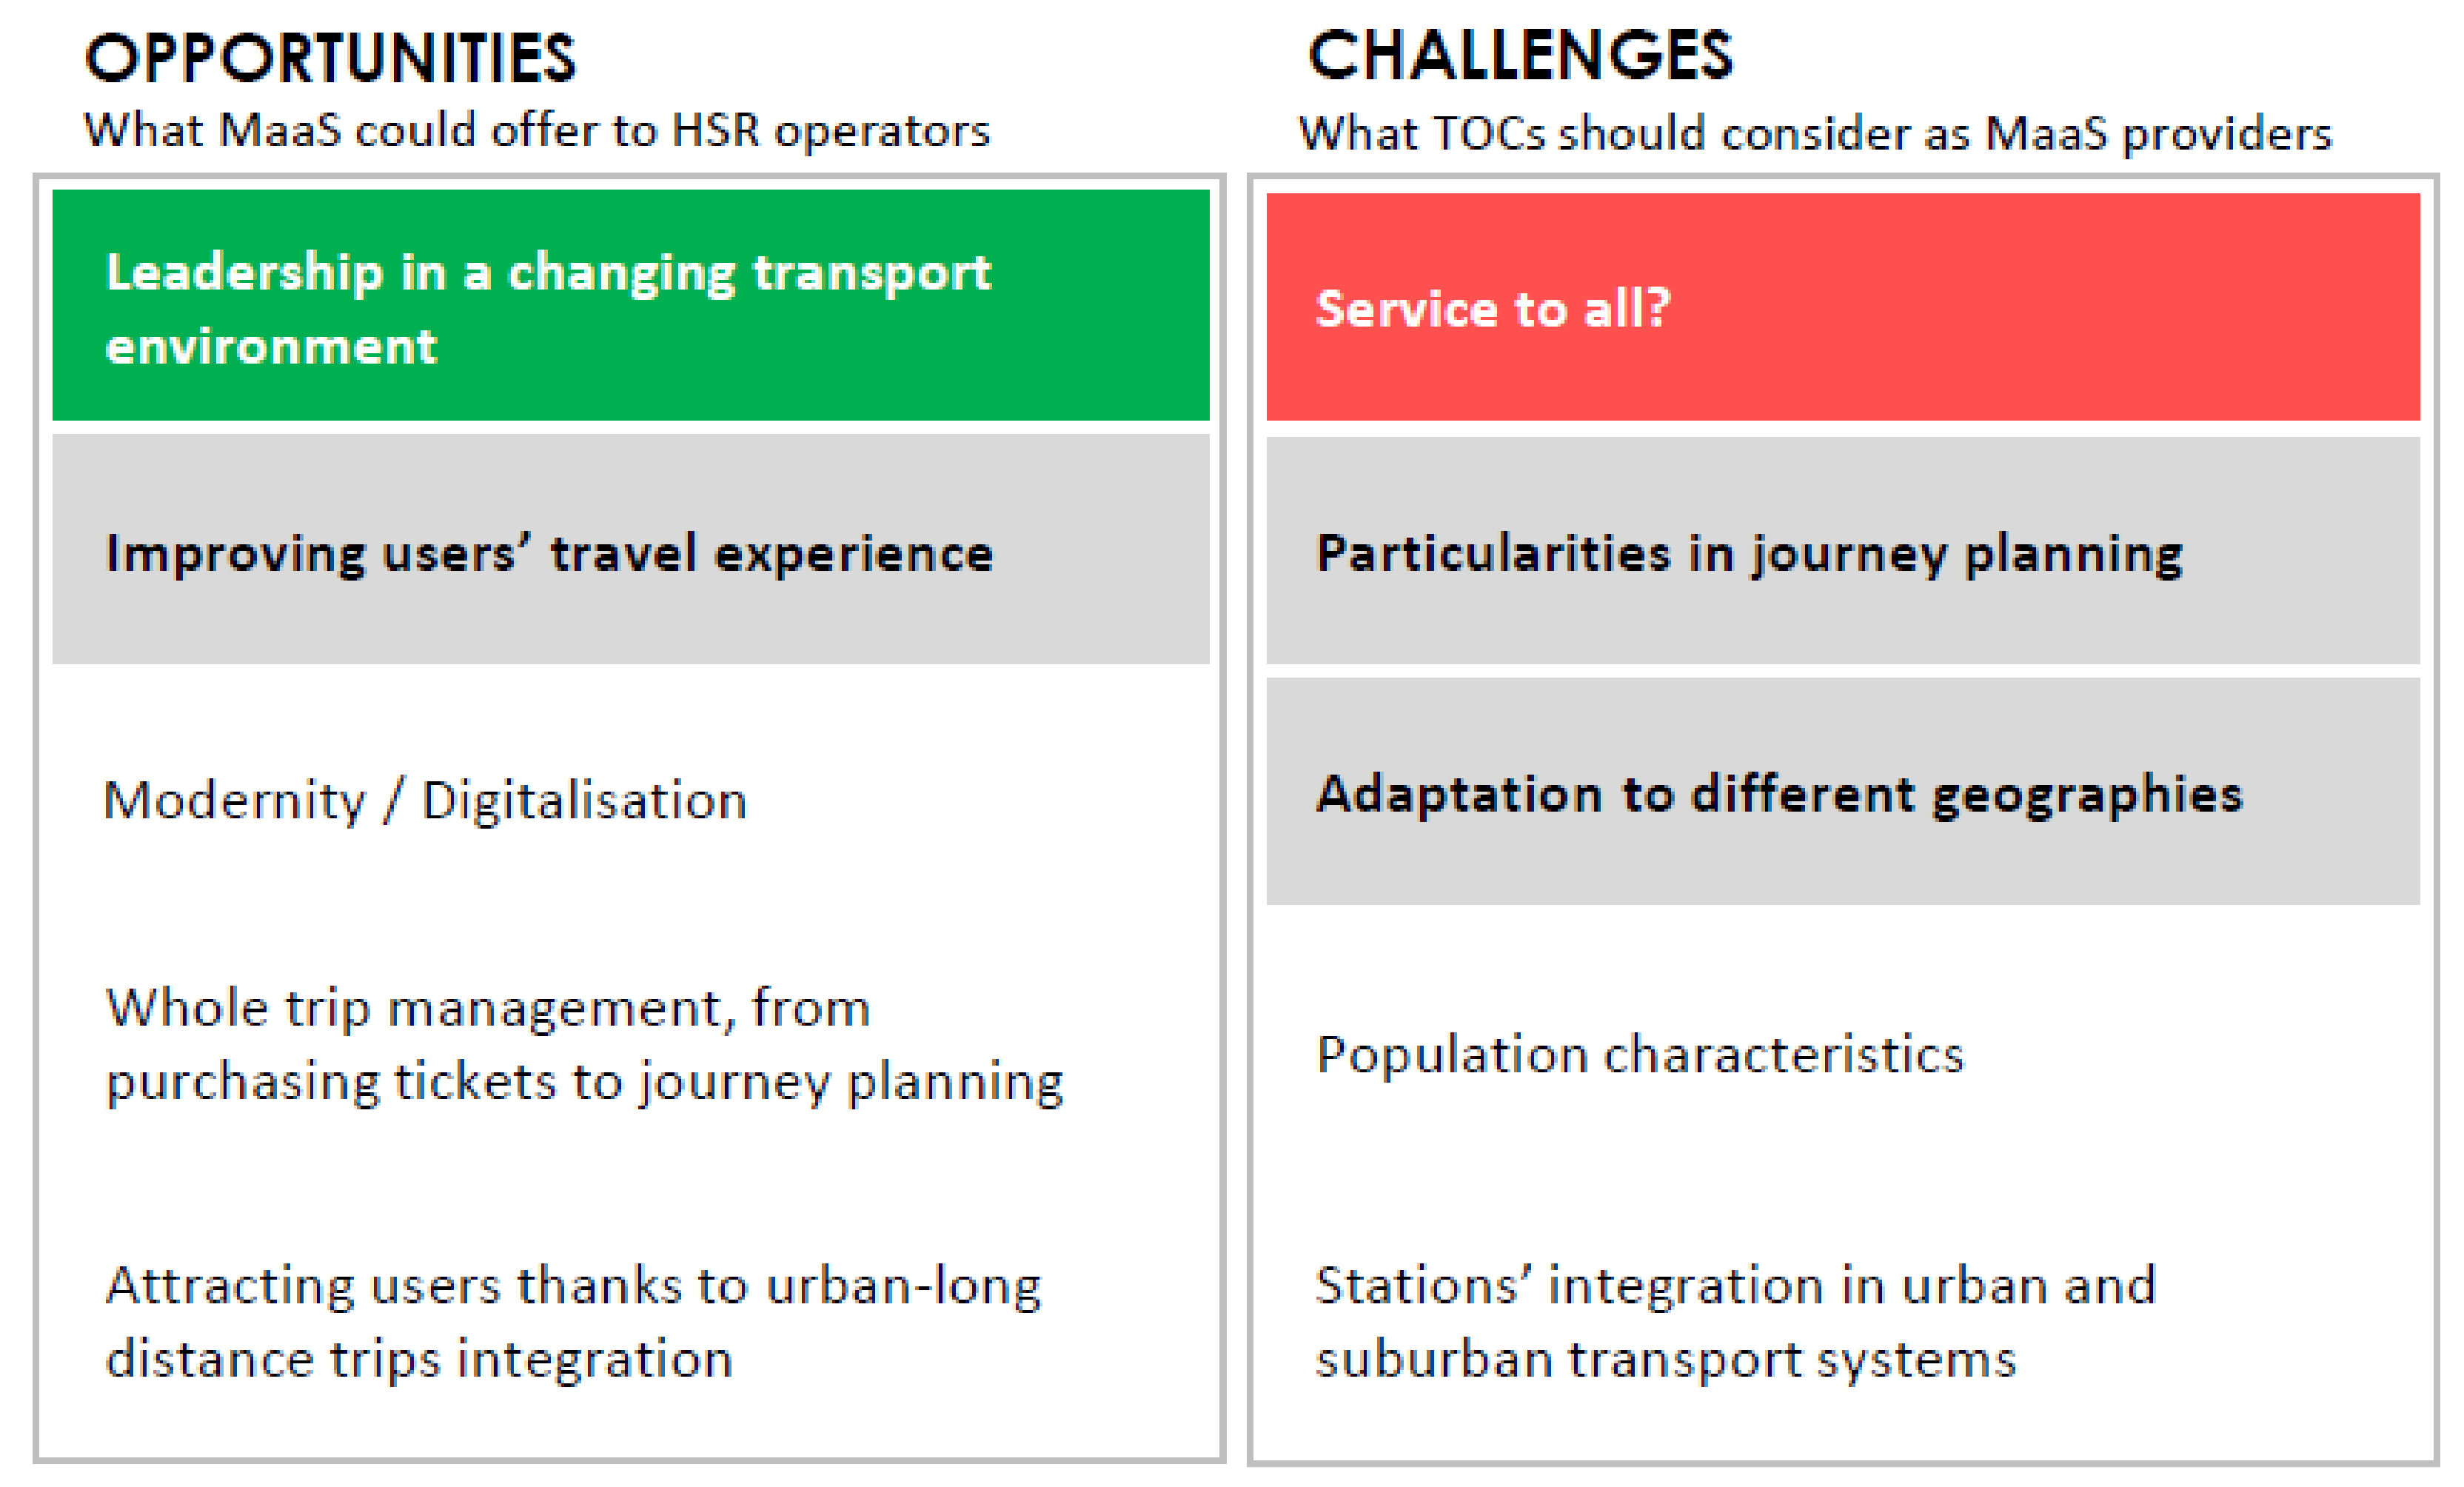
5. Opportunities and Challenges for HSR Operators as MaaS Providers
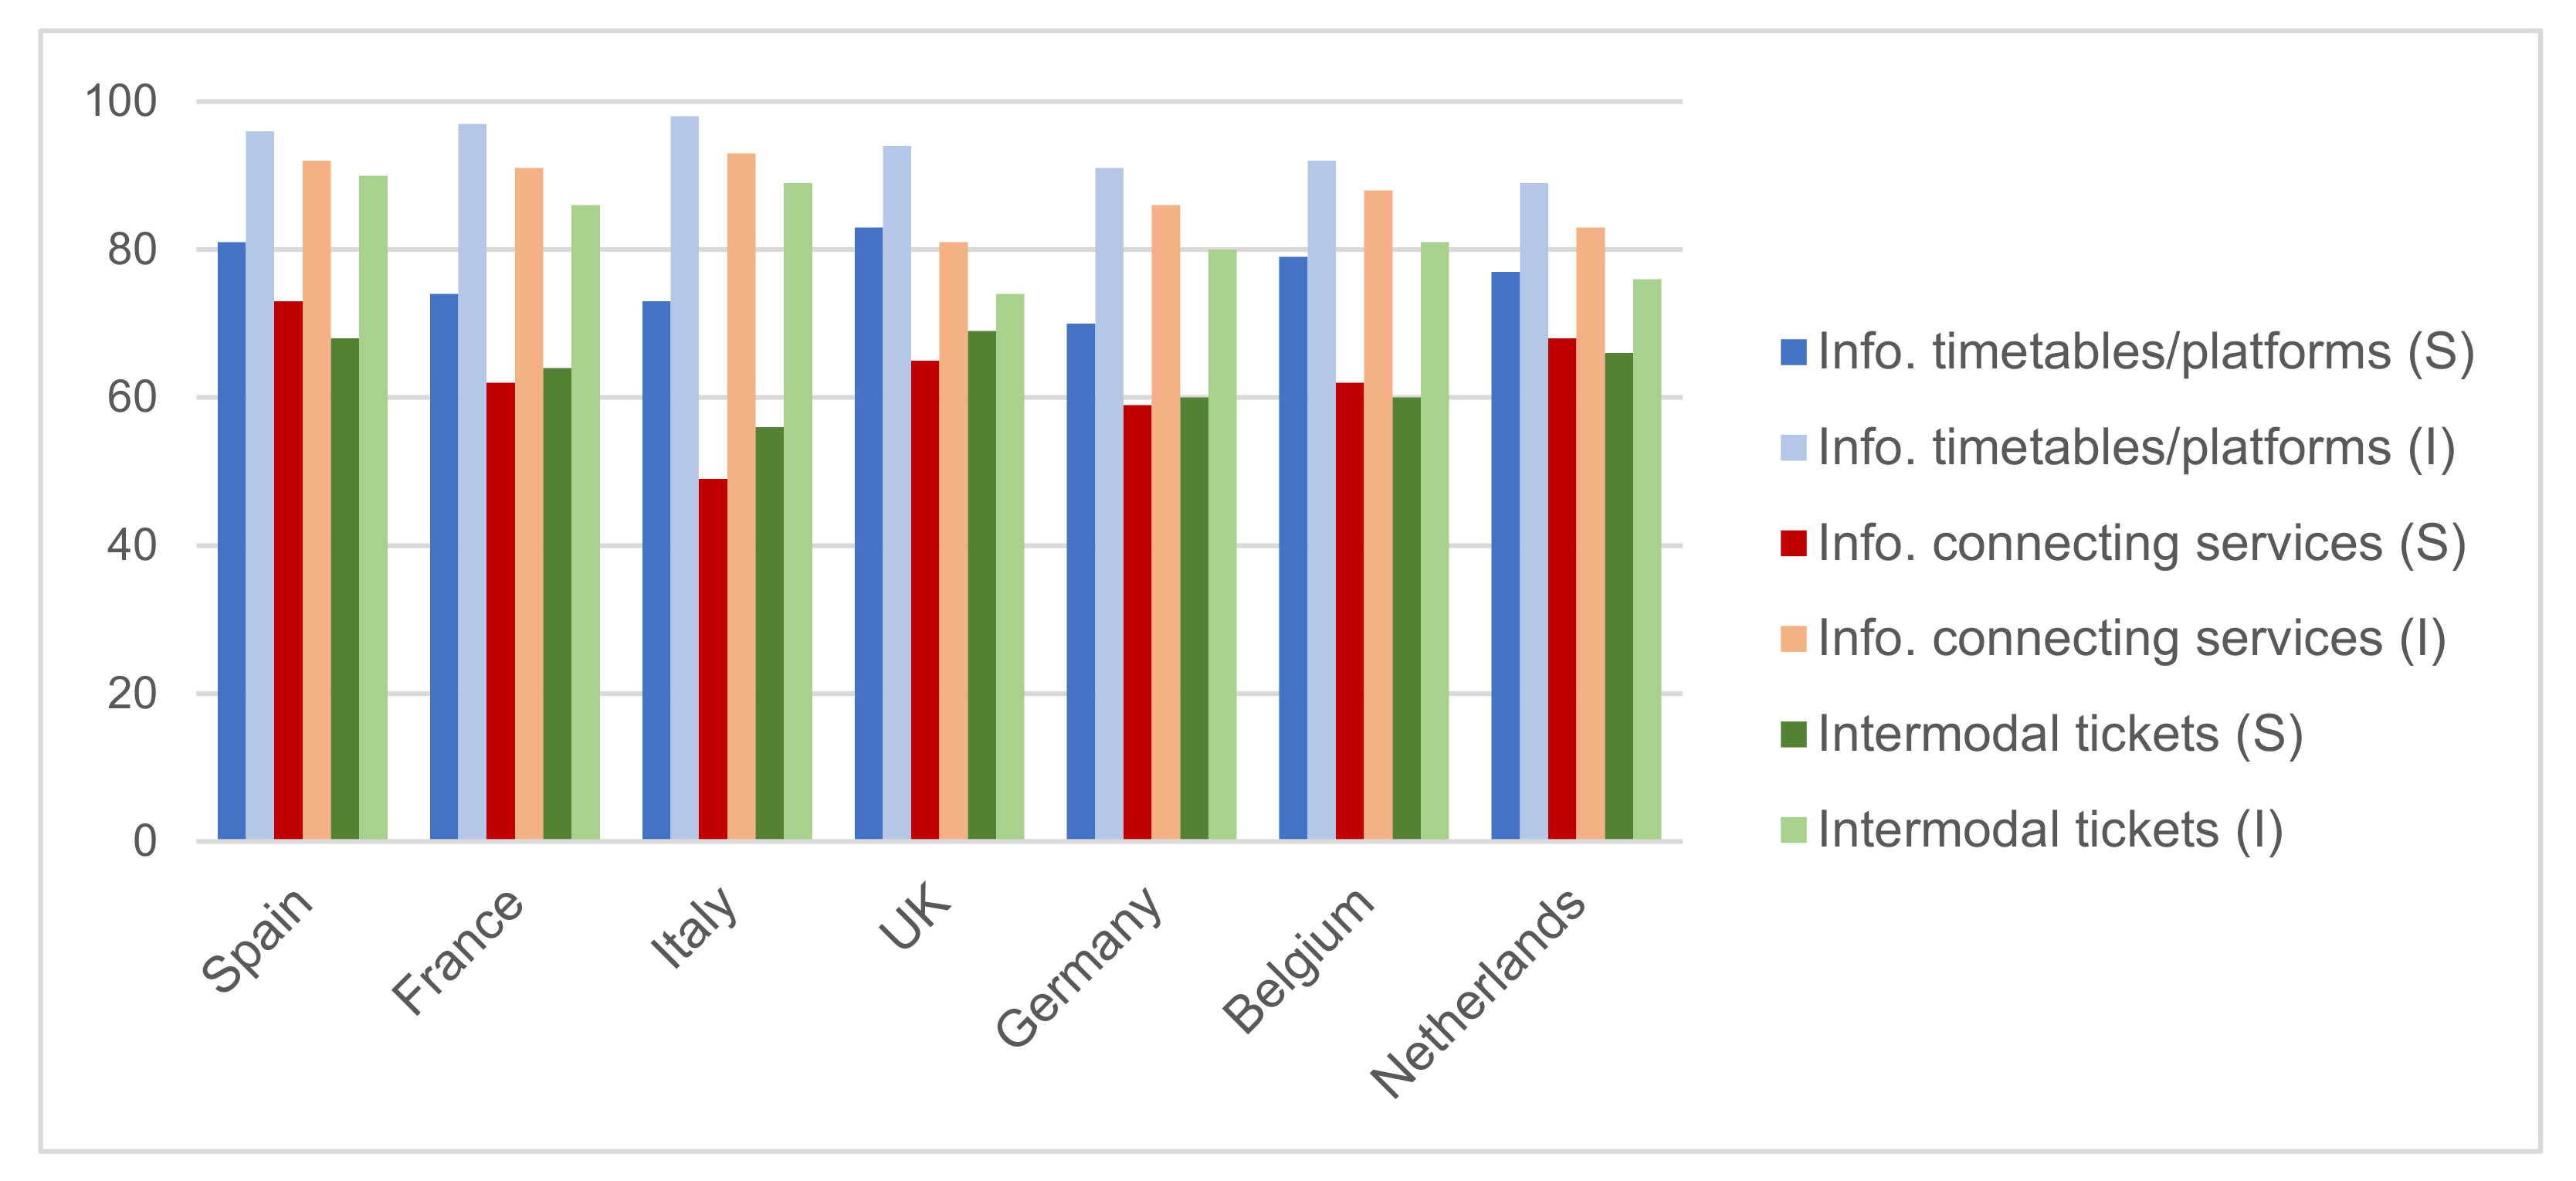
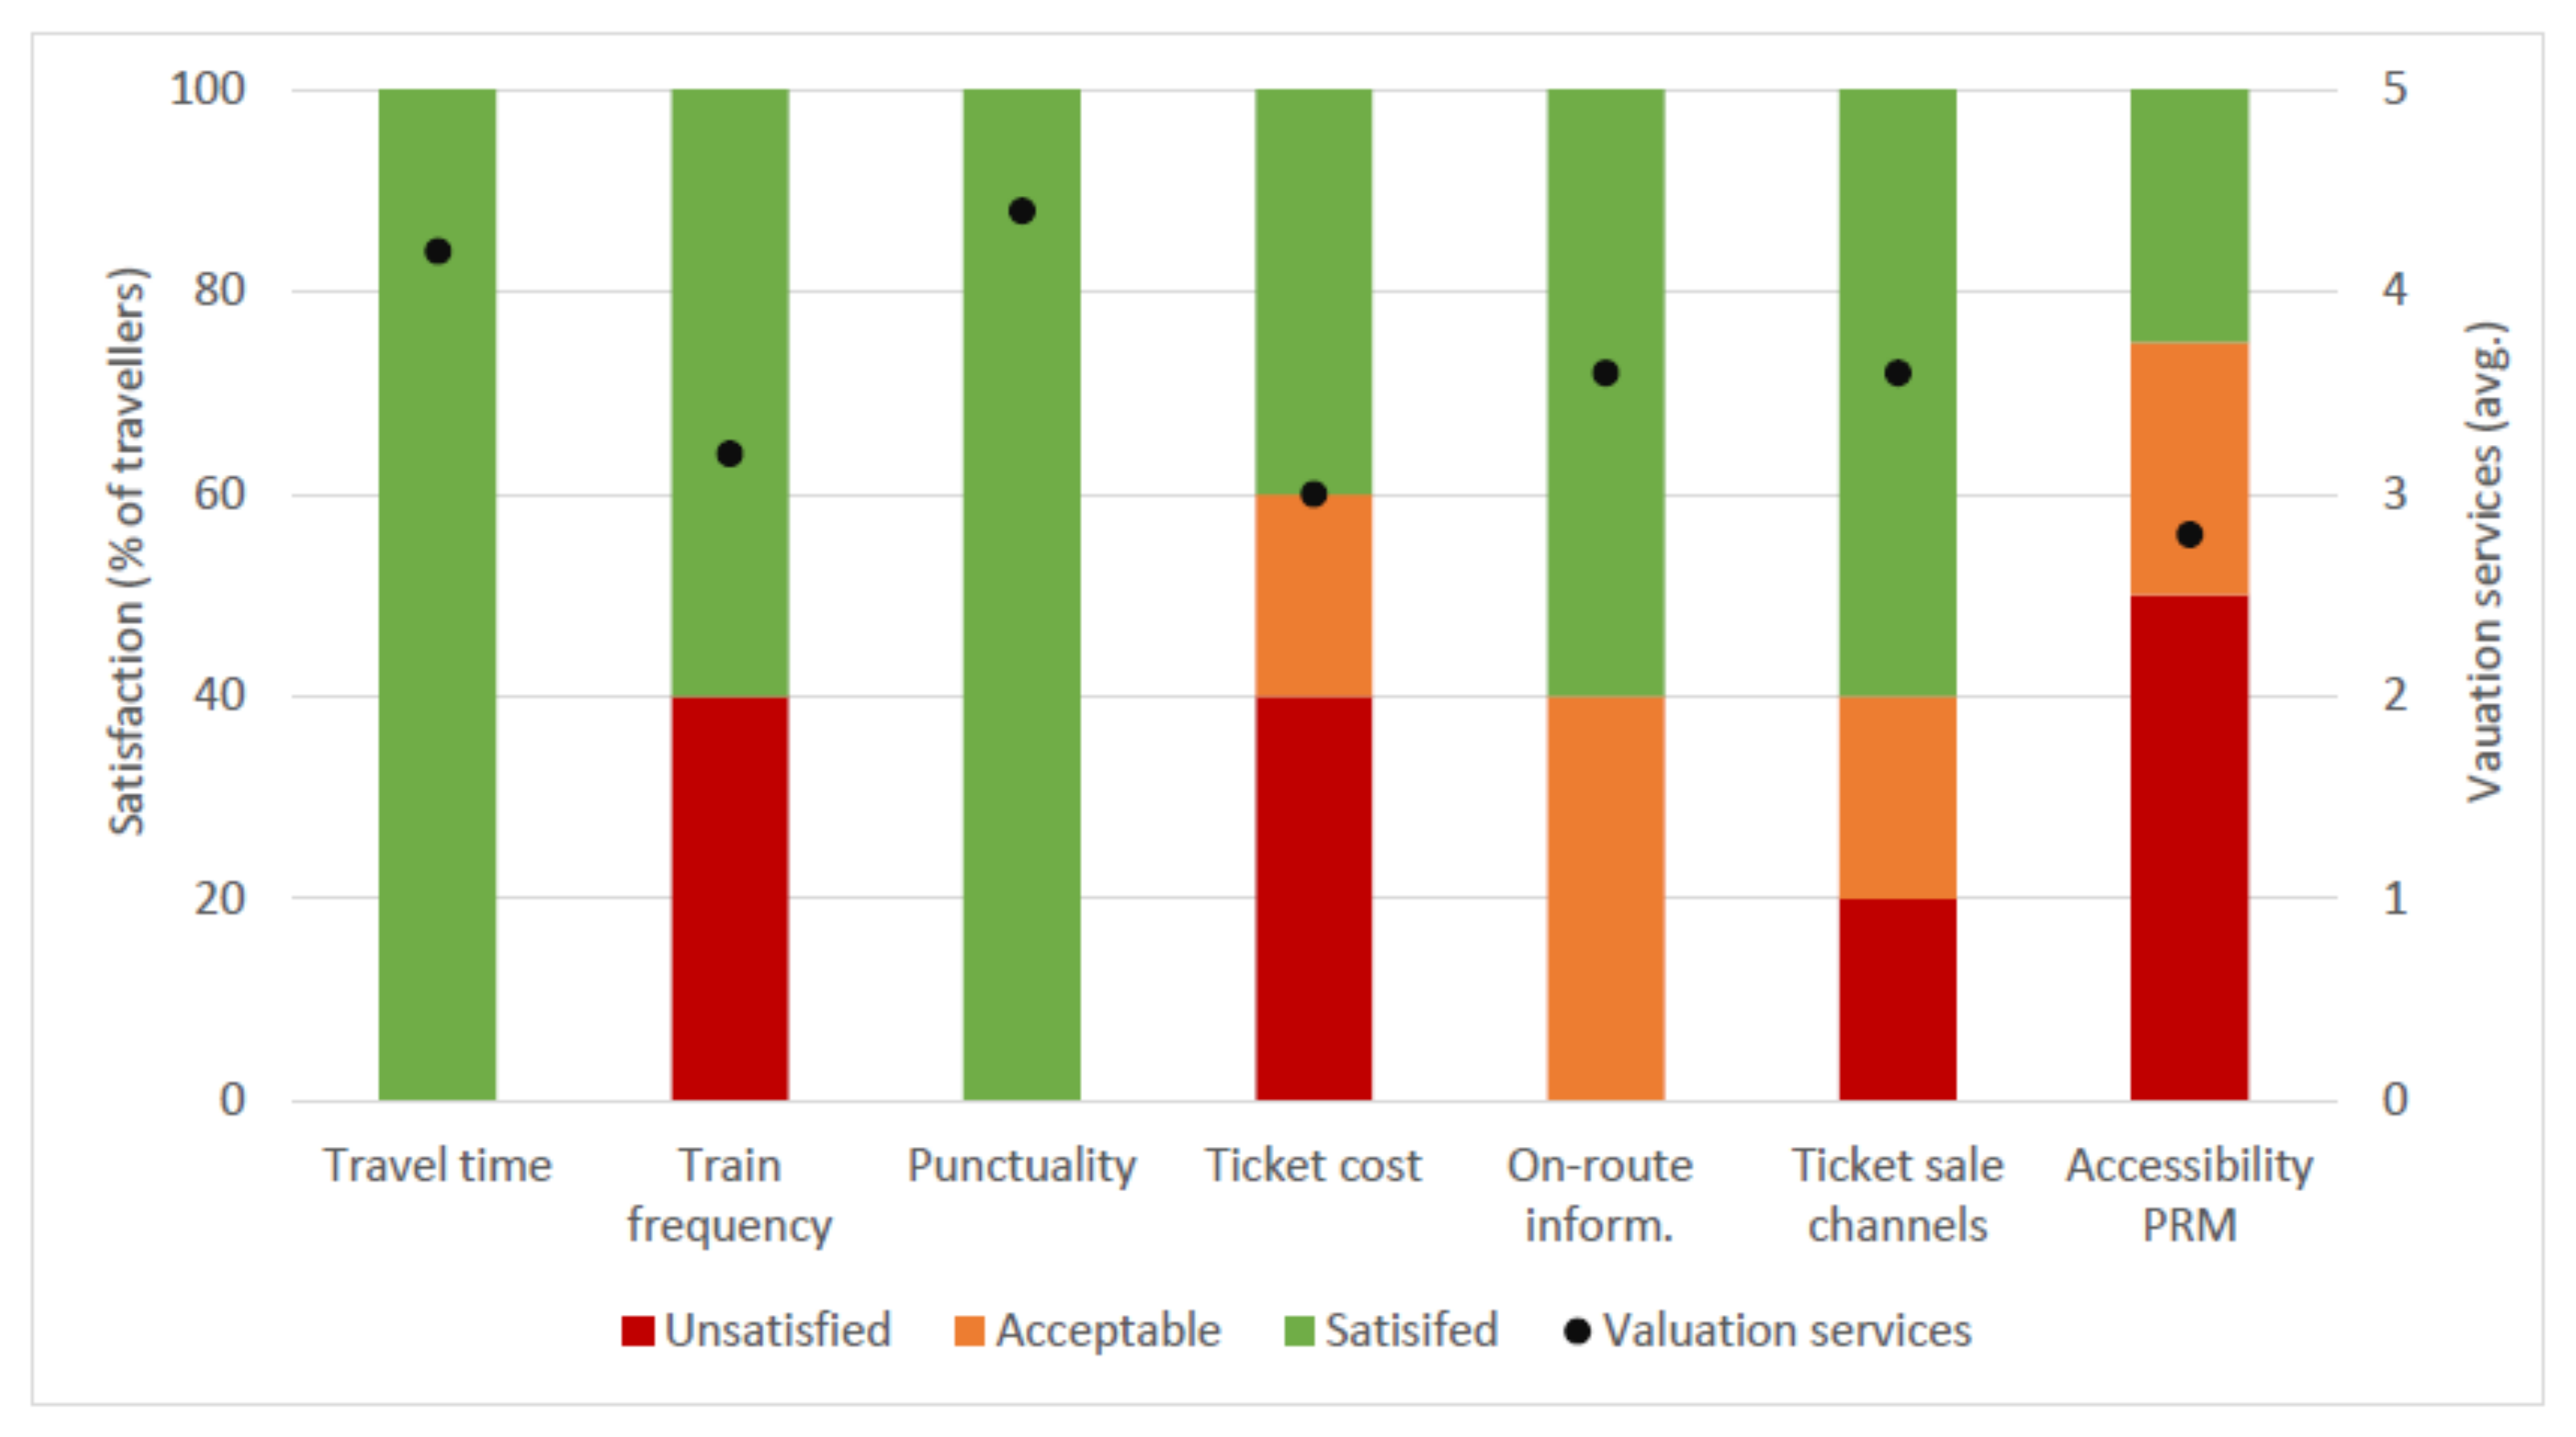
5.1. Opportunities: Improving Users’ Travel Experience
5.2. Challenges: Journey Planning Needs and Adaptation to Different Geographies
5.2.1. Travel Behaviour and Journey Planning
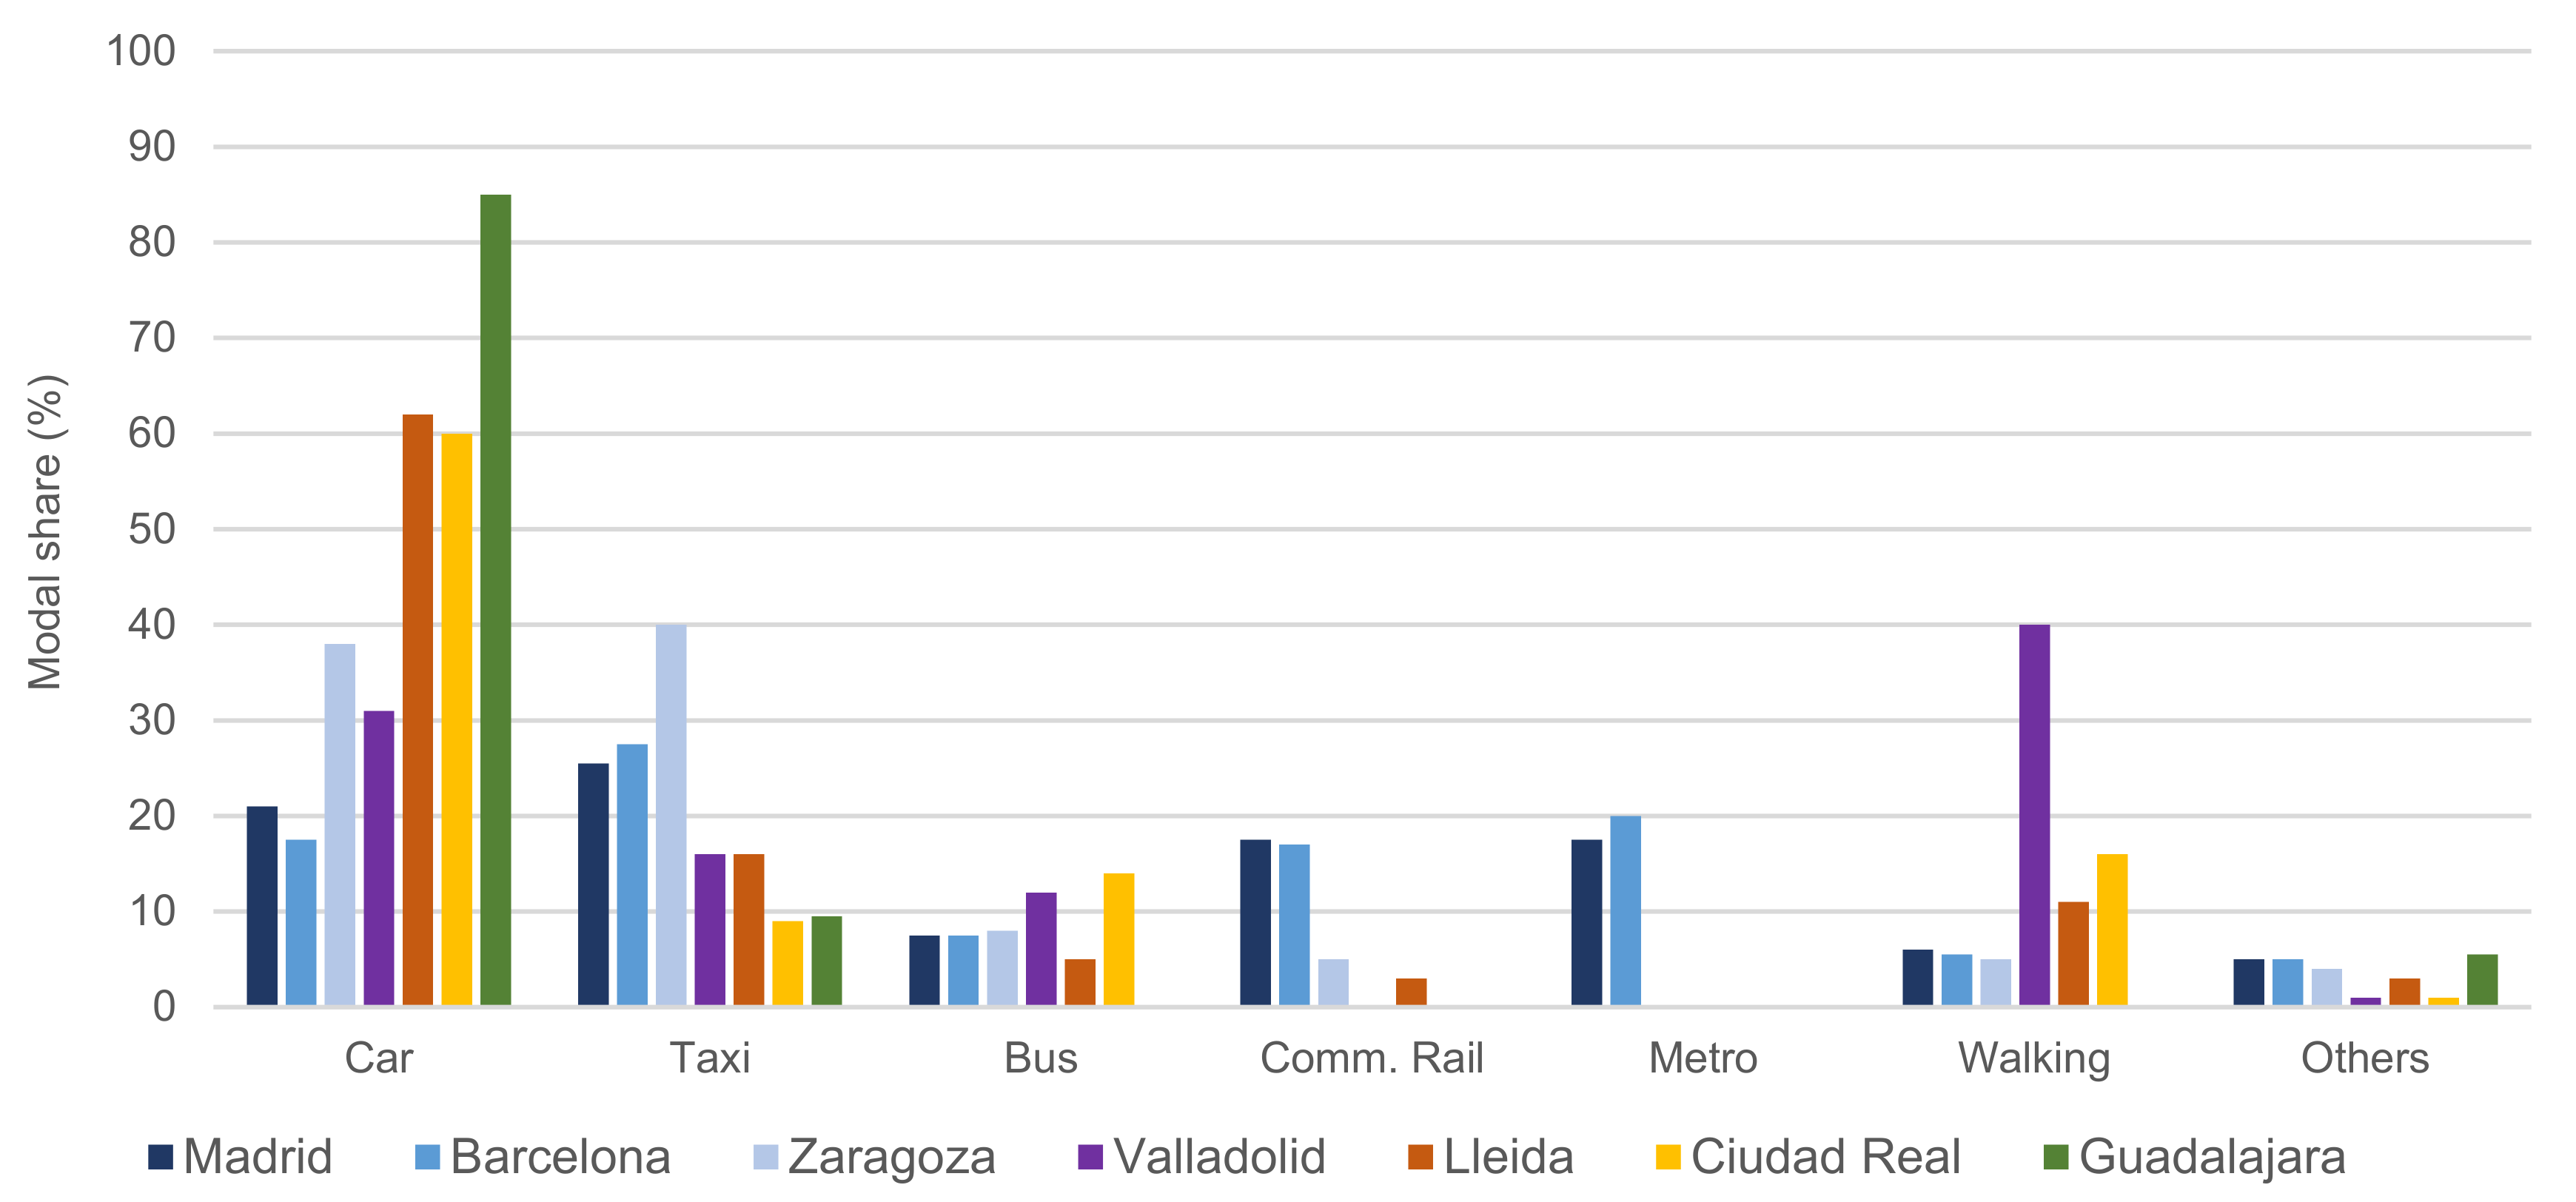
5.2.2. Urban Geographies: From Big Metropolitan Areas to Small, Rural Cities
- Socioeconomic characteristics of the stations’ catchment areas
- Local/regional transport systems
- Station integration in local/regional transport systems
6. Discussion
7. Conclusions
Author Contributions
Funding
Institutional Review Board Statement
Informed Consent Statement
Conflicts of Interest
References
- Arias-Molinares, D.; García-Palomares, J.C. The Ws of MaaS: Understanding Mobility as a Service Fromaliterature Review. IATSS Res. 2020, 44, 253–263. [Google Scholar] [CrossRef]
- Yen, B.T.H.; Mulley, C.; Tseng, W.-C.; Chiou, Y.-C. Assessing Interchange Effects in Public Transport: A Case Study of South East Queensland, Australia. Case Stud. Transp. Policy 2018, 6, 364–375. [Google Scholar] [CrossRef]
- Hernandez, S.; Monzon, A. Key Factors for Defining an Efficient Urban Transport Interchange: Users’ Perceptions. Cities 2016, 50, 158–167. [Google Scholar] [CrossRef]
- Lois, D.; Monzón, A.; Hernández, S. Analysis of Satisfaction Factors at Urban Transport Interchanges: Measuring Travellers’ Attitudes to Information, Security and Waiting. Transp. Policy 2018, 67, 49–56. [Google Scholar] [CrossRef]
- Delaplace, M.; Dobruszkes, F. From Low-Cost Airlines to Low-Cost High-Speed Rail? The French Case. Transp. Policy 2015, 38, 73–85. [Google Scholar] [CrossRef]
- Moyano, A.; Coronado, J.M. Typology of High-Speed Rail City-to-City Links. In Proceedings of the Institution of Civil Engineers—Transport; ICE Publishing: London, UK, 2018; Volume 171, pp. 264–274. [Google Scholar] [CrossRef]
- Esztergár-Kiss, D.; Kerényi, T.; Mátrai, T.; Aba, A. Exploring the MaaS Market with Systematic Analysis. Eur. Transp. Res. Rev. 2020, 12, 67. [Google Scholar] [CrossRef]
- Wong, Y.Z.; Hensher, D.A.; Mulley, C. Mobility as a Service (MaaS): Charting a Future Context. Transp. Res. Part A Policy Pract. 2020, 131, 5–19. [Google Scholar] [CrossRef]
- Aapaoja, A.; Eckhardt, J.; Nykänen, L.; Sochor, J. MaaS Service Combinations for Different Geographical Areas. In Proceedings of the 24th World Congress on Intelligent Transportation System, Montréal, QC, Canada, 29 October–2 November 2017; pp. 1–11. [Google Scholar]
- Kriukelyte, E. New Challenges for Transport Planning: The Institutionalization of Mobility as a Service in Stockholm Region. Ph.D. Thesis, School of Architecture and the Built Environment, Stockholm, Sweden, 2018. [Google Scholar]
- Kamargianni, M.; Li, W.; Matyas, M.; Schäfer, A. A Critical Review of New Mobility Services for Urban Transport. Transp. Res. Procedia 2016, 14, 3294–3303. [Google Scholar] [CrossRef]
- Smith, G.; Hensher, D.A. Towards a Framework for Mobility-as-a-Service Policies. Transp. Policy 2020, 89, 54–65. [Google Scholar] [CrossRef]
- Li, Y.; Voege, T. Mobility as a Service (MaaS): Challenges of Implementation and Policy Required. J. Transp. Technol. 2017, 07, 95–106. [Google Scholar] [CrossRef]
- Jittrapirom, P.; Marchau, V.; van der Heijden, R.; Meurs, H. Dynamic Adaptive Policymaking for Implementing Mobility-as-a Service (MaaS). Res. Transp. Bus. Manag. 2018, 27, 46–55. [Google Scholar] [CrossRef]
- Wright, S.; Nelson, J.D.; Cottrill, C.D. MaaS for the Suburban Market: Incorporating Carpooling in the Mix. Transp. Res. Part A Policy Pract. 2020, 131, 206–218. [Google Scholar] [CrossRef]
- Chang, S.K.J.; Chen, H.Y.; Chen, H.C. Mobility as a Service Policy Planning, Deployments and Trials in Taiwan. IATSS Res. 2019, 43, 210–218. [Google Scholar] [CrossRef]
- Smith, G.; Sochor, J.; Karlsson, I.C.M.A. Mobility as a Service: Development Scenarios and Implications for Public Transport. Res. Transp. Econ. 2018, 69, 592–599. [Google Scholar] [CrossRef]
- Karlsson, I.C.M.; Mukhtar-Landgren, D.; Smith, G.; Koglin, T.; Kronsell, A.; Lund, E.; Sarasini, S.; Sochor, J. Development and Implementation of Mobility-as-a-Service—A Qualitative Study of Barriers and Enabling Factors. Transp. Res. Part A Policy Pract. 2020, 131, 283–295. [Google Scholar] [CrossRef]
- Merkert, R.; Bushell, J.; Beck, M.J. Collaboration as a Service (CaaS) to Fully Integrate Public Transportation—Lessons from Long Distance Travel to Reimagine Mobility as a Service. Transp. Res. Part A Policy Pract. 2020, 131, 267–282. [Google Scholar] [CrossRef]
- Vij, A.; Ryan, S.; Sampson, S.; Harris, S. Consumer Preferences for Mobility-as-a-Service (MaaS) in Australia. Transp. Res. Part C Emerg. Technol. 2020, 117, 102699. [Google Scholar] [CrossRef]
- Lopez-Carreiro, I.; Monzon, A.; Lois, D.; Lopez-Lambas, M.E. Are Travellers Willing to Adopt MaaS? Exploring Attitudinal and Personality Factors in the Case of Madrid, Spain. Travel. Behav. Soc. 2021, 25, 246–261. [Google Scholar] [CrossRef]
- Giesecke, R.; Surakka, T.; Hakonen, M. Conceptualising Mobility as a Service. In Proceedings of the 2016 11th International Conference on Ecological Vehicles and Renewable Energies, EVER 2016, Monte Carlo, Monaco, 6–8 April 2016. [Google Scholar]
- Barreto, L.; Amaral, A.; Baltazar, S. Mobility as a Service (MaaS) in Rural Regions: An Overview. In Proceedings of the 2018 International Conference on Intelligent Systems (IS), IEEE, Funchal-Madeira, Portugal, 25–27 September 2018; pp. 856–860. [Google Scholar]
- European Commission Report. Europeans’ Satisfaction with Passenger Rail Services. Flash Eurobarometer 463 – TNS Political & Social; European Commission Report: Brussels, Belgium, 2018. [Google Scholar] [CrossRef]
- CNMC, Comisión Nacional de los Mercados Y Valores. Acuerdo por el que se emite informe relativo a la consulta a los representantes de los usuarios sobre su punto de vista del mercado ferroviario (2019). INF/DTSP/007/19. Available online: https://www.cnmc.es/expedientes/infdtsp00719 (accessed on 20 October 2022).
- Lyons, G.; Hammond, P.; Mackay, K. The Importance of User Perspective in the Evolution of MaaS. Transp. Res. Part A Policy Pract. 2019, 121, 22–36. [Google Scholar] [CrossRef]
- Moyano, A.; Coronado, J.M.; Garmendia, M. How to Choose the Most Efficient Transport Mode for Weekend Tourism Journeys: An HSR and Private Vehicle Comparison. Open Transp. J. 2016, 10, 84–96. [Google Scholar] [CrossRef]
- Moyano, A.; Rivas, A.; Coronado, J.M. Business and Tourism High-Speed Rail Same-Day Trips: Factors Influencing the Efficiency of High-Speed Rail Links for Spanish Cities. Eur. Plan. Stud. 2019, 27, 533–554. [Google Scholar] [CrossRef]
- Sun, Y.; Jiang, Z.; Gu, J.; Zhou, M.; Li, Y.; Zhang, L. Analyzing High Speed Rail Passengers’ Train Choices Based on New Online Booking Data in China. Transp. Res. Part C Emerg. Technol. 2018, 97, 96–113. [Google Scholar] [CrossRef]
- Xie, H.; Song, X.; Zhang, H. MaaS and IoT: Concepts, Methodologies, and Applications. In Big Data and Mobility as a Service; Elsevier: Amsterdam, The Netherlands, 2022; pp. 229–243. [Google Scholar]
- Cheng, Y.H.; Huang, T.Y. High Speed Rail Passenger Segmentation and Ticketing Channel Preference. Transp. Res. Part A Policy Pract. 2014, 66, 127–143. [Google Scholar] [CrossRef]
- INE, Instituto Nacional de Estadística. Encuesta sobre Equipamiento y Uso de Tecnologías de Información y Comunicación en los Hogares, 2021; Instituto Nacional de Estadística – INE: Madrid, Spain, 2021. [Google Scholar]
- Burckhart, K.; Martí-Henneberg, J.; Tapiador, F.J. Cambio de Hábitos y Transformaciones Territoriales En Los Corredores de Alta Velocidad Ferroviaria. Resultados de Una Encuesta de Viajeros En La Línea Madrid-Barcelona. Scripta Nova 2008, 12, 1–13. [Google Scholar]
- Cano, B. Áreas de Influencia Generadas Por Estaciones de Alta Velocidad. Parámetros Que Determinan Sus Características. Master’s Thesis, Universidad de Castilla La Mancha, Ciudad Real, Spain, 2011. [Google Scholar]
- Moyano, A.; Moya-gómez, B.; Gutiérrez, J. Access and Egress Times to High-Speed Rail Stations: A Spatiotemporal Accessibility Analysis. J. Transp. Geogr. 2018, 73, 84–93. [Google Scholar] [CrossRef]


| Group (Inhab.) | Cities | ID | Population | Station Location |
|---|---|---|---|---|
| Less than 100,000 | Tardienta | TAR | 952 | Edge |
| Puebla de Sanabria | PUE | 1409 | Edge | |
| Calatayud | CAL | 20,035 | Central | |
| Requena | REQ | 20,227 | Peripherical | |
| Medina del Campo | MED | 20,583 | Peripherical | |
| Puente-Genil | PTE | 30,241 | Peripherical | |
| Villena | VILL | 33,983 | Peripherical | |
| Antequera | ANT | 41,154 | Peripherical | |
| Figueres | FIG | 46,381 | Edge | |
| Puertollano | PTO | 47,881 | Central | |
| Segovia | SEG | 51,258 | Peripherical | |
| Huesca | HUE | 53,429 | Central | |
| Cuenca | CUE | 53,988 | Peripherical | |
| Zamora | ZAM | 60,297 | Edge | |
| Ciudad Real | CR | 75,104 | Edge | |
| Palencia | PAL | 77,090 | Central | |
| Toledo | TO | 85,449 | Edge | |
| Guadalajara | GUA | 87,064 | Peripherical | |
| Santiago de Compostela | SAN | 96,405 | Edge | |
| 100,000–200,000 | Girona | GIR | 101,932 | Central |
| Ourense | OUR | 104,596 | Central | |
| Tarragona | TAR | 113,129 | Peripherical | |
| León | LEO | 122,051 | Edge | |
| Lleida | LLE | 140,080 | Central | |
| Castellón | CAS | 172,589 | Edge | |
| Albacete | ALB | 172,722 | Edge | |
| 200,000–400,000 | Granada | GRA | 231,775 | Central |
| A Coruña | CORU | 245,468 | Central | |
| Valladolid | VLL | 297,775 | Central | |
| Córdoba | COR | 322,071 | Central | |
| Alicante | ALI | 337,304 | Central | |
| 400,000–1,000,000 | Málaga | MAL | 577,405 | Central |
| Zaragoza | ZAR | 675,301 | Central | |
| Sevilla | SEV | 684,234 | Central | |
| Valencia | VAL | 789,744 | Central | |
| More than 1,000,000 | Barcelona | BCN | 1,636,732 | Central |
| Madrid (Atocha and Chamartín stations) | MAD, MAD2 | 3,305,408 | Central |
| MaaS Keyword | Urban Rail * | High-Speed Rail |
|---|---|---|
| Journey planning | At the moment | Time in advance |
| Real time | Very important. Traffic congestion, overcrowded systems, delays, accidents, etc. | Less important, mainly for incidents or delays. |
| Service frequencies | High | Low |
| Type of service and ticketing | Homogenous service supply | Multiple kinds of services, adapted to different users and trip purposes |
| Pricing | Fixed | Dynamic pricing system (For long-distance HSR services. Regional HSR presents a static pricing system) depending on the time in advance of purchase. |
| Population | Dwellings | ||||||
|---|---|---|---|---|---|---|---|
| Cities Group | Total (Inhab.) | >64 Years Old (%) | No Studies (%) | Income (€) | Residential (%) | Avg Density (dw/ha) | Internet (%) |
| Less than 100,000 inhab. | 41,072 | 17.8 | 8.9 | 12,216 | 27.2 | 8.9 | 37.8 |
| 100,000–200,000 inhab. | 132,168 | 15.7 | 6.6 | 12,919 | 66.4 | 18.1 | 44.5 |
| 200,000–400,000 inhab. | 294,669 | 18.4 | 7.4 | 12,757 | 73.6 | 31.5 | 45.3 |
| 400,000–1,000,000 inhab. | 658,414 | 17.5 | 7.1 | 12,789 | 83.2 | 53.3 | 49.6 |
| More than 1,000,000 inhab. | 1,307,567 | 20.2 | 6.0 | 18,065 | 93.4 | 92.6 | 54.6 |
| Population | Dwellings | ||||||
|---|---|---|---|---|---|---|---|
| Cities Group | Total (Inhab.) | >64 Years Old (%) | No Studies (%) | Income (€) | Residential (%) | Avg Density (dw/ha) | Internet (%) |
| Less than 100,000 inhab. | 112,740 | 21.1 | 12.1 | 11,286 | 11.0 | 2.8 | 29.5 |
| 100,000–200,000 inhab. | 217,429 | 19.5 | 9.4 | 12,005 | 26.3 | 2.0 | 31.7 |
| 200,000–400,000 inhab. | 298,706 | 14.5 | 9.7 | 11,017 | 26.0 | 3.7 | 36.7 |
| 400,000–1,000,000 inhab. | 649,308 | 12.7 | 8.4 | 11,314 | 20.7 | 6.4 | 44.3 |
| More than 1,000,000 inhab. | 3,315,250 | 13.5 | 7.5 | 14,018 | 42.6 | 18.7 | 59.3 |
| Collective Public Transport | Shared Mobility | ||||||||
|---|---|---|---|---|---|---|---|---|---|
| Cities Group (Inhab.) | Interurban Bus | Conventional Rail | Urban Bus | Commuting Rail | Metro | Bicycle | Scooter | Motorcycle | Car |
| Less than 100,000 | 100 | 71 | 88 | 0 | 0 | 0 | 0 | 0 | 0 |
| 100,000–200,000 | 100 | 100 | 100 | 0 | 0 | 14 | 14 | 0 | 0 |
| 200,000–400,000 | 100 | 100 | 100 | 20 | 20 | 80 | 0 | 20 | 40 |
| 400,000–1,000,000 | 100 | 100 | 100 | 100 | 75 | 100 | 75 | 75 | 50 |
| More than 1,000,000 | 100 | 100 | 100 | 100 | 100 | 100 | 100 | 100 | 100 |
| Station Location | |||
|---|---|---|---|
| Cities Group (Inhab.) | Central (%) | Edge (%) | Peripheral (%) |
| Less than 100,000 | 4 (21.1) | 7 (36.8) | 8 (42.1) |
| 100,000–200,000 | 3 (42.9) | 3 (42.9) | 1 (14.2) |
| 200,000–400,000 | 5 (100.0) | 0 (0.0) | 0 (0.0) |
| 400,000–1,000,000 | 4 (100.0) | 0 (0.0) | 0 (0.0) |
| More than 1,000,000 | 3 (100.0) | 0 (0.0) | 0 (0.0) |
Disclaimer/Publisher’s Note: The statements, opinions and data contained in all publications are solely those of the individual author(s) and contributor(s) and not of MDPI and/or the editor(s). MDPI and/or the editor(s) disclaim responsibility for any injury to people or property resulting from any ideas, methods, instructions or products referred to in the content. |
© 2023 by the authors. Licensee MDPI, Basel, Switzerland. This article is an open access article distributed under the terms and conditions of the Creative Commons Attribution (CC BY) license (https://creativecommons.org/licenses/by/4.0/).
Share and Cite
Moyano, A.; Tejero-Beteta, C.; Sánchez-Cambronero, S. Mobility-as-a-Service (MaaS) and High-Speed Rail Operators: Do Not Let the Train Pass! Sustainability 2023, 15, 8474. https://doi.org/10.3390/su15118474
Moyano A, Tejero-Beteta C, Sánchez-Cambronero S. Mobility-as-a-Service (MaaS) and High-Speed Rail Operators: Do Not Let the Train Pass! Sustainability. 2023; 15(11):8474. https://doi.org/10.3390/su15118474
Chicago/Turabian StyleMoyano, Amparo, Carlos Tejero-Beteta, and Santos Sánchez-Cambronero. 2023. "Mobility-as-a-Service (MaaS) and High-Speed Rail Operators: Do Not Let the Train Pass!" Sustainability 15, no. 11: 8474. https://doi.org/10.3390/su15118474
APA StyleMoyano, A., Tejero-Beteta, C., & Sánchez-Cambronero, S. (2023). Mobility-as-a-Service (MaaS) and High-Speed Rail Operators: Do Not Let the Train Pass! Sustainability, 15(11), 8474. https://doi.org/10.3390/su15118474