Abstract
The shear mechanical properties of rock under high temperature and high pressure are key issues in geothermal energy development. In order to explore the variation in shear mechanical properties of rock under high temperature and high pressure, the shear experiments of granite under real-time temperatures and normal stresses were carried out using the servo-controlled true triaxial experimental system for rock shearing testing and acoustic emission technology. The results show the following trends: (1) the peak shear strength of granite increases slightly first and then decreases sharply with real-time temperature, with 200 °C considered as the threshold temperature for the peak shear strength of granite. When the temperature is constant, the shear strength of granite increases linearly with the increase in normal stress. (2) Before 200 °C, the shear modulus of granite decreases slowly with the increase in temperature and decreases rapidly after 200 °C. The shear modulus always increases linearly with the increase in normal stress. (3) Under the coupling effect of real-time high temperature and normal stress, the cumulative acoustic emission energy released during the shear deformation of granite gradually decreases with temperature, and the main failure mode of granite gradually changes from tensile failure to shear failure.
1. Introduction
Traditional fossil fuel-based energy is non-renewable and its combustion will bring serious environmental pollution problems, which are not conducive to the sustainable development strategy of energy and the requirements of environmental protection regulations. As a clean, green, and sustainable new energy, geothermal energy has gradually become an important research direction for renewable energy [1]. The essence of geothermal energy exploitation is heat exchange, and the mining technology mainly digs injection wells and outlet wells to reach the high-temperature stratum, as well as building artificial flow reservoirs in the stratum between the two wells. To ensure the stability of the wellbore, it is necessary to enhance the stability of the rock under high temperature. The construction of an artificial flow storage layer needs to reduce the strength of the rock under high temperature [2]. Therefore, the development of geothermal energy must fully study the mechanical properties of rock under real-time high temperature. Relevant scholars previously carried out mechanical experiments on heat-treated rock samples, exploring the influence of temperature on rock mechanical properties [3,4,5,6].
Liu et al. [7] conducted compression experiments on heat-treated granite and found that the compressive strength of granite decreased with temperature; however, compressive strength increased slightly at 100 °C, and 600 °C was the critical temperature for the brittle–ductile transition of stress–strain curve. Yao et al. [8] conducted triaxial compression experiments on heat-treated marble samples and found that the thermal effect enhanced the ductility of rock, while the crack initiation stress decreased with temperature, i.e., the higher the temperature, the easier it was for the rock to crack. Yang et al. [9,10] found that the crack damage threshold, strength, and elastic modulus gradually increased before 300 °C and rapidly decreased after 300 °C through conducting uniaxial compression experiments on heat-treated granite, i.e., 300 °C was the threshold temperature for strength of granite and the growth rate of cumulative acoustic emission count curve decreased with temperature. Miao et al. [11] conducted three-point bending tests on heat-treated granite and found that the peak strength decreased linearly, the crack initiation stress decreased gradually with the increase in temperature, and thermal-induced microcracks were the essential cause of the change in the fracture behavior of granite. He et al. [12] conducted variable angle shear tests on heat-treated granite specimens and found that the peak shear stress and the cohesion decreased, whereas the frictional angle increased with temperature; 500–600 °C was the critical temperature range for mechanical properties and acoustic emission characteristics of granite.
The cooling process of rock after high temperature treatment will affect the mechanical properties of rock. Different cooling methods and cooling rates will cause different degrees of deterioration of the mechanical properties of the rock [13,14,15,16,17].
Some scholars conducted comparative studies of the mechanical properties of rocks under real-time high-temperature and after heat treatment, finding that there were some differences between the two outcomes. Zhang et al. [18] carried out uniaxial compression experiments and found that the uniaxial compressive strength and elastic modulus of rock continuously deteriorated with real-time temperature increases, while for the heat-treated specimens, though the peak strength did not change much before the threshold temperature, it decreased suddenly after the threshold temperature. Yin et al. [19] found that the critical temperature of brittle–ductile transition and the peak stress was lower for granite under real-time high temperature in uniaxial compression experiments; there was also a significant difference in the failure mode, which was shear failure under real-time high temperature and cleavage failure for heat-treated specimens. Luo et al. [20] conducted uniaxial compression experiments on granite specimens and found that the degradation of the mechanical properties of the heat-treated specimens was lower than that of the specimens under real-time high temperature before 400 °C; after 400 °C, the degradation of mechanical properties of the heat-treated specimens was greater than that of the specimens under real-time high temperature.
Most of the above studies only carried out uniaxial compression experiments on rock samples, and subsequent scholars have successively carried out various forms of rock mechanics experiments under real-time high temperature [21,22,23,24,25]. Zhao et al. [26,27] carried out triaxial compression experiments on granite under 20 MN confining pressure in the range of room temperature to 600 °C using the servo-controlled triaxial compression experimental system under high temperature and high pressure, which found that the thermal cracking of granite was intermittent and multi-stage, while the thermal deformation coefficient had a large difference compared to unconstrained conditions. Ma et al. [28] investigated the effect of temperature on the mechanical properties of granite using a true triaxial test system under real-time high-temperature and found that the toughness enhancement of black mica particles at high temperature was the reason for the existence of the threshold temperature in the mechanical properties of granite, and the temperature mainly affected the cohesion of granite.
The above-mentioned studies paid less attention to shear failure of granite at real-time high temperature, despite shear failure being an important form of rock failure and compression-shear failure being an important factor affecting the safety of rock engineering.
Based on this issue, this research uses the servo-controlled true triaxial experimental system for rock shearing testing under real-time high temperature and high pressure and the acoustic emission (AE) technique to study the evolution of macroscopic mechanical properties, AE characteristics and surface morphology of shear failure plane of granite under real-time high temperature, providing corresponding theoretical support for the development and utilization of deep ground resources.
2. Materials and Methods
2.1. Samples
The granite used in this study was quarried from Rizhao City, Shandong Province, China. In this experiment, all samples were taken from the same homogeneous granite block and processed into 50 mm × 50 mm × 50 mm cubes. The specimens were processed in strict accordance with the international standards recommended for rock mechanics experiments to ensure that the flatness met the experimental requirements. The specimens were tested at 25 °C, 100 °C, 200 °C, 300 °C, and 400 °C with normal stresses of 10 MPa, 20 MPa, 30 MPa, and 40 MPa, respectively. Five specimens were tested at each temperature and pressure, and the results were averaged to reduce the influence of specimen dispersion on the experimental results. Figure 1 shows the schematic diagram of the granite shear test and the images of some specimens used in the test.
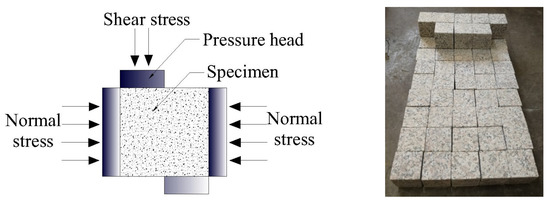
Figure 1.
Schematic diagram of granite shear experiment and image of specimens.
2.2. Experimental Device
The self-developed servo-controlled true triaxial experiment system for rock shearing testing under real-time high temperature and high pressure (Figure 2) mainly consisted of five parts: (1) data acquisition system; (2) frequency conversion temperature control system; (3) servo-controlled rock mechanics experimental system; (4) electrical heating system; (5) cooling circulation system. The experimental machine can carry out triaxial compression, shear, and seepage coupling experiments for rock under real-time high temperature and high pressure. Utilizing this experimental device, granite was sheared under real-time temperature.
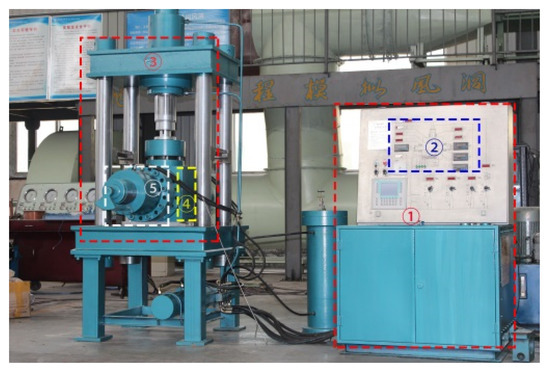
Figure 2.
True triaxial testing system of high temperature and high pressure.
A SSEU2S full-information AE measuring system was used to record AE counts, which was composed of signal receiving probe, signal processor, and display device. The probe was placed inside the loading chamber of the testing machine, whereas the external signal processing system and display device were connected. The specific AE detection diagram is shown in Figure 3.
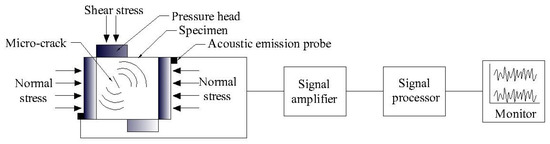
Figure 3.
Schematic diagram of acoustic emission equipment.
2.3. Test Procedures
The servo-controlled true triaxial experiment system for rock shearing testing under real-time high temperature and high pressure used in this experiment ensured that the performance of the tester itself was not affected while heating the specimens with external cooling circulation system. Detailed steps are outlined here for measuring:
(1) Installing the specimen into the pressure chamber after measuring its size; (2) fixing the normal stress to the pre-determined value (10 MPa, 20 MPa, 30 MPa, 40 MPa); (3) connecting the AE instrument and tapping the surface of specimen to ensure that the equipment is functioning properly; (4) keeping the normal stress constant and using the automatic heating mode with a heating rate of approximately 1 °C/min; (5) when the setting temperature points (25 °C, 100 °C, 200 °C, 300 °C, 400 °C) are reached, keeping each temperature point constant for 2 h to ensure that the specimens are uniformly heated inside; (6) keeping the temperature unchanged, the shear test is carried out on the sample. A constant axial displacement rate of 0.05 mm/min is applied to the granite specimen to apply the shear stress. Continuous monitoring of AE output is performed during shear deformation; (7) repeating the above experimental steps until all the granite shear experiments under pre-set temperature and normal stress are completed.
3. Results and Discussion
3.1. Shear Stress-Displacement Curve Characteristics of Granite
Figure 4 shows the shear stress–shear displacement curves of granite specimens under real-time high temperature and different normal stresses. It can be seen that the curves at various temperatures under different normal stresses are basically similar. Figure 4a is the shear stress-displacement curves of granite under different temperatures when the normal stress is 10 MPa. Taking the shear stress-displacement curve of granite at 25 °C as an example, it can be seen that the curve can be divided into five stages: compaction section (OA), elastic section (AB), plastic section (BC), shear failure section (CD), and residual deformation section (DE).
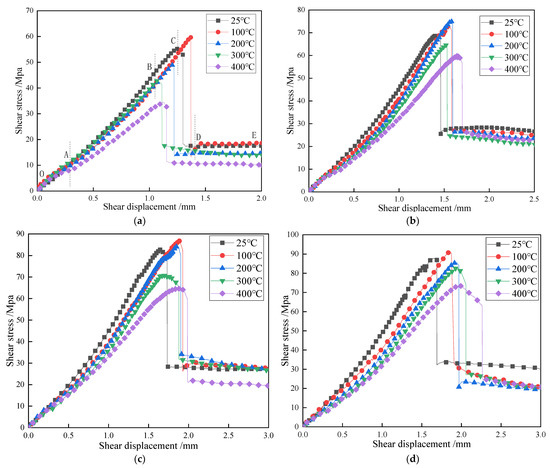
Figure 4.
Shear stress-displacement curves of granite under various temperatures and different normal stresses: (a) σ = 10 MPa; (b) σ = 20 MPa; (c) σ = 30 MPa; (d) σ = 40 MPa.
The initial stage of the shear stress-displacement curve of the granite specimen at real-time temperature is the compaction section (OA). At this stage, the original micro-cracks inside the sample are closed under external load, and the shear stress-displacement curve is slightly concave. The higher the temperature, the more obvious the stage. After the compaction stage, it enters the linear elastic deformation stage (AB). The shear stress-displacement curve is approximately a straight line, and the shear modulus remains unchanged. This stage constitutes the main part of the shear stress-displacement curve. The increase in temperature does not change the linear characteristics of this stage, though it does reduce the slope. With the increase in shear deformation, the shear stress-displacement curve of granite enters the non-linear deformation stage (BC), i.e., the yield stage, in which the curve is slightly convex and the shear modulus of the sample decreases gradually with the increase in displacement; however, this stage is not obvious at low temperatures. After that, the specimen reaches the peak strength and enters the shear failure stage (CD). The granite specimen is rapidly broken into two parts, with this process being accompanied by severe noise. After the shear failure, the shear slip continues under the action of shear stress, and the shear stress-displacement curve enters the residual deformation stage (DE). According to Figure 4, the peak displacement of granite specimens is relatively dispersed with temperature, and the peak stress initially increases and then decreases with temperature. The shear modulus gradually decreases with temperature, while the residual strength has no significant correlation with temperature.
Comparing (a) to (d) in Figure 4, it can be seen that in this experiment, the variability in the stage of initial non-linear deformation of the curves is very small with the increase in temperature when the normal stress is certain; the non-linear characteristic of the OA segment decreases gradually with the increase in normal stress when the temperature is certain. The reason for this result is that, in this experiment, a constant normal stress is initially applied to the specimens, and then the specimen is heated slowly, which produces less thermal rupture in the specimens compared to the free heating of the rock specimens during heat treatment. The higher the normal stress, the lower the number of thermogenic microcracks inside the rock.
Before 200 °C, the granite shear stress-displacement curve is mainly observed in the linear elastic stage (AB) before the peak stress, there is almost no plastic deformation section (BC), and the failure mode is brittle and sudden instability. When the temperature exceeds 300 °C, the granite slowly softens, the compaction section (OA) in the shear stress-displacement curve gradually becomes more obvious; the linear elastic deformation stage (AB) gradually decreases; the plastic deformation section (BC) gradually increases; the failure mode of granite starts to change from brittle to ductile, with local failure occurring in the plastic stage; and the shear failure section (CD) changes to progressive instability.
3.2. The Variation Characteristics of Shear Strength of Granite
3.2.1. Variation in Granite Shear Strength with Temperature
Figure 5 shows the evolution of peak shear strength (τ) with temperature under different normal stresses affecting the granite specimens. The peak shear strength of granite initially increases slightly and then decreases rapidly with the increase in temperature, which can be roughly divided into two stages: in the range 25–200 °C, the peak shear strength of granite increases slightly compared to that at 25 °C, while the overall change range is small. In the range 200–400 °C, the peak shear strength of granite decreases rapidly compared to that recorded at 200 °C.
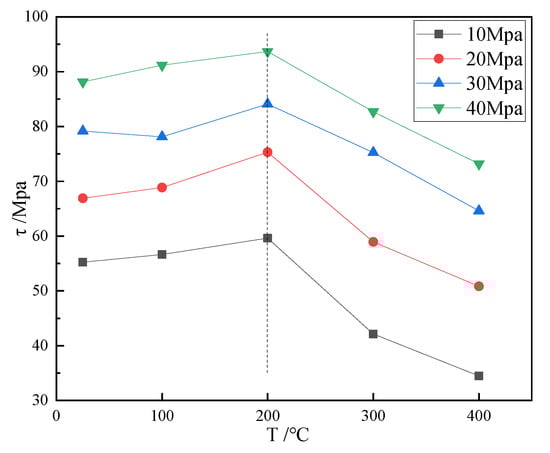
Figure 5.
Variation curve of shear strength of granite with temperature under different normal stresses.
At 25 °C, when the normal stress is 10–40 MPa, the shear strength values of granite are 55.24 MPa, 66.91 MPa, 79.17 MPa, or 88.14 MPa respectively; at 200 °C, compared to 25 °C, when the normal stress is 10–40 MPa, the shear strength values of granite become 107.96%, 112.54%, 106.21%, or 108.55% of the original values, respectively, and the maximum changing range is 12.54%. At 400 °C, when the normal stress is 10–40 MPa, compared to 200 °C, the shear strength values of granite are 62.42%, 75.98%, 81.59% or 83.03% of the original values, respectively, and the maximum changing range is 37.58%. Increasing the normal stress can inhibit the deterioration of mechanical properties of granite based on temperature.
Typically, 200 °C is considered as the threshold temperature for the peak shear strength of granite. This assumption can be explained in the following way: in the range 25–200 °C, the water inside the granite sample is heated and evaporated, and the thermal expansion of the mineral crystal with the increase in temperature compresses the volume of the original pores and cracks inside the sample. However, granite’s thermal expansion is too small to cause boundary cracks or transgranular cracks between mineral components, which makes the sample stronger at 200 °C [29]. When the temperature increases from 200 to 400 °C, the thermal expansion deformation of granite gradually increases. The mineral crystal grains inside the rock produce non-uniform expansion due to different thermal conductivity and thermal elastic modulus. Thermal stress leads to cracks along the boundary of mineral composition and transgranular cracks, which leads to a decrease in the bond strength and material stiffness of the specimen, resulting in the decrease in shear strength.
Zhao et al. [27] analyzed the meso-structure of granite samples under different temperatures through CT scanning, finding that before 200 °C, only a few discontinuous microcracks were generated around the crystal particles inside the granite. After 200 °C, the microcracks in granite began to expand and generate new cracks, finally forming a closed crack around the crystal particles or producing a transgranular fracture, which was consistent with the results obtained in this experiment.
Under the coupling effect of real-time temperature and stress, the peak shear strength of granite changes non-linearly with temperature. Therefore, in the construction of artificial storage layer in the geothermal energy development, a larger fracturing stress should be applied in the low temperature area than that in the normal temperature area, while in the high temperature area, lower fracturing stress is needed. Reasonable use of the variation law of rock strength at different temperatures can better reduce costs.
3.2.2. Variation in Granite Shear Strength with Normal Stress
The variation curves of granite shear strength with normal stress under different temperatures are shown in Figure 6. It can be seen from Figure 6 that when the temperature is 25 °C, the shear strength of granite increases linearly with the increase in normal stress, which is consistent with the results of other scholars [30]. When the temperature is 100–400 °C, the shear strength of granite is still approximately linearly positively correlated with the normal stress. It shows that the shear strength of granite increases linearly with the increase in normal stress in the range 25–400 °C, and the temperature does not change the relationship between normal stress and shear strength.
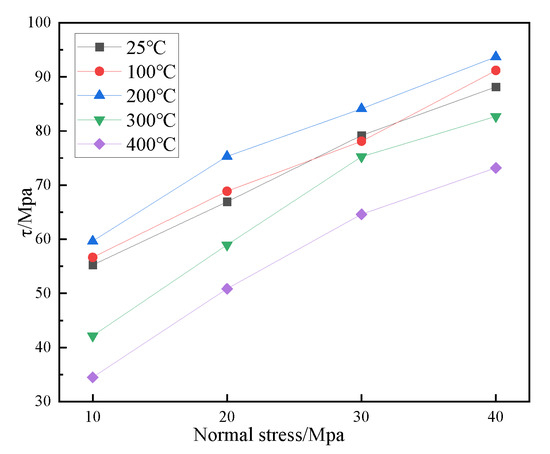
Figure 6.
Variation curves of shear strength of granite with normal stresses under different temperatures.
However, the degree of promotion of the normal stress on the granite shear strength is not the same at different temperatures. When the temperature is 25 °C, the granite shear strength is 55.24 MPa when the normal stress is 10 MPa, and when the normal stress is 20 MPa, 30 MPa, or 40 MPa, the granite shear strength increases by 21.13%, 43.32%, or 59.56%, respectively, compared to that of 10 MPa. When the temperature is 200 °C, the granite shear strength is 59.64 MPa when the normal stress is 10 MPa, and when the normal stress is 20 MPa, 30 MPa, or 40 MPa, the granite shear strength increases by 26.25%, 40.99%, or 57.08%, respectively, compared to that of 10 MPa. When the temperature increases to 400 °C, the granite shear strength is 34.48 MPa when the normal stress is 10 MPa, and when the normal stress is 20 MPa, 30 MPa, or 40 MPa, the granite shear strength increases by 47.45%, 87.36%, or 112.23%, respectively, compared to that of 10 MPa.
In general, there is an approximate linear positive correlation between normal stress and granite shear strength. When the temperature is higher than 200 °C, the higher the temperature, the more obvious the effect of normal stress on granite shear strength.
3.3. The Variation Characteristics of Shear Modulus of Granite with Temperature
3.3.1. Variation in Granite Shear Modulus with Temperature
Shear modulus is the ratio of shear stress to shear strain in the elastic deformation range of rock, which characterizes the ability of materials to resist shear strain. Figure 7 shows the variation curves of normalized shear modulus of granite with temperature, which is similar to the variation in peak shear strength with temperature. In general, with the increase in temperature, the shear modulus decreases gradually. The variation in shear modulus of granite with temperature obtained in this study is consistent with the conclusion of Zhao et al. [27].
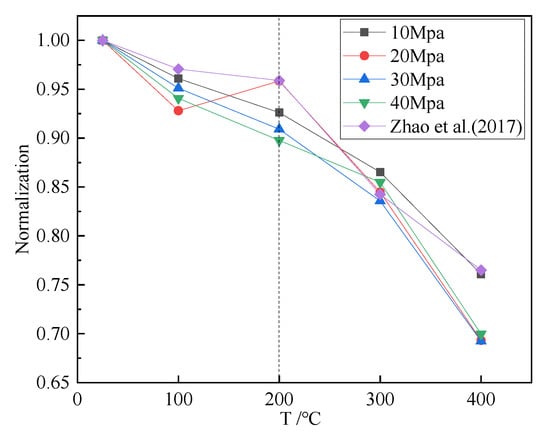
Figure 7.
Variation in shear modulus of granite with temperature under different normal stresses [27].
In the range 25–200 °C, the shear modulus of granite decreases slightly with the increase in temperature. Compared to 25 °C, when the normal stress is 10 MPa, 20 MPa, 30 MPa, or 40 MPa at 200 °C, the shear modulus of granite is reduced to 92.61%, 95.83%, 90.91%, or 89.77% of the original value, respectively, and the elastic modulus of granite in Zhao et al. [27] is reduced to 95.88% of the original value.
In the range 200–400 °C, the shear modulus of granite decreases sharply with the increase in temperature. Compared to 25 °C, when the normal stress is 10 MPa, 20 MPa, 30 MPa, or 40 MPa at 400 °C, the shear modulus of granite is reduced to 76.09%, 69.32%, 69.23%, or 69.96% of the original, respectively, and the elastic modulus of granite in Zhao et al. [27] is reduced to 76.51% of the original.
The shear modulus reflects the ability of granite to resist shear deformation, which is mainly determined based on the strength of cementing material between mineral particles and the degree of interaction between mineral particles. With the increase in temperature, the cementation between mineral crystal particles in granite gradually weakens; thus, the shear modulus decreases with the increase in temperature. Before 200 °C, the water inside the granite sample is heated and evaporated; thus, the pore structure inside the rock increases slightly. At the same time, the mineral crystal particles are heated to produce volume expansion, resulting in local stress concentration inside the rock, which, in turn, results in a very small number of intracrystalline cracks in some mineral crystals. The boundary of different minerals initiates a small number of intergranular cracks with small openings, which slightly weakens the tightness of the combination between mineral particles, making the shear modulus decrease slightly with the increase in temperature [31,32]. After 200 °C, with the increase in thermal deformation, cracks are gradually generated at the boundary of mineral crystal particles in granite and slowly expand, resulting in transgranular cracks; thus, the cohesive force between mineral particles decreases rapidly, while the shear modulus decreases rapidly with the increase in temperature.
Under the coupling effect of real-time temperature and stress, the shear modulus of granite decreases rapidly after the threshold temperature. Therefore, in the design of wellbores in geothermal energy development, the influence of temperature on wellbore deformation must be considered. In particular, after the threshold temperature, accelerated creep may occur, resulting in wellbore collapse. According to the different temperatures in the stratum where the wellbore is located, the wellbore design margin should be appropriately increased to improve the cementing process and ensure wellbore stability.
3.3.2. Variation in Granite Shear Modulus with Normal Stress
The variation curves of granite shear modulus with normal stress under different temperature effects are shown in Figure 8. From Figure 8, it can be seen that when the temperature is 25 °C, the granite shear modulus increases linearly with normal stress, which is consistent with the results of other scholars [30]. When the temperature is 100–400 °C, the granite shear modulus is still approximately linear with normal stress. This result indicates that the granite shear modulus always increases linearly with normal stress in the range 25–400 °C. The temperature fails to change the trend of the normal stress-shear modulus relationship curve.
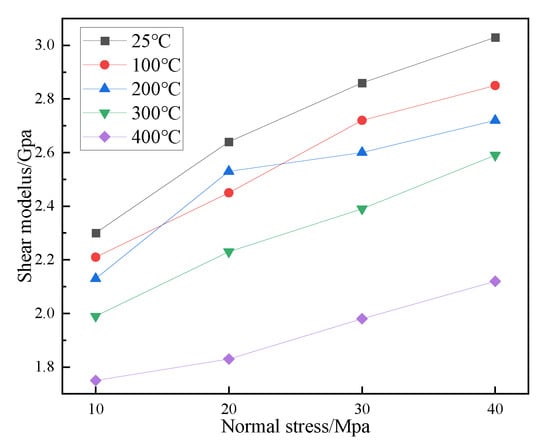
Figure 8.
Variation curves of shear modulus of granite with normal stresses under different temperatures.
At different temperatures, the effect of normal stress on the shear modulus of granite is quite similar. The granite shear modulus is 2.3 GPa when the normal stress is 10 MPa at 25 °C. When the normal stress is 20 MPa, 30 MPa, or 40 MPa, the granite shear modulus increases by 14.78%, 24.34%, or 31.74%, respectively, compared to that at 10 MPa. When the temperature is 200 °C, the granite shear modulus is 2.13 GPa at recorded 10 MPa. When the normal stress is 20 MPa, 30 MPa, or 40 MPa, the granite shear modulus increases by 18.78%, 22.07%, or 27.70%, respectively, compared to that at recorded 10 MPa. The granite shear modulus is 1.75 GPa when the normal stress is 10 MPa at 400 °C. When the normal stress is 20 MPa, 30 MPa or 40 MPa, the granite shear modulus increases by 4.57%, 13.14%, or 21.14%, respectively, compared to that recorded at 10 MPa.
In general, there is an approximate linear positive correlation between normal stress and shear modulus. Temperature does not change the trend of the relationship curve between normal stress and shear modulus. At the same time, the degree of promotion of normal stress on shear modulus of granite at different temperatures does not significantly differ.
3.4. Variation Characteristics of AE Energy of Granite with Temperature
The acoustic emission information reflects the elastic wave generated through the internal fracture during the deformation of brittle materials and is widely used in the study of evolution and spatial positioning of cracks during rock failure [33,34].
The characteristics of acoustic emission information in the shear process of granite at different normal stresses under various temperatures are roughly similar. Therefore, the change in acoustic emission information in the shear process of granite under 10 MPa normal stress is taken as an example for detailed analysis. Figure 9 shows the curves of the shear stress, AE energy, and accumulated AE energy of granite specimens with time at 10 MPa normal stress under real-time temperature. Before the shear failure of granite specimens, the AE energy-time curve can be obviously divided into quiet and active periods, and the active period can be further divided into stable and accelerated periods according to the number of AE events and the cumulative growth rate of AE energy.
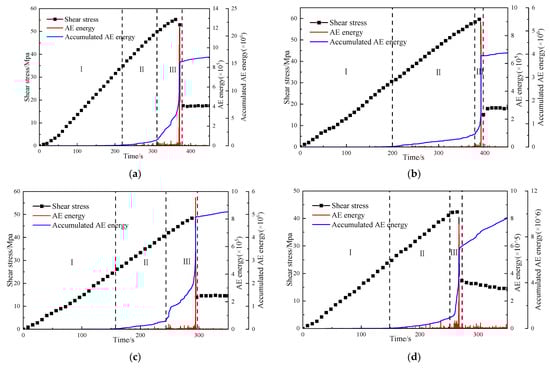
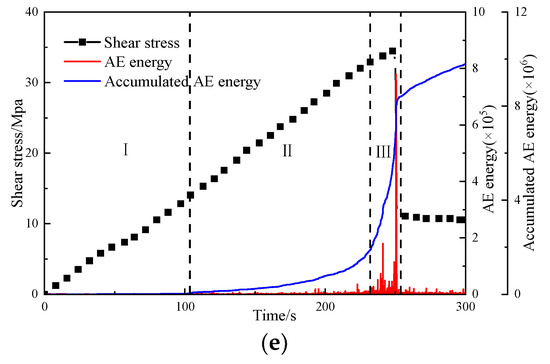
Figure 9.
AE energy and accumulated AE energy of granite specimens with respect to various temperatures under 10 MPa normal stress during whole deformation failure: (a) T = 25 °C; (b) T = 100 °C; (c) T = 200 °C; (d) T = 300 °C; (e) T = 400 °C.
It can be seen from Figure 9a that when the shear stress reaches the compaction stage (OA) of the granite, no acoustic emission energy is detected, indicating that the original microcracks inside the granite at this stage are gradually closed under the action of external forces, and no new cracks are generated. When the loading continues, the granite enters the linear elastic deformation stage (AB), and the acoustic emission event is still not monitored in the first half of it, which is still in the quiet period. During the quiet period, the cumulative energy curve of acoustic emission remains at a very low value, and the slope of the curve is almost unchanged. At the initial stage of the linear elastic deformation stage of granite, the internal microcracks are in the incubation stage. At the initial stage of crack initiation, the generated elastic wave is too weak to be transmitted to the rock surface and captured using the acoustic emission probes. Therefore, the acoustic emission signal is in the quiet period.
When the shear stress enters the second half of the AB stage, the acoustic emission signals begin to appear one after another. However, the distribution of acoustic emission events is scattered and the acoustic emission energy value is low, no abnormal high value appears, the cumulative energy value of acoustic emission, and the slope of the curve increases slowly; thus, the acoustic emission events are in the stable period. In the later stage of the linear elastic deformation stage (AB) of granite, with the increase in external load, the deformation of rock increases linearly, the microcracks inside the rock begin to expand, and the lengths and opening of cracks increase gradually. Therefore, the stable expansion of cracks compels the acoustic emission events to enter the stable period.
When the loading continues, the granite enters the yield stage (BC). After reaching the peak shear stress, the rock quickly enters the failure stage (CD). During this stage, the acoustic emission events are densely generated, and the acoustic emission energy value continues to increase to the maximum value. The cumulative acoustic emission energy increases rapidly, while the slope of the curve increases continuously, which is approximately vertical upward at the moment of failure. After the rock enters the yield stage, the expansion of internal micro-cracks changes from stable to unstable, the lengths and opening of cracks increase sharply, and the dense generation of micro-fractures makes the acoustic emission events enter the acceleration period.
The shear stress-displacement curve of granite can reflect the macroscopic deformation characteristics of rock, while the acoustic emission signal reflects the damage of rock from the microscopic perspective. When the acoustic emission signal is in the quiet and stable periods, the granite is basically in the elastic deformation stage, and there is no obvious damage inside the rock if the external load disappears. When the acoustic emission signal enters the acceleration period, the granite rock enters the non-linear deformation stage, the unrecoverable damage is generated inside, and the macroscopic crack is rapidly generated under the action of external force. It can be seen from Figure 7 that when the normal stress is constant, the acoustic emission characteristics of granite during shear deformation from 25 to 400 °C are very similar, which can be divided into three stages. Some differences are mainly due to the different external loads required for crack initiation and propagation in granite samples at different temperatures.
From Figure 9a–c, it can be seen that when the temperature increases from 25 to 200 °C, the granite hardly produces obvious acoustic emission events before the shear failure, and the monitored acoustic emission energy values are low. At the moment of shear damage, acoustic emission events are intensively produced, and the acoustic emission energy rapidly reaches the extreme value. This result shows that in this temperature range, under the coupling effect of constant normal stress and temperature, the internal micro-cracks of granite are more difficult to develop; the energy released via crack propagation is lower; the stress level required for failure is higher; there are fewer cracks inside the rock before macroscopic damage, which leads to a slight increase in granite shear strength instead of it decreasing with the increase in temperature; and the failure mode of rock is obvious brittle failure. It can be seen from Figure 9d,e that when the temperature increases from 200 to 400 °C, the acoustic emission events gradually increase before the shear failure of granite, especially in the acceleration period, and the AE energy values are high. At the same time, the extreme value of AE energy monitored at the moment of shear failure is also reduced. This result shows that within this temperature range, the stress level required for crack initiation and propagation in granite is reduced, and the internal cracks in the rock are fully developed before the macroscopic failure, resulting in the shear strength of granite gradually decreasing with the increase in temperature, while the rock failure mode gradually changes to ductile failure. As can be seen from Figure 9, compared to 25 °C, when the temperature is 100–400 °C, the total value of accumulated AE energy released during granite shear de-formation decreases, i.e., the elastic energy released during the shear deformation of granite decreases, as do the results under other normal stresses. At 400 °C, compared to 25 °C, when the normal stress is 10 MPa, 20 MPa, 30 MPa, or 40 MPa, the accumulated AE energy released during the shear deformation are reduced to 53.33%, 18.18%, 20.00%, or 15.71% of the original value, respectively.
This result is contrary to the results of Wang et al. [35]. Wang et al. conducted uniaxial compression testing on granite under real-time temperature and found that with the increase in real-time temperature, the cumulative energy of acoustic emission during the deformation of sample gradually increased. This difference may be explained as follows: the samples are first heated under the condition of no stress constraint in Wang et al., with rock samples suffering greater damage at higher temperatures; thus, there are more thermally induced microcracks. Next, in the loading stage, more acoustic emission energy is generated via crack propagation in rock samples. During this study, granite specimens experienced two stages: heating under constant normal stress and shearing testing under constant temperature. In the heating stage under the normal stress, thermally induced microcracks were generated inside the granite, after which the specimens produced deformation, thereby releasing energy and weakening the resistance to the deformation of the specimen; thus, the elastic energy released during the shear failure process was ever-decreasing. It can be seen that the evolution characteristics of microcracks in rock under the coupling of real-time high temperature and stress are obviously different to those observed via the loading method of heating the rock before applying stress. The cumulative acoustic emission energy obtained can be significantly reduced, which shows that the generation of microcracks in rock is affected by both temperature and stress. Applying a certain condition alone will lead to the difference in the rock fracture process; thus, that the mechanical strength of rock under thermal–mechanical coupling cannot be accurately obtained.
3.5. Variation in Crack Types in Rock with Temperature
Brittle rocks mainly produce tension cracks and shear cracks during the damage process. It is found that when the tensile crack is generated, the two sides of the crack move in opposite directions, resulting in an acoustic emission waveform with short rise time and high frequency. When a shear crack is generated, an acoustic emission waveform with a long rise time and a low frequency is generated. Therefore, RA (the ratio of rise time to amplitude, in ms·V−1) and AF (the ratio of acoustic emission ringing count to duration, in kHz) can be used to distinguish between the types of cracks in rock [36]. Figure 10 is a typical acoustic emission waveform parameters and crack classification diagram.
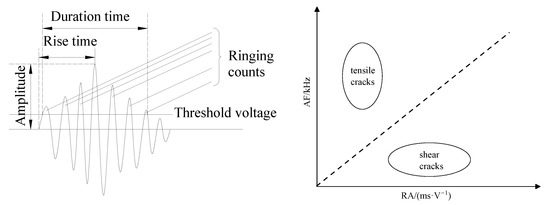
Figure 10.
Schematic diagram of typical AE wave-form parameters and crack classification.
Figure 11a shows the scatter plot of AF-RA signal value during the shear deformation of granite. It can be seen from the diagram that it is difficult to make effective distinction because the data points are too dense; thus, the kernel density plot of AF-RA signal value is transformed into the density plot of AF-RA signal value distribution shown in Figure 11b, which makes it easier to find the distribution pattern of AF-RA value.
Figure 11.
Scatter plot and kernel density plot of AF-RA during shear deformation of granite: (a) scatter plot of AF-RA; (b) kernel density plot of AF-RA.
It is generally considered that a low value of RA and a high value of AF represents tensile cracks, while a low value of AF and a high value of RA represents shear cracks. Japanese scholars used this approach based on concrete materials to develop the JMCS-III specification. In this model, the ratio of AF to RA is defined as the slope , and the line with slope passing through the origin is taken as the dividing line for two crack classifications, while for concrete materials, the value can be taken as any integer between 1 and 200 [37]. For rock materials, He et al. took as 1 [38] and Niu et al. took as 2.13 [39]; Mao found that the value had an effect on the number of different types of cracks, though the value did not affect the crack evolution trend under the same loading method [40]. For granite, is taken as two in this paper.
The kernel density plot of AF-RA value distribution during shear deformation of granite under different normal stresses is shown in Figure 12. The red area in the figure represents the maximum density, i.e., the core of data point distribution, while the blue area represents the distribution of numerous strongholds with a density of 0. The transition area represents different numbers of data points according to different colors.
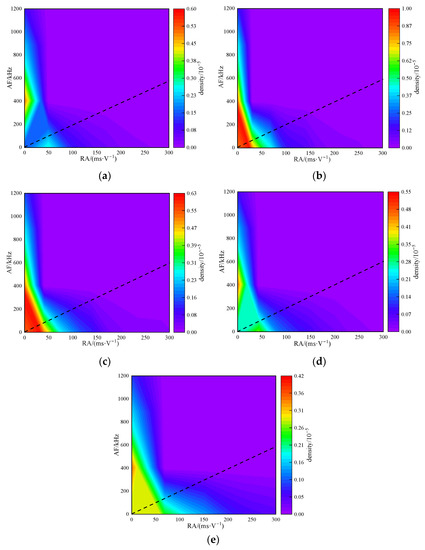
Figure 12.
AF-RA kernel density plot of granite at different temperatures under 10 MPa normal stress: (a) T = 25 °C; (b) T = 100 °C; (c) T = 200 °C; (d) T = 300 °C; (e) T = 400 °C.
As can be seen from Figure 12, the proportion of tensile cracks in the granite shear damage process is larger than that of shear cracks, i.e., tensile damage mainly occurs in the granite shear damage process. When the temperature increases from 25 to 200 °C, the core of the distribution in the AF-RA density diagram gradually approaches from the AF axis to the origin; when the temperature increases from 200 to 400 °C, the core of the distribution in the AF-RA density diagram gradually approaches from the origin to the RA axis. It can be seen that with the increase in temperature, the shear cracks gradually increase during the shear deformation of granite, i.e., the higher the temperature, the more likely the granite is to produce shear damage.
3.6. Variation Characteristics of Surface Morphology of Granite with Temperature
There are two main failure modes in the process of rock compression-shear failure: shear failure and tensile failure. The shear failure planes of granite specimens are basically distributed along the pre-determined position. After failure, the two pieces are basically intact with local damage. Figure 13 shows the surface morphology of the failure plane after shear failure under real-time high-temperature (25–400 °C) and 10 MPa normal stress. In the pictures, the ellipses are used to mark the shear scratches, and the arrows represent the movement direction of the rock.
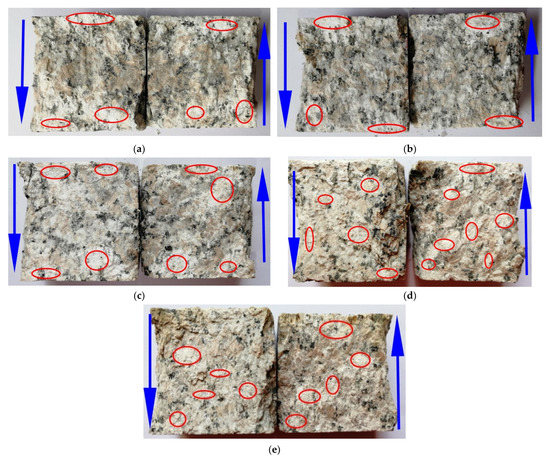
Figure 13.
Surface morphology of failure plane of granite under real-time temperature: ((a) T = 25 °C; (b) T = 100 °C; (c) T = 200 °C; (d) T = 300 °C; (e) T = 400 °C) under 10 MPa normal stress.
It can be seen from Figure 13 that the color of granite specimens is grayish white at room temperature, and the color gradually deepens with the increase in temperature. The granite is partially damaged on the side of specimens during the shearing process but remains essentially intact. There are obvious wears from shear failure at some locations on the shear failure plane, while the rest position of the plane is characterized by tensile fracture.
From 25 to 100 °C, the location of wear on the shear failure plane of the specimen is mainly concentrated on the top and bottom of the specimen, while the area is small. The tensile failure mainly occurs in the middle of the shear failure plane, which leads to the high surface evenness of the shear plane. Compared to Figure 9a,b, it can be found that there are only a few AE events before the shear failure of specimen, and the elastic energy of rock is mainly released at the moment of shear failure.
From 200 to 400 °C, the shear wear marks on the surface of the specimen gradually increased and were evenly distributed on the whole shear failure plane. The debris produced through shear wear are visible, and the roughness of the shear failure plane gradually increases. Compared to Figure 9, it can be found that the failure mode of granite specimens gradually changes from sudden instability to progressive instability and generates more intensive AE events before the failure, i.e., a large number of cracks are generated before the failure of the rock, meaning that the specimen is dominated by shear failure rather than tensile failure.
4. Conclusions
In this paper, the evolution of mechanical properties, AE energy, meso-cracks, and surface morphology for shear test of granite under real-time high temperature was studied using the servo-controlled true triaxial experimental system under real-time high temperature combined with AE technique, and the following conclusions were drawn.
There exists a threshold temperature for the effect of temperature on the shear mechanical strength and shear modulus of granite (200 °C). Before the threshold temperature, the effect of temperature on the macroscopic mechanical properties of granite is not obvious. The stress–strain curve of granite shows strong brittle deformation characteristics, and there are almost no obvious micro-cracks before shear failure. After the threshold temperature, the temperature compels the macroscopic mechanical properties of granite to deteriorate rapidly, the ductility characteristics of granite stress–strain curve gradually become obvious, and the AE energy released by micro-cracks is obviously visible before shear failure.
While the temperature always has a positive effect on the development of shear cracks in granite, the shear cracks in granite always increase with temperature. In addition, the temperature does not change the effect of stress on the mechanical properties of the rock, and the normal stress is always positively correlated with the shear mechanical strength and shear modulus of granite.
In the present study, the variation law of shear mechanical properties of granite under real-time temperature is analyzed based on the direct shear experiment of granite. The single type of rock selected is not enough to prove the universality of the obtained law to other rocks. At the same time, the influence of temperature on the microstructure of granite is not deeply explored. In the future, it is necessary to carry out more mechanical experiments of various types of rocks under real-time high temperature and pressure, and the evolution of the meso-structure of rock needs to be further explored through means of CT scanning or numerical simulation.
Author Contributions
Conceptualization, Z.F. and J.G.; methodology, Z.F.; software, Z.F.; validation, J.G., Z.F. and X.L.; formal analysis, J.G.; investigation, X.L.; resources, Z.F.; data curation, J.G.; writing—original draft preparation, J.G.; writing—review and editing, Z.F.; visualization, X.L.; supervision, Z.F.; project administration, Z.F.; funding acquisition, Z.F. All authors have read and agreed to the published version of the manuscript.
Funding
This research was funded by National Natural Science Foundation of China Youth Fund, grant number 51904197.
Institutional Review Board Statement
Not applicable.
Informed Consent Statement
Not applicable.
Data Availability Statement
Not applicable.
Conflicts of Interest
The authors declare no conflict of interest.
References
- Krieger, M.; Kurek, K.A.; Brommer, M. Global geothermal industry data collection: A systematic review. Geothermics 2022, 104, 102457. [Google Scholar] [CrossRef]
- Lu, S.-M. A global review of enhanced geothermal system (EGS). Renew. Sustain. Energy Rev. 2018, 81, 2902–2921. [Google Scholar] [CrossRef]
- Yin, T.; Li, X.; Xia, K.; Huang, S. Effect of Thermal Treatment on the Dynamic Fracture Toughness of Laurentian Granite. Rock Mech. Rock Eng. 2012, 45, 1087–1094. [Google Scholar] [CrossRef]
- Guha, R.D.; Singh, T.N. Effect of heat treatment and layer orientation on the tensile strength of a crystalline rock under Brazilian test condition. Rock Mech. Rock Eng. 2015, 49, 1663–1677. [Google Scholar] [CrossRef]
- Cheng, C.; Xu, N.; Zheng, B. Mobilized Mohr-Coulomb and Hoek-Brown strength parameters during failure of granite in Alxa area in China for high-Level radioactive waste disposal. Energies 2019, 12, 4237. [Google Scholar] [CrossRef]
- Liu, C.; Feng, G.; Xie, H.; Wang, J.; Duan, Z.; Tao, Y.; Lu, G.; Xu, H.; Hu, Y.; Li, C.; et al. Study on the accuracy of fracture criteria in predicting fracture characteristics of granite with different occurrence depths. Energies 2022, 15, 9248. [Google Scholar] [CrossRef]
- Liu, S.; Xu, J. An experimental study on the physico-mechanical properties of two post-high-temperature rocks. Eng. Geol. 2015, 185, 63–70. [Google Scholar] [CrossRef]
- Yao, M.; Rong, G.; Zhou, C.; Peng, J. Effects of thermal damage and confining pressure on the mechanical properties of coarse marble. Rock Mech. Rock Eng. 2016, 49, 2043–2054. [Google Scholar] [CrossRef]
- Yang, S.-Q.; Ranjith, P.; Jing, H.-W.; Tian, W.-L.; Ju, Y. An experimental investigation on thermal damage and failure mechanical behavior of granite after exposure to different high temperature treatments. Geothermics 2017, 65, 180–197. [Google Scholar] [CrossRef]
- Yang, S.Q.; Huang, Y.H.; Tian, W.L.; Yin, P.F.; Jing, H.W. Effect of high temperature on deformation failure behavior of granite specimen containing a single fissure under uniaxial compression. Rock Mech. Rock Eng. 2019, 52, 2087–2107. [Google Scholar] [CrossRef]
- Miao, S.; Pan, P.-Z.; Yu, P.; Zhao, S.; Shao, C. Fracture analysis of Beishan granite after high-temperature treatment using digital image correlation. Eng. Fract. Mech. 2020, 225, 106847. [Google Scholar] [CrossRef]
- He, M.; Yu, L.-Y.; Liu, R.-C.; Jiang, Y.-J.; Li, Z.-C.; Wang, X.-L. Experimental investigation on mechanical behaviors of granites after high-temperature exposure. J. Cent. South Univ. 2022, 29, 1332–1344. [Google Scholar] [CrossRef]
- Jin, P.H.; Hu, Y.Q.; Shao, J.X.; Shao, G.K.; Zhu, X.Z.; Li, C. Experimental study on physical, mechanical and permeability properties of granite after rapid cooling. Chin. J. Rock Mech. Eng. 2018, 37, 2556–2564. [Google Scholar]
- Shen, Y.-J.; Hou, X.; Yuan, J.-Q.; Zhao, C.-H. Experimental study on temperature change and crack expansion of high temperature granite under different cooling shock treatments. Energies 2019, 12, 2097. [Google Scholar] [CrossRef]
- Xi, B.P.; Wu, Y.C.; Wang, S.; Xiong, G.M.; Zhao, Y.S. Experimental study on mechanical properties of granite under thermal shock and its evolution with cooling temperature. Rock Soil Mech. 2020, 41, 83–94. [Google Scholar]
- Li, C.; Hu, Y.; Meng, T.; Jin, P.; Zhao, Z.; Zhang, C. Experimental study of the influence of temperature and cooling method on mechanical properties of granite: Implication for geothermal mining. Energy Sci. Eng. 2020, 8, 1716–1728. [Google Scholar] [CrossRef]
- Xiao, P.; Zheng, J.; Dou, B.; Tian, H.; Cui, G.; Kashif, M. Mechanical behaviors of granite after thermal shock with different cooling rates. Energies 2021, 14, 3721. [Google Scholar] [CrossRef]
- Zhang, Z.Z.; Gao, F.; Xu, X.L. Experimental study on temperature effect of mechanical properties of granite. Rock Soil Mech. 2011, 32, 2346–2352. [Google Scholar]
- Yin, T.-B.; Shu, R.-H.; Li, X.-B.; Wang, P.; Liu, X.-L. Comparison of mechanical properties in high temperature and thermal treatment granite. Trans. Nonferrous Met. Soc. China 2016, 26, 1926–1937. [Google Scholar] [CrossRef]
- Luo, S.Y.; Dou, B.; Tian, H.; Chen, J.; Xiao, P.; Zhang, S. Comparative experimental study on physical and mechanical properties of granite after natural cooling and under real-time high temperature. Earth Sci. Front. 2020, 27, 178–184. [Google Scholar]
- Liu, S.; Xu, J. Investigation of impact compressive mechanical properties of sandstone after as well as under high temperature. High Temp. Mater. Process. 2014, 33, 585–591. [Google Scholar] [CrossRef]
- Xu, X.L.; Gao, F.; Zhang, Z.Z.; Chen, L. Experimental study of the effect of loading rates on mechanical properties of granite at real-time high temperature. Rock Soil Mech. 2015, 36, 2184–2192. [Google Scholar]
- Gu, B.; Wan, Z.J.; Zhang, Y.; Ma, Y.; Xu, X.B. Influence of real-time heating on mechanical behaviors of rocks. Adv. Civ. Eng. 2020, 2020, 8879922. [Google Scholar]
- Yang, K.; Zhang, F.; Meng, F.-Z.; Hu, D.-W.; Tan, X.-F. Effect of real-time high temperature and loading rate on mode I fracture toughness of granite. Geotherm. Energy 2022, 10, 14. [Google Scholar] [CrossRef]
- Gao, Z.; Liu, Z.; Tian, F.; Shen, W. Strength, energy evolution and cracking process of sandstone under high-temperature and high-pressure coupled true triaxial compression. Géoméch. Geophys. Geo-Energy Geo-Resour. 2022, 8, 176. [Google Scholar] [CrossRef]
- Zhao, Y.; Wan, Z.; Feng, Z.; Yang, D.; Zhang, Y.; Qu, F. Triaxial compression system for rock testing under high temperature and high pressure. Int. J. Rock Mech. Min. Sci. 2012, 52, 132–138. [Google Scholar] [CrossRef]
- Zhao, Y.S.; Wan, Z.J.; Feng, Z.J.; Xu, Z.H.; Liang, W.G. Evolution of mechanical properties of granite at high temperature and high pressure. Géoméch. Geophys. Geo-Energy Geo-Resour. 2017, 3, 199–210. [Google Scholar] [CrossRef]
- Ma, X.; Wang, G.; Hu, D.; Liu, Y.; Zhou, H.; Liu, F. Mechanical properties of granite under real-time high temperature and three-dimensional stress. Int. J. Rock Mech. Min. Sci. 2020, 136, 104521. [Google Scholar] [CrossRef]
- Yang, S.Q. Mechanical Behavior and Damage Fracture Mechanism of Deep Rocks; Springer Nature: Berlin/Heidelberg, Germany, 2022; pp. 345–372. [Google Scholar]
- Feng, X.T.; Wang, G.; Zhang, X.; Yang, C. Experimental method for direct shear tests of hard rock under both normal stress and lateral stress. Int. J. Geomech. 2021, 21, 04021013. [Google Scholar] [CrossRef]
- Guo, P. Research on Physical Mechanics and Damage Characteristics of Heat-Treated Granite. Ph.D. Thesis, Beijing University of Science and Technology, Beijing, China, 2023. [Google Scholar]
- Yin, W.T.; Feng, Z.J.; Zhao, Y.S. Effect of Grain Size on the Mechanical Behaviour of Granite Under High Temperature and Triaxial Stresses. Rock Mech. Rock Eng. 2021, 54, 745–758. [Google Scholar] [CrossRef]
- Mao, R.; Feng, Z.; Liu, Z.; Zhao, Y. Laboratory hydraulic fracturing test on large-scale pre-cracked granite specimens. J. Nat. Gas Sci. Eng. 2017, 44, 278–286. [Google Scholar] [CrossRef]
- Zhang, Q.; Zheng, T.; Wang, X.; Fang, Z. Multi-source information monitoring test of fractured rock mass destruction characteristics and sensitivity analysis of precursor phenomena. Energies 2022, 15, 538. [Google Scholar] [CrossRef]
- Wang, Z.; He, A.; Shi, G.; Mei, G. Temperature effect on AE energy characteristics and damage mechanical behaviors of granite. Int. J. Géoméch. 2018, 18, 04017163. [Google Scholar] [CrossRef]
- Du, K.; Li, X.; Tao, M.; Wang, S. Experimental study on acoustic emission (AE) characteristics and crack classification during rock fracture in several basic lab tests. Int. J. Rock Mech. Min. Sci. 2020, 133, 104411. [Google Scholar] [CrossRef]
- JCMS-III B5706; Monitoring Method for Active Cracks in Concrete by Acoustic Emission. Federation of Construction Materials Industries: Tokyo, Japan, 2003.
- He, M.C.; Zhao, F.; Du, S.; Zheng, M. Experimental analysis of rockburst damage characteristics under different unloading rates. Rock Soil Mech. 2014, 35, 2737–2747, 2793. [Google Scholar]
- Niu, Y.; Zhou, X.P.; Berto, F. Evaluation of fracture mode classification in flawed red sandstone under uniaxial compression. Theor. Appl. Fract. Mech. 2020, 107, 102528. [Google Scholar] [CrossRef]
- Mao, R.B. Research on the Law of Fracturing Evolution of Rock Mass by Real-Time Acoustic Emission Location Monitoring; Taiyuan University of Technology: Taiyuan, Taiwan, 2020. [Google Scholar]
Disclaimer/Publisher’s Note: The statements, opinions and data contained in all publications are solely those of the individual author(s) and contributor(s) and not of MDPI and/or the editor(s). MDPI and/or the editor(s) disclaim responsibility for any injury to people or property resulting from any ideas, methods, instructions or products referred to in the content. |
© 2023 by the authors. Licensee MDPI, Basel, Switzerland. This article is an open access article distributed under the terms and conditions of the Creative Commons Attribution (CC BY) license (https://creativecommons.org/licenses/by/4.0/).