Article

Clues in the Data: The Role of Education in Adopting Technology That Enhances Sustainable Lifestyle Choices

School of Forest, Fisheries, and Geomatics Sciences, University of Florida, Gainesville, FL 32611, USA
*
Author to whom correspondence should be addressed.
Sustainability 2023, 15(11), 8443; https://doi.org/10.3390/su15118443
Submission received: 30 March 2023 / Revised: 9 May 2023 / Accepted: 17 May 2023 / Published: 23 May 2023
(This article belongs to the Special Issue Education to Influence Pro-environmental Behavior)

Abstract

:
Smart technology has the potential to help people practice more sustainable behaviors, but many barriers still exist. Understanding the motivations of people who use these devices can help educators develop more effective programs to ensure people reach appropriate conservation and sustainability goals. As a case in point, we analyzed surveys from owners of smart irrigation controllers to understand their motives for using the device on residential landscaping. Factor analysis resulted in six categories of survey questions: interest in landscaping maintenance, interest in technology, interest in conservation, interest in saving money, interest in the aesthetic benefits of landscaping, and concerns about technology. Cluster analysis divided the respondents into four distinct groups based on their factor scores. Characteristics and motivations differed for each cluster and ranged from those who enjoy landscaping activities and use the device to grow healthier plants, to those who dislike landscaping chores and see the device as a tool to make these tasks easier. All clusters had an interest in conservation, but it was not the highest motivating factor for any group. We discuss ways in which educators can utilize the cluster profiles to better communicate and support each group in achieving water conservation. This process could be used for other types of technology that make it easier to achieve a more sustainable lifestyle.

1. Introduction

Educators have long been on the front lines of solutions to challenging issues. Improvements to basic driver’s training, for example, was one of several solutions provided by the National Traffic and Motor Vehicle Safety Act in 1966 to reduce automobile fatalities, and climate change education is one of three strategies in the Climate Action Sustainable Development Goal 13 that will enable the world to address global warming. Innovation and adherence to commitments are the other two (https://www.globalgoals.org/goals/13-climate-action/, accessed on 15 March 2023). Education has a role to play in not only making the problems more understandable but also the solutions, as well as offering the motivation and hopefulness to achieve the goals (Monroe et al., 2017) [1].
Many educational programs related to environmental issues initially focused on providing background information about the problem hoping to change attitudes in order to compel people to change behavior (Kollmus and Agyeman, 2002) [2]. Noting the resilience of habits and the difficulties to alter some behaviors, a variety of theories suggest that information in concert with strengthening skills; building peer and community support; and offering reasonable alternatives, prompts, and incentives can help motivate behavior changes (Heimlich and Ardoin, 2008; Monroe, 2003) [3,4]. The variety of possible motives, such as competence, satisfaction, and autonomy (De Young, 2000; Kaplan, 2000) [5,6], and the dimensions of the action, such as private or public and individual or group (Stern, 2000) [7], effectively stymie those seeking a single strategy for changing behavior. As a result, educators are left to create programs that may help some learners but may be ineffective at garnering large-scale changes across the broader population.
Many of the behaviors on which the theories of pro-environmental behavior change were developed explored individual actions that require time and effort but no other resources. They could be adopted by anyone, such as turning off the faucet or the lights to conserve water or energy. Technology has made some of these behaviors more likely and more convenient. It is no longer necessary for someone to adjust the household thermostat every morning and evening; a smart device can do that. Smart technology is emerging as a potentially powerful tool for sustainability. A smart device is one that adapts to situations without user input, typically through the use of sensors, and usually has an app or similar communications tool for the user. While many of these devices are specifically marketed as conservation tools (such as thermostats, lighting, irrigation controllers), many purchasers are only interested in owning the technology (Murtagh et al., 2014; Wilson et al., 2015) [8,9], and the devices are not always effective at reducing energy or water (Hargreaves et al., 2010; Murtagh et al., 2014; Yang & Newman, 2013) [8,10,11].
For any given behavior, knowing what motivated those who have adopted it and how they are different from those who have not would be useful information to design an educational intervention (Warner, 2021) [12]. Education programs which promote smart devices as a method of increasing sustainable behaviors can provide tools and training to maximize conservation. The potential barriers to adopting sustainable behavior that an educational intervention should address will likely vary with the device and the user’s motivations. Devices meant to conserve energy, such as smart thermostats and home energy monitors, are often subject to interpersonal household dynamics and the negotiations among residents about their preferred surrounding temperature or lighting (Hargreaves et al., 2010; Murtagh et al., 2014) [8,10], whereas typically only one or two members of a household are involved with landscaping decisions, such as whether to use a smart irrigation controller. However, landscaping decisions are often influenced by neighbors, homeowner associations, and social norms in the neighborhood (Warner et al. 2017; Warner, 2021) [12,13].
Unlike previous studies that have analyzed motives of those who irrigate their lawns (Warner et al. 2017) [13], the following study analyzes data from those who have purchased a smart irrigation controller. The analysis will enable educators to better understand homeowners’ motivations and consider how this insight could be useful to future educational programs. Although they are ostensibly devices to conserve water, insisting that people adopt a device for only one motive is unlikely to be successful, even if there are rational reasons to believe that that is the “best” reason (Kaplan, 2000) [6]. Homeowners could be attracted by a number of motives: convenience, precise control, efficiency, automation of disliked chores, assistance with enjoyable activities, conservation of water or money, or to simply show off a new gadget. Unfortunately, mere ownership does not guarantee water conservation; the devices must be programmed by the homeowners to achieve this goal. Therefore, educational programs, either before or after purchase, are essential to achieve the promise that smart devices offer for sustainable lifestyle choices.
Understanding user motivations could help educators design programs and communication tools that better resonate with users and help them achieve and sustain their objectives. While community surveys and focus groups can begin to provide these insights (McKenzie Mohr and Schultz, 2014 [14]), the analysis of market research data also offers helpful clues.

2. Methods

Profiles of smart irrigation controller users were developed by the following with a three-step process: First, questions regarding interests in smart technology, conservation, landscaping, and home finances were selected from the survey and used to create meaningful factors. Second, the smart controller users were clustered around these factors which represent a common set of motivations and intent for using the device. Third, cluster descriptions were augmented with an assortment of demographic and descriptive data including a text analysis of an open-ended survey question about their choice of a smart irrigation controller.

2.1. Data

Data for this study were taken from a national survey of current and potential consumers of smart irrigation controllers. The electronic survey was conducted by a leading manufacturer in February–March of 2019 for the primary purpose of market research. Because we are exploring data from only one manufacturer of smart irrigation devices, there may be bias due to their specific marketing techniques or survey self-selection. The survey data can, however, help describe and profile users of smart irrigation controllers, identify their reasons for purchasing the device, and identify patterns and preferences in home landscaping activities. To profile current owners only, a subset of 5679 survey respondents who currently own a smart controller of any brand was used.

2.2. Analysis

2.2.1. Factor Analysis

Forty-two survey items on the topics of smart technology, conservation, landscaping, and home finances were selected from the 130 items on the marketing survey. These questions were measured through a 7-point Likert item using the prompt, “How do you feel about the following statements?” with responses ranging from 1 (Disagree Completely) to 7 (Agree Completely). In order to determine if these questions represented any latent factors, an exploratory factor analysis was conducted using R statistical language (version 3.63) in R Studio (version 1.2.5033) (R Core Team, 2020) [15] with the psych package (Revelle, 2020) [16] using minimum residuals as the extraction method (fa function with fm = minres), and an oblique rotation (oblimin). Four questions were eliminated because of ambiguous wording, and five additional questions were eliminated due to a lack of correlation with any other questions (r < 0.3). Thresholds for the exploratory analysis were set at eigenvalues ≥1 and item loadings ≥ 0.3, which resulted in three additional questions being removed. The final solution identified six factors among the 30 remaining questions (Table 1). Factor scores were calculated for each respondent by averaging the scores of the factor items, which were then used to cluster the survey respondents.

2.2.2. Cluster Analysis

Cluster analysis is frequently used in audience segmentation and market research to identify subgroups based on multiple dimensions (Smith, 2017) [17]. Since a person may have multiple reasons for purchasing a smart irrigation controller, cluster analysis can be useful in determining subtle differences among groups. The k-means cluster analysis was also conducted in R using the ClusterR package and KMeans_rcpp function, initialized with kmeans++ (Mouselimis, 2020) [18]. Three indicators were consulted in determining the number of clusters to set: within-cluster-sum-of-squares error, silhouette, and distortion (Pham et al., 2005) [19]. Together they indicated that two to four clusters would be optimal. Solutions with two, three, and four clusters were compared, and the solution with four was chosen due to better interpretability. Additional cluster metrics were obtained through the clValid package (Brock et al., 2008) [20] and the clv package (Nieweglowski, 2020) [21] (Figure 1, Table 2).

2.2.3. Additional Cluster Characteristics

The cluster groups were then further compared and described through demographics, additional survey questions, and text analysis of the open-ended question, “Why did you purchase a smart sprinkler controller rather than a more basic type of controller?” Text analysis was conducted using the Tidytext package (Silge & Robinson, 2016) [22] in R. Responses were segmented into all possible combinations of two-word phrases, stop-words were removed, and words were tokenized into stems before frequencies were computed. One limitation of this study is that information about the sampling method and response rate of survey participants was not provided, limiting the generalizability of this research. Additionally, because we only analyzed current owners of smart irrigation controllers, no information is known about the potential barriers and motivations of those who have not adopted this technology.

3. Results

Respondents were located in 49 US states and the District of Columbia (Vermont being the only state without any responses), but were not evenly distributed, with half residing in three states: California (25%), Texas (16%), and Colorado (9%). The majority were male (89%), white (78.1%) with a mean age of 49 years (median = 47 years, range = 18–97 years). The most frequently selected household income level was $250,000 or more (17.1%); however, 73.7% selected categories of $100,000 or above. Education levels were also high, with 80.7% having either a college degree (44.9%) or an advanced degree (35.8%). Medium sized yards (4000 ft2–10,000 ft2) were the most common (41%), followed by small (less than 4000 ft2, 22.3%) and medium-large (10,000 ft2–22,000 ft2, 21.8%), and 49.6% lived within a homeowners’ association. Most respondents purchased their controller in either 2017 (29.1%) or 2018 (38.9%).
The six factors generated from the exploratory factor analysis each have a recognizable theme (Table 1). The first factor can be described as “interest in landscaping maintenance” (7 questions, Eigenvalue = 3.37, Cronbach’s alpha = 0.76). High scores on this factor indicate enjoyment in the tasks of yard work and knowledge about landscaping and maintenance techniques. The second factor can be described as “interest in technology” (6 questions, Eigenvalue = 3.10, Cronbach’s alpha = 0.80). High scores on this factor indicate a belief that technology is exciting and helpful and an interest in keeping up with the latest devices. High scores on “interest in conservation” (5 questions, Eigenvalue = 2.79, Cronbach’s alpha = 0.83) indicate a belief in the need for natural resource conservation and willingness to participate in conservation efforts. The fourth factor can be described as “interest in the aesthetic benefits of landscaping” (5 questions, Eigenvalue = 2.21, Cronbach’s alpha = 0.79). High scores on this factor indicate a belief in the many benefits of a beautiful yard such as personal satisfaction, emotional well-being, and maintaining property values. The fifth factor can be described as “interest in saving money” (3 questions, Eigenvalue = 1.56, Cronbach’s alpha = 0.64) with high scores indicating a focus on reducing the costs of utilities and increasing property value. The sixth factor is interpreted as “concern about technology” (4 questions, Eigenvalue = 1.54, Cronbach’s alpha = 0.67). High scores on this factor indicate a belief that technology is complicated and unnecessary.
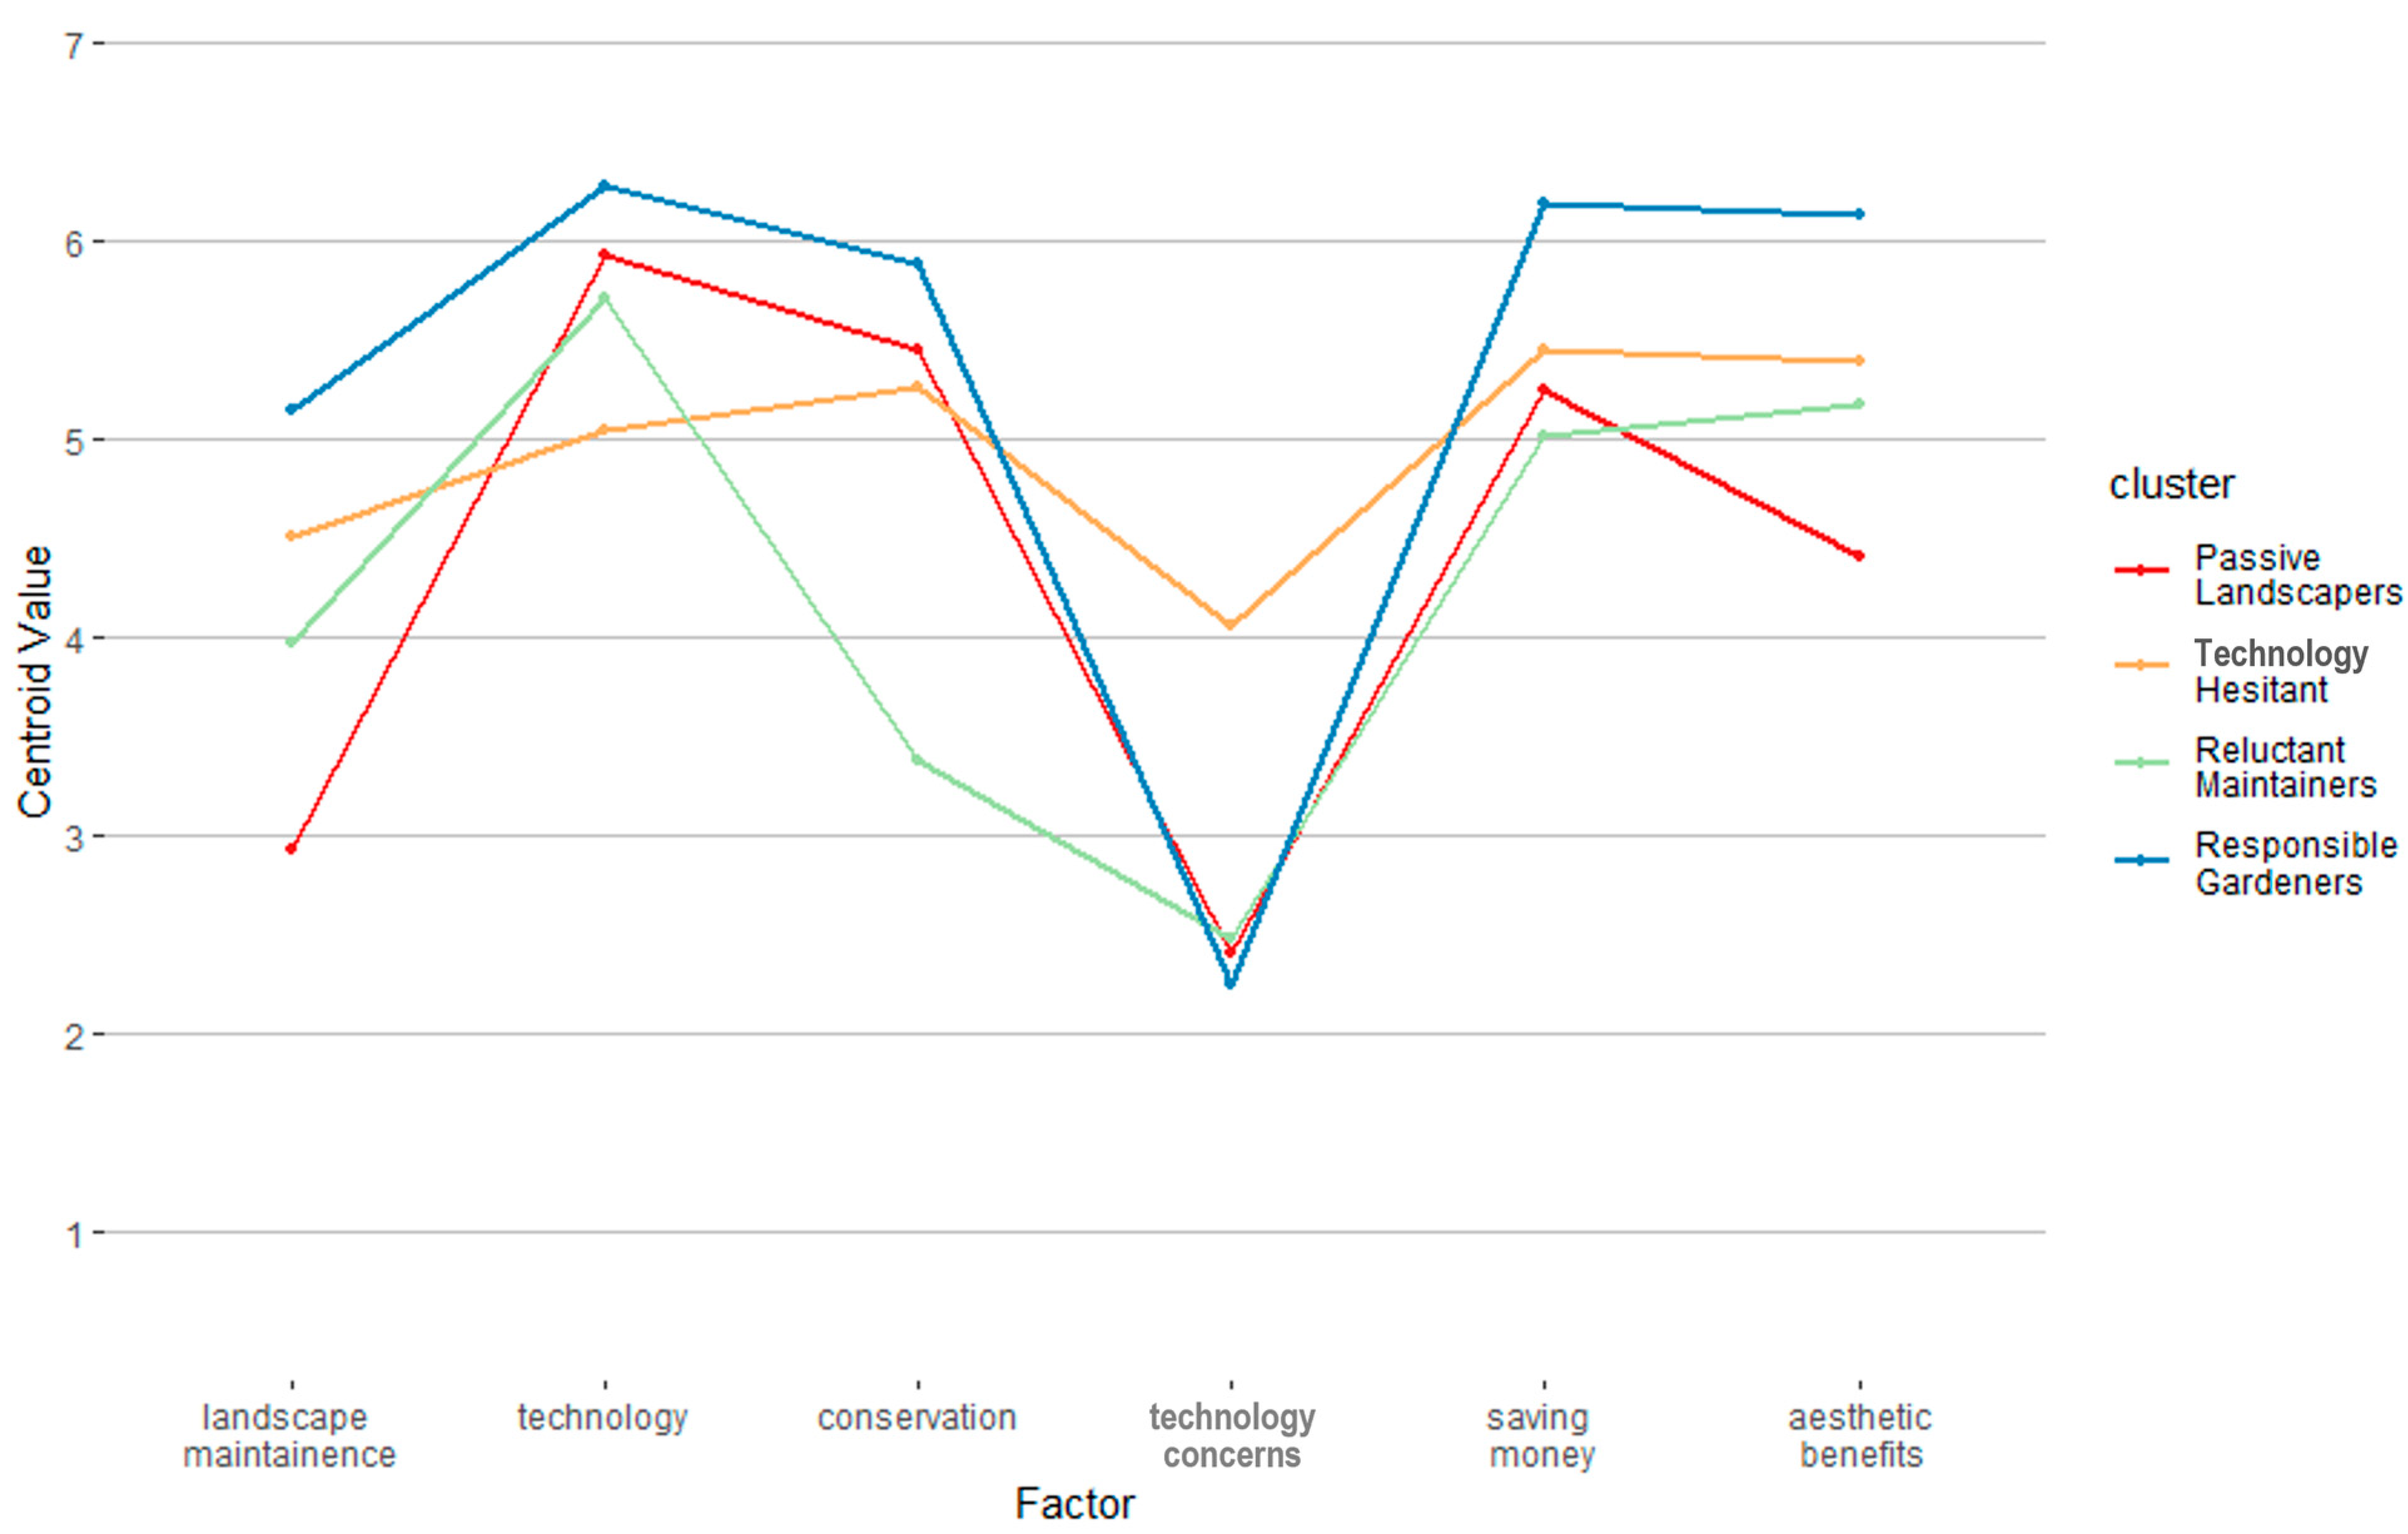
Four clusters of smart controller users were delineated based on their responses to these six factors and given descriptive names for easier identification and interpretation (Figure 2, Table 3). The largest cluster (n = 1802, 31.7%) has the highest mean scores across all clusters in yard maintenance, technology, conservation, money, and aesthetic benefits, which suggests that those in this group take pride in their landscaping and enjoy the yardwork but would like to use technology to conserve both resources and money and, therefore, was labeled Responsible Gardeners. The next cluster (n = 1213, 21.4%) is labeled as Technology Hesitant, due to having the highest scores in technology concerns and corresponding lowest scores in technology interest. The third cluster (n = 1229, 21.6%) is distinguished from the other groups by its low score in conservation. Combined with a basically neutral interest in yard maintenance, this may indicate that members of this group use the smart controller to make it easier to maintain their landscaping and, therefore, are labeled Reluctant Maintainers. The last cluster (n = 1435, 25.3%) has the lowest interest of any cluster in both yard maintenance and aesthetic benefits but the second highest interest in conservation and technology, which could indicate an admission of passivity or a preference for a less well-kept landscape and indifference to social norms; they were thus labeled Passive Landscapers.
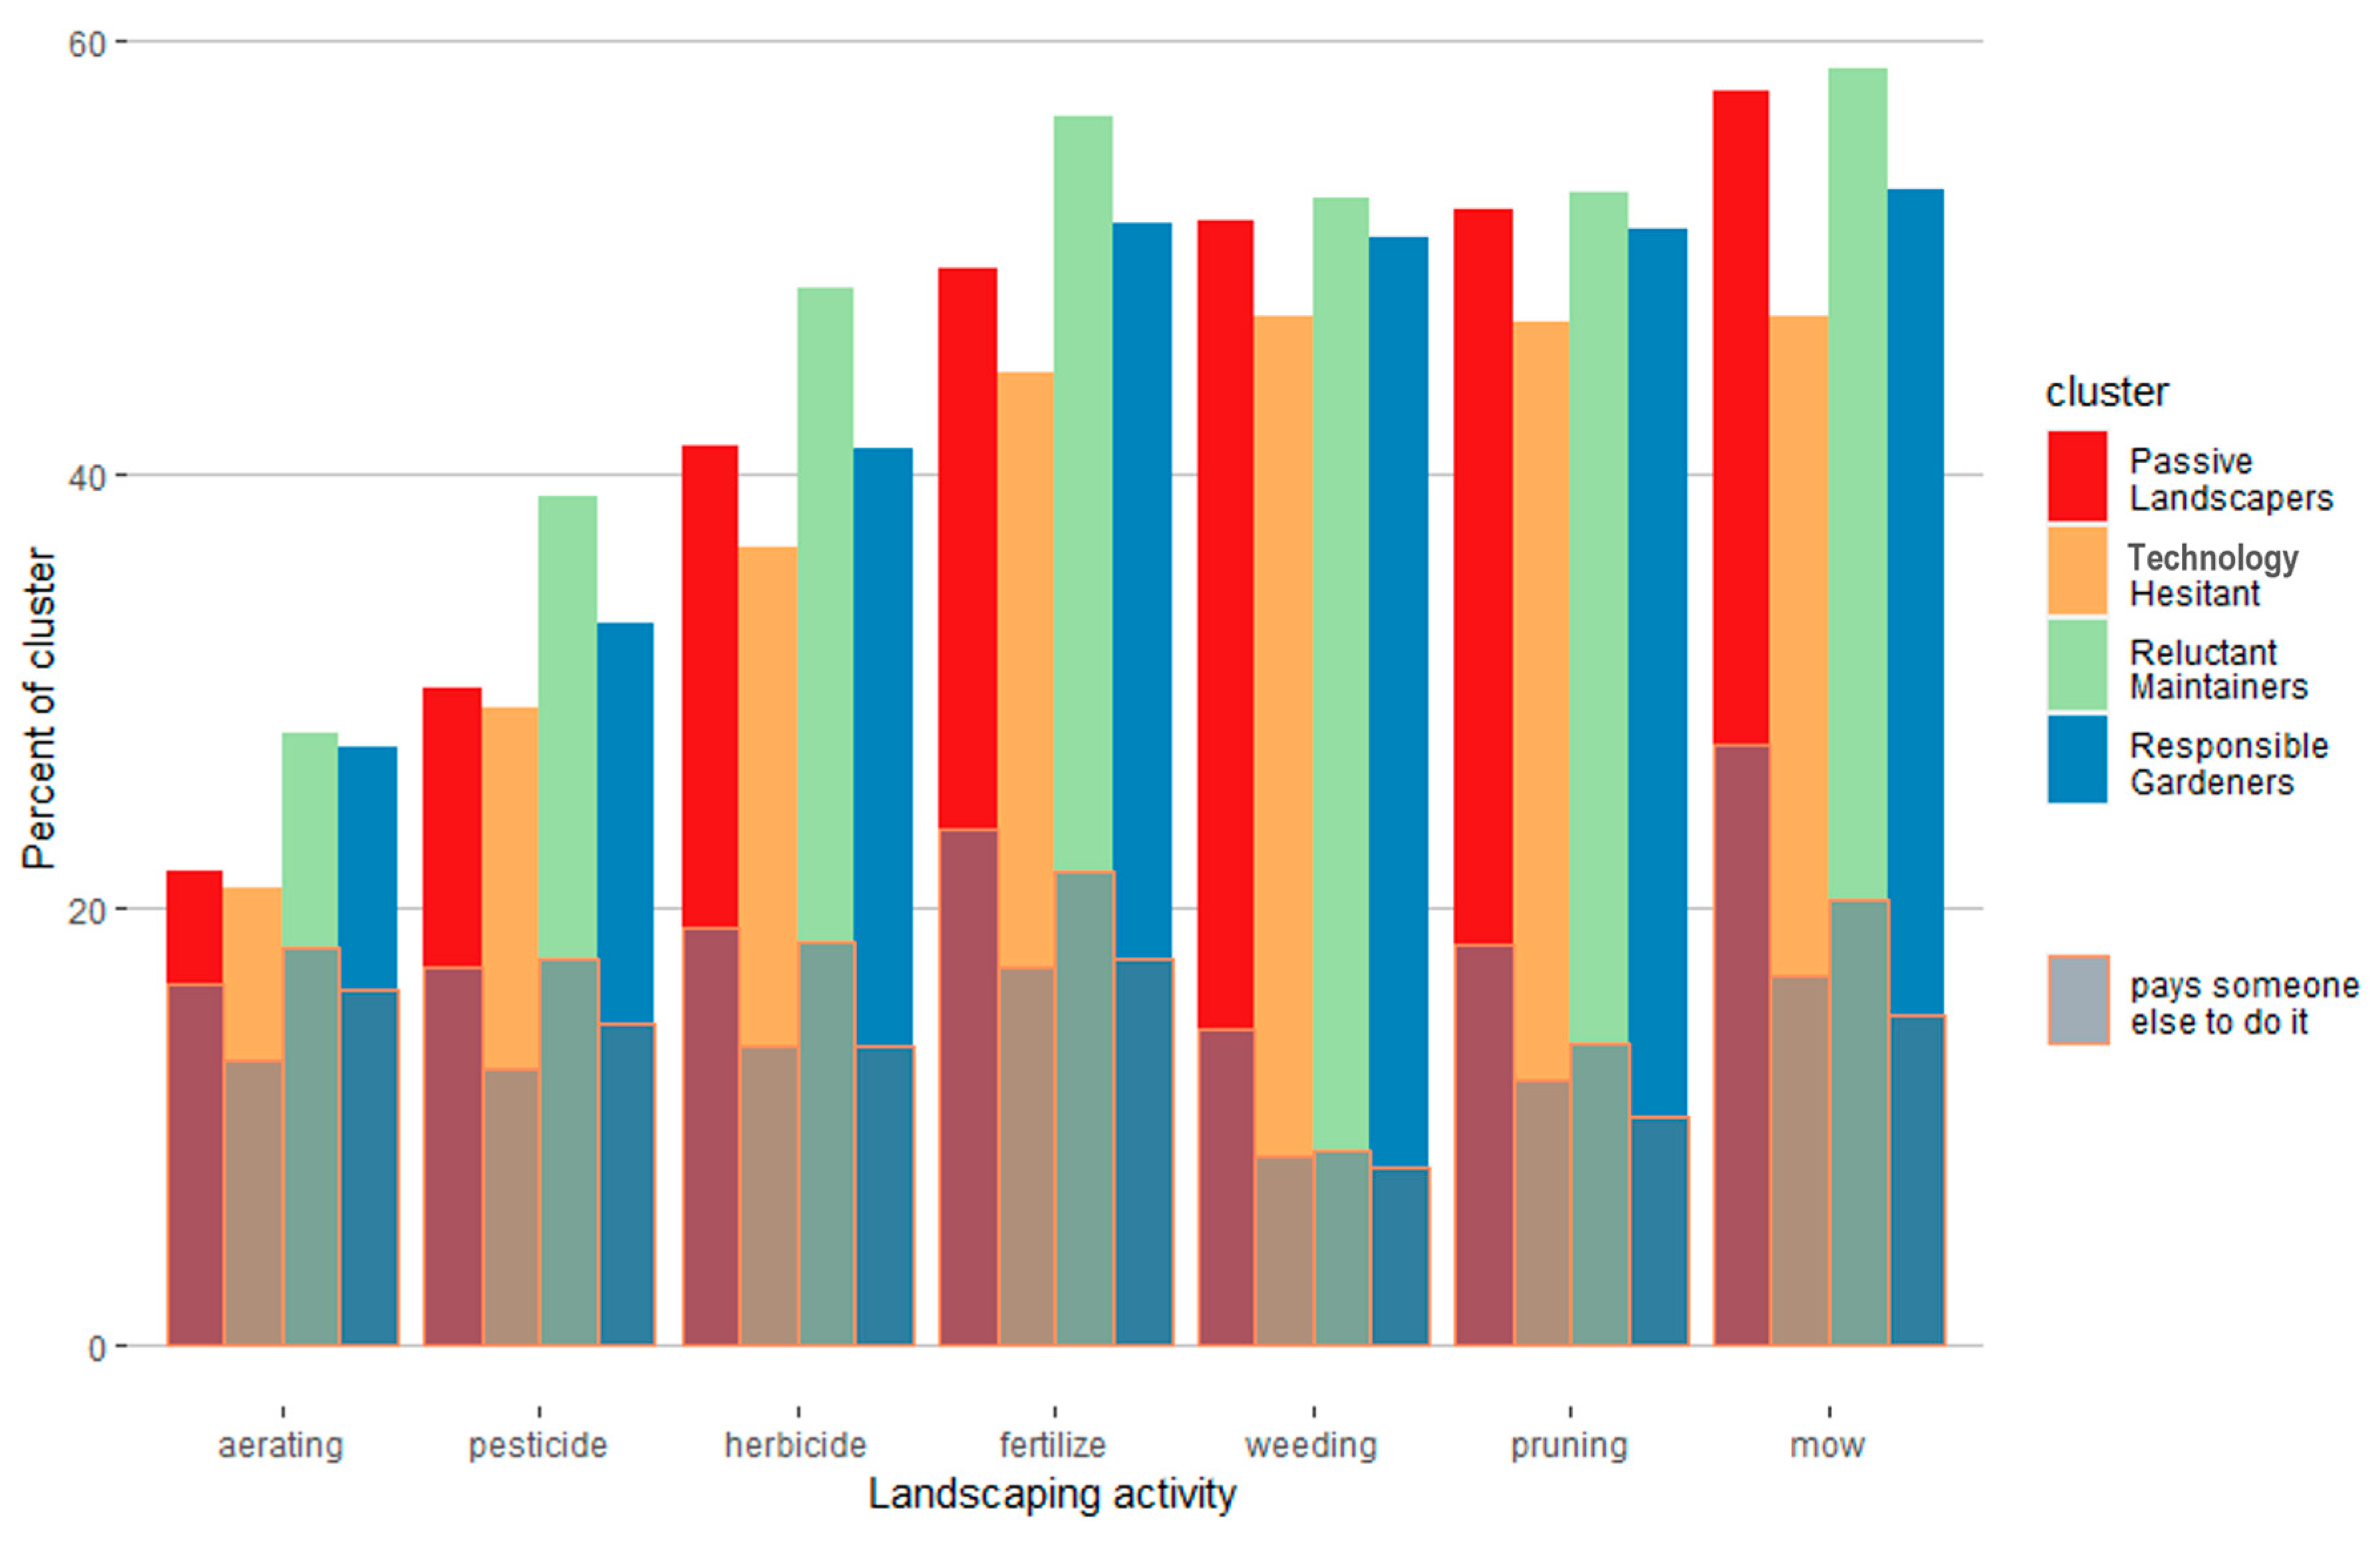
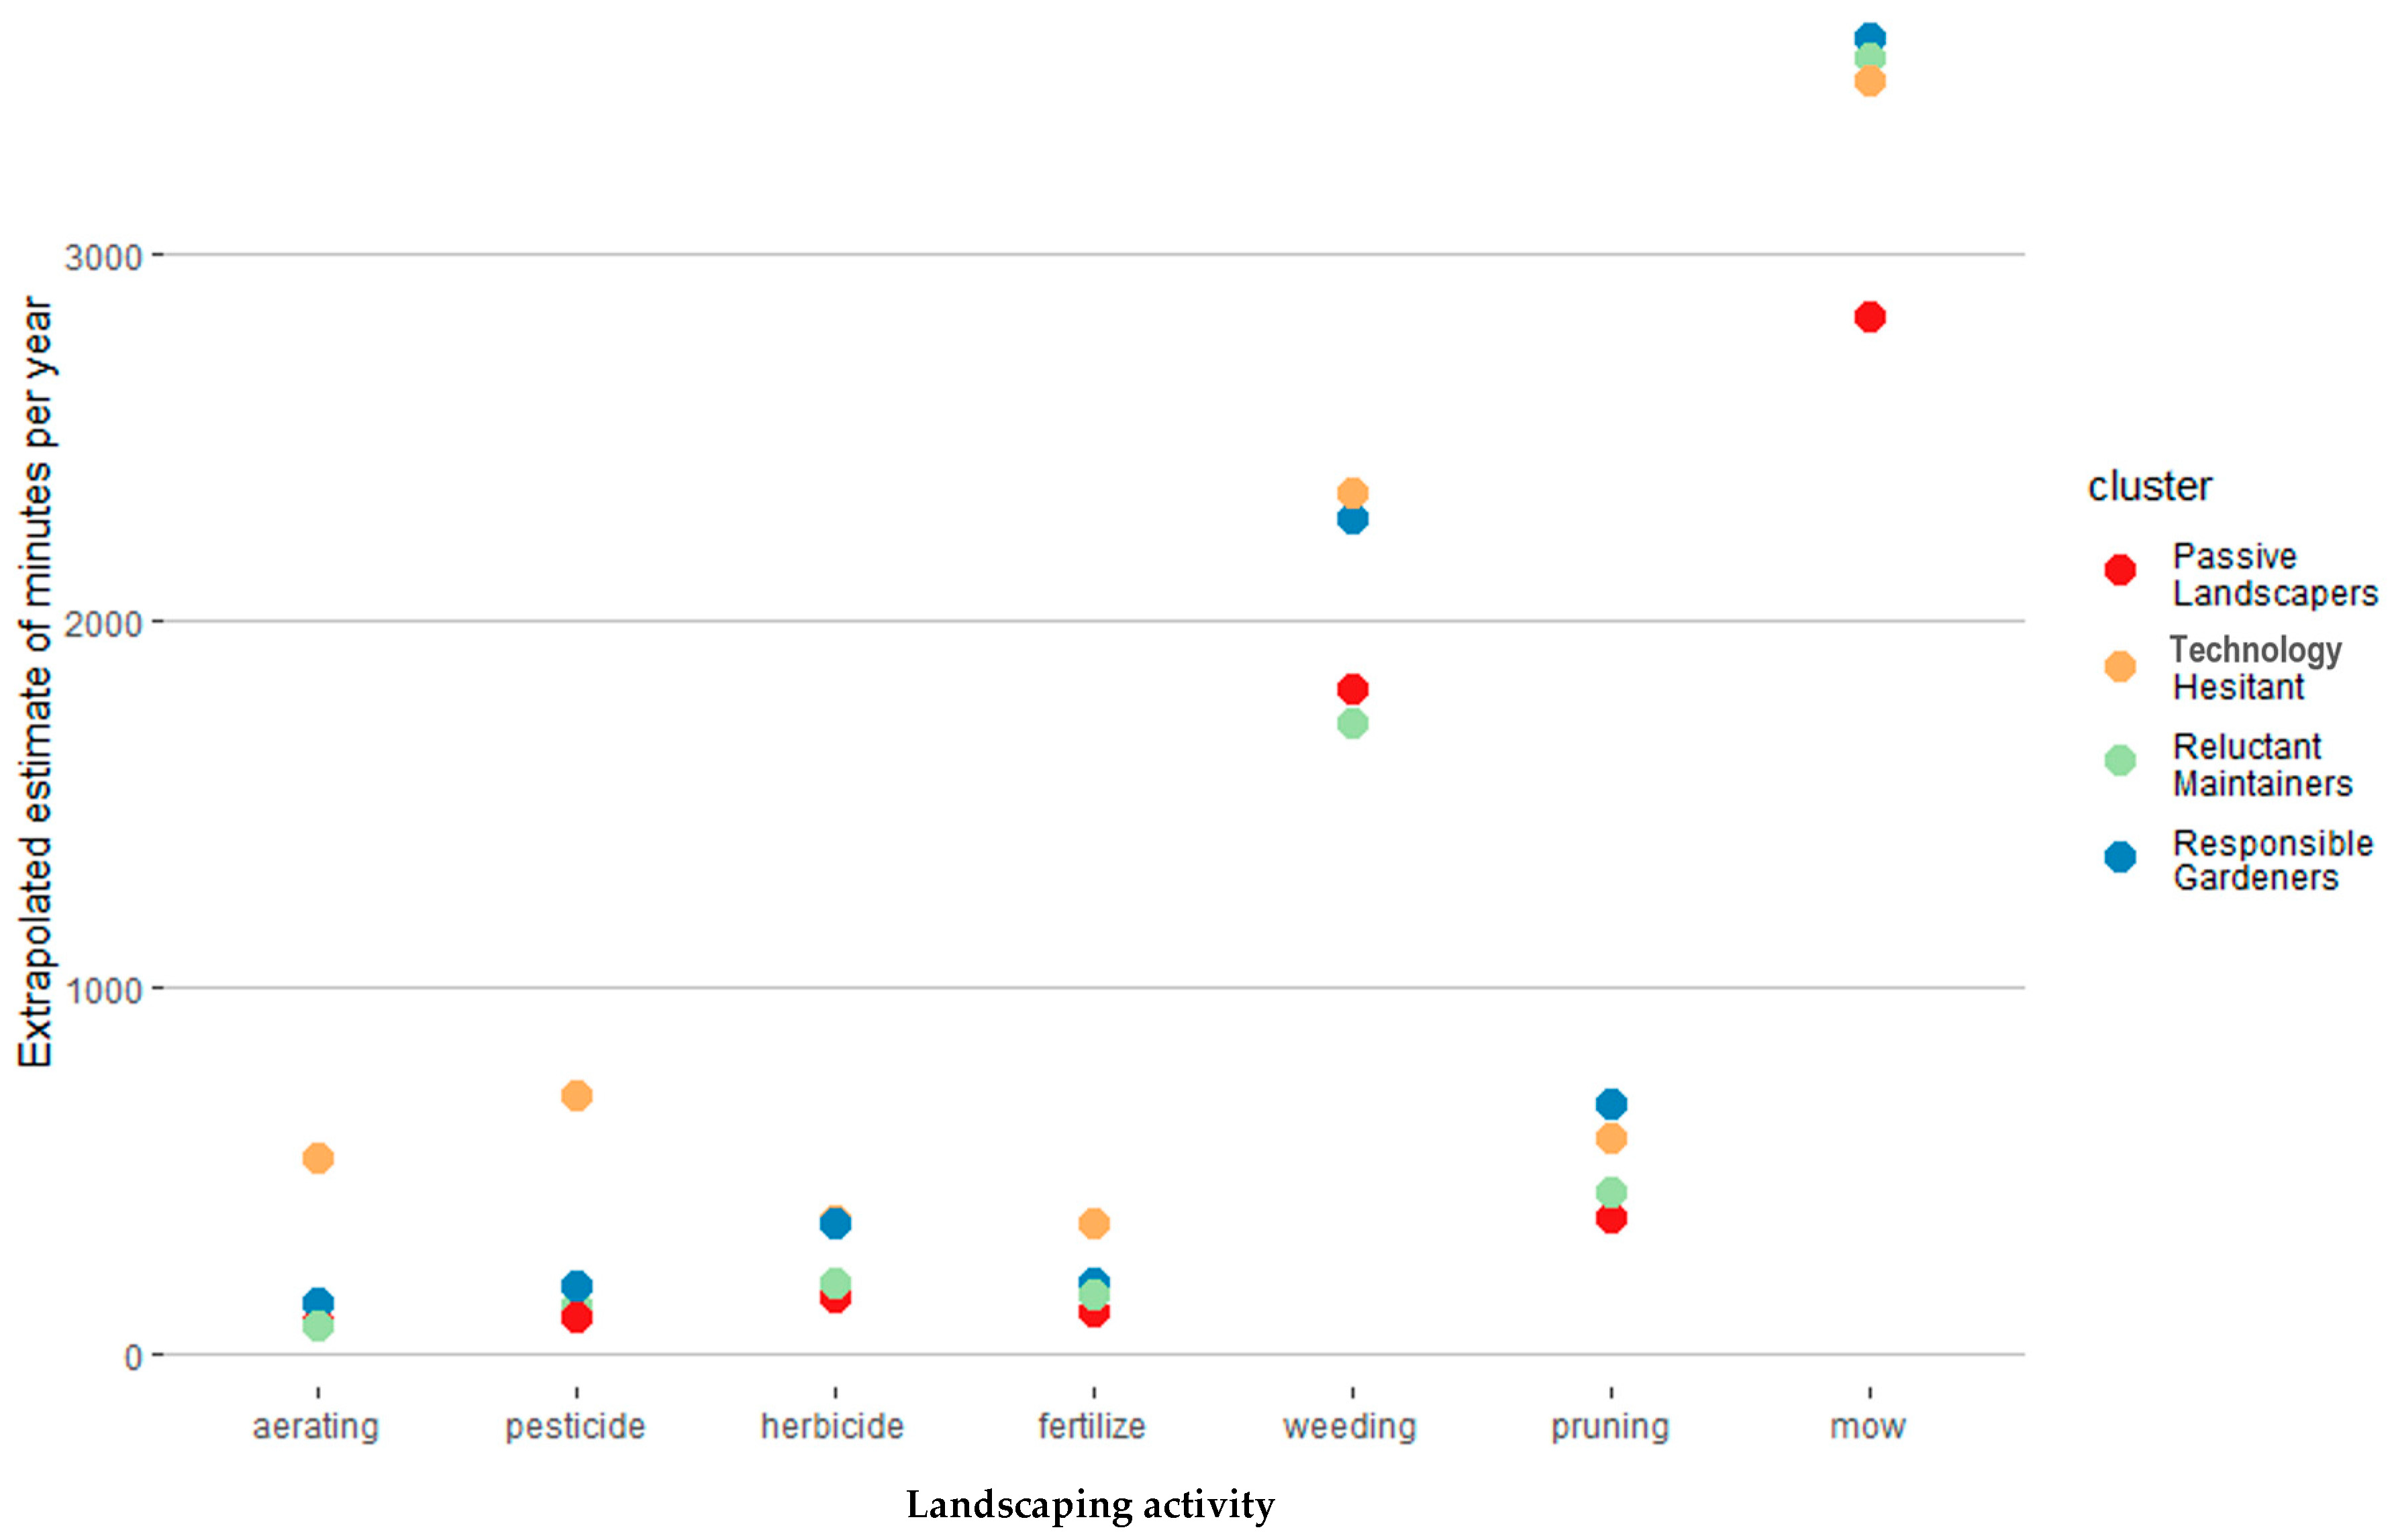
These cluster groups were further profiled using other questions and information from the survey, and each has characteristics consistent with their monikers (Table 4). There were statistically significant differences between the groups for all variables except for living in a homeowners association. The Technology Hesitant group is slightly older, has a higher proportion of females, and owns fewer smart devices compared to the other cluster groups. The Reluctant Maintainers have a slightly larger yard size and have a higher proportion of respondents who feel the appearance of the front yard is more important and correspondingly gets more time and investment. In the United States, front yards face the street and are visible to neighbors. They are rarely used for any purpose. The back yard is where families grow vegetables, sit outside, or play games. As a result, the front yard is a more important indicator of style, taste, and accommodation to social norms than the back yard. Reluctant Maintainers are also more likely to participate in chemical-based landscaping activities, which may be related to their low interest in conservation (Figure 3). Passive Landscapers, who have the lowest interest in landscape maintenance, also spend the least time on landscape maintenance activities, have the highest proportion of respondents who hire other people to maintain their yards, and have the least frequent engagement with the smart irrigation controller app. Similar to the Reluctant Maintainers, they also have a higher proportion of respondents who place more importance and investment in their front yards. Responsible Gardeners spend the most time on maintenance activities (Figure 4); are least likely to hire someone to complete their maintenance especially on routine activities such as mowing, pruning, and weeding (Figure 3); have the most frequent engagement with the app; and believe both the front and back yards are equally important and deserving of investment.
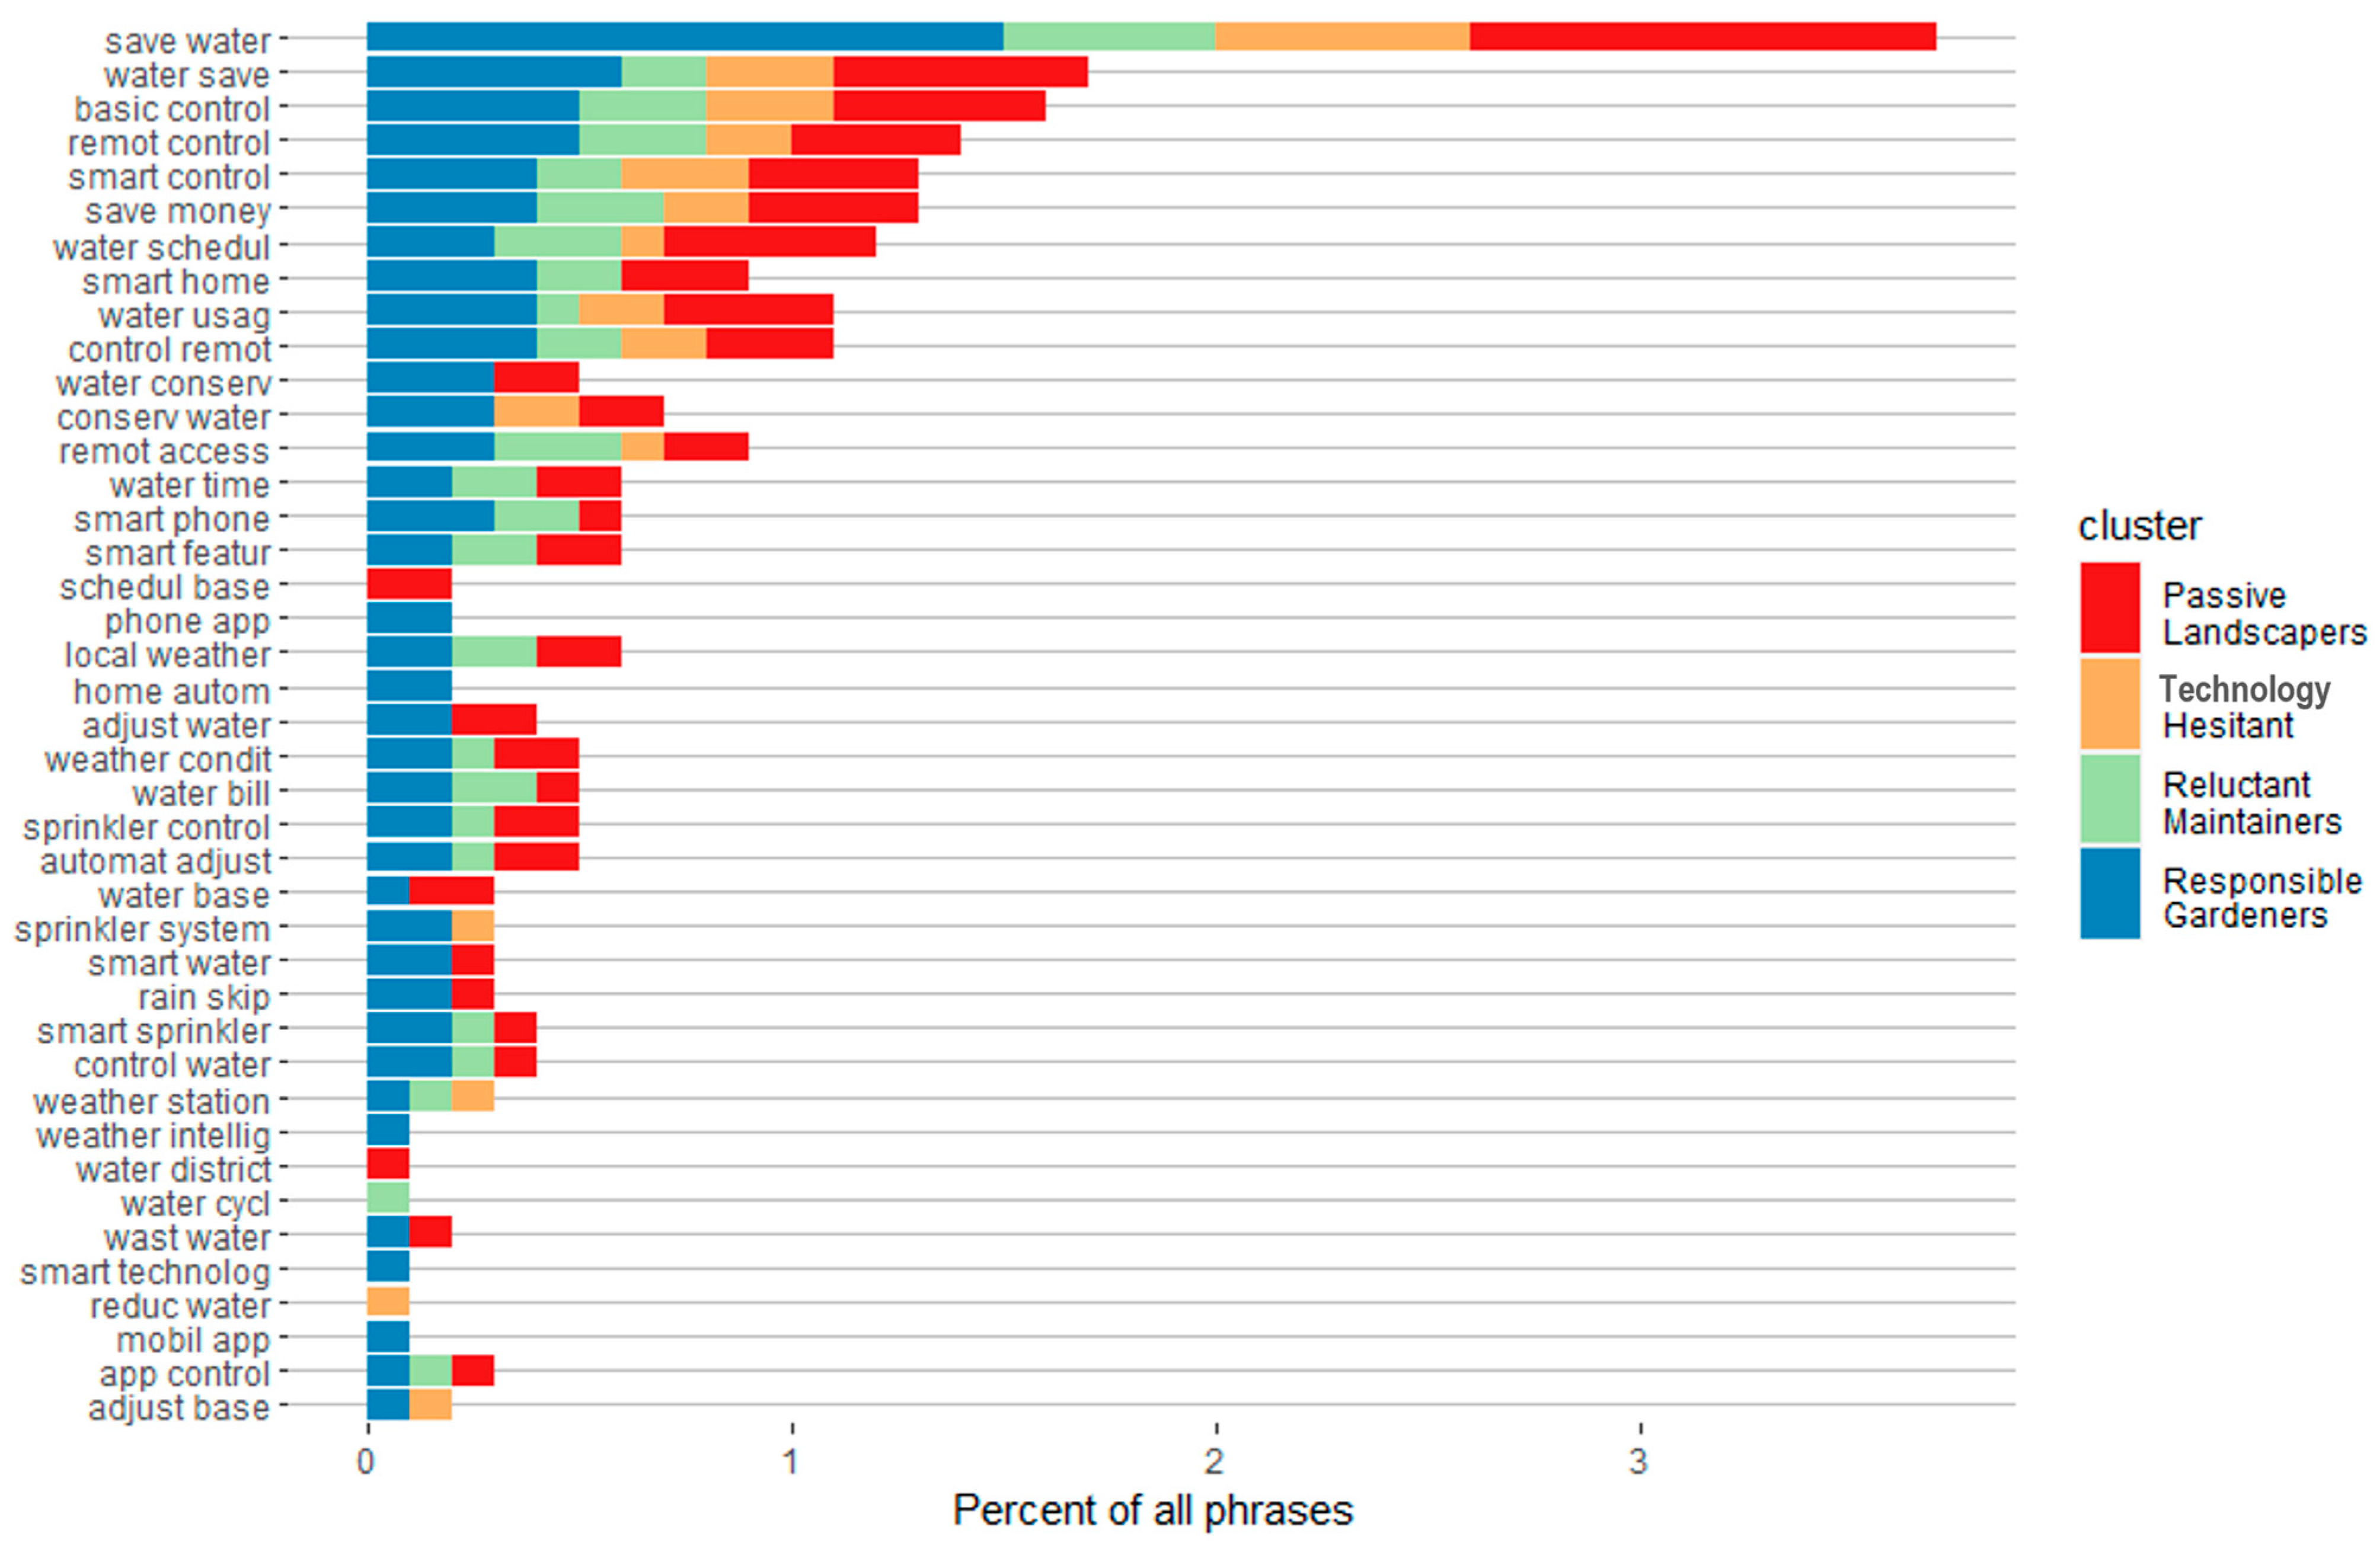
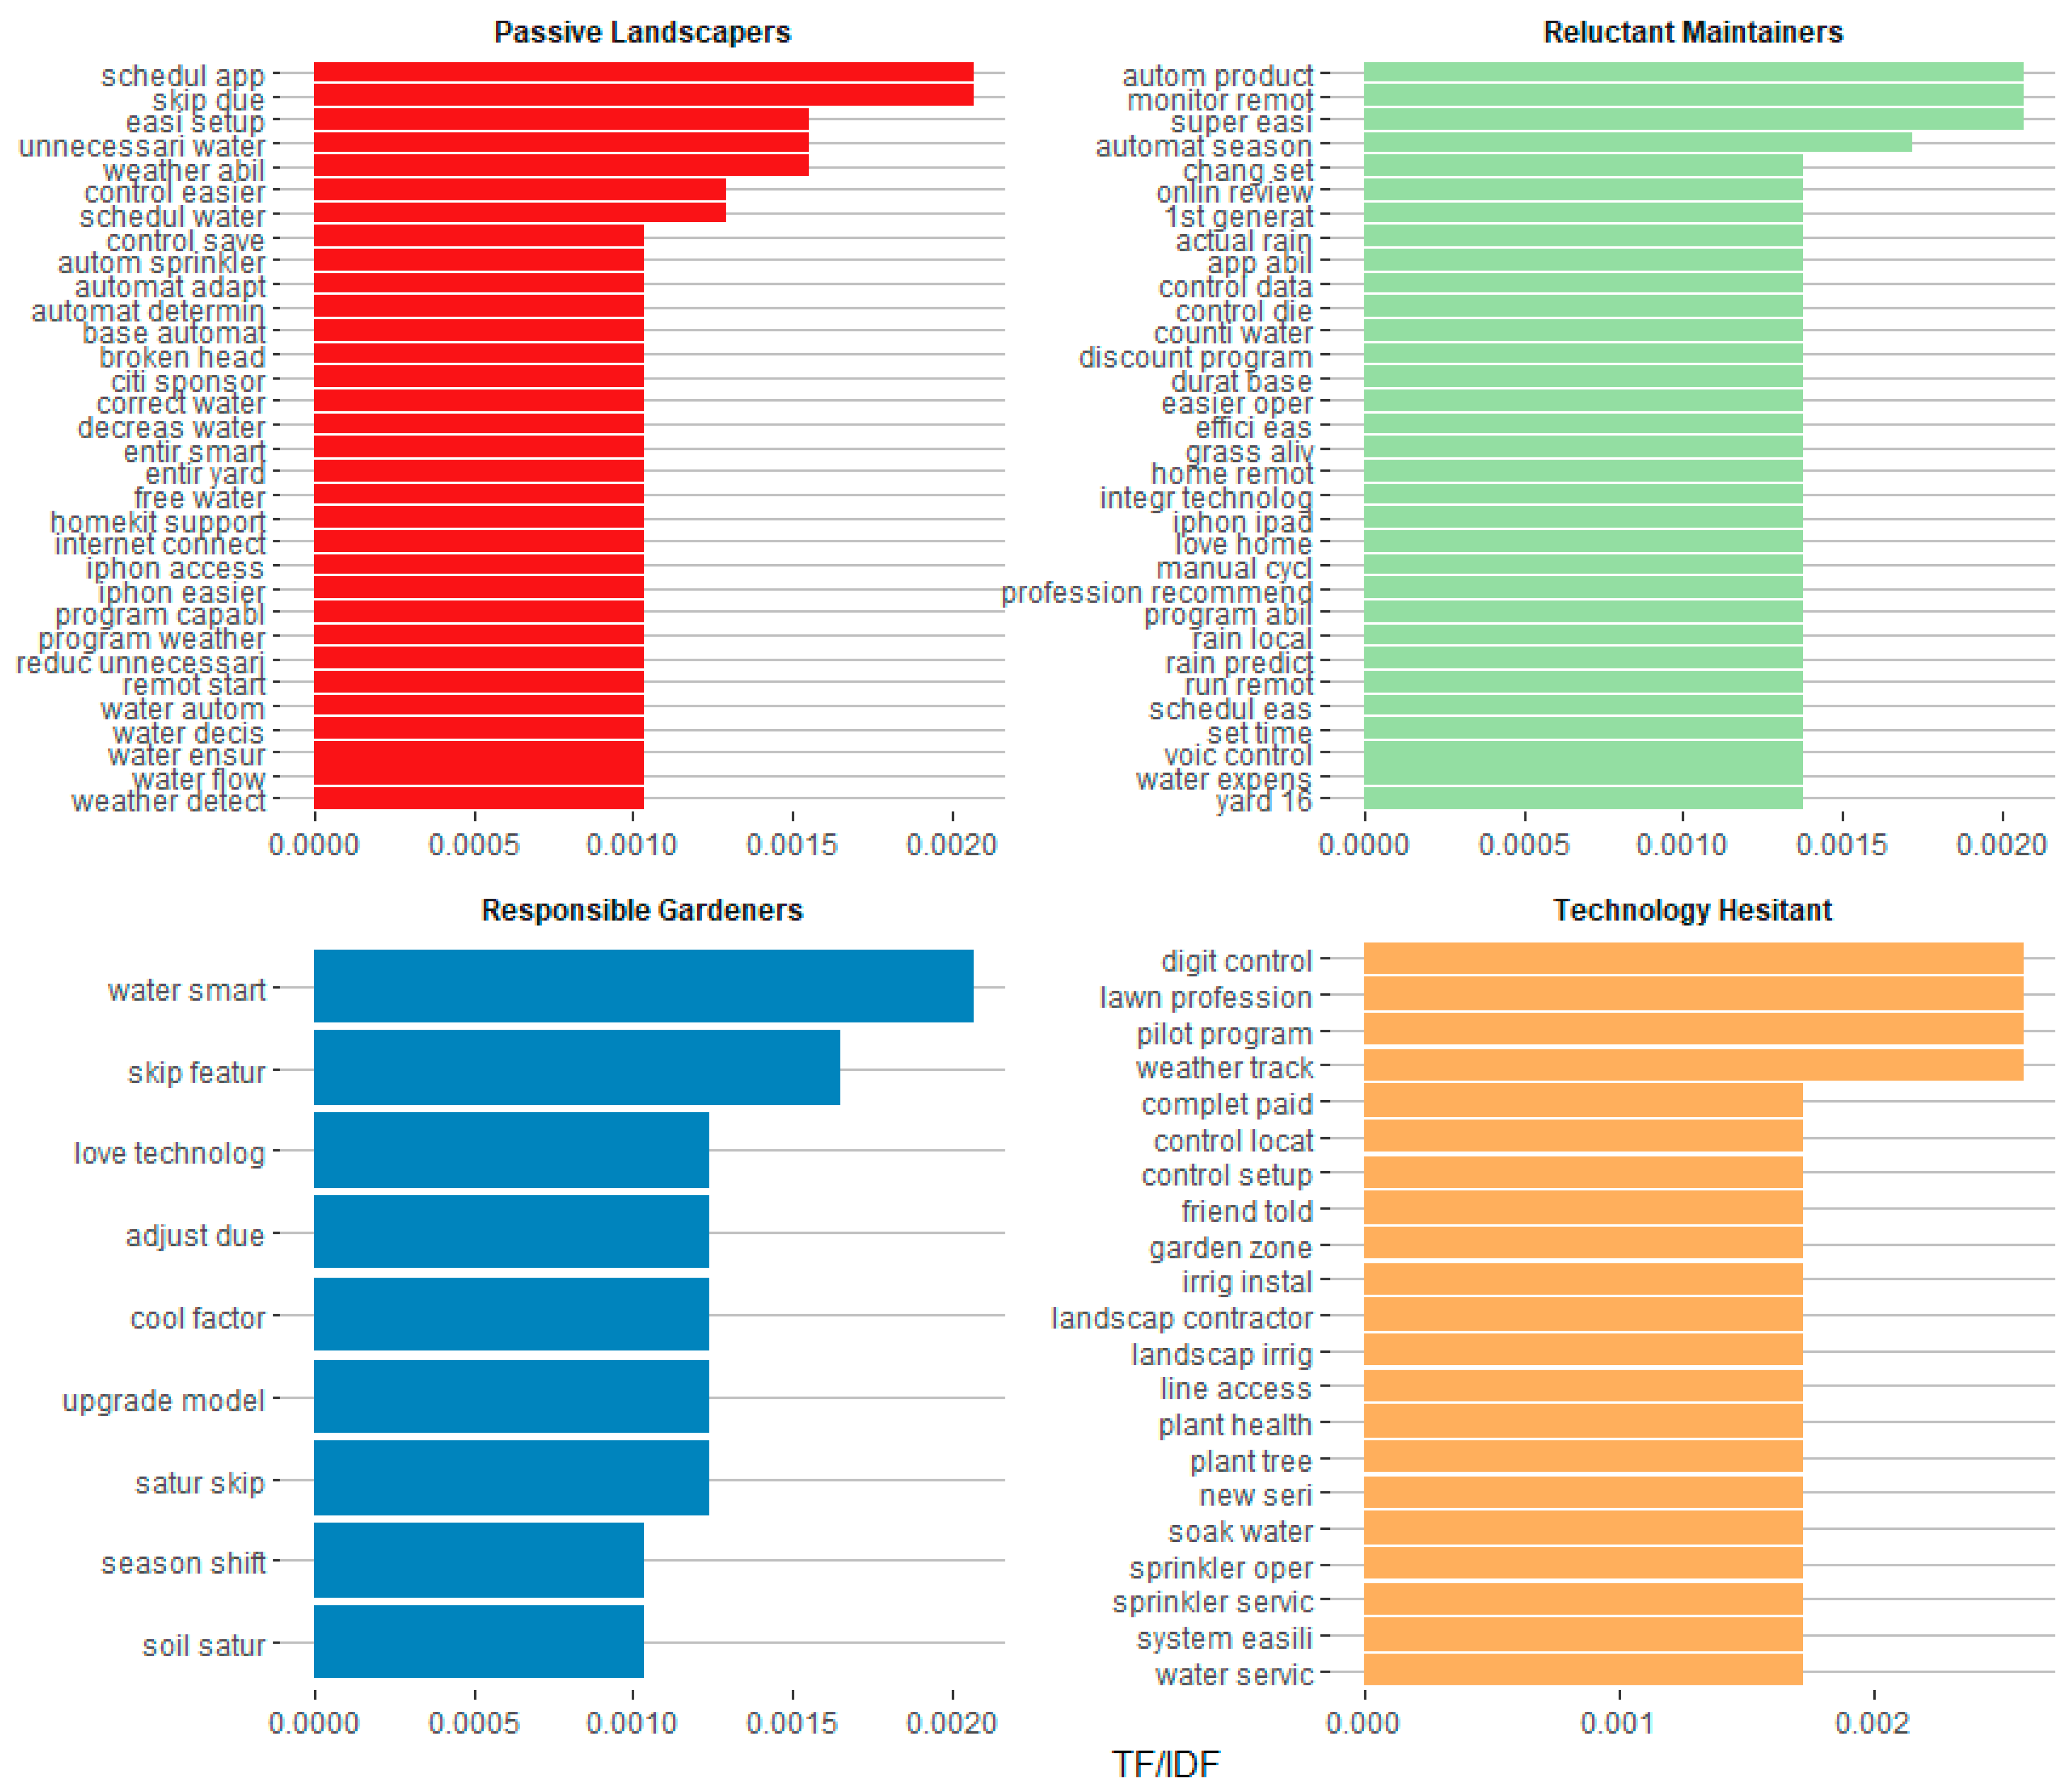
Over 90% of each cluster responded to the open-ended question, “Why did you purchase a smart sprinkler controller rather than a more basic type of controller?” Text frequency analysis revealed themes common to all clusters: saving water, remote control abilities, saving money, and replacing or comparing to a more basic controller (Table 5, Figure 5). Figure 6 compares the most distinctive terms for each cluster based on their tf/idf ratio (term frequency/inverse document frequency). Tf/idf identifies terms which are more representative of a particular cluster by inversely weighting their frequencies based on commonality across clusters. Therefore, terms which are unique to a particular cluster are weighted higher than terms found in all four clusters. These terms are more reflective of the overall cluster profiles. For example, the Technology Hesitant use phrases such as “pilot program, company recommend, and friend told”, which suggest reasons for overcoming their hesitancy. Responsible Gardeners use phrases such as “adjust due [to changing weather], saturation skip, and season shift”, which point to awareness of and concern about maintaining plant health during changing seasons. Passive Landscapers’ focus on water conservation is reflected in phrases such as “increasing water [savings], unnecessary water, and determine water”. Reluctant Maintainers refer to the features that make maintenance tasks easier or produce better outcomes, such as “automated season, easy efficiency, grass alive”.

4. Discussion

Understanding the motives and objectives of users of smart irrigation controllers can have two benefits for educators. It can enable educators to increase the device’s effectiveness as a tool for conservation by improving homeowners’ skills and knowledge, and it can enable educators to communicate multiple reasons to purchase the device to those who are considering the investment, assuming that these data represent the early adopters of this technology and their motives resonate with the remaining population (Rogers, 2010) [23]. Overall, the results suggest that there are four distinct groups with different motivations for purchasing and using a smart irrigation controller. Cluster profiles were consistent throughout the analysis such that interest level in the factors aligned with the supplemental demographic and behavioral data as well as the open-ended text responses. Furthermore, all respondents fit into one of these four groups and each group captures approximately 20–30% of the responses, making all groups well represented. For educators who wish to increase water conservation actions among smart irrigation device owners, these profiles can help them provide targeted and strategic information, skills, and peer support groups.
Responsible Gardeners’ cluster profile indicates intrinsic motivation and some expertise in gardening. Their frequent use of the app and their interest in maintaining their front and back yards suggest that these users are most likely to save water, if they knew how. They do not maintain their landscape for show exclusively; they also enjoy it. Factors which increase the likelihood of purchasing a smart irrigation controller include knowledge of soil types and irrigation rates, belief in the benefits of water conservation, and perception of benefits compared to a standard controller (Suh et al., 2017) [24]. Members of this cluster may resonate with technical aspects of the device such as the ability to fine tune irrigation schedules and any data or feedback the device may provide about vegetation irrigation requirements.
Social pressure to match landscaping aesthetics to neighborhood norms can be intense (Carrico et al., 2013; Fraser et al., 2013; Nassauer et al., 2009; Warner, 2021 [12,25,26,27]). Reluctant Maintainers seem to be influenced by these external pressures to have a well maintained landscape but are less likely to derive pleasure from the process as Responsible Gardeners. Messages encouraging this group to adopt a smart controller could emphasize benefits, such as how accurate watering can lead to healthier, better-looking landscaping with less effort, to motivate them to conserve water.
Education and training might also help the Technology Hesitant overcome their negative attitudes toward adopting new technology. Common factors associated with the purchase and use of other smart devices include perceived usefulness of the device (Hsu & Lin, 2016; Koo et al., 2015; Mani & Chouk, 2017; Shin et al., 2018) [28,29,30,31], and the perception that the device is compatible with a person’s values, lifestyle, and specific goals (Canhoto & Arp, 2017; Hsu & Lin, 2016; Shin et al., 2018) [28,31,32]. Considering that saving money, landscaping appearance, and conservation all scored higher for this cluster than their concerns about technology, this group seems highly motivated to see those benefits in this device.
Conservation may be a motivating factor for Passive Landscapers; however, their lackadaisical attitude toward landscaping makes it difficult to identify an attractive rationale to achieve water reduction goals. This group may benefit most from education programs that address procedural knowledge and skill. Many studies have emphasized the need for proper installation and initial program set up to optimize water conservation (Davis & Dukes, 2010; Dukes, 2012; Dukes, 2020; Mayer & DeOreo, 2010; McCready & Dukes, 2011) [33,34,35,36,37] and skill with technology to ensure continued use of the device (Mayer & DeOreo, 2010; McCready et al., 2009; Morera et al., 2017) [36,38,39]. Since Passive Landscapers report the least frequent engagement with the app, they are unlikely to make changes and adjustments to the watering schedule. Targeting this group early in the season with education on proper settings, basic plant care, and how to handle technical issues can help ensure they use the controllers to conserve water.
It would be easy to think that users of a device designed and marketed specifically for conservation would be solely motivated by conservation. However, we found that the level of conservation motivation varied by cluster and was not the highest factor for any cluster. With the exception of the Technology Hesitant, the technology itself was more attractive than the potential for water conservation. Responsible Gardeners had the highest centroid value for conservation of all the clusters (5.86), but it was the fourth highest value for their cluster, behind technology, saving money, and aesthetic benefits of their landscape. Passive Landscapers had the second highest value across clusters (5.53), but it was still second for them, just behind technology. Text analysis similarly followed this pattern, where “save water” and its different linguistic forms (“water save”, “water usage”, “water conserve”, etc.) were some of the most frequent terms across all clusters, but there were just as many, if not more, terms referring to technology-based aspects of the device (“remote control”, “smart control”, “smart features”, etc.). Because smart irrigation technology is still relatively new, it may be in an early phase of diffusion (Rogers, 2010) [23] and most of the participants in this study may be considered early adopters who will naturally be more interested in the novelty of the technology and be willing to take a risk (Rogers, 2010) [23]. This would also be consistent with the generally high interest in technology expressed by all clusters. Even the Technology Hesitant are more positive about technology than they are concerned, though they are likely to be Early Majority adopters, the next phase on the diffusion continuum, because they were convinced to invest by comments from peers.
Further investigations of smart irrigation controller users are necessary to determine if the different clusters and motivations correspond with different use patterns. Though no information on water use or irrigation behavior was provided for this study, owners of smart irrigation controllers fit the profile of high-water users which are often recommended as those who can benefit most from smart irrigation technology: wealthy, educated, live in a HOA, and have an in-ground irrigation system (Dukes, 2012; Endter-Wada et al., 2008; Huang et al., 2016; Mayer & DeOreo, 2010; Syme et al., 2004) [34,36,40,41,42]. Therefore, these are people for whom technology can achieve water conservation, and it would behoove educators to create programs that maximize the contribution that smart controllers can make. Determining interactions between pre-smart controller water use, motivation for using a smart controller, and post-smart controller water use could provide valuable insights for educators and enable them to maximize their efforts by targeting clusters that may still be struggling to meet water conservation goals. To motivate non-users to invest in smart irrigation controllers, it would be essential to understand the barriers to this purchase. Though there have been studies which explore potential owners’ feature preferences (Zhang and Khachatryan, 2019) [43] and willingness to pay for smart irrigation controllers (Khachatryan et al., 2019) [44], more information is needed to fully understand the motives of non-users.
The value of audience segmentation is considerable for educators who wish to address and promote sustainable behaviors (Warner 2017) [13]. The process described in this paper could be used to define clusters for any conserving technologies. There are likely to be a variety of motivations that spur users to make these investments, and their use and maintenance may require information, training, and support that educators could organize. Blending the power of technology in the 21st century with the urgent for conservation to achieve our sustainable development goals will require researchers and educators to look carefully at users’ motivations to efficiently design effective programs.

Author Contributions

Conceptualization, S.K. and M.C.M.; Formal analysis, S.K.; Writing—original draft, S.K. and M.C.M. All authors have read and agreed to the published version of the manuscript.

Funding

This research received no external funding.

Institutional Review Board Statement

Not applicable.

Informed Consent Statement

Not applicable.

Data Availability Statement

Data is not available.

Conflicts of Interest

The authors declare no conflict of interest.

References

  1. Monroe, M.C.; Plate, R.R.; Oxarart, A.; Bowers, A.; Chaves, W.A. Identifying effective climate change education strategies: A systematic review of the research. Environ. Educ. Res. 2017, 25, 791–812. [Google Scholar] [CrossRef]
  2. Kollmuss, A.; Agyeman, J. Mind the Gap: Why do people act environmentally and what are the barriers to pro-environmental behavior? Environ. Educ. Res. 2002, 8, 239–260. [Google Scholar] [CrossRef]
  3. Heimlich, J.E.; Ardoin, N.M. Understanding Behavior to Understand Behavior Change: A Literature Review. Environ. Educ. Res. 2008, 14, 215–237. [Google Scholar] [CrossRef]
  4. Monroe, M.C. Two avenues for encouraging conservation behaviors. Hum. Ecol. Rev. 2003, 10, 113–125. [Google Scholar]
  5. De Young, R. Expanding and evaluating motives for environmentally responsible behavior. J. Soc. Issues 2000, 56, 509–526. [Google Scholar] [CrossRef]
  6. Kaplan, S. Human nature and environmentally responsible behavior. J. Soc. Issues 2000, 56, 491–508. [Google Scholar] [CrossRef]
  7. Stern, P.C. Toward a coherent theory of environmentally significant behavior. J. Soc. Issues 2000, 56, 407–424. [Google Scholar] [CrossRef]
  8. Murtagh, N.; Gatersleben, B.; Uzzell, D. 20:60:20—Differences in Energy Behaviour and Conservation between and within Households with Electricity Monitors. PLoS ONE 2014, 9, e92019. [Google Scholar] [CrossRef]
  9. Wilson, C.; Hargreaves, T.; Hauxwell-Baldwin, R. Smart homes and their users: A systematic analysis and key challenges. Pers. Ubiquitous Comput. 2015, 19, 463–476. [Google Scholar] [CrossRef]
  10. Hargreaves, T.; Nye, M.; Burgess, J. Making energy visible: A qualitative field study of how householders interact with feedback from smart energy monitors. Energy Policy 2010, 38, 6111–6119. [Google Scholar] [CrossRef]
  11. Yang, R.; Newman, M.W. Learning from a learning thermostat: Lessons for intelligent systems for the home. In Proceedings of the 2013 ACM International Joint Conference on Pervasive and Ubiquitous Computing—UbiComp ’13, Zurich, Switzerland, 8–12 September 2013; p. 93. [Google Scholar] [CrossRef]
  12. Warner, L.A. Who conserves and who approves? Predicting water conservation intentions in urban landscapes with referent groups beyond the traditional ‘important others’. Urban For. Urban Green. 2021, 60, 127070. [Google Scholar] [CrossRef]
  13. Warner, L.A.; Chaudhary, A.K.; Rumble, J.N.; Lamm, A.J.; Momol, E. Using Audience Segmentation to Tailor Residential Irrigation Water Conservation Programs. J. Agric. Educ. 2017, 58, 313–333. [Google Scholar] [CrossRef]
  14. McKenzie-Mohr, D.; Schultz, P.W. Choosing Effective Behavior Change Tools. Soc. Mark. Q. 2014, 20, 35–46. [Google Scholar] [CrossRef]
  15. R Core Team. R: A Language and Environment for Statistical Computing. R Foundation for Statistical Computing. 2020. Available online: https://www.R-project.org (accessed on 1 March 2023).
  16. Revelle, W. Psych: Procedures for Psychological, Psychometric, and Personality Research; Northwestern University: Evanston, IL, USA, 2020; Available online: https://CRAN.R-project.org/package=psych (accessed on 1 March 2023).
  17. Smith, R. Audience Segmentation Techniques. Oxford Research Encyclopedia of Communication. Available online: https://oxfordre.com/communication/view/10.1093/acrefore/9780190228613.001.0001/acrefore-9780190228613-e-321 (accessed on 9 May 2023).
  18. Mouselimis, L. ClusterR: Gaussian Mixture Models, K-Means, Mini-Batch-Kmeans, K-Medoids and Affinity Propagation Clustering. 2020. Available online: https://CRAN.R-project.org/package=ClusterR (accessed on 1 March 2023).
  19. Pham, D.T.; Dimov, S.S.; Nguyen, C.D. Selection of K in K-means clustering. Proc. Inst. Mech. Eng. Part C J. Mech. Eng. Sci. 2005, 219, 103–119. [Google Scholar] [CrossRef]
  20. Brock, G.; Pihur, V.; Datta, S.; Datta, S. ClValid: An R Package for Cluster Validation. J. Stat. Softw. 2008, 25, 1–22. [Google Scholar] [CrossRef]
  21. Nieweglowski, L. Clv: Cluster Validation Techniques. 2020. Available online: https://CRAN.R-project.org/package=clv (accessed on 1 March 2023).
  22. Silge, J.; Robinson, D. tidytext: Text Mining and Analysis Using Tidy Data Principles in R. J. Open Source Softw. 2016, 1, 37. [Google Scholar] [CrossRef]
  23. Rogers, E.M. Diffusion Of Innovations, 4th ed.; Free Press: Los Angeles, CA, USA, 2010; Available online: http://rbdigital.oneclickdigital.com (accessed on 5 March 2023).
  24. Suh, D.; Khachatryan, H.; Rihn, A.; Dukes, M. Relating Knowledge and Perceptions of Sustainable Water Management to Preferences for Smart Irrigation Technology. Sustainability 2017, 9, 607. [Google Scholar] [CrossRef]
  25. Carrico, A.R.; Fraser, J.; Bazuin, J.T. Green with Envy: Psychological and Social Predictors of Lawn Fertilizer Application. Environ. Behav. 2013, 45, 427–454. [Google Scholar] [CrossRef]
  26. Fraser, J.C.; Bazuin, J.T.; Band, L.E.; Grove, J.M. Covenants, cohesion, and community: The effects of neighborhood governance on lawn fertilization. Landsc. Urban Plan. 2013, 115, 30–38. [Google Scholar] [CrossRef]
  27. Nassauer, J.I.; Wang, Z.; Dayrell, E. What will the neighbors think? Cultural norms and ecological design. Landsc. Urban Plan. 2009, 92, 282–292. [Google Scholar] [CrossRef]
  28. Hsu, C.-L.; Lin, J.C.-C. An empirical examination of consumer adoption of Internet of Things services: Network externalities and concern for information privacy perspectives. Comput. Hum. Behav. 2016, 62, 516–527. [Google Scholar] [CrossRef]
  29. Koo, C.; Chung, N.; Nam, K. Assessing the impact of intrinsic and extrinsic motivators on smart green IT device use: Reference group perspectives. Int. J. Inf. Manag. 2015, 35, 64–79. [Google Scholar] [CrossRef]
  30. Mani, Z.; Chouk, I. Drivers of consumers’ resistance to smart products. J. Mark. Manag. 2017, 33, 76–97. [Google Scholar] [CrossRef]
  31. Shin, J.; Park, Y.; Lee, D. Who will be smart home users? An analysis of adoption and diffusion of smart homes. Technol. Forecast. Soc. Chang. 2018, 134, 246–253. [Google Scholar] [CrossRef]
  32. Canhoto, A.I.; Arp, S. Exploring the Factors That Support Adoption and Sustained Use of Health and Fitness Wearables. J. Mark. Manag. 2017, 33, 32–60. [Google Scholar] [CrossRef]
  33. Davis, S.L.; Dukes, M.D. Irrigation scheduling performance by evapotranspiration-based controllers. Agric. Water Manag. 2010, 98, 19–28. [Google Scholar] [CrossRef]
  34. Dukes, M.D. Water conservation potential of landscape irrigation smart controllers. Trans. ASABE 2012, 55, 563–569. [Google Scholar] [CrossRef]
  35. Dukes, M.D. Two decades of smart irrigation controllers in U.S. landscape irrigation. Trans. ASABE 2020, 63, 1593–1601. [Google Scholar] [CrossRef]
  36. Mayer, P.; DeOreo, W.B. Improving urban irrigation efficiency by using weather-based “smart” controllers. Am. Water Work. Assoc. J. 2010, 102, 86. [Google Scholar] [CrossRef]
  37. McCready, M.S.; Dukes, M.D. Landscape irrigation scheduling efficiency and adequacy by various control technologies. Agric. Water Manag. 2011, 98, 697–704. [Google Scholar] [CrossRef]
  38. McCready, M.S.; Dukes, M.D.; Miller, G.L. Water conservation potential of smart irrigation controllers on St. Augustinegrass. Agric. Water Manag. 2009, 96, 1623–1632. [Google Scholar] [CrossRef]
  39. Morera, M.C.; Monaghan, P.F.; Dukes, M.D.; Breder, E. Predicting Satisfaction with Smart Irrigation Controllers and Their Long-Term Use among Homeowners in Central Florida. JAWRA J. Am. Water Resour. Assoc. 2017, 53, 929–943. [Google Scholar] [CrossRef]
  40. Endter-Wada, J.; Kurtzman, J.; Keenan, S.P.; Kjelgren, R.K.; Neale, C.M.U. Situational Waste in Landscape Watering: Residential and Business Water Use in an Urban Utah Community. JAWRA J. Am. Water Resour. Assoc. 2008, 44, 902–920. [Google Scholar] [CrossRef]
  41. Huang, P.; Lamm, A.; Dukes, M. Informing Extension Program Development through Audience Segmentation: Targeting High Water Users. J. Agric. Educ. 2016, 57, 60–74. [Google Scholar] [CrossRef]
  42. Syme, G.J.; Shao, Q.; Po, M.; Campbell, E. Predicting and understanding home garden water use. Landsc. Urban Plan. 2004, 68, 121–128. [Google Scholar] [CrossRef]
  43. Zhang, X.; Khachatryan, H. Investigating Homeowners’ Preferences for Smart Irrigation Technology Features. Water 2019, 11, 1996. [Google Scholar] [CrossRef]
  44. Khachatryan, H.; Suh, D.; Xu, W.; Useche, P.; Dukes, M.D. Towards sustainable water management: Preferences and willingness to pay for smart landscape irrigation technologies. Land Use Policy 2019, 85, 33–41. [Google Scholar] [CrossRef]
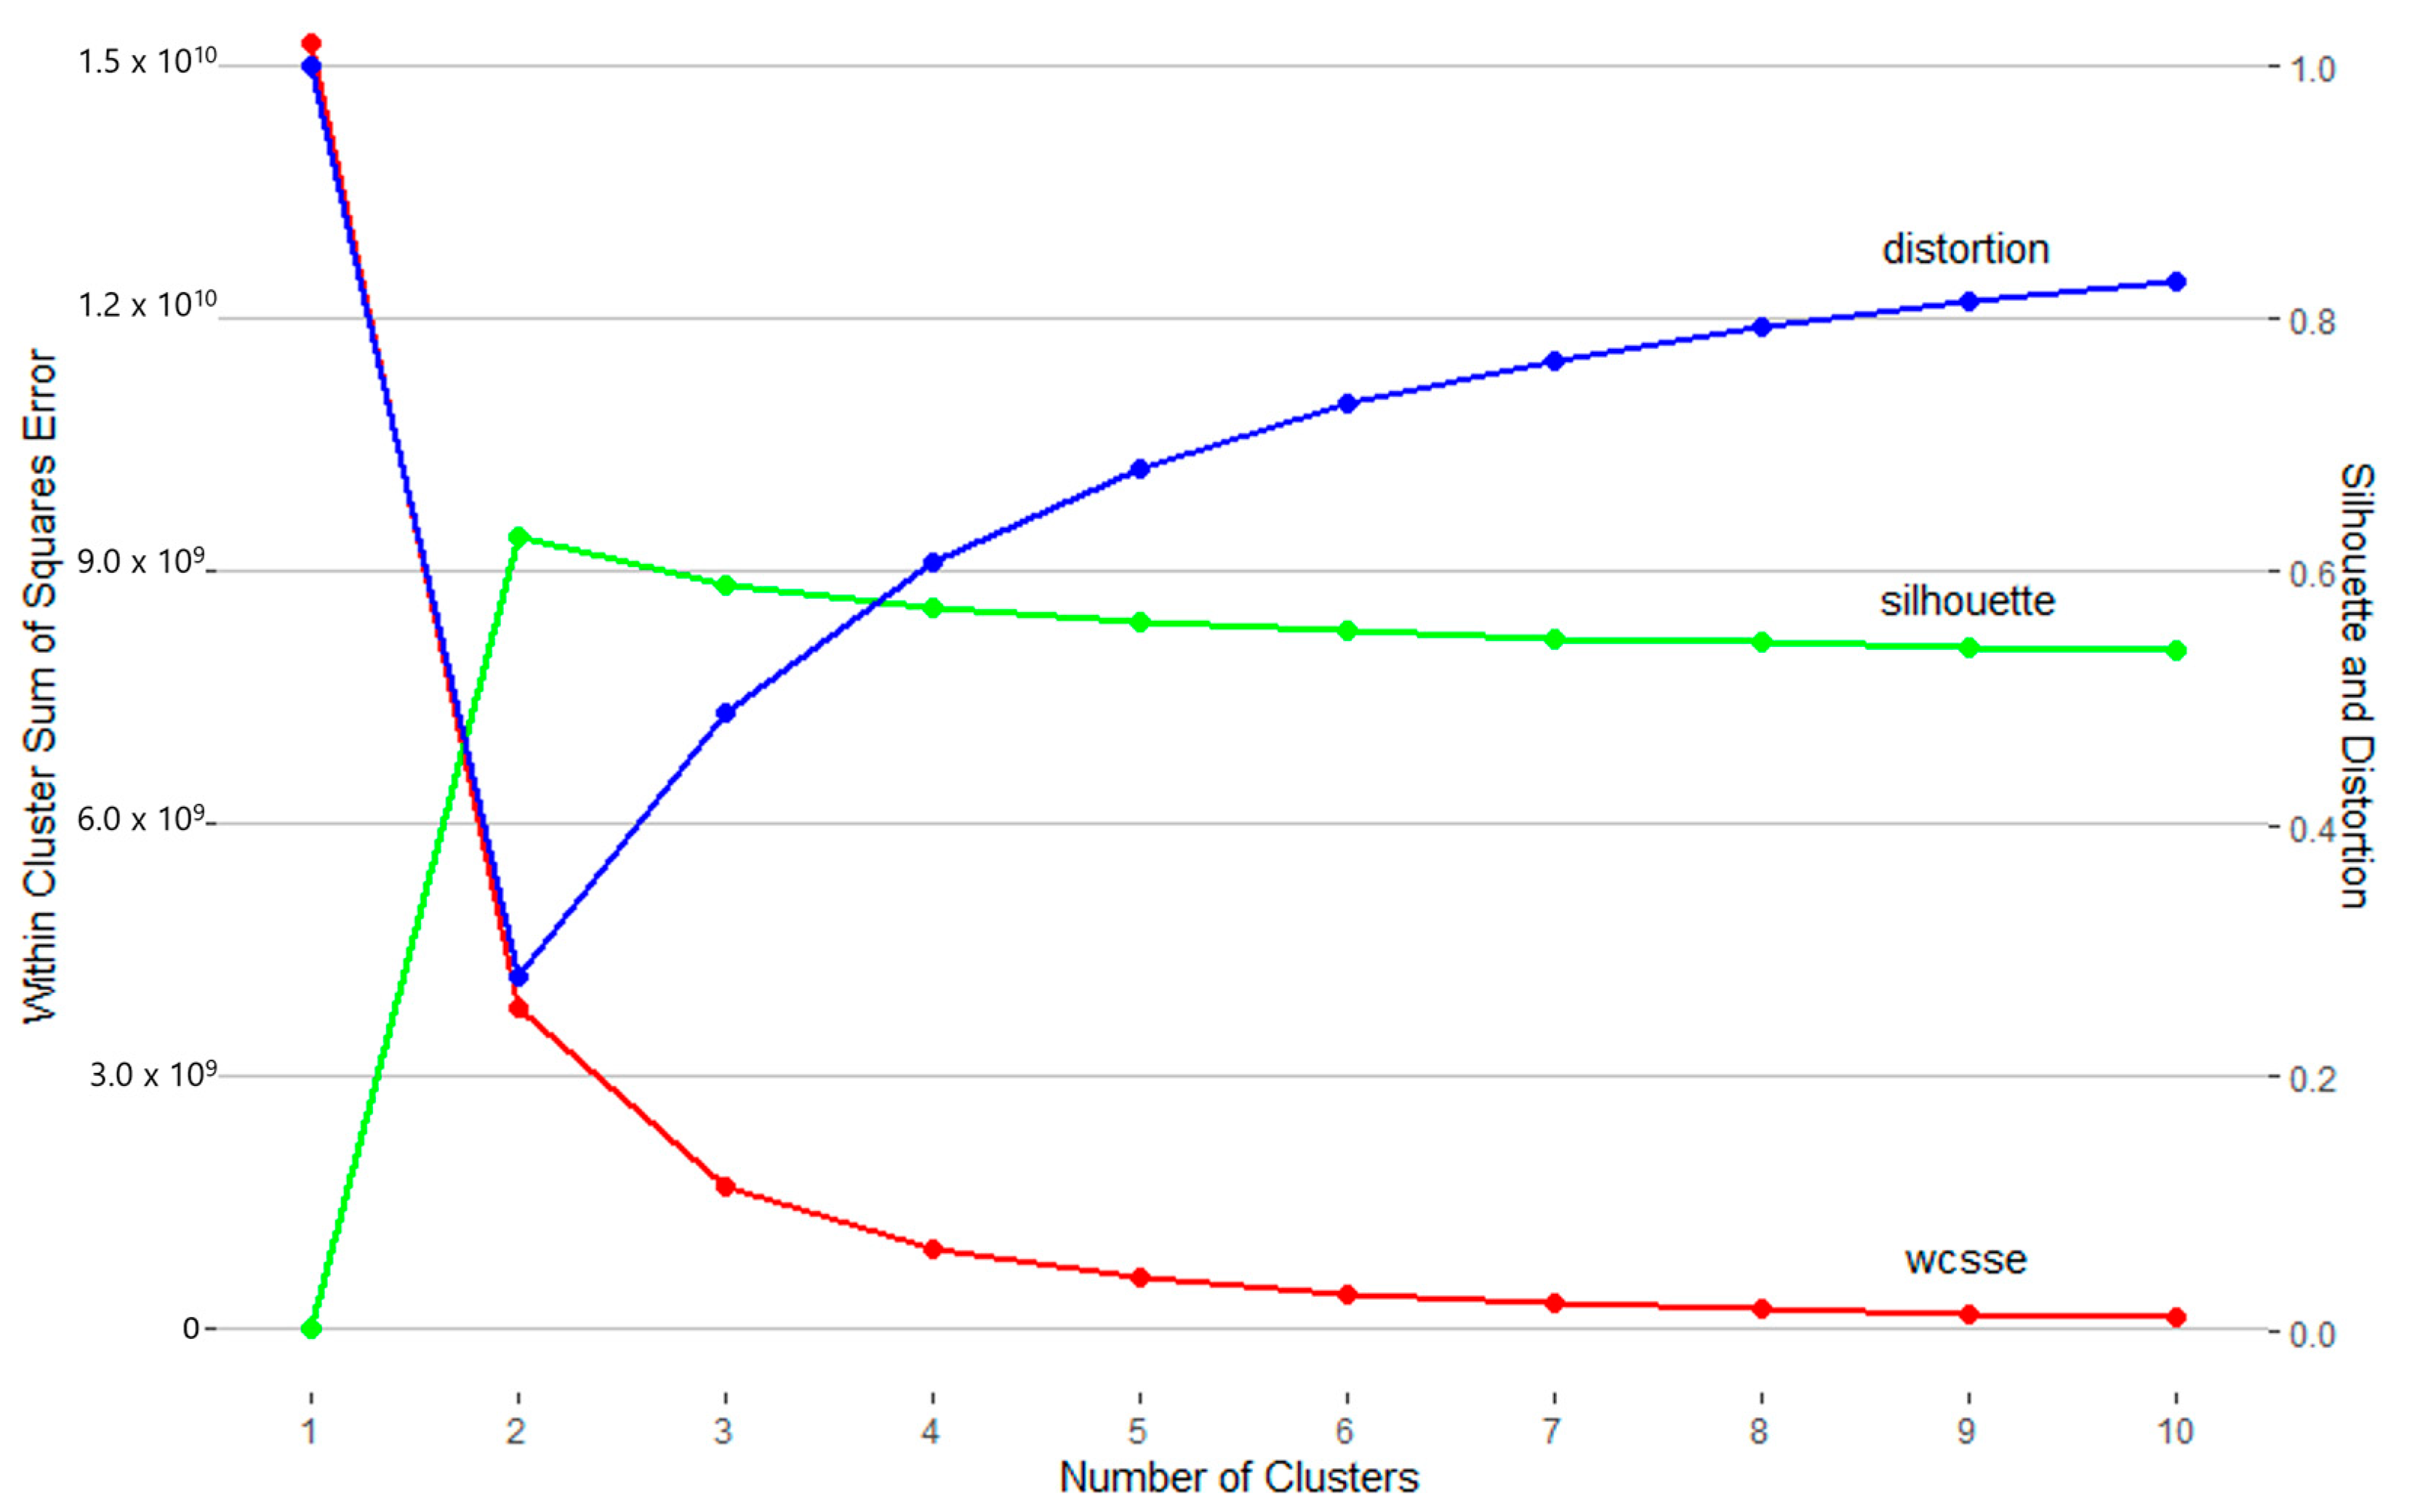
Figure 1. Indicators for choosing the number of clusters for k-means.
Sustainability 15 08443 g001
Figure 2. Centroid graph of cluster groups.
Sustainability 15 08443 g002
Figure 3. Reported landscaping activities by cluster.
Sustainability 15 08443 g003
Figure 4. Time spent on each activity in a year. Estimated using responses to the following questions: “How often is this activity done during a typical season?” and “How long does it take to complete this each time?”. Responses were offered in ordinal categories (e.g., daily, once a week, 31–60 min, 61–90 min), so midpoints were used, and the calculations were extrapolated to a 12-month season.
Sustainability 15 08443 g004
Figure 5. The most frequently used phrases (word stems) for all respondents of the question “Why did you purchase a smart sprinkler controller rather than a more basic type of controller?”.
Sustainability 15 08443 g005
Figure 6. The most unique phrases (word stems), as determined by their tf/idf ratio, for each cluster in response to the question “Why did you purchase a smart sprinkler controller rather than a more basic type of controller?”.
Sustainability 15 08443 g006
Table 1. Factor groups with loadings, eigenvalues, and Cronbach’s alpha levels.
Factor
Eigenvalue
1
3.37
2
3.10
3
2.79
4
2.21
5
1.56
6
1.54
Cronbach’s Alpha
Maintaining my yard is my favorite hobby0.76 0.76
Maintaining my yard is relaxing0.74
People often ask me for advice about their yards and landscaping0.66
Maintaining my yard is a chore I dread *−0.56
I know everything I need to know to maintain my yard the way I want it0.50
I try out new things in my landscaping every season0.43
I wish I could maintain my yard with less work−0.32
I’m always looking for the latest and greatest technology 0.76 0.80
I’m very interested in home automation and “smart home” technology 0.72
People often ask me advice about tech products 0.67
I’m excited about “smart home” technology 0.63
Technology and data could be helpful in improving my landscaping 0.38
The best part of technology is that it takes care of things so I don’t have to 0.36
I’m willing to invest in efforts to reverse climate change and help the environment 0.83 0.83
I believe we all have a responsibility to conserve the earth’s natural resources 0.78
I’ll do anything I can to help protect the earth 0.76
Aside from the cost, wasting water at home has a major impact on the environment 0.70
No matter how much water I use at home, it won’t have an impact on large-scale environmental issues like drought * −0.47
A beautiful yard has a big impact on my home value 0.63 0.79
Being able to enjoy a beautiful yard is a key part of my emotional well-being 0.50
Maintaining my yard gives me a great sense of accomplishment 0.46
My yard makes me proud 0.42
I want to have the best-looking yard in the neighborhood 0.39
I’m always looking for ways to save money on my utility bills 0.77 0.64
It’s important for me to save money on water usage at home 0.68
I am very focused on increasing the value of my home 0.32
“Smart” products are too complicated 0.640.67
New technology often frustrates me 0.57
I usually buy new technology only when my tried-and-true solutions don’t work any more 0.41
Most of the tech products I see are things I don’t need 0.33
* Items which have negative factor loadings were reverse coded before factor scores were computed.
Table 2. Comparison of cluster metrics.
Indicator2 Clusters3 Clusters4 Clusters
Davies–Bouldin1.571.571.50
Dunn Index0.0230.0250.027
Table 3. Centroid values for each cluster.
FactorResponsible GardenersTechnology HesitantReluctant MaintainersPassive Landscapers
Interest in landscape maintenance4.353.873.52.57
Interest in technology6.354.815.796.06
Interest in conservation5.865.23.385.53
Concerns about technology2.273.982.432.35
Interest in saving money and increasing home value6.285.394.975.51
Aesthetic benefits6.205.295.114.49
Table 4. Cluster Profiles.
Responsible GardenersTechnology HesitantReluctant MaintainersPassive LandscapersStatistic
Age (mean/median)48.8/4754.3/5650.2/4947.8/45F= 115.8, df = 3, p = 0.0
Gender:
  Male
  Female
  Self-describe

91.0%
8.7%
0.1%

78.8%
19.5%
0.3%

95.0%
4.4%
0.1%

91.9%
7.4%
0.1%

Χ2 = 185.9,
df = 3, p = 0.0
Education:
  college graduate
  advanced degree

46.4%
31.4%

40.8%
41.7%

46.7%
34.5%

44.7%
37.4%
Χ2 = 26.7,
df = 3, p = 0.0
Location:
  California
  Texas
  Colorado
  midwest
  northeast
  south
  west

24.1%
15.2%
9.8%
13.5%
9.2%
14.2%
14.1%

27.6%
13.7%
9.2%
11.9%
7.8%
13.6%
16.2%

20.9%
16.4%
8.1%
14.6%
9.0%
15.0%
15.9%

28.7%
16.7%
8.9%
11.4%
6.5%
13.2%
14.7%
Χ2 = 16.1,
df = 6, p = 0.01

Χ2 = 30.5,
df = 12, p = 0.0
Season length-months (mean)7.57.27.47.8
HOA50.1%46.3%51.0%50.3%Χ2 = 6.6,
df = 3, p = 0.08
Other smart devices owned (mean, 0–9)5.03.14.84.8F = 224,
df = 3, p = 0.0
Yard size
  small <4000 ft2
  med 4–10,000 ft2
  med-large 10–22,000 ft2

18.6%
42.0%
22.7%

24.6%
39.6%
20.3%

19.0%
39.3%
25.0%

27.5%
42.6%
19.1%
Χ2 = 48.1,
df = 6, p = 0.0
Years owned smart controller (mean)1.91.81.92.0
Engagement with app
  2–4 x/week
  Once/week
  2–3 x/month
  Once/month

30.4%
26.6%
17.0%
14.9%

23.5%
27.1%
16.8%
18.2%

24.7%
28.8%
18.0%
18.6%

16.0%
25.6%
22.5%
29.0%
Χ2 = 166.4,
df = 9, p = 0.0
Landscape maintenance
  num. of activities (mean, 1–7)
  hires out 75 + % of activities
  hours per year on maint. act.

6.0
9.2%
109.4

5.2
11.5%
99.8

5.9
13.2%
83.5

5.2
19.9%
71.2
Appearance:
  equal importance
  front yard more important
  back yard more important

67.7%
26.3%
6.0%

63.5%
28.6%
7.9%

57.7%
36.1%
6.2%

55.1%
38.3%
6.6%
Investment:
  equal investment
  front yard gets more
  back yard gets more

62.7%
19.6%
17.6%

60.3%
20.4%
19.3%

59.2%
24.6%
16.2%

54.8%
24.6%
20.6%
Table 5. Summary data for responses to the open-ended question “Why did you purchase a smart sprinkler controller rather than a more basic type of controller?”.
Responsible GardenersTechnology HesitantReluctant MaintainersPassive LandscapersAll
Total response17031112114713335295
94.5%91.7%93.3%92.8%93.2%
Words used (mean)12.49.811.612.511.7
Most frequent wordscontrol (n = 780)control (n = 431)control (n = 466)water (n = 646)control (n = 2309)
water (n = 768)water (n = 370)water (n = 401)control (n = 632)water (n = 2185)
save (n = 285)save (n = 139)smart (n = 159)save (n = 232)save (n = 764)
smart (n = 257)weather (n = 104)weather (n = 146)weather (n = 205)smart (n = 703)
weather (n = 248)smart (n = 97)remote (n = 132)smart (n = 190)weather (n = 703)
Most frequent phrasesave water (n = 203)save water (n = 97)save water (n = 64)save water (n = 157)save water (n = 521)
basic controller* (n = 55)remote control (n = 41)remote control (n = 51)water schedule (n = 47)remote control (n = 236)
remote control (n = 83)smart control (n = 38)basic controller * (n = 29)basic controller * (n = 44)basic controller * (n = 160)
smart home (n = 40)basic controller * (n = 32)water schedule (n = 28)remote control (n = 38)smart control (n = 123)
save money (n = 36)save money (n = 19)save money (n = 23)save money (n = 38)save money (n = 116)
* The phrase “basic controller” is typically in the context of replacing or upgrading from a basic controller to a smart controller, though occasionally referenced in comparison (e.g., “it has features that the basic controllers don’t”).
Disclaimer/Publisher’s Note: The statements, opinions and data contained in all publications are solely those of the individual author(s) and contributor(s) and not of MDPI and/or the editor(s). MDPI and/or the editor(s) disclaim responsibility for any injury to people or property resulting from any ideas, methods, instructions or products referred to in the content.