Article

Research on the Healing Effect Evaluation of Campus’ Small-Scale Courtyard Based on the Method of Semantic Differential and the Perceived Restorative Scale

School of Mechanics and Civil Engineering, China University of Mining and Technology (Beijing), Beijing 100083, China
*
Author to whom correspondence should be addressed.
Sustainability 2023, 15(10), 8369; https://doi.org/10.3390/su15108369
Submission received: 1 April 2023 / Revised: 9 May 2023 / Accepted: 18 May 2023 / Published: 22 May 2023
(This article belongs to the Special Issue Health, Wellbeing and Environmental Benefits of Contact with Nature)

Abstract

:
Many studies have proven that campus green space has healing effects, but there are few evaluation studies on the healing effects of a small-scale courtyard landscape on a high-density campus. This research comprehensively employs the method of semantic differential (SD method) and the perceived restorative scale (PRS) to construct an evaluation framework based on environmental preference and restorative evaluation in order to quantify the healing capability of small-scale campus landscapes. The findings demonstrate the following: (1) Plants close to or higher than human visual height, such as trees or shrubs, will lead to a better healing effect than lawns. An irregular layout of the plants can also bring a more beautiful aesthetic and better light than a monotonous layout, thus more strongly diverting people’s attention from pressure. (2) Users’ preferences for activity space do not depend on the scale of the activity space. (3) “Perceived quality” and “Experienced quality” represent the healing quality of the courtyard in terms of abstract feelings or atmospheres that are difficult to distinguish directly. In addition to expanding and deepening the concept of restorative space elements, this research provides some guidance for the design of healing courtyards in high-density campus environments.

1. Introduction

1.1. Research on the Healing Effect of the Environment in Colleges

Physical environments that promote bodily health and mental well-being are referred to as healing environments [1]. Healing environment theories mainly include Kaplan’s Attention Restorative Theory (ART) [2,3] and Ulrich’s Stress Reduction Theory (SRT) [4,5]. ART indicates that nature can restore human cognition, and SRT indicates that contact with nature can promote stress relief. Specifically, the restorative effect of the environment on individuals is primarily demonstrated in three aspects: emotion, cognitive ability, and subjective comprehensive evaluation. In recent years, there has been research on the healing ability of various environments: Hartig et al. confirmed that the green spaces between houses and urban green walkways serve a spiritual building function [6,7]; Ulrich et al. revealed that gardens outside ICU wards can contribute to reducing anxiety and tension [8]; Wells et al. confirmed the connection between the naturalness of the home setting and the cognitive function of children from low-income urban households [9]; and Mathew et al. corroborated the relationship between weekly visits to nature and people’s well-being through a nationally representative population survey in Britain [10]. These studies have proven that the natural environment, with its green landscape and blue sky, can have a healing effect on people’s physical and mental health.
College campus courtyards are the main locations for the leisure and social activities of students in their spare time. In a conventional campus courtyard design, the function of activities is the main purpose. The scale and quality of the activity space that the courtyard can offer are used as the measurement indices. The empirical components of design also remain in physical measurements or behavior inductions [11,12,13,14], and many campus courtyards operate only as traffic buffer spaces and sports spaces. With the gradual development of the field of healing environment research and the increasing emphasis on mental health in society, the healing value of campus green spaces has been gradually confirmed. For exmaple, Francis showed that approximately 75% of college students enjoy going outdoors and into natural environments when they are experiencing anxiety and depression [15]. Foellmer et al. revealed the relationship between campus green spaces and students’ well-being by studying the Hofgarten green space (7.5 hectares) at the University of Bonn, Germany, and pointed out that large and clean green spaces with beautifully arranged trees and a better view of iconic buildings have the functions of restoring attention, awakening emotions, and stimulating a sense of social belonging [16]. Ying et al. revealed the relationship between the characteristics of campus green spaces (the Shannon–Wiener index, the green rate, and the richness of spatial factors) and place dependence; they also proved that campus green spaces can promote the mental health of college students [17]. Liu et al. evaluated the naturalness of eight college campus green spaces (the minimum area is 218,700 m2, and the maximum area is 1,056,621 m2), including their dimensions, landscape elements, landscape interface elements, etc. Their study indicated that there is a substantial correlation between the naturalness of the university and emotional responses, physiological responses, and cognitive and behavioral reactions [18]. Previous research has mainly concentrated on the backgrounds of low-density university campuses with vast natural areas, whereas high-density university campuses have more small-scale courtyard environments with small areas, compact layouts, and surrounding buildings. Although there are few studies on the healing effects of these small-scale college courtyard spaces, scholars have realized that the healing effect of small courtyards adjacent to people’s workplaces, study areas, and lives in general is significant [19,20,21].
Previous research has mainly concentrated on the backgrounds of low-density university campuses with vast natural areas, whereas high-density university campuses have more small-scale courtyard environments with small areas, compact layouts, and surrounding buildings. Moreover, scholars have realized that small courtyards close to people’s workplaces, study areas, and lives have more remarkable healing effects; for example, Hongwu Du et al. found that sky courtyards in urban high-rise buildings have certain healing effects, and different forms of sky courtyards have different healing effects [19], while Guang Yang’s research pointed out that micro-healing spaces in the city can play a healing role through sensory stimulation and healing activities [20]. Additionally, Jien Wen Chien et al. established a relationship between urban open spaces and adult renal function. The results of logistic regression models demonstrated that open spaces in the city have the ability to protect physical health, and open spaces with natural plants can have more obvious effects [21]. Based on the existing research, this study takes the psychological health problems of college students as the direction and small-scale campus courtyards as the research object. The following hypotheses for the healing ability of small-scale campus courtyards can be put forward as:
  • The layout and spatial forms of different plants bring about different healing effects;
  • The placement of activity spaces has an impact on the healing effect of the courtyard;
  • The healing ability of the environment may be related to the manner of perception of the user: the healing effect brought about by direct visual feeling and that by indirect desire for activity may be different.
According to these hypotheses, the research will be carried out based on the evaluation of a space environment’s healing efficiency.

1.2. Researches on Environmental Healing Capability Evaluation

Numerous studies have been conducted to assess the healing capability of people’s surroundings. For illustration, based on the investigation of the Yangtze River Delta, Luo et al. developed a comprehensive evaluation system for this area based on four dimensions (residential attributes, residential satisfaction, residential preference, and residential choice factors) [22]. Jiang et al. built a residential green space healing capacity assessment model based on the connection between the number of visits to residential quarter green space (RQGS) and inhabitants’ life fulfillment [23]. Zhu et al. established a healing impact evaluation model based on “people as the subject” to evaluate the healing environment based on the index measurements of “psychological dimension” and “physiological dimension” [24]. Wang et al. used subjective surveys to comprehensively analyze self-rated physical health (SRPH) and self-rated mental health (SRMH) in order to build a healing capability evaluation model based on community facilities and the neighboring environment [25]. Although these evaluation models incorporate some degree of environmental preference, restorative evaluation, and health benefits to a certain extent, there is a lack of research on the relationships and mechanisms of the three components. Aiming to identify the relationships and mechanisms of the three, Liu et al. proposed a health benefit assessment model for the restorative assessment of natural environment users [26]. In accordance with the model, the evaluation of the healing capacity of the environment occurred at three levels: environmental preference, restorative evaluation, and health benefit evaluation. Restorative evaluation and health benefit evaluation can both be promoted by environmental preference, and restorative evaluation can also be promoted by health benefit evaluation. The three parts together constitute the environmental healing capability evaluation. This evaluation model solves the problems of the traditional evaluation models, such as unclear hierarchy logic and narrow coverage, so the healing capability of small-scale campus courtyards can be evaluated based on this evaluation model.
In the past, most of the evaluation methods of environmental healing capability were based on a single level, such as using the semantic differential method (SD method) to analyze the preferences for green spaces environments [27,28], or the Perceived Restorative Scale (PRS) by Hartig et al. to perform recovery evaluations on these environments [29,30]. Health benefit assessment requires the use of scales and other means to obtain changes in psychological indicators, or the use of measuring instruments to obtain changes in physiological indicators in order to represent health benefits [31,32,33,34]. This study integrates environmental preference evaluation and restorative evaluation, and uses the SD method to evaluate the ornamental value, uniqueness, and activity elements of three small-scale courtyards on a campus to explore the relationship between different factors (plant layout, special form, activity factors, etc.) of small-scale courtyards and their healing effect. Furthermore, it provides a reference for the design of healing-oriented, small-scale campus courtyards.

2. Materials and Methods

2.1. Study Area and Samples

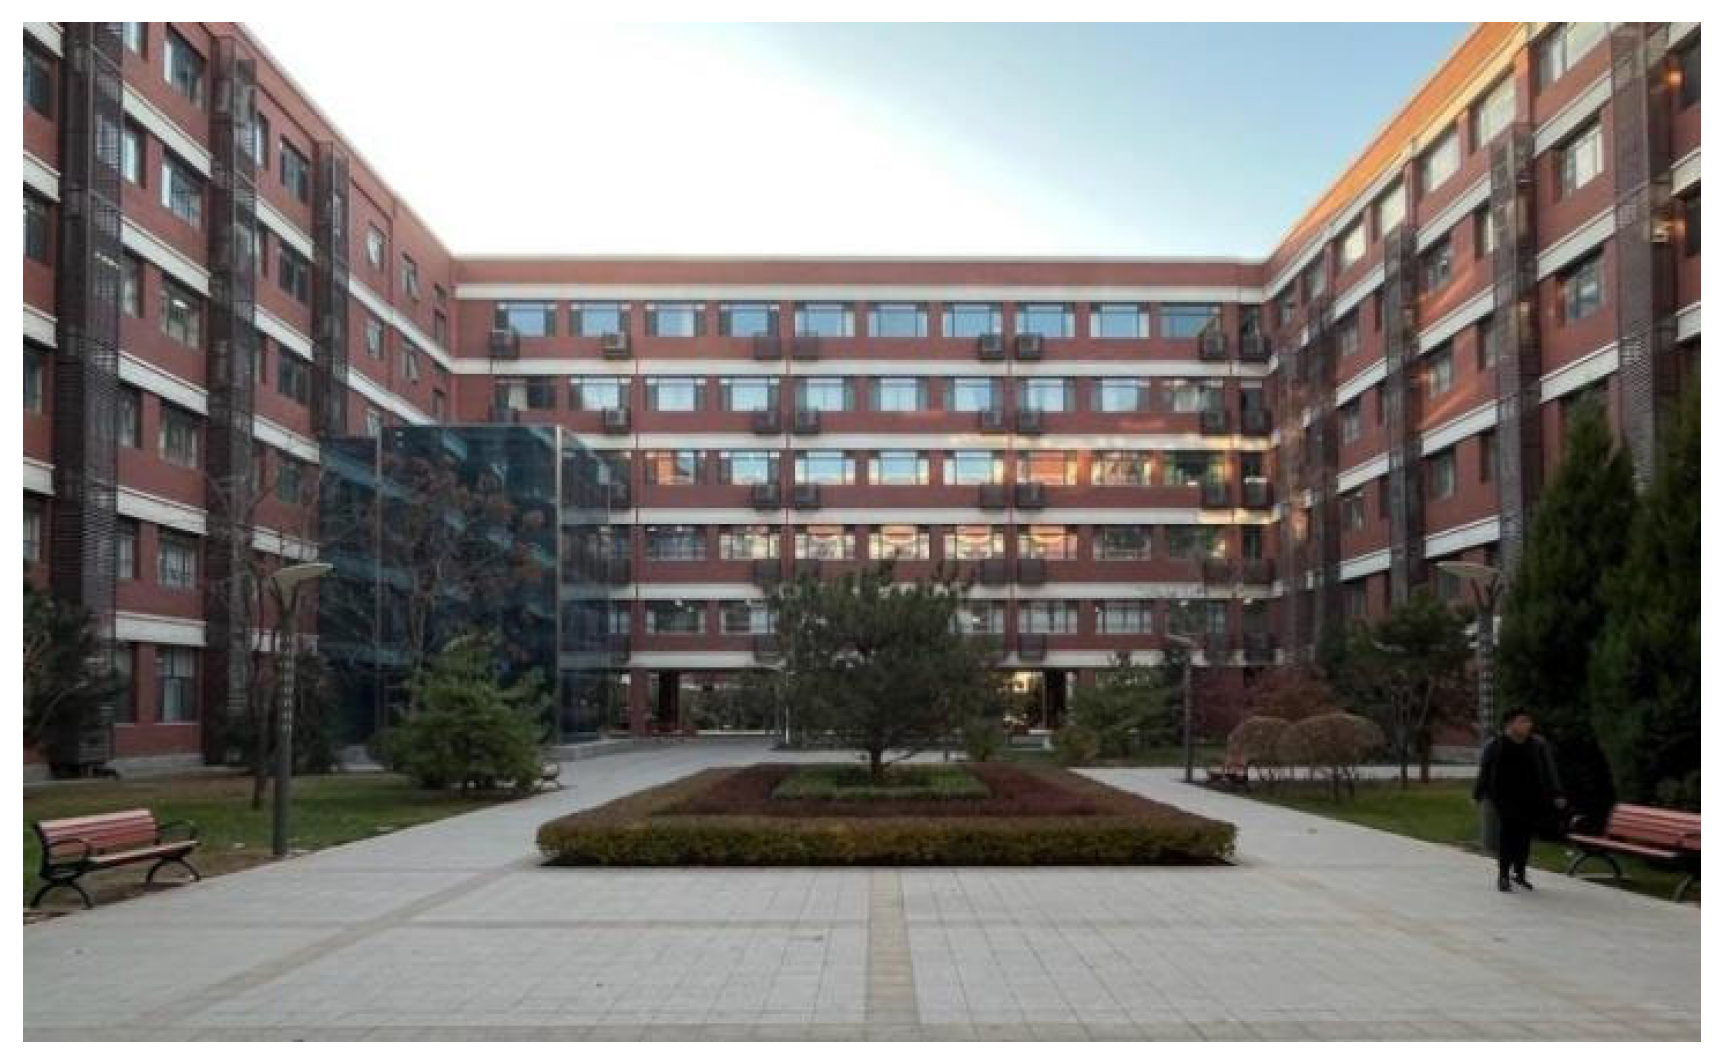
The China University of Mining and Technology (Beijing) campus covers nearly 34 acres in Beijing’s Changping District, with a total gross floor area of nearly 160,000 m2. There are 6 teaching buildings and 9 apartments for students and faculty. The property has 7 landscape courtyards, all of which are organized around teaching buildings and apartments (Figure 1). Most courtyards are surrounded by three-sided buildings, which is consistent with the situation of courtyards in high-density cities. The heights of the buildings around the courtyards are about 22 m, and the façades of the buildings are all of the same style, all of which are decorated with red bricks (Figure 2), which ensures the consistency of the courtyards’ landscape interfaces and helps to control the variables of the samples. Landscape nodes in the courtyards are abundant, the landscape types of the courtyards are diverse, and the layouts have obvious differences. It is appropriate to investigate and verify the differences in restoration performance and the influencing factors of different layout types of these courtyards.
Through the statistical screening of the square meter areas and layout characteristics of eight courtyards, three courtyards with similar square meter areas but obviously different layout characteristics were finally selected as the experimental samples. Courtyard Ⅰ (1600 m2) is a courtyard attached to the student apartment. The plants are dominated by lawns, and shrubs are arranged around the courtyard. The courtyard has a badminton court, and the overall space is open (Figure 3a). Courtyard Ⅱ (1200 m2) is a courtyard adjacent to a student apartment. Lawns, shrubs, and trees are the most common vegetation varieties. The shrubs are organized along the road, and the trees are in clusters. There is a hard-ground square with wooden benches in the courtyard, and the overall space is regular (Figure 3b). Courtyard Ⅲ (1600 m2) is a courtyard adjacent to a teaching building, with a variety of plant types, including lawns, shrubs, and trees. Its layout is diverse and complex. There is an antique pavilion in the courtyard for rest, and the overall design is mysterious (Figure 3c).

2.2. Study Methods

2.2.1. SD Method

Environmental preference, as an aspect of the healing effect of the green space environment, refers to an individual’s preference for the environment, and, thus affects the individual’s behavior. Kaplan’s Environmental Preference Model points out that environmental preference includes a behavior dimension and an information dimension. The behavior dimension indicates that individuals feel that the environment is suitable for conducting various behaviors within it; the information dimension indicates that individuals are attracted by information provided by the environment. Generally, the method of semantic differential (SD method) is used as a means of investigation in the evaluation of the spatial environment at the level of environmental preference [35].
The method of semantic differential is a psychological measurement method introduced in 1957 by C.E. Osgood that uses semantics as a scale on which to conduct psychological experiments. It has analyzed indicators such as vision, hearing, and psychological emotions to describe the ideas and structures of an object [36]. The emphasis of the SD method is on considering the existing environmental information to determine the factor axis and setting the representative scale of the factor axis. Firstly, according to the behavior dimension and information dimension proposed by Kaplan [35], along with college students’ needs for environmental elements, three classifications were set: “Ornamental”, “Uniqueness”, and “Activity”. Secondly, under these 3 classifications, 17 items that were easily perceived by the subjects were selected as the factor axes, and 17 pairs of adjectives with clear and opposite meanings were further determined as the representative scales of the 17 factor axes (Table 1). Lastly, the assessment value of the representative scale of the factor axis was set to 7 grades, and the numbers were assigned correspondingly as 1–7 (Figure 4) based on the statistical requirements.

2.2.2. PRS

The Perceived Restorative Scale (PRS) was constructed by Hartig et al. based on the four restorative environmental characteristics (being away, fashioning, extent, and compatibility) of Kaplan’s Attention Restorative Theory (ART) to evaluate the environment. Scholars have further revised the scale after years of practice [37,38]. The Chinese version of the PRS, revised by Taiwan Province scholar Huang Zhangzhan [39], was selected for this paper (Table 2), with 18 clear and concise items of semantics that were more compatible with the language environment and language habits of the subjects [40,41]. The evaluation values comprised 7 grades, which were numbered 1–7.

2.2.3. Experimental Design

The experiment was conducted in the form of an online questionnaire. The electronic questionnaire consisted of four sections. The first section contained photographs of courtyard samples, with three photos presented for each scene, all of which were taken using a lens with unified focal length to capture the most frequently occurring viewpoints of pedestrians in the courtyards. The second part included demographic information such as age, gender, subject, and other details. The third section was an evaluation form of campus courtyards based on the SD method with 17 items in total, which was used to represent the feelings and preferences of the subjects regarding landscape elements. The fourth section was the PRS (Chinese version), which was used to represent the restorative benefits of the space for the subjects.
The experiment used random sampling, and volunteers were collected among all the students at the university. After outlining the purpose and content of the investigation, electronic questionnaires were distributed to be filled in. A total of 172 questionnaires were collected, with 66, 51, and 55 originating from the 3 courtyard samples, correspondingly. After screening out the invalid questionnaires, 64 (Courtyard Ⅰ), 49 (Courtyard Ⅱ), and 52 (Courtyard Ⅲ) valid questionnaires were retained, for a total of 165, representing a 95.93% effective rate.

2.2.4. Analytical Framework

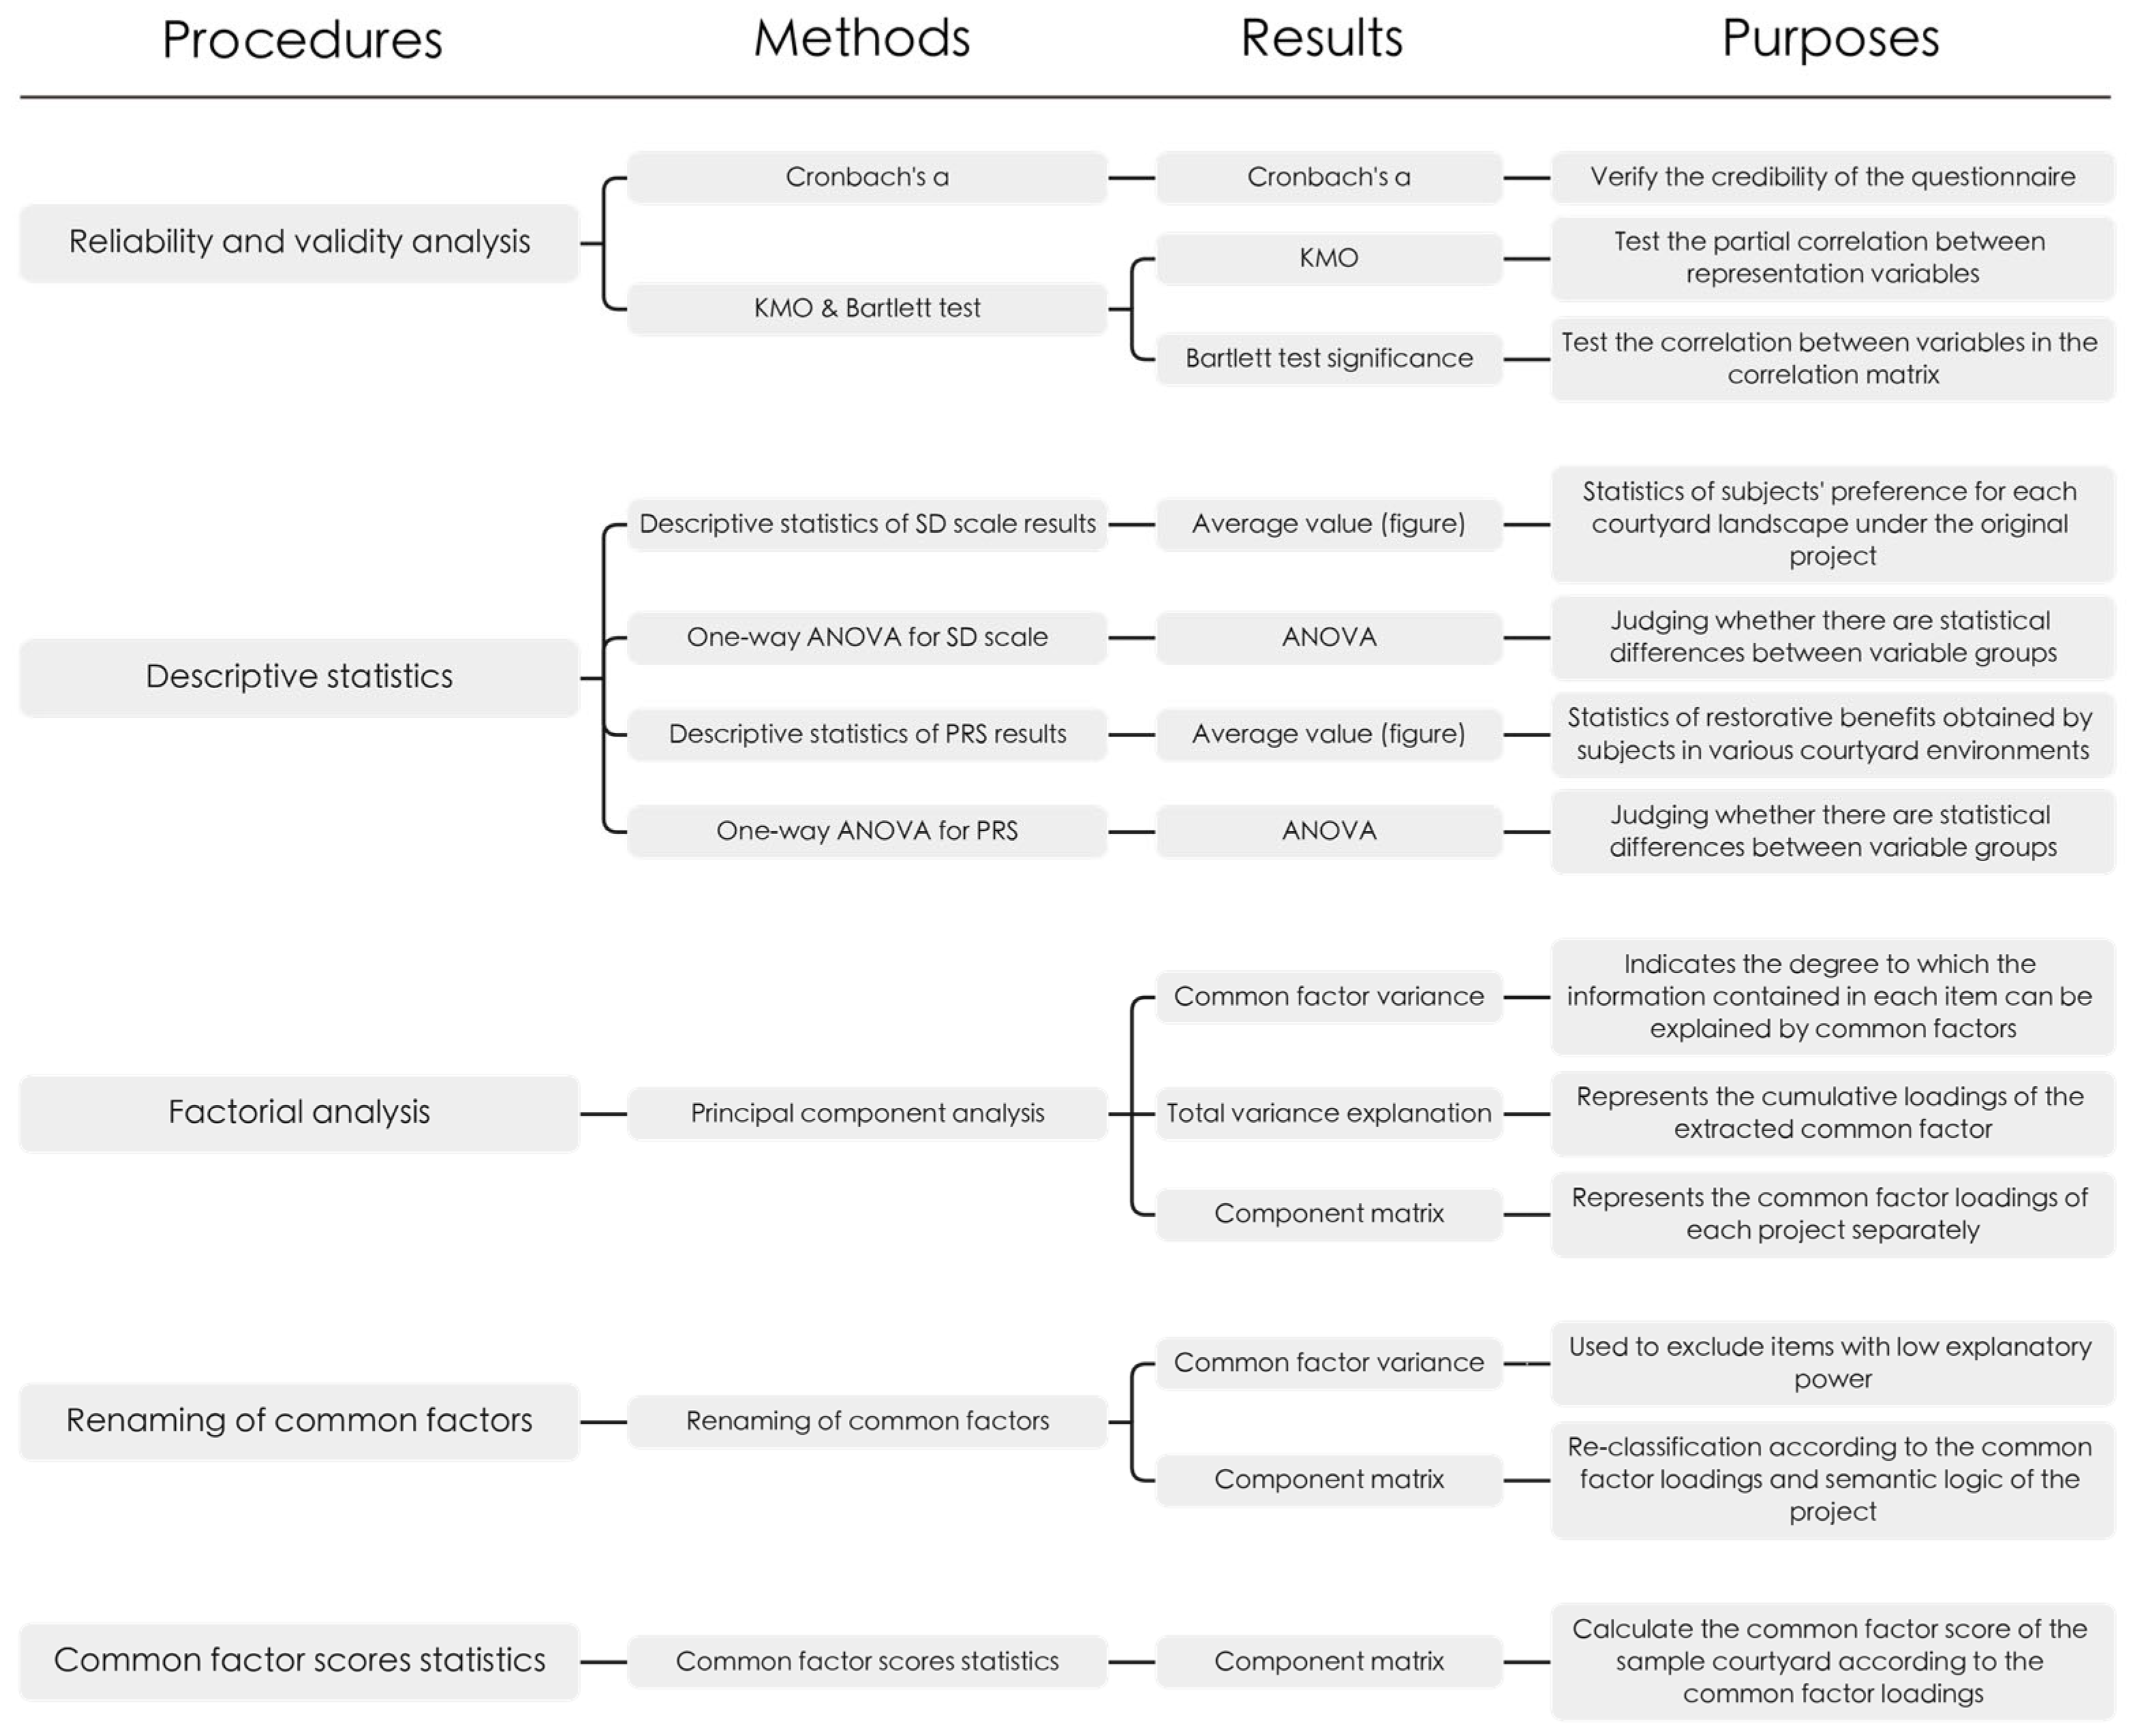
This study’s analytical framework was founded on the fundamental procedure of SD analysis, suggested by Zhuang Weimin et al. [42], which was mainly composed of five interrelated steps (Figure 5). In Step 1, the reliability and validity of the collected questionnaire data were analyzed to ensure the reliability and structural validity of the data. In Step 2, descriptive statistics were calculated based on the results of the SD scale and PRS, respectively, so as to preliminary characterize the subjects’ preferences for each courtyard and the restoration benefits obtained in the environments of the courtyard samples. In step 3, a factorial analysis was carried out using the SD method, and common factors were identified using principal component analysis. Step 4, by using the common factor variance and component matrix obtained in step 3 and analyzing the semantic logic of the original project, renamed the common factors extracted in step 3. In Step 5, according to the analysis results of the preceding steps, the shared factor scores of courtyard samples were statistically analyzed and compared to draw further inferences. All statistical analyses in this study were carried out by SPSS Statistics software R26.0.0.0 (IBM, Armonk, NY, USA).

3. Results

3.1. Reliability and Validity Analysis

Cronbach’s α is frequently used in statistics to symbolize the dependability of the results, because it demonstrates the consistency and stability of the scale results. After preliminary screening, we imported the results of 165 questionnaires into SPSS Statistics software R26.0.0.0 for Cronbach’s α test, in which Cronbach’s α of the SD scale was 0.945 and Cronbach’s α of the PRS was 0.925, indicating that the results of the two-part scale were very reliable and suitable for subsequent statistical analysis.
Validity reflects the authenticity of the scale results, which is used to measure whether the comprehensive evaluation system can accurately reflect the evaluation purpose and requirements. In statistics, the KMO test and the Bartlett spherical test are commonly used to characterize the validity of the scale results. The KMO coefficient can characterize the partial correlations between variables, and the Bartlett spherical test is used to test the correlations between variables in the correlation matrix. After calculation, the KMO sampling suitability of the results of SD scale was 0.936, and the significance of the Bartlett spherical test was less than 0.001, which proved that the results of the SD scale were very suitable for factorial analysis.

3.2. Descriptive Statistics

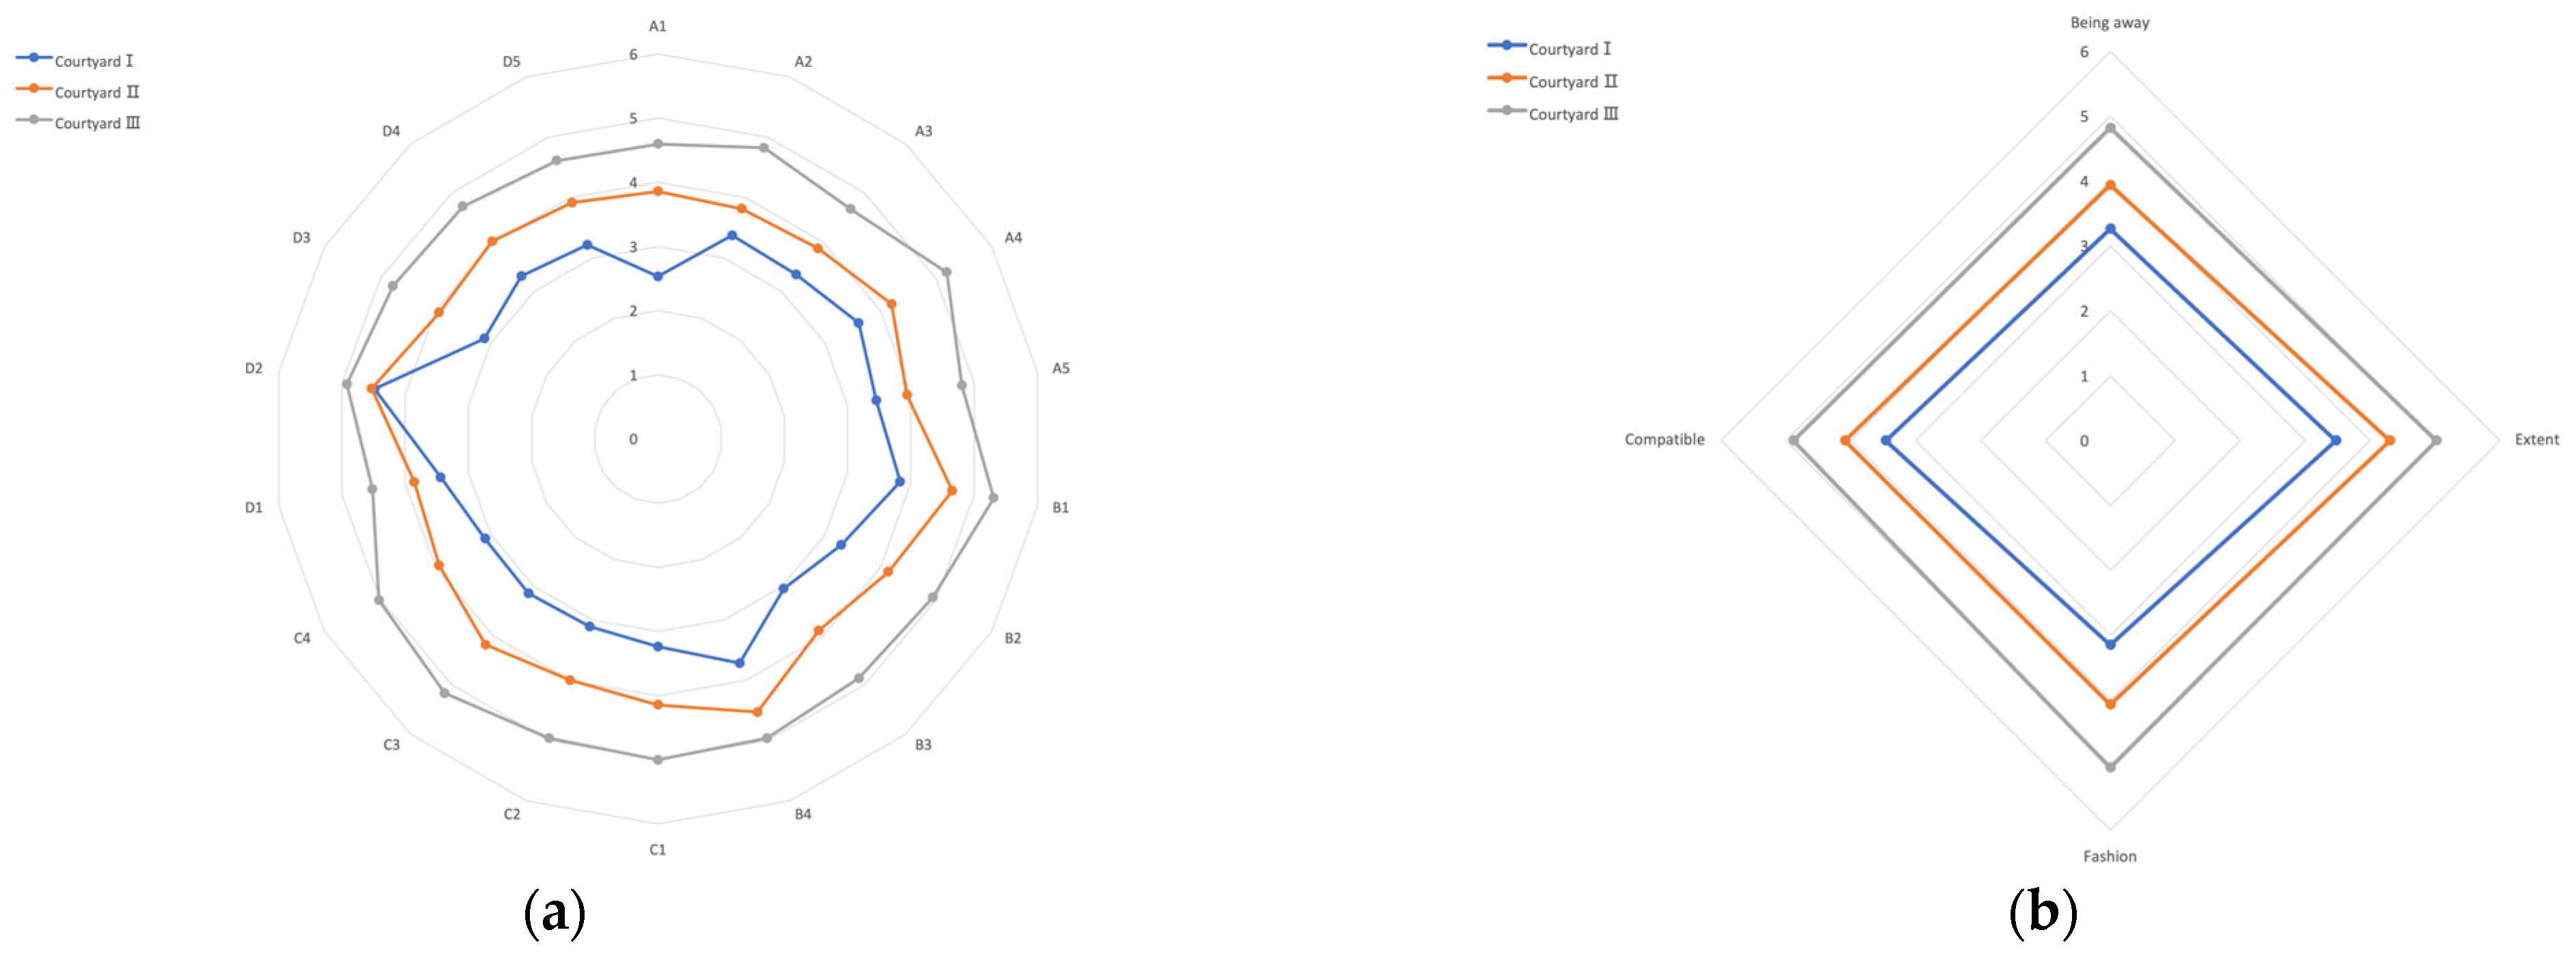
The average PRS score can be used to characterize the corresponding healing efficiencies of different subjects in the sample courtyards, since each item in the PRS affects the healing efficacy value for the subjects. By comparing the average total PRS scores of the samples, it was clear that Courtyard I had poorer environmental restoration quality than the baseline (72, the sum of the median evaluation values of 18 items), whilst Courtyard Ⅱ and Courtyard Ⅲ had higher levels of environmental restoration quality. Overall, Courtyard III outperformed Courtyard II and Courtyard I in terms of healing efficiency (Table 3 and Figure 6). The outputs of an ANOVA test conducted on the dataset implied that the significance was p < 0.001, the probability that the difference between samples was caused by sampling error was less than 0.001, and there was an extremely significant statistical difference between the sample groups.
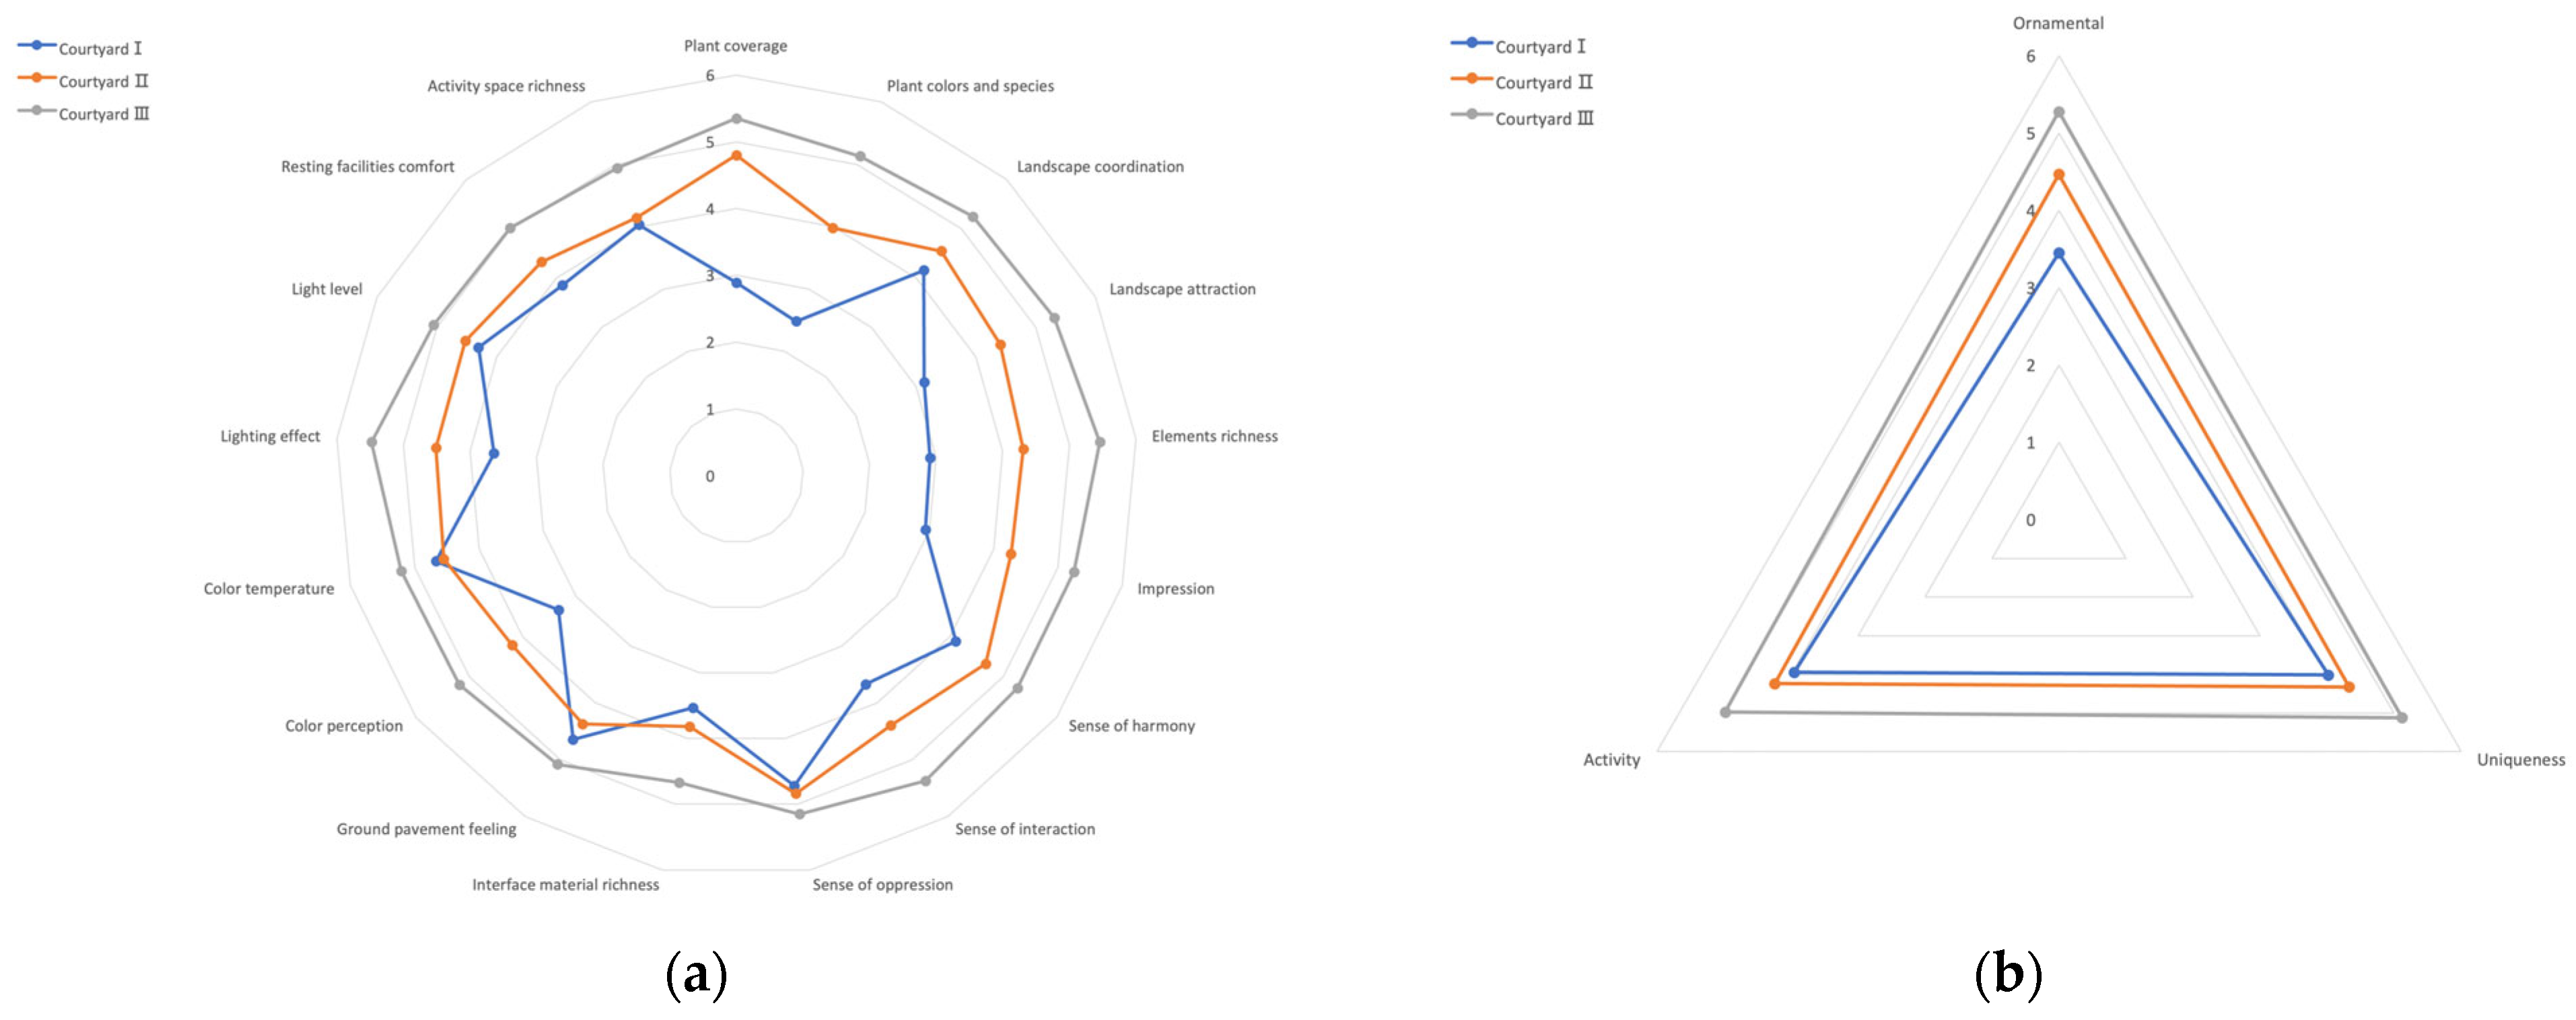
The descriptive statistics were calculated for the item values in the SD scale. Overall, the scores of the three courtyard samples were Courtyard Ⅲ > Courtyard Ⅱ > Courtyard Ⅰ (Table 4 and Figure 7), which corresponded to the descriptive statistics of the PRS results. Second, based on the pre-classification of factors using the SD method, the average values of three types of projects were counted. According to the median value of the evaluation scale, taking 4 as the baseline of the factor axis score, we observed that the average score of Courtyard Ⅰ under the classification of “ornamental” was low (−0.55), and the average scores of “uniqueness” and “activity” were both around the baseline (+0.02 and −0.05, respectively); The scores of Courtyard Ⅱ in the three groups were close, and all were slightly higher than the baseline (+0.47, +0.33, and +0.24). The average scores of the three categories of Courtyard Ⅲ were relatively high, and the average score under the category of “ornamental” was the highest, a far better result than that of Courtyard Ⅰ. Similarly, the scores of the SD scale were tested by one-way ANOVA, and the F was 44.30 with a significance of p < 0.001, indicating that there was significant variance between the sample groups and that the results could be used for further analyses.

3.3. Factorial Analysis

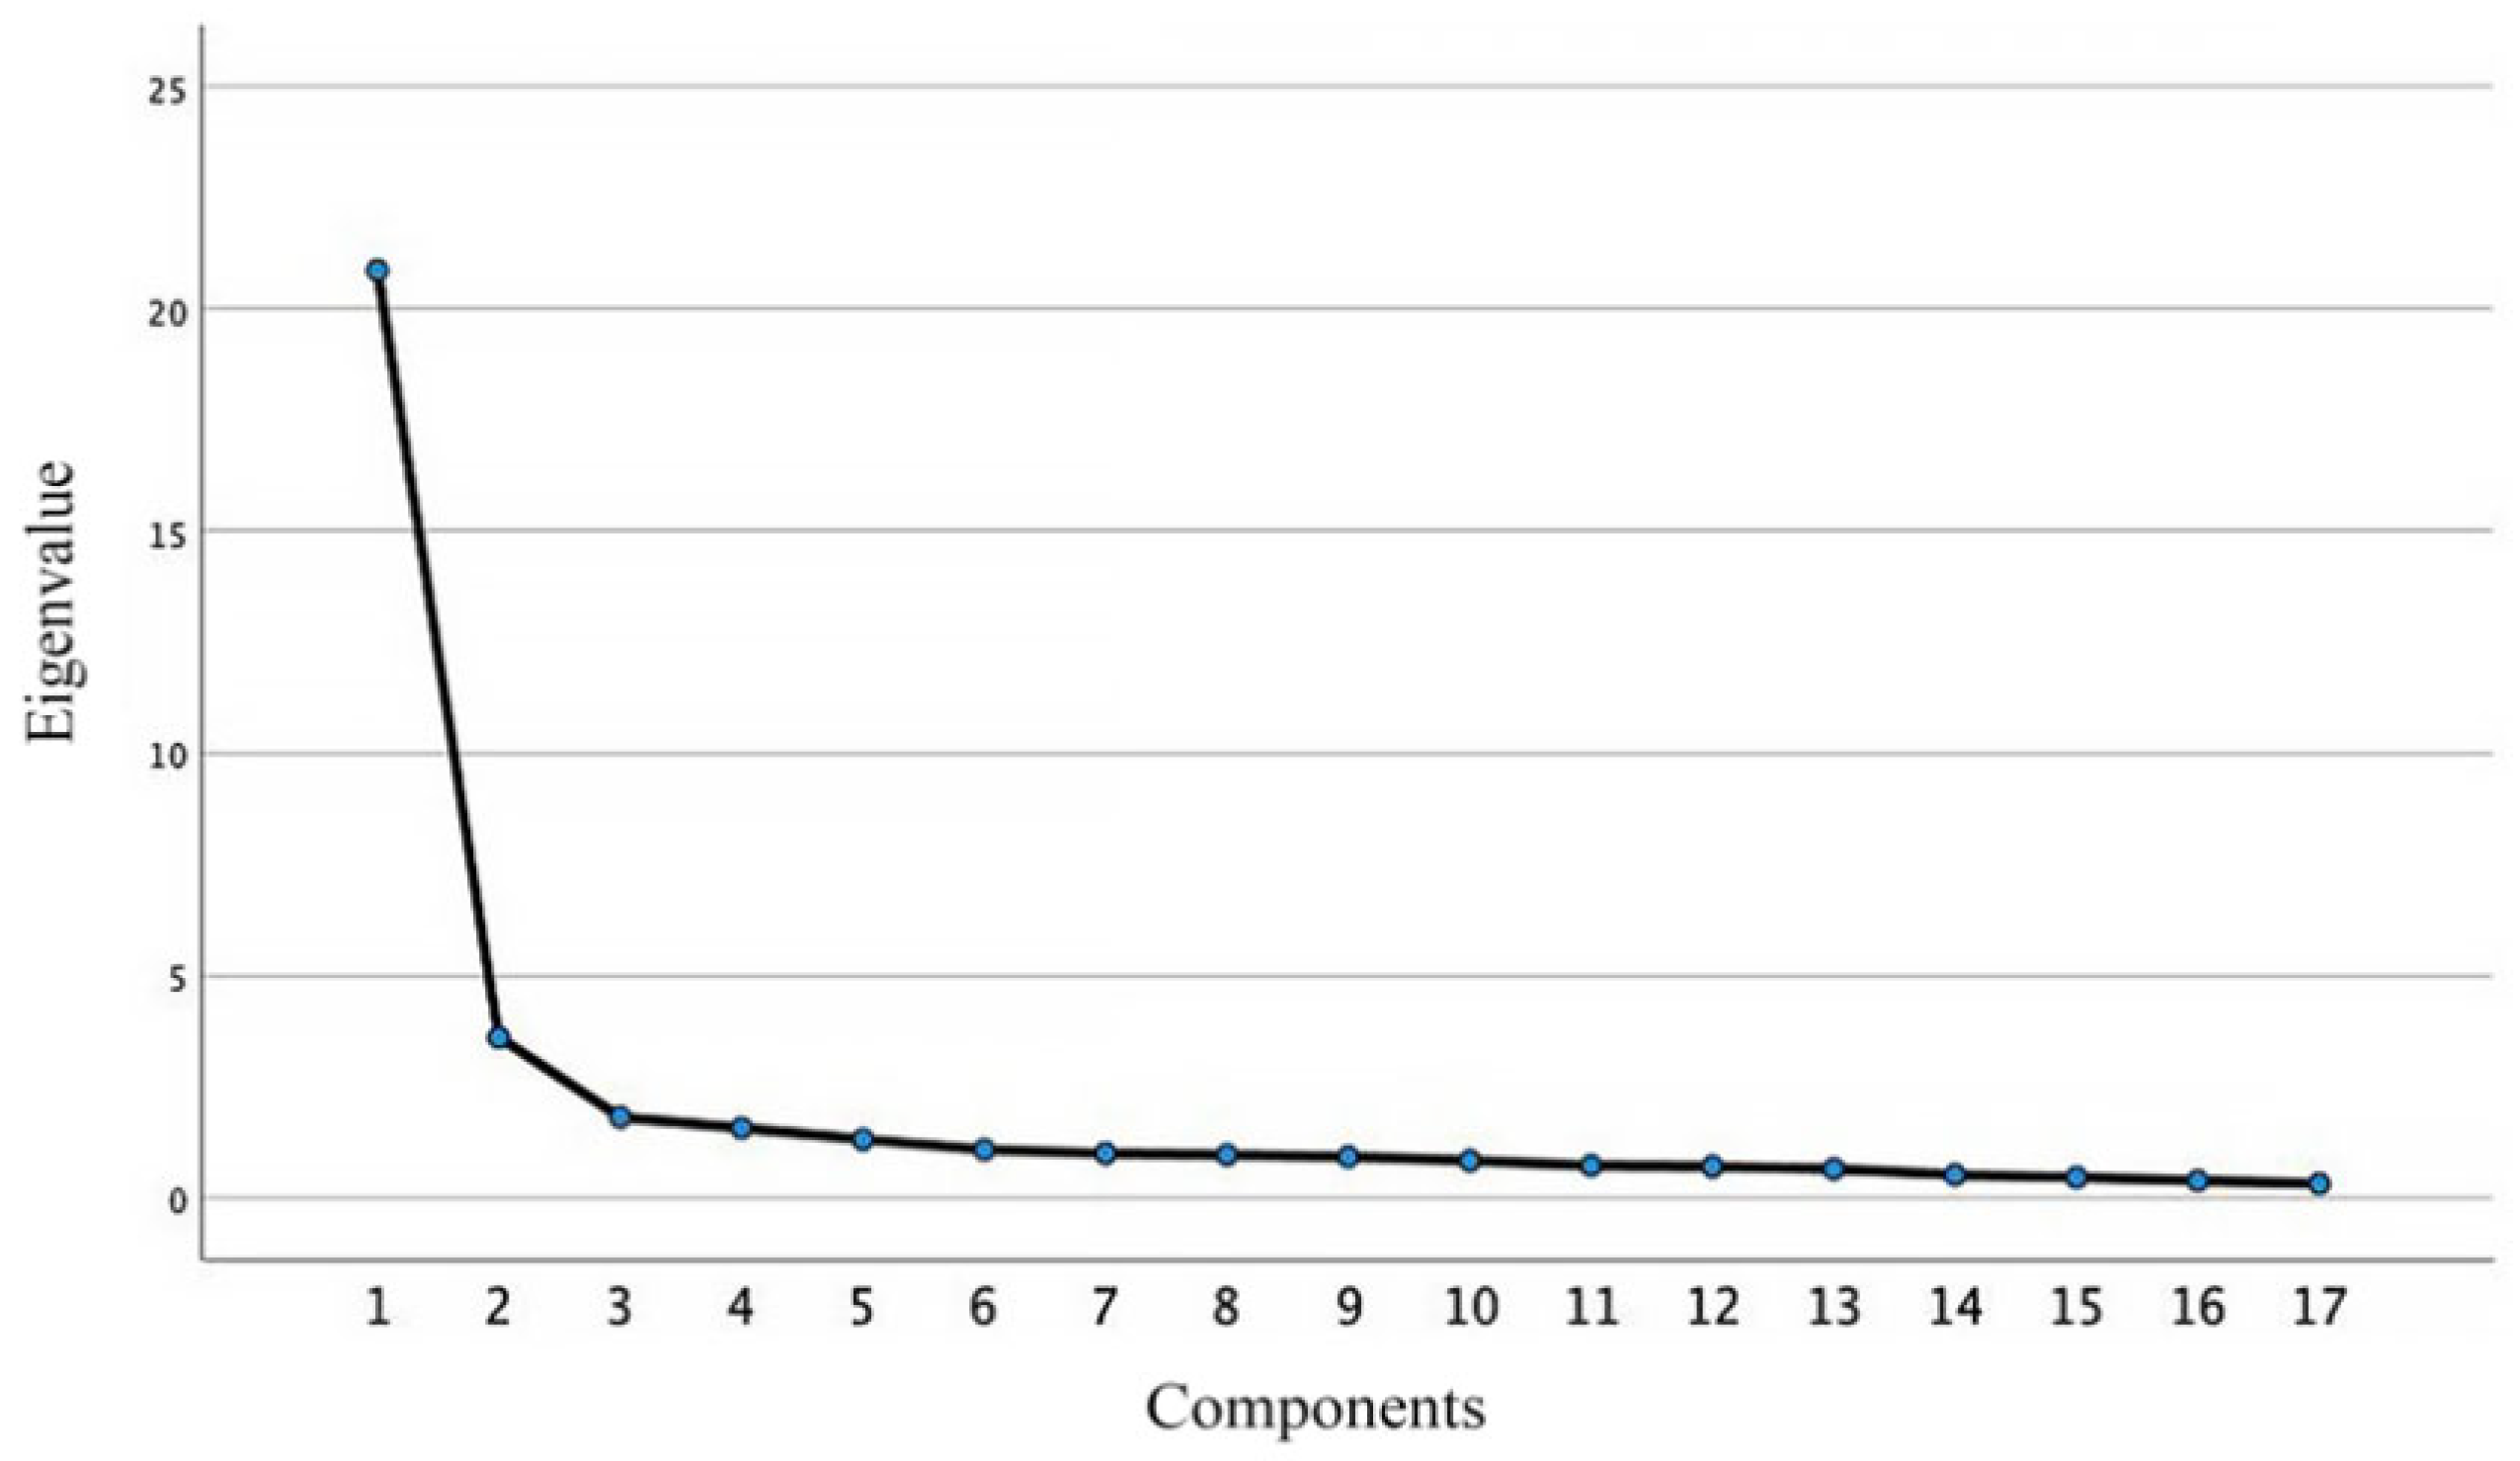
In the SD method, the original data were sorted and summarized by factorial analysis, and the psychological and physical quantities of the original spatial description elements were numerically stated to convey the features of the spatial environment [42]. The scree plot in Figure 8 shows that the eigenvalues of components 1 and 2 were relatively high, while the eigenvalues of the remaining components were relatively low or average. According to the results of total variance interpretation, the initial eigenvalues of the first two components were both greater than 1, and the cumulative contribution rate of the two components was 64.821%, which shows that the extracted two common factors were able to explain the entirety of the 64.821% result (Table 5); thus, they can be used as two common factors extracted by the SD method.

3.4. Renaming of Common Factors

The variance extraction value of the rescaled common factors represents the sum of the squared loadings of an original variable on all common factors and indicates the degree to which the information contained in each variable can be explained by the extracted principal components. Firstly, we excluded the items with a low degree of principal component explanation according to the common factor variance, and took a common factor variance of 0.5 as the confidence limit. The common factor variances of items 9, 10, and 15 (0.413, 0.438, and 0.430, respectively) were lower than the confidence limit, so we excluded them when the factors were renamed.
Second, the original items could be divided into two categories depending on the factor loading distribution by comparing the loading of two distinct common factors of each item (Table 6). The “plant color and species”, “plant coverage”, “element richness”, and “impression” common factor 1 loads were comparatively large (0.901, 0.832, 0.869, and 0.826, respectively). Nevertheless, the semantics of these items trended towards the intuitive feelings and visual feelings obtained by the subjects in the courtyard, so the common factor 1 was named “Perceived Quality”. In the second group of project classification, the common factor 2 loads of “color temperature”, “sense of harmony”, “ground pavement feeling”, “activity space richness”, and “resting facilities comfort” were relatively high (0.778, 0.709, 0.701, 0.689, and 0.661, respectively). The semantics of these items tended to be the subjects’ experiences and detailed feelings in the courtyard, so the common factor 2 was named “Experience Quality”.

3.5. Common Factor Scores Statistics

To compare the scores of the sample courtyards after reclassification, the shared factor scores of sample groups, namely, the rotated component matrix and item scores, were weighted. The common factor scores of the samples weighted by linear combination expression are displayed in Table 7.

4. Discussion

4.1. Discussion Based on Initial Categories

4.1.1. “Ornamental”

In the above descriptive statistics, we can see that the score of Courtyard Ⅲ in the classification of “ornamental” (5.28) was much higher than that of Courtyard Ⅰ (3.45), with obvious differences. Secondly, we calculated the differences in the average score of the original items between Courtyard Ⅲ and Courtyard Ⅰ under the classification of “ornamental”, among which the differences of “plant coverage”, “plant color and species,” and “element richness” were significant (2.46, 2.56, and 2.55, respectively). When the situations of the sample courtyards were investigated, it was found that the plant richness and element richness of Courtyard Ⅲ were far superior to those of Courtyard Ⅰ (Figure 9), demonstrating that the scale results corresponded to the actual scenario. Furthermore, it was revealed in the actual investigation that, although the lawn coverage of Courtyard Ⅰ was very high, it demonstrated the problem of the fluctuation of green visibility with seasonal changes due to the planting modes and maintenance. The amount of shrubs and trees planted in Courtyard Ⅰ was much lower than that in Courtyard Ⅲ, which led to the “plant coverage” score in CourtyardⅠ being much lower than that in Courtyard Ⅲ.
Many other studies have shown that the green vision rate is positively correlated with the healing capability of the environment [43,44,45], which matches the results of the “plant coverage” item and the PRS results of the samples, and proves that the small-scale campus courtyard covered with more plants has better restoration benefits. Plants (shrubs, trees, etc.) near or above human eye height, on the other hand, often have greater landscape attraction. Therefore, in the healing-oriented courtyard design, additional different kinds of plants, more abundant landscape components, and improved coverage of shrubs and trees can make people more readily drawn to the courtyard, thus diverting their attention in order to accomplish the healing effect [2,3].

4.1.2. “Uniqueness”

Based on the summary of the original scores of the SD scale, we can see that the “uniqueness” category scores of Courtyard Ⅰ and Courtyard Ⅱ were close (4.02 and 4.33, respectively), while the “uniqueness” score of Courtyard Ⅲ was higher (5.12), indicating that it is worthwhile to investigate the differences between sub-item scores and courtyard conditions further.
In terms of “color perception” and “lighting effect”, the average scores of Courtyard Ⅲ and Courtyard Ⅰ were quite different (the differences were 1.86 and 1.84, respectively). In the actual courtyard situation, the plant species in Courtyard Ⅲ were more abundant, and there was a colorful antique pavilion as a garden ornament, giving it a higher score for “color perception”. Additionally, the road form and space form of Courtyard Ⅲ were more complicated, and the trees and shrubs were staggered, providing it with a higher score in “lighting effect”.
Therefore, in the design of healing courtyards, introducing more diverse landscape components or garden ornaments as well as more complex spatial forms can increase landscape preference, thereby enhancing the healing capability of the courtyard.

4.1.3. “Activity”

Courtyard III received a higher average score (4.98) in the “activity” category, while Courtyard I (3.95) and Courtyard II (4.24) showed little variation. In terms of sub-items, the scores of “resting facilities comfort” in the three samples were 3.86 (Courtyard Ⅰ), 4.33 (Courtyard Ⅱ), and 5.02 (Courtyard Ⅲ), respectively. The scores of “activity space richness” were 4.03 (Courtyard Ⅰ), 4.14 (Courtyard Ⅱ), and 4.94 (Courtyard Ⅲ), respectively. We also analyzed the actual activity spaces in the sample courtyards (Figure 10). The main activity space of Courtyard Ⅰ was a badminton court (82 m2); the main activity space of Courtyard Ⅱ was a rectangular hard square (110 m2) with four wooden benches; and the main activity space of Courtyard Ⅲ was an antique pavilion (36 m2). Despite the fact that the main activity space areas of Courtyard Ⅰ and Courtyard Ⅱ were much larger than that of Courtyard Ⅲ, the average scores of “activity space richness” and “resting facilities comfort” of Courtyard Ⅲ were much higher than those of Courtyard Ⅱ and Courtyard Ⅰ, indicating that users’ demand for activity space is not determined by size.
Many studies, such as those on the behavioral cognition hypothesis [46], social interaction hypothesis [47], distraction hypothesis [48], and others, have proven that physical exercise can strengthen people’s mental health. However, in designing healing-oriented activity spaces in colleges and universities, we should not only consider the size of the activity space, but also other factors, such as the form and function of the space’s design.

4.2. Discussions Based on Common Factors

4.2.1. “Perceived Quality”

Based on the calculation of factor scores in Chapter 2.4.5, the score trend of “Perceived Quality” of the sample courtyards was Courtyard Ⅰ (30.367) < Courtyard Ⅱ (39.017) < Courtyard Ⅲ (46.819), which demonstrates that Courtyard Ⅲ more easily provided users with a strong sensory impact than Courtyard Ⅱ and Courtyard Ⅰ.
The factor loading distribution (Table 6) was assessed for analysis. Firstly, the “Perceived Quality” loadings of the richness items (“plant colors and species”, “plant coverage” and “element richness”) were relatively high. Courtyard III had more plant types and overall plants based on the real conditions of the samples, which was compatible with the scores of Courtyard Ⅲ in the richness items. Second, the “Perceived Quality” loadings of the two items, “landscape attraction” and “impression”, were both significant. In fact, Courtyard Ⅲ had a unique antique pavilion, which led to higher scores for “landscape attraction” and “impression”. In summary, Courtyard Ⅲ had significant numbers of diverse plants, as well as a distinctive garden ornament. These landscape elements with visual impact help to explain the higher “Perceived Quality” score. Therefore, by increasing the types of landscape elements and placing garden ornaments in college and university courtyard designs, courtyards can achieve better “Perceived Quality” scores, thereby boosting users’ environmental preferences for these courtyards.

4.2.2. “Experience Quality”

Based on the common factor score calculation for “Experience Quality”, the score trend of the samples was Courtyard Ⅰ < Courtyard Ⅱ < Courtyard Ⅲ, which shows that Courtyard Ⅲ can provide users with better experiences and details than Courtyard Ⅱ and Courtyard I.
In accordance with the loading distribution of the common factor of “Experience Quality”, its loadings were mainly distributed in items such as “harmony”, “rest facility comfort”, and “activity space richness”. The analysis of the scores of these leisure facility comfort and activity space richness items is presented in Chapter 3.1.4. Courtyard Ⅲ scored 5.27, which was higher than Courtyard Ⅱ (4.67) and Courtyard Ⅰ (4.11). According to the semantics of the original items, “harmony” refers to the close relationship between people and the environment. The width of the pathway in Courtyard III was small and the plants were dense, which brings pedestrians and landscape plants closer to each other; owing to the tortuous path design, people passively obtained more sensory information when crossing through this courtyard (Figure 11). These two factors help, to some extent, to clarify why Courtyard Ⅲ received a higher “Experience Quality” score.
Moreover, this conclusion is also consistent with the environmental preference demand by Kaplan [2]: tortuous roads and dense plants can provide the environment with higher scores in the “Mysterious” and “Richness” items, thus stimulating users’ willingness to explore. The “harmony” of the landscape layout is also important, as it determines the user’s ability to understand the environment. Therefore, leveraging tortuous and compact path layouts and increasing the information provided by the courtyard landscape in courtyard design can improve the experiences and sensibilities of courtyard users, thus improving the quality of users’ restorative experiences.

4.3. Conjectures

The following conjectures can be made by comparing the score statistics of the SD scale results (Table 6) and the common factor scores of samples with the actual situations of the sample courtyards:
  • According to the comparison between the eigenvalues of common factors in the Scree plot and the scores of the PRS, although the common factor scores of the three were similar, the PRS scores of Courtyard Ⅱ and Courtyard Ⅲ, with higher “Perceived Quality” scores, were much higher than those of Courtyard I, with similar “Experience Quality” scores. That is, it is speculated that the original items with higher “Perceived Quality” loading distribution, such as “plant colors and species”, “element richness”, and “plant coverage,” can improve the healing quality of small-scale campus courtyards more significantly than the spatial elements and characteristics described by the original items with higher “Experience Quality” loading (“sense of harmony,” “ground pavement feeling,” “activity space richness,” etc.).
  • Courtyard Ⅲ, with its smaller activity space area, had higher “activity space richness” (4.94) and “resting facilities comfort” scores (5.02) than the other two sample courtyards with larger activity space areas. In the actual situation, the form of the activity space of Courtyard Ⅲ was more distinctive, and the function orientation of the activity space was unclear, so it was hypothesized that users have a higher demand and preference for activity spaces with ambiguous function and better senses of atmosphere.
  • Among the scores for “ground pavement feeling”, the scores of the sample courtyards were Courtyard Ⅲ (5.08) > Courtyard Ⅰ (4.64) > Courtyard Ⅱ (4.37). The ground of Courtyard I was paved with stone collage; Courtyard II was paved with stone; and Courtyard III was paved with brick. The scores of “senses of harmony” were combined with the real circumstances of the sample courtyards. As a consequence, we speculated that moderately curved brick paving can obtain a higher score for tactile preference than flat stone collage paving or flat ordinary stone paving.

5. Conclusions

Based on Kaplan’s Attention Recovery Theory (ART) and Ulrich’s Stress Reduction Theory (SRT) [2,3,4,5], this study selected the health benefit evaluation model [26] proposed by Liu Yuequn as the evaluation framework of healing environmental quality. It used the SD method and the PRS as research methods to quantify the healing efficiency of small-scale campus courtyards from the perspectives of environmental preference and recovery evaluation.
For the analysis method, we first adopted descriptive statistics; following that, the statistics of the SD scale results and the PRS results were applied to describe the subjects’ landscape preferences and the restoration evaluations of the sample courtyards. Second, the data were condensed using factorial analysis so as to further quantitatively analyze the healing qualities of the courtyards.
Through statistical analysis, we reached the following conclusions:
  • Small-scale courtyards with more dense plants have higher healing abilities, and the type and layout of plants also affect the healing effect. Plants close to or higher than human visual height, such as trees or shrubs, have a better healing effect than lawns. An irregular layout of plants can also bring about a more beautiful aesthetic and better light than a monotonous layout, thus strongly diverting people’s attention from pressure.
  • In small-scale courtyards, different forms of activity spaces correspond to different landscape preferences, but users’ preferences for activity spaces do not depend on the scale of the activity space.
  • In terms of the perception mode of users, we used “Perceived quality” and “Experienced quality” to represent the healing qualities of the courtyard relative to abstract feelings or atmospheres that are difficult to distinguish directly. “Perceived quality” is related to the healing elements that can be perceived by vision or intuition, such as color, element richness, light and shadow effect, etc. “Experience quality” involves healing elements related to behavioral interaction or details, such as spatial form and coordination, etc. The presence of rich plant species or landscape sketches can enhance the visual impact of the environment, thus providing direct sensory satisfaction to users and improving the “perceived quality” of the courtyard landscape. On the other hand, tortuous roads and greater amounts of information in courtyards can make the environment more mysterious, thus stimulating users’ desire to explore and improving the “experience quality” of the courtyard landscape.
In this study, a questionnaire survey was used to objectively evaluate the healing qualities of small-scale courtyards on campuses, but the following limitations are still present. The study established a relationship between plant morphology (trees, shrubs, and lawns) and the healing ability of the courtyards by researching three courtyard samples. However, because this experiment was based on real courtyards, the species composition and plant morphology of the courtyards could not be controlled, resulting in uncontrollable variables. Thus, we were unable to draw conclusions regarding the correlation between specific plant species (such as broadleaf trees and coniferous trees) and the overall healing ability of the courtyard. In addition, the environmental factors involved in this study were unable to explain the elements of “perceived quality” and “experienced quality” more comprehensively. In terms of “perceived quality” and “experienced quality”, the user’s information perception behavior in the courtyard was emphasized, which requires certain behavioral indicators for characterization. Therefore, in follow-up research, VR technology and human factor analysis technology can be introduced to make up for the technical defects of scene simulation and behavior analysis. Using samples to assess more specific environmental factors (such as plant species, road bending angle, green patch layout, etc.) and obtaining behavioral indicators by monitoring the activities of the subjects in the scene may establish a correlation between specific environmental factors and healing ability from multiple angles.
While it is true that this study used a university in Beijing as a model, it can still provide some guidance for the design of small-scale courtyards on ordinary campuses or small-scale gardens in high-density cities. We can evaluate the healing quality of courtyard landscapes more comprehensively using this research method, while also expanding and deepening the concept of spatial factors that provide healing efficiency.

Author Contributions

Conceptualization, Y.C. and L.H.; methodology, L.H.; software, L.H.; validation, Y.C. and L.H.; formal analysis, L.H.; investigation, L.H. and Y.C.; resources, L.H.; data curation, L.H.; writing—original draft preparation, L.H.; writing—review and editing, Y.C.; visualization, L.H.; supervision, Y.C.; project administration, Y.C.; funding acquisition, Y.C. All authors have read and agreed to the published version of the manuscript.

Funding

This research received no external funding.

Institutional Review Board Statement

Not applicable.

Informed Consent Statement

Informed consent was obtained from all subjects involved in the study.

Data Availability Statement

The data presented in this study are available upon request from the corresponding author. The data are not publicly available as they involve personal privacy.

Acknowledgments

Thanks much to Yaobing Song for his photographic help in this article.

Conflicts of Interest

The authors declare no conflict of interest.

References

  1. Stichler, J.F. Creating healing environments in critical care units. Crit. Care Nurs. Q. 2001, 24, 1–20. [Google Scholar] [CrossRef] [PubMed]
  2. Kaplan, R.; Kaplan, S. Experience of Nature: A Psychological Perspective; Cambridge University Press: New York, NY, USA, 1989. [Google Scholar]
  3. Kaplan, S. The Restorative Benefits of Nature: Toward an Integrative Framework. J. Environ. Psychol. 1995, 15, 169–182. [Google Scholar] [CrossRef]
  4. Ulrich, R.S. Visual Landscapes and Psychological Well-Being. Landsc. Res. 1979, 4, 17–19. [Google Scholar] [CrossRef]
  5. Ulrich, R.S. View Through a Window May Influence Recovery from Surgery. Science 1984, 224, 420–421. [Google Scholar] [CrossRef]
  6. Dzhambov, A.M.; Hartig, T.; Tilov, B.; Atanasova, V.; Makakova, D.R.; Dimitrova, D.D. Residential greenspace is associated with mental health via intertwined capacity-building and capacity-restoring pathways. Environ. Res. 2019, 178, 108708. [Google Scholar] [CrossRef]
  7. Dzhambov, A.M.; Markevych, I.; Hartig, T.; Tilov, B.; Arabadzhiev, Z.; Stoyanov, D.; Gatseva, P.; Dimitrova, D.D. Multiple pathways link urban green- and bluespace to mental health in young adults. Environ. Res. 2018, 166, 223–233. [Google Scholar] [CrossRef]
  8. Ulrich, R.S.; Cordoza, M.; Gardiner, S.K.; Manulik, B.J.; Fitzpatrick, P.S.; Hazen, T.M.; Perkins, R.S. ICU Patient Family Stress Recovery During Breaks in a Hospital Garden and Indoor Environments. HERD Health Environ. Res. Des. J. 2020, 13, 83–102. [Google Scholar] [CrossRef]
  9. Wells, N.M. At Home with Nature: Effects of “Greenness” on Children’s Cognitive Functioning. Environ. Behav. 2000, 32, 775–795. [Google Scholar] [CrossRef]
  10. White, M.P.; Pahl, S.; Wheeler, B.W.; Depledge, M.H.; Fleming, L.E. Natural environments and subjective wellbeing: Different types of exposure are associated with different aspects of wellbeing. Health Place 2017, 45, 77–84. [Google Scholar] [CrossRef]
  11. Jiang, W.; Zou, M. Innovative design of campus green spaces in the context of the “One Belt, One Road” and the digital use of Silk Road elements. E3S Web Conf. 2021, 236, 05031. [Google Scholar] [CrossRef]
  12. Abu-Ghazzeh, T.M. Communicating Behavioral Research to Campus Design. Environ. Behav. 1999, 31, 764–804. [Google Scholar] [CrossRef]
  13. Zhu, Y. Student’s Living Space Study and Improved Design in Shenzhen University Town. Master’s Thesis, Harbin Institute of Technology, Harbin, China, 2016. (In Chinese). [Google Scholar]
  14. Zhang, M.; Ying, L. Evaluation on Green Space Use on University Campuses Based on PSPL Survey Method: A Case of the Youth Garden of Huazhong University of Science and Technology. Urban. Archit. 2022, 19, 175–178. (In Chinese) [Google Scholar] [CrossRef]
  15. Francis, C.; Marcus, C. Places people take their problems. In Proceedings of the 22nd Annual Conference of the Environmental Design Research Association; Urbina-Soria, J., Andeane, P.O., Bechtel, R., Eds.; Environmental Design Research Association: Oklahoma City, OK, USA, 1991; pp. 178–184. [Google Scholar]
  16. Foellmer, J.; Kistemann, T.; Anthonj, C. Academic Greenspace and Well-Being—Can Campus Landscape be Therapeutic? Evidence from a German University. Wellbeing Space Soc. 2020, 2, 100003. [Google Scholar] [CrossRef]
  17. Ying, J.; Jin, H.; Zhang, Y.; Shao, Z. The Pathway of the Role of Campus Green Space Contact Motivation on University Students’ Psychological Well-being—A Moderated Chain Mediation Model. Chin. Landsc. Archit. 1–6. Available online: http://kns.cnki.net/kcms/detail/11.2165.TU.20220720.1603.002.html (accessed on 1 April 2023). (In Chinese).
  18. Liu, Q.; Zhang, Y.; Lin, Y.; You, D.; Zhang, W.; Huang, Q.; van den Bosch, C.C.K.; Lan, S. The relationship between self-rated naturalness of university green space and students’ restoration and health. Urban For. Urban Green. 2018, 34, 259–268. [Google Scholar] [CrossRef]
  19. Wang, S.; Du, H. The Healing Effects of Skycourts in High-rise Office Buildings in the Pearl River Delta. South Archit. 2022, 7, 29–35. (In Chinese) [Google Scholar] [CrossRef]
  20. Yang, G. Research on the design of urban micro-healing space from the perspective of mental health. Xiandai Hortic. 2021, 44, 60–61. (In Chinese) [Google Scholar] [CrossRef]
  21. Chien, J.W.; Yang, Y.R.; Chen, S.Y.; Chang, Y.J.; Chan, C.C. Urban Open Space Is Associated with Better Renal Function of Adult Residents in New Taipei City. Int. J. Environ. Res. Public Health 2019, 16, 2436. [Google Scholar] [CrossRef]
  22. Luo, X.; Ge, J.; Chen, F.; Kazunori, H. Residential Environment Evaluation Model and Residential Preferences of the Changjiang Delta Region of China. J. Asian Archit. Build. Eng. 2007, 6, 299–306. [Google Scholar]
  23. Huang, J.; Ge, X. A Study of Built Environment Evaluation Based on Street View Images—Taking Green View Ratio and Green Land Ratio as Examples. J. Soc. Sci. Humanit. 2020, 2, 80–84. [Google Scholar]
  24. Zhu, L.; Meng, H.; Long, J. Elements and Research Framework Construction of “Human-Centered” Elements and Research Framework Construction of “Human-Centered” Healing Landscape in the Post-Pandemic Era. Urban Environ. Des. 2021, 374–381. (In Chinese) [Google Scholar] [CrossRef]
  25. Wan, J.; Zhao, Y.; Chen, Y.; Wang, Y.; Su, Y.; Song, X.; Zhang, S.; Zhang, C.; Zhu, W.; Yang, J. The Effects of Urban Neighborhood Environmental Evaluation and Health Service Facilities on Residents’ Self-Rated Physical and Mental Health: A Comparative and Empirical Survey. Int. J. Environ. Res. Public Health 2022, 19, 4501. [Google Scholar] [CrossRef] [PubMed]
  26. Liu, Q.; Chen, Y.; Zhang, W.; Zhang, Y.; Huang, Q.; Lan, S. Tourists’ environmental preferences, perceived restoration and perceived health at Fuzhou National Forest Park. Resour. Sci. 2018, 40, 381–391. (In Chinese) [Google Scholar] [CrossRef]
  27. Yang, Q.; Zhang, Y. Research on Landscape Quality Evaluation of a City Park Based on the SD Method—A Case Study of the Tanhua Temple Park in Kun-ming. Chongqing Archit. 2022, 21, 20–23, 26. (In Chinese) [Google Scholar]
  28. Wei, L.; Huang, Q. Spring Landscape Quality Evaluation of Six Urban Parks in Shanghai Based on SBE and SD Methods. Landsc. Archit. Acad. J. 2022, 39, 125–134. (In Chinese) [Google Scholar]
  29. Wang, X.; Wu, C.; Yan, J. Experimental Study of the Perceived Restorative Scale (PRS) in Chinese by Evaluating the Restorative Qualities of Urban Park Scenes. Chin. Landsc. Archit. 2019, 35, 45–48. (In Chinese) [Google Scholar]
  30. Xue, L. The Study on the Environmental Perception and Perceived Restorativeness of Tourists in Three Parks of Chengdu. Master’s Thesis, Sichuan Agricultural University, Ya’an, China, 2020. (In Chinese) [Google Scholar] [CrossRef]
  31. Wang, X.; Rodiek, S.; Wu, C.; Chen, Y.; Li, Y. Stress recovery and restorative effects of viewing different urban park scenes in Shanghai, China. Urban For. Urban Green. 2016, 15, 112–122. [Google Scholar] [CrossRef]
  32. Kreibig, S.D. Autonomic nervous system activity in emotion: A review. Biol. Psychol. 2010, 84, 394–421. [Google Scholar] [CrossRef]
  33. Darrow, C.W.; Gullickson, G.R. The peripheral mechanism of the galvanic skin response. Psychophysiology 1970, 6, 597–600. [Google Scholar] [CrossRef]
  34. Martin, I.; Venables, P.H. Mechanisms of palmar skin resistance and skin potential. Psychol. Bull. 1966, 65, 347. [Google Scholar] [CrossRef]
  35. Kaplan, S.; Kaplan, R. Cognition and Environment: Coping in an Uncertain World; Praeger: New York, NY, USA, 1982. [Google Scholar]
  36. Osgood, C.E. The Measurement of Meaning; Illinois Univ Press: Chicago, IL, USA, 1957. [Google Scholar]
  37. Laumann, K.; Gärling, T.; Stormark, K.M. Rating scale measures of restorative components of environments. J. Environ. Psychol. 2001, 21, 31–44. [Google Scholar] [CrossRef]
  38. Herzog, T.R.; Maguire, P.; Nebel, M.B. Assessing the restorative components of environments. J. Environ. Psychol. 2003, 23, 159–170. [Google Scholar] [CrossRef]
  39. Huang, C.-C.; Hwang, F.-M.; Chou, H.-C. The Relationships between Environmental Preference and Restorative Perception of Environment: A Case of Moutainscape. J. Outdoor Recreat. Study 2008, 21, 1–25. (In Chinese) [Google Scholar]
  40. Chen, R.; Han, B.; Lin, F.; Cui, Y.; Pan, H. Relationship between Environmental Quality and Perceived Restoration of Forest Parks. J. Chin. Urban For. 2021, 19, 85–89. [Google Scholar] [CrossRef]
  41. Huang, Y.; Fu, W.; Weng, Y.; Wagn, M. A Study on the Relationship between Individual Landscape Preference, Perceived Restorativeness Scale and Health Benefits Assessment of Urban Forest Pathway—A Case Study of Fudao. Chin. Landsc. Archit. 2020, 36, 73–78. (In Chinese) [Google Scholar] [CrossRef]
  42. Zhuang, W. SD Method and Evaluation of Architectural Space Environment. J. Tsinghua Univ. (Sci. Technol.) 1996, 4, 42–47. (In Chinese) [Google Scholar] [CrossRef]
  43. Cohen-Cline, H.; Turkheimer, E.; Duncan, G.E. Access to green space, physical activity and mental health: A twin study. J. Epidemiol. Community Health 2015, 69, 523–529. [Google Scholar] [CrossRef]
  44. Tsunetsugu, Y.; Park, B.J.; Miyazaki, Y. Trends in research related to “Shinrin-yoku” (taking in the forest atmosphere or forest bathing) in Japan. Environ. Health Prev. Med. 2010, 15, 27–37. [Google Scholar] [CrossRef]
  45. Xiao, Y.; Zhang, Y.; Lu, S.; Kuang, X. Exploring the Relationship Between Multi-Dimensional Residential Greening Perceived Neighborhoods Greenness Level and Residents’ Mental Health Based on Multi-source Data: A Case Study of Shanghai Lilong. Landsc. Archit. 2021, 28, 108–113. (In Chinese) [Google Scholar] [CrossRef]
  46. Morgan, W.P. Affective beneficence of vigorous physical activity. Med. Sci. Sport. Exerc. 1985, 17, 94–100. [Google Scholar] [CrossRef]
  47. North, T.C.; McCullagh, P.; Tran, Z.V. Effect of exercise on depression. Exerc. Sport Sci. Rev. 1990, 18, 379–416. [Google Scholar] [CrossRef] [PubMed]
  48. Bahrke, M.S.; Morgan, W.P. Anxiety reduction following exercise and meditation. Cogn. Ther. Res. 1978, 2, 323–333. [Google Scholar] [CrossRef]
Figure 1. The plane layout of the campus of the China University of Mining and Technology (Beijing).
Sustainability 15 08369 g001
Figure 2. Façade forms of buildings around the campus courtyard.
Sustainability 15 08369 g002
Figure 3. Samples: (a) Courtyard Ⅰ: large lawn, low density of shrubs and trees, a badminton court; (b) Courtyard Ⅱ: medium lawn, medium density of shrubs and trees, a hard-ground square with wooden benches; (c) Courtyard Ⅲ: medium lawn, high density of shrubs and trees, an antique pavilion.
Sustainability 15 08369 g003
Figure 4. Example of an SD scale questionnaire.
Sustainability 15 08369 g004
Figure 5. Analytical framework.
Sustainability 15 08369 g005
Figure 6. Radar graph of PRS results: (a) sub-item scores of three samples; (b) classification scores of three samples.
Sustainability 15 08369 g006
Figure 7. Radar graph of SD method results: (a) sub-item scores of three samples; (b) classification scores of three samples.
Sustainability 15 08369 g007
Figure 8. Scree plot.
Sustainability 15 08369 g008
Figure 9. Species and layout of courtyard plants: (a) Courtyard Ⅰ; (b) Courtyard Ⅱ; (c) Courtyard Ⅲ.
Sustainability 15 08369 g009
Figure 10. Main activity spaces in sample courtyards: (a) Courtyard Ⅰ; (b) Courtyard Ⅱ; (c) Courtyard Ⅲ.
Sustainability 15 08369 g010
Figure 11. Forms of sample courtyards path: (a) Courtyard Ⅰ; (b) Courtyard Ⅱ; (c) Courtyard Ⅲ.
Sustainability 15 08369 g011
Table 1. Evaluation form of campus courtyard space based on SD method.
ClassificationNumberItemsAdjectives
Ornamental (A)Landscape image (A1)1Plant coverageBarren/Lush
2Plant colors and speciesPoor/Abundant
3Landscape coordinationChaos/Harmonious
4Landscape attractionUnattractive/Attractive
5Elements richnessPoor/Abundant
6ImpressionForgettable/Memorable
7Sense of harmonyIncompatible/Harmonious
Spatial organization (A2)8Sense of interactionIsolated/Familiar
9Sense of oppressionOppressive/Relaxed
Uniqueness (B)Interface form (B1)10Interface material richnessPoor/Abundant
11Ground pavement feelingSudden/Harmonious
12Color perceptionSame/Rich
13Color temperatureCold/Warm
Luminous environment (B2)14Lighting effectBoring/Beautiful
15Light levelDim/Bright
Activity (C)Active factors (C1)16Resting facilities comfortUncomfortable/Comfortable
17Activity space richnessLack/Sufficient
Table 2. PRS (Chinese version) [39].
CharacteristicsNumberItems
Being away(A)A1This can give me an experience that is out of the world.
A2This place gives me a break from the routine of my daily life.
A3This is a place where I can rest completely.
A4The environment here can help me relax my tense mood.
A5I feel free from work and daily life here.
Extent(B)B1I think the surrounding scenery is harmonious.
B2I am quite curious about the invisible landscape.
B3The landscape here can make me extend many beautiful associations.
B4The elements of the landscape here are matched.
Fashion(C)C1The environment here has attractive characteristics.
C2The environment here can attract me to explore and discover more.
C3The environment here is charming.
C4I will want to spend more time in this environment.
Compatibility(D)D1I can do what I like here.
D2I can adapt to the environment here quickly.
D3I feel that I have integrated with this environment.
D4I can find a way to enjoy myself here.
D5This place is very suitable for doing what I like.
Table 3. Descriptive statistics of PRS results.
NumberNAverage ValueStandard DeviationVariance
16465.0520.67427.03
24978.1222.01484.36
35292.5620.48419.43
Base line-68.00--
Table 4. Statistics of the results of the SD scale and summary of the original classification scores.
NumberItemsCourtyardCategoriesCourtyard
1Plant coverage2.894.805.35Ornamental3.454.475.28
2Plant colors and species2.483.985.13
3Landscape coordination4.164.555.25
4Landscape attraction3.144.415.31
5Element richness2.914.315.46
6Impression2.944.275.25
7Sense of harmony4.114.675.27
8Sense of interaction3.674.395.37
9Sense of oppression4.724.845.15
10Interface material richness3.533.824.67Uniqueness4.024.335.12
11Ground pavement feeling4.644.375.08
12Color perception3.334.205.19
13Color temperature4.674.555.21
14Lighting effect3.644.515.48
15Light level4.314.535.06
16Resting facilities comfort3.864.335.02Activity3.954.244.98
17Activity space richness4.034.144.94
Total-63.0374.6788.19----
Table 5. Total variance interpretation.
ComponentsInitial EigenvalueSums of Squared LoadingsRotation Sums of Squared Loadings
Total %Accumulated %Total %Accumulated %Total %Accumulated %
Initial120.85855.25520.85855.25514.40838.169
23.61164.8213.61164.82110.06064.821
Recalibration120.85855.2559.12053.6455.85734.454
23.61164.8211.63163.2394.89363.239
Table 6. Renaming of common factors.
Common FactorNumberInitial ItemsFactor LoadingsCommon Factor VarianceVariance Devoting Rates/%
Factor 1Factor 2(Recalibration)
Perceived Quality1Plant coverage0.8320.1970.73238.169
2Plant colors and species0.9010.1470.832
4Landscape attraction0.7860.3860.766
5Elements richness0.8690.2940.842
6Impression0.8260.3120.780
8Sense of interaction0.6390.4460.607
12Color perception0.7290.3590.660
14Lighting effect0.5630.5510.621
Experience Quality3Landscape coordination0.4660.6530.64326.652
7Sense of harmony0.4220.7090.681
11Ground pavement feeling0.1790.7010.523
13Color temperature0.0760.7780.611
16Resting facilities comfort0.4120.6610.607
17Activity space richness0.2980.6890.563
Table 7. Common factor scores of the samples.
SamplesPerceived QualityExperience Quality
Courtyard Ⅰ30.36733.650
Courtyard Ⅱ39.01737.769
Courtyard Ⅲ46.81944.159
Disclaimer/Publisher’s Note: The statements, opinions and data contained in all publications are solely those of the individual author(s) and contributor(s) and not of MDPI and/or the editor(s). MDPI and/or the editor(s) disclaim responsibility for any injury to people or property resulting from any ideas, methods, instructions or products referred to in the content.