Article

Study on Seismic Performance Optimization of Assembly Concrete-Filled Steel Tubular (CFST)-Laced Piers

1
College of Civil Engineering, Hefei University of Technology, Hefei 230009, China
2
Anhui Transport Consulting and Design Institute Co., Ltd., Hefei 230088, China
*
Author to whom correspondence should be addressed.
Sustainability 2023, 15(10), 8318; https://doi.org/10.3390/su15108318
Submission received: 20 April 2023 / Revised: 12 May 2023 / Accepted: 14 May 2023 / Published: 19 May 2023

Abstract

:
This study aims to investigate the seismic behavior of concrete-filled steel tubular (CFST)-laced piers; after verifying the model through engineering tests, the simplified finite element models (S-FEM) and refined ones (R-FEM) with CFST-laced piers are developed in this manuscript, respectively. Through comparison, it is found that the S-FEM can effectively improve analyzing efficiency while meeting the requirements of engineering analysis accuracy. In addition, the seismic response of assembled flange-connected CFST-laced piers bridge was studied based on the S-FEM, and different structural parameters, including pier height, axial compression ratios, steel ratios of CFST columns, steel lacing tube arrangement, and longitudinal slope, are considered to optimize the bridge design scheme. Results indicate that the parameters of 0.1 axial pressure ratios and 1:30 longitudinal slope show superior seismic performance. Meanwhile, the peak axial force and peak bending moment of CFST column limbs occur at the pier bottom, and the flanges, which are subject to larger bending moments, are generally located at the two connection positions above the pier bottom.

1. Introduction

Concrete-filled steel tubular (CFST) four-limb-laced columns (piers) use four circular CFST column limbs as chord tubes and hollow steel tubes as lacing tubes (Figure 1). Due to many advantages such as high bearing capacity, high structural stiffness, superior seismic performance, simple construction, material saving, and environmental protection, etc., assembled CFST-laced piers began to be widely used in mountainous areas.
CFST has been deeply studied by scholars in the past decades. For static behavior of CFST-laced columns, Han et al. [1] investigated the fire performance of CFST-laced columns by a test, and the test results indicate that CFST triple-limb-laced columns have good integrity because of the steel lacing tubes.
To study the failure mechanism of CFST columns at ultimate loads, Ou Z et al. [2] conducted a series of tests, and the experimental results were used to validate several analytical models. Huang et al. [3] studied the ultimate load of laced columns with initial stress by axial loading test, and found that the initial stress has little effect on the mechanical properties of lacing tubes.
To date, studies on the overall seismic performance of bridges with CFST-laced piers are still insufficient. Previous studies on seismic performance usually focused on the component level. Scholars [4,5,6,7,8] carried out the hysteresis performance tests and finite element analysis to investigate the seismic performance of CFST-laced piers; the results showed that the CFST columns have good ductility and energy dissipation capacity. In more detail, to improve the rapid repair capacity of bridges after earthquakes, Zhang et al. [8] proposed a replaceable connection component for laced piers. Hajjar and Gourley [9,10] put forward two theoretical models to calculate the hysteretic curve of concrete-filled square steel tubular structures. Moreover, Aval et al. [11] used the fiber model method to analyze the load–displacement hysteresis curves of CFST under cyclic load, which takes the steel tube combined effect into account with core concrete and bond–slip effect. Additionally, similar studies also can be seen in the research of [2,12].
It should be noted that the application research of CFST-laced columns in bridge engineering is still in its infancy. In particular, the current study on CFST-laced piers in segmental prefabricated assemblies is limited and lacks engineering examples to promote its development and application. The new type of assembled flange-connected CFST-laced columns proposed in this paper has a novel structure. It adopts a new form of hollow CFST column limbs and internal flange connection (see Figure 1), which effectively realizes the construction concept of standardized design, factory prefabrication, and assembled construction, and also greatly reduces the construction difficulty of mountainous bridges. However, due to the innovative structure of this new lace pier, there is still a lack of relevant design codes and standards, which poses many difficulties in the design process, such as the mechanical properties of key components, seismic performance, and identification of key design parameters. These difficulties will have an important impact on the safety, durability, and economy of the CFST-laced piers [13,14]. Moreover, due to the low stiffness of the overall structural system of this bridge, the mass and stiffness distribution of the superstructure may have some influence on the seismic response of the structure, which needs efficient seismic analysis models for the bridge with CFST-laced piers.
Due to the above considerations, to further investigate the seismic performance of a real bridge with hollow CFST-laced columns, this manuscript used the finite element analysis software SAP2000 to verify the experimental steel–concrete model, and developed two finite element models: a simplified model using an equivalent section of superstructure replaced, and a refined model taking into account the mass and stiffness distribution of the superstructure [15]. The applicability of the two models was evaluated by analyzing the static properties, dynamic properties, and seismic response of the structure. In addition, the seismic response mechanisms of assembled flange-connected CFST-laced piers were studied, and their seismic design was optimized with five optimized parameters, including pier height, axial compression ratios, steel ratios of CFST columns, and longitudinal slope. Generally, this study aims to obtain a simple and effective seismic analysis model, and will provide useful information for the design of CFST-laced columns in composite bridges.

2. Materials and Methods

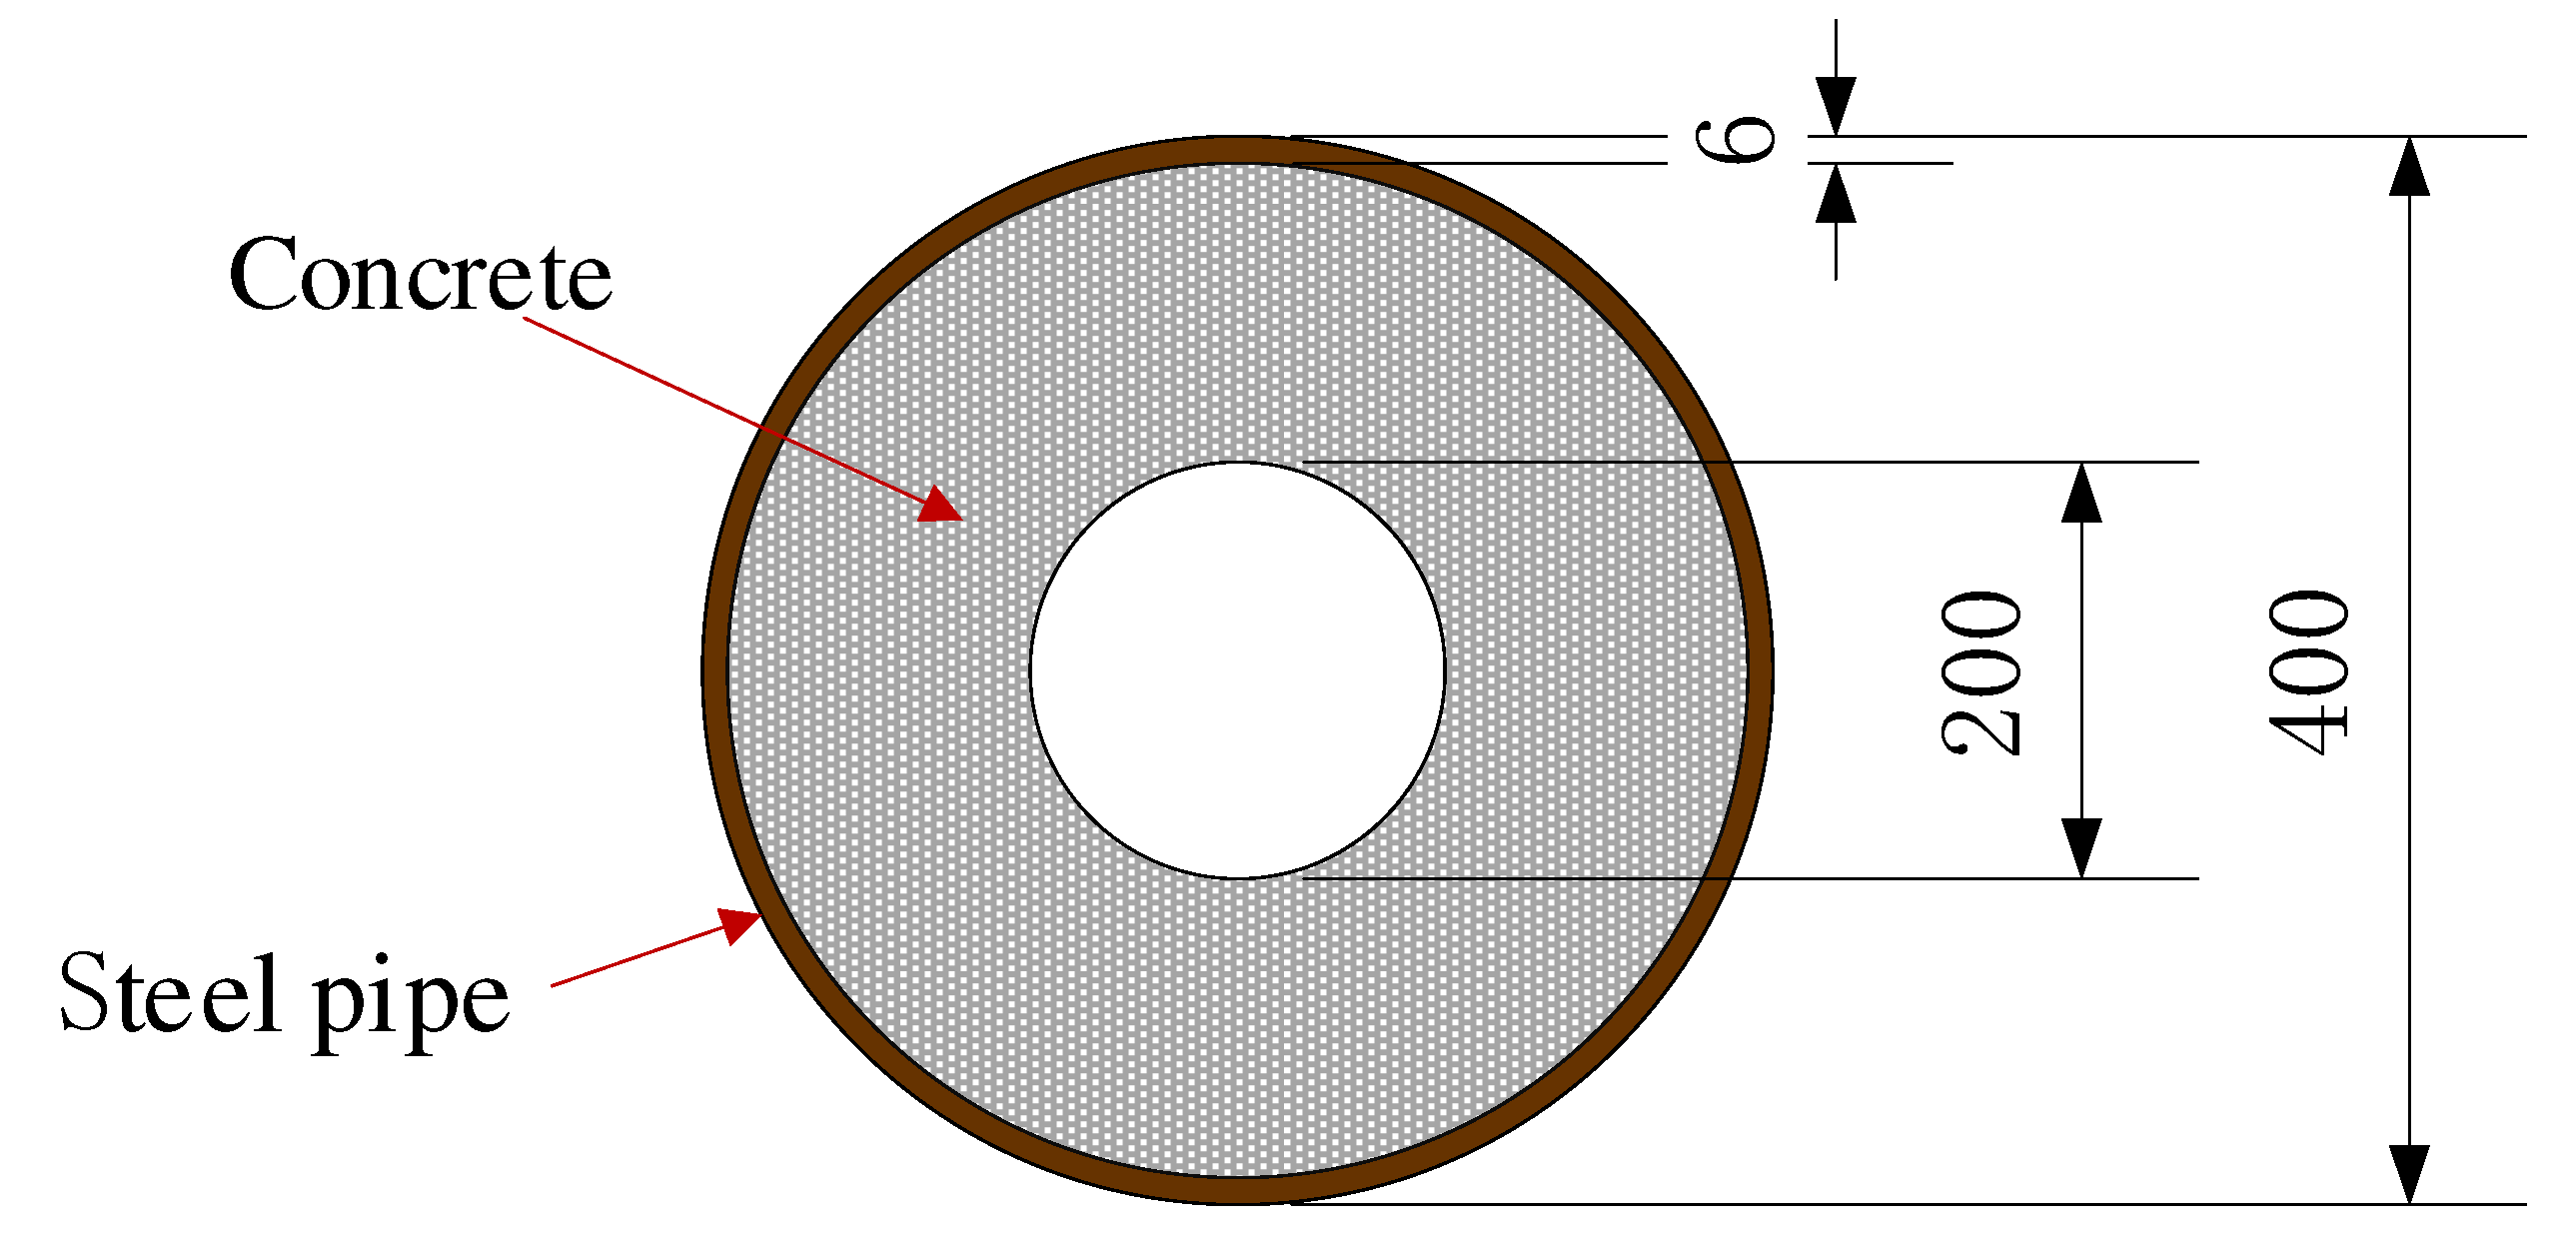
To validate the proposed modeling method for CFST in this paper, finite element simulations were carried out based on the bending test of CFST conducted by Reference [16]. The correctness of the proposed modeling method can be validated by comparing the numerical results with the experimental data. This section takes the SC1 specimen of Reference [16] as an analysis object, which has an outer diameter of 400 mm, an inner diameter of 200 mm, and a steel tube wall thickness of 6 mm made of Q235B steel, and is filled with C80 high-strength concrete with a wall thickness of 94 mm. The loading device adopts a hydraulic jack for two-point symmetrical loading, with a loading span of 3.6 m and a pure bending beam length of 1 m (see Figure 1 and Figure 2). The material properties of the specimen are shown in Table 1.

2.1. Numerical Modeling

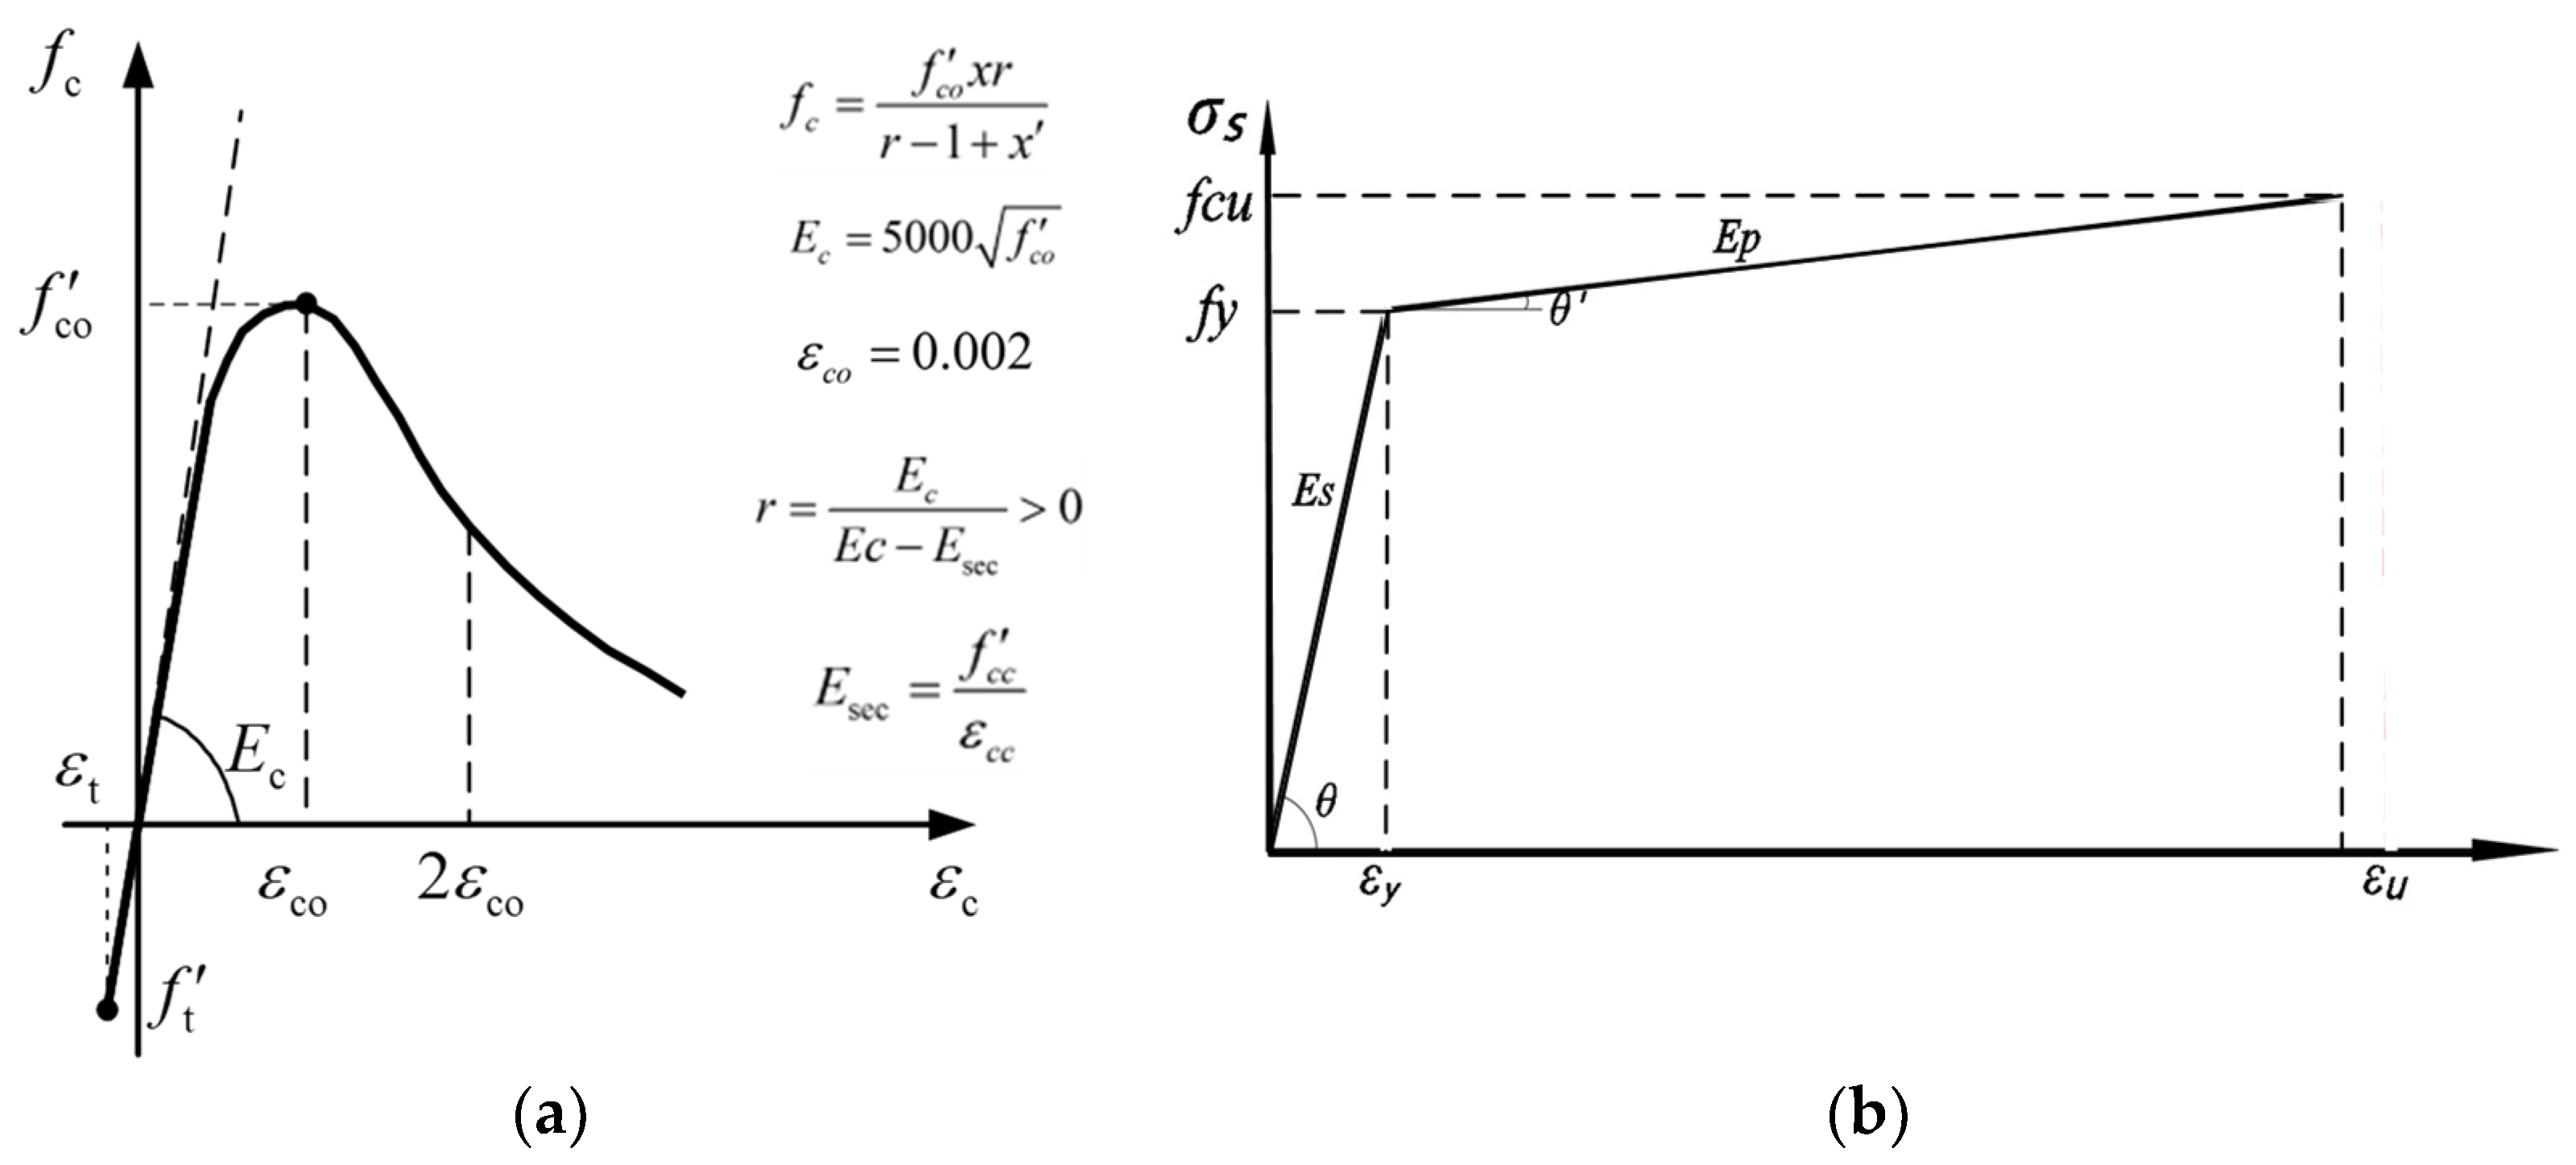
As illustrated in Figure 3 and Figure 4, the model was established based on a 1:1 scale of the experimental setup, and the entire model was built using beam elements. The stress–strain relationship of concrete used in the numerical model was based on the envelope curve recommended by Mander [17], where f c o represents the compressive strength of the cylinder, E c represents the elastic modulus, and ε c o represents the strain corresponding to the peak stress of the unconfined concrete, which is generally taken as 0.002. The steel tube was modeled using the bilinear model for its constitutive behavior, where E s represents the elastic modulus and is measured in 2.06 × 10⁵ MPa.

2.2. Model Verification

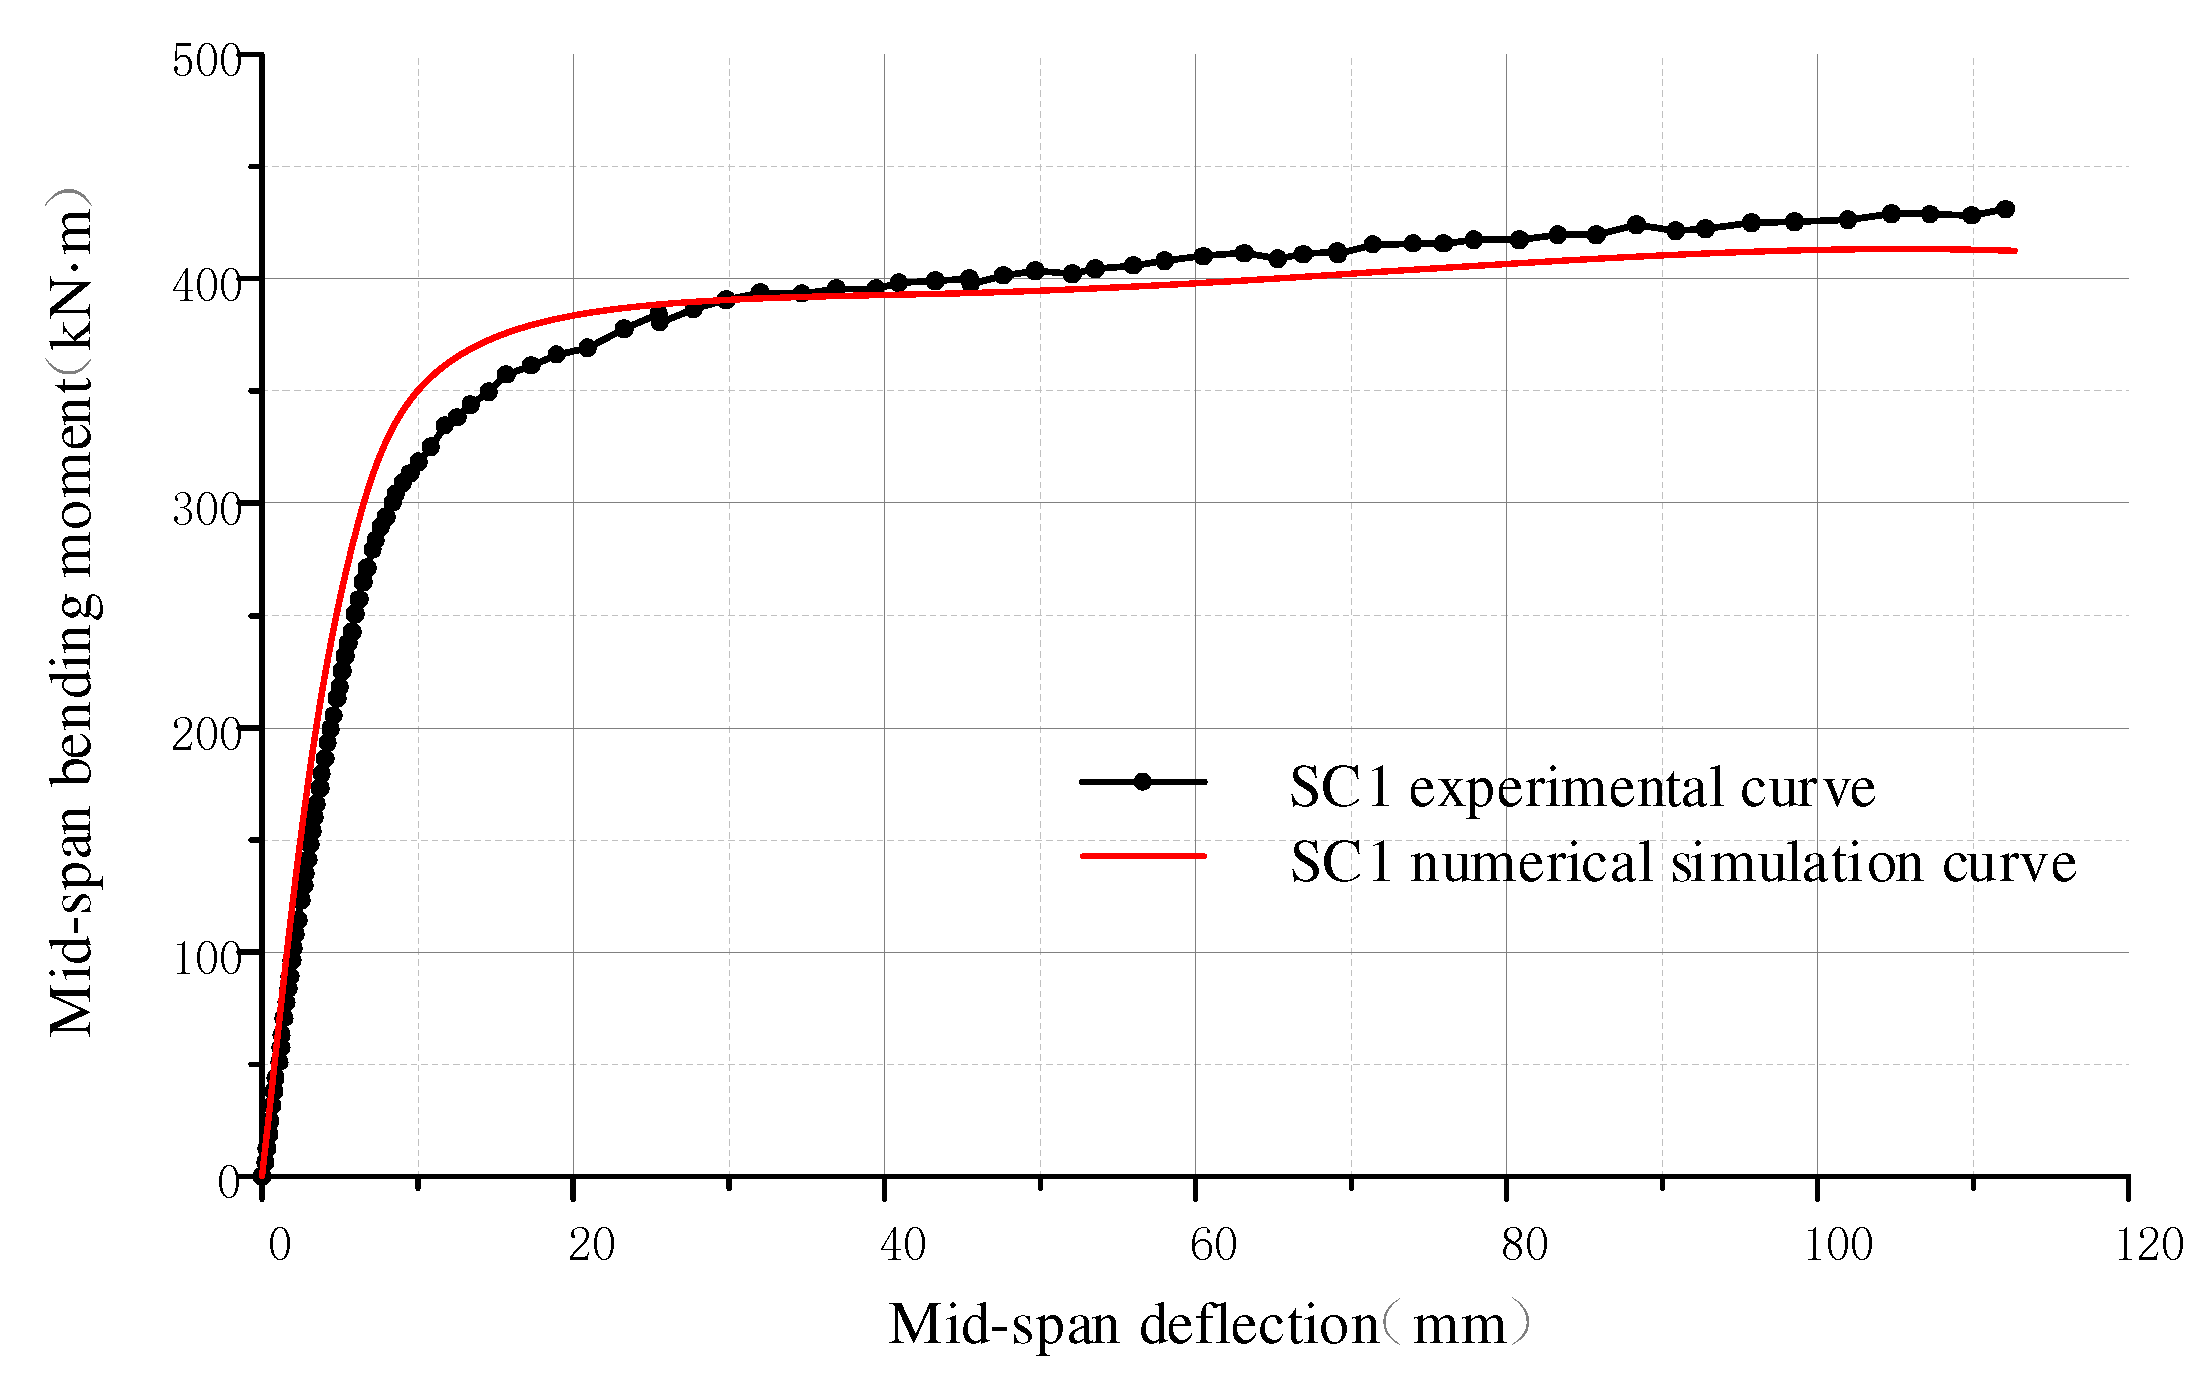
According to the experimental loading scheme, a force-controlled step loading is first used until reaching yield, followed by displacement-controlled loading with each step of 2 mm, up to a total displacement of 110 mm. The moment–displacement curve at mid-span of the structure is obtained, and the comparison of numerical simulation and experimental data is shown in Figure 5. Apparently, by comparing the FEM results with the experimental results, FEM results correspond well with experimental results, which validates the effectiveness of the proposed numerical models of CFST column.

2.3. Finite Element Model (FEM)

2.3.1. Bridg Overview

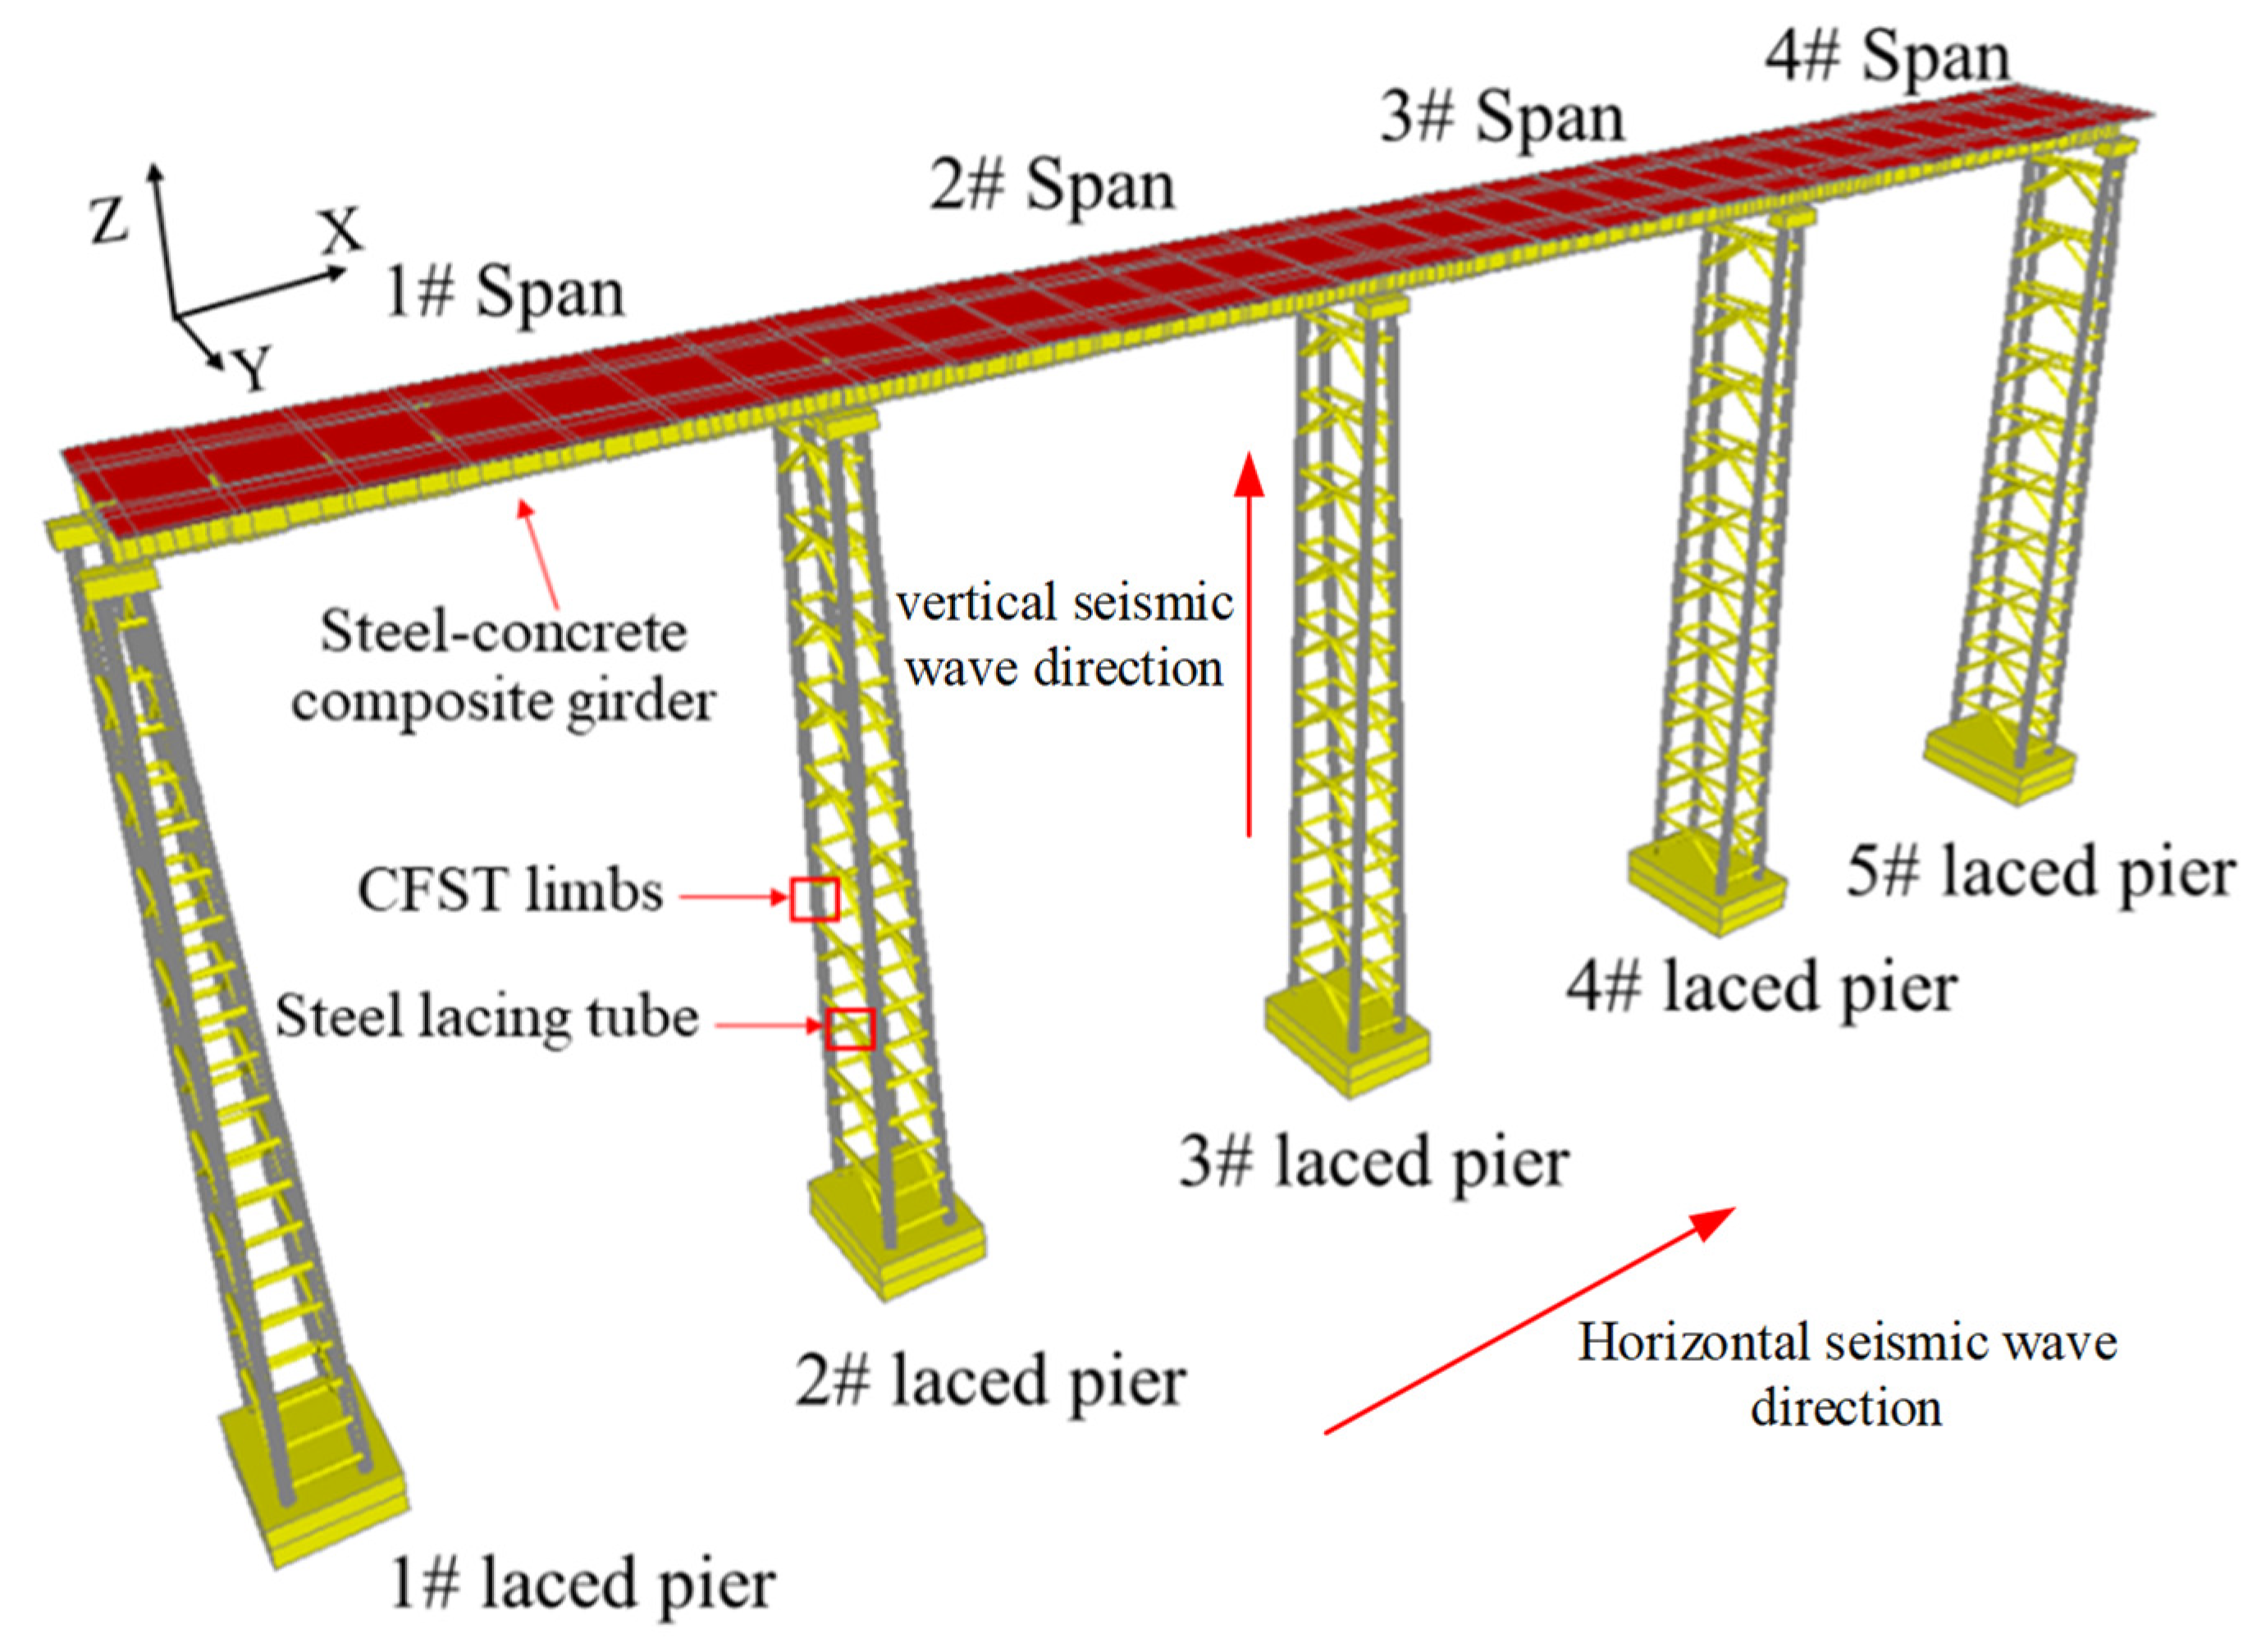
To investigate the seismic performance of concrete-filled steel tubular (CFST) laced columns, this study takes a real bridge as the object of analysis. The bridge is a 4 × 35 m four-span continuous composite bridge, the substructure is assembled flange connected hollow CFST-laced piers, and the superstructure is made of steel–concrete composite girder; the bridge layout is shown in Figure 6.
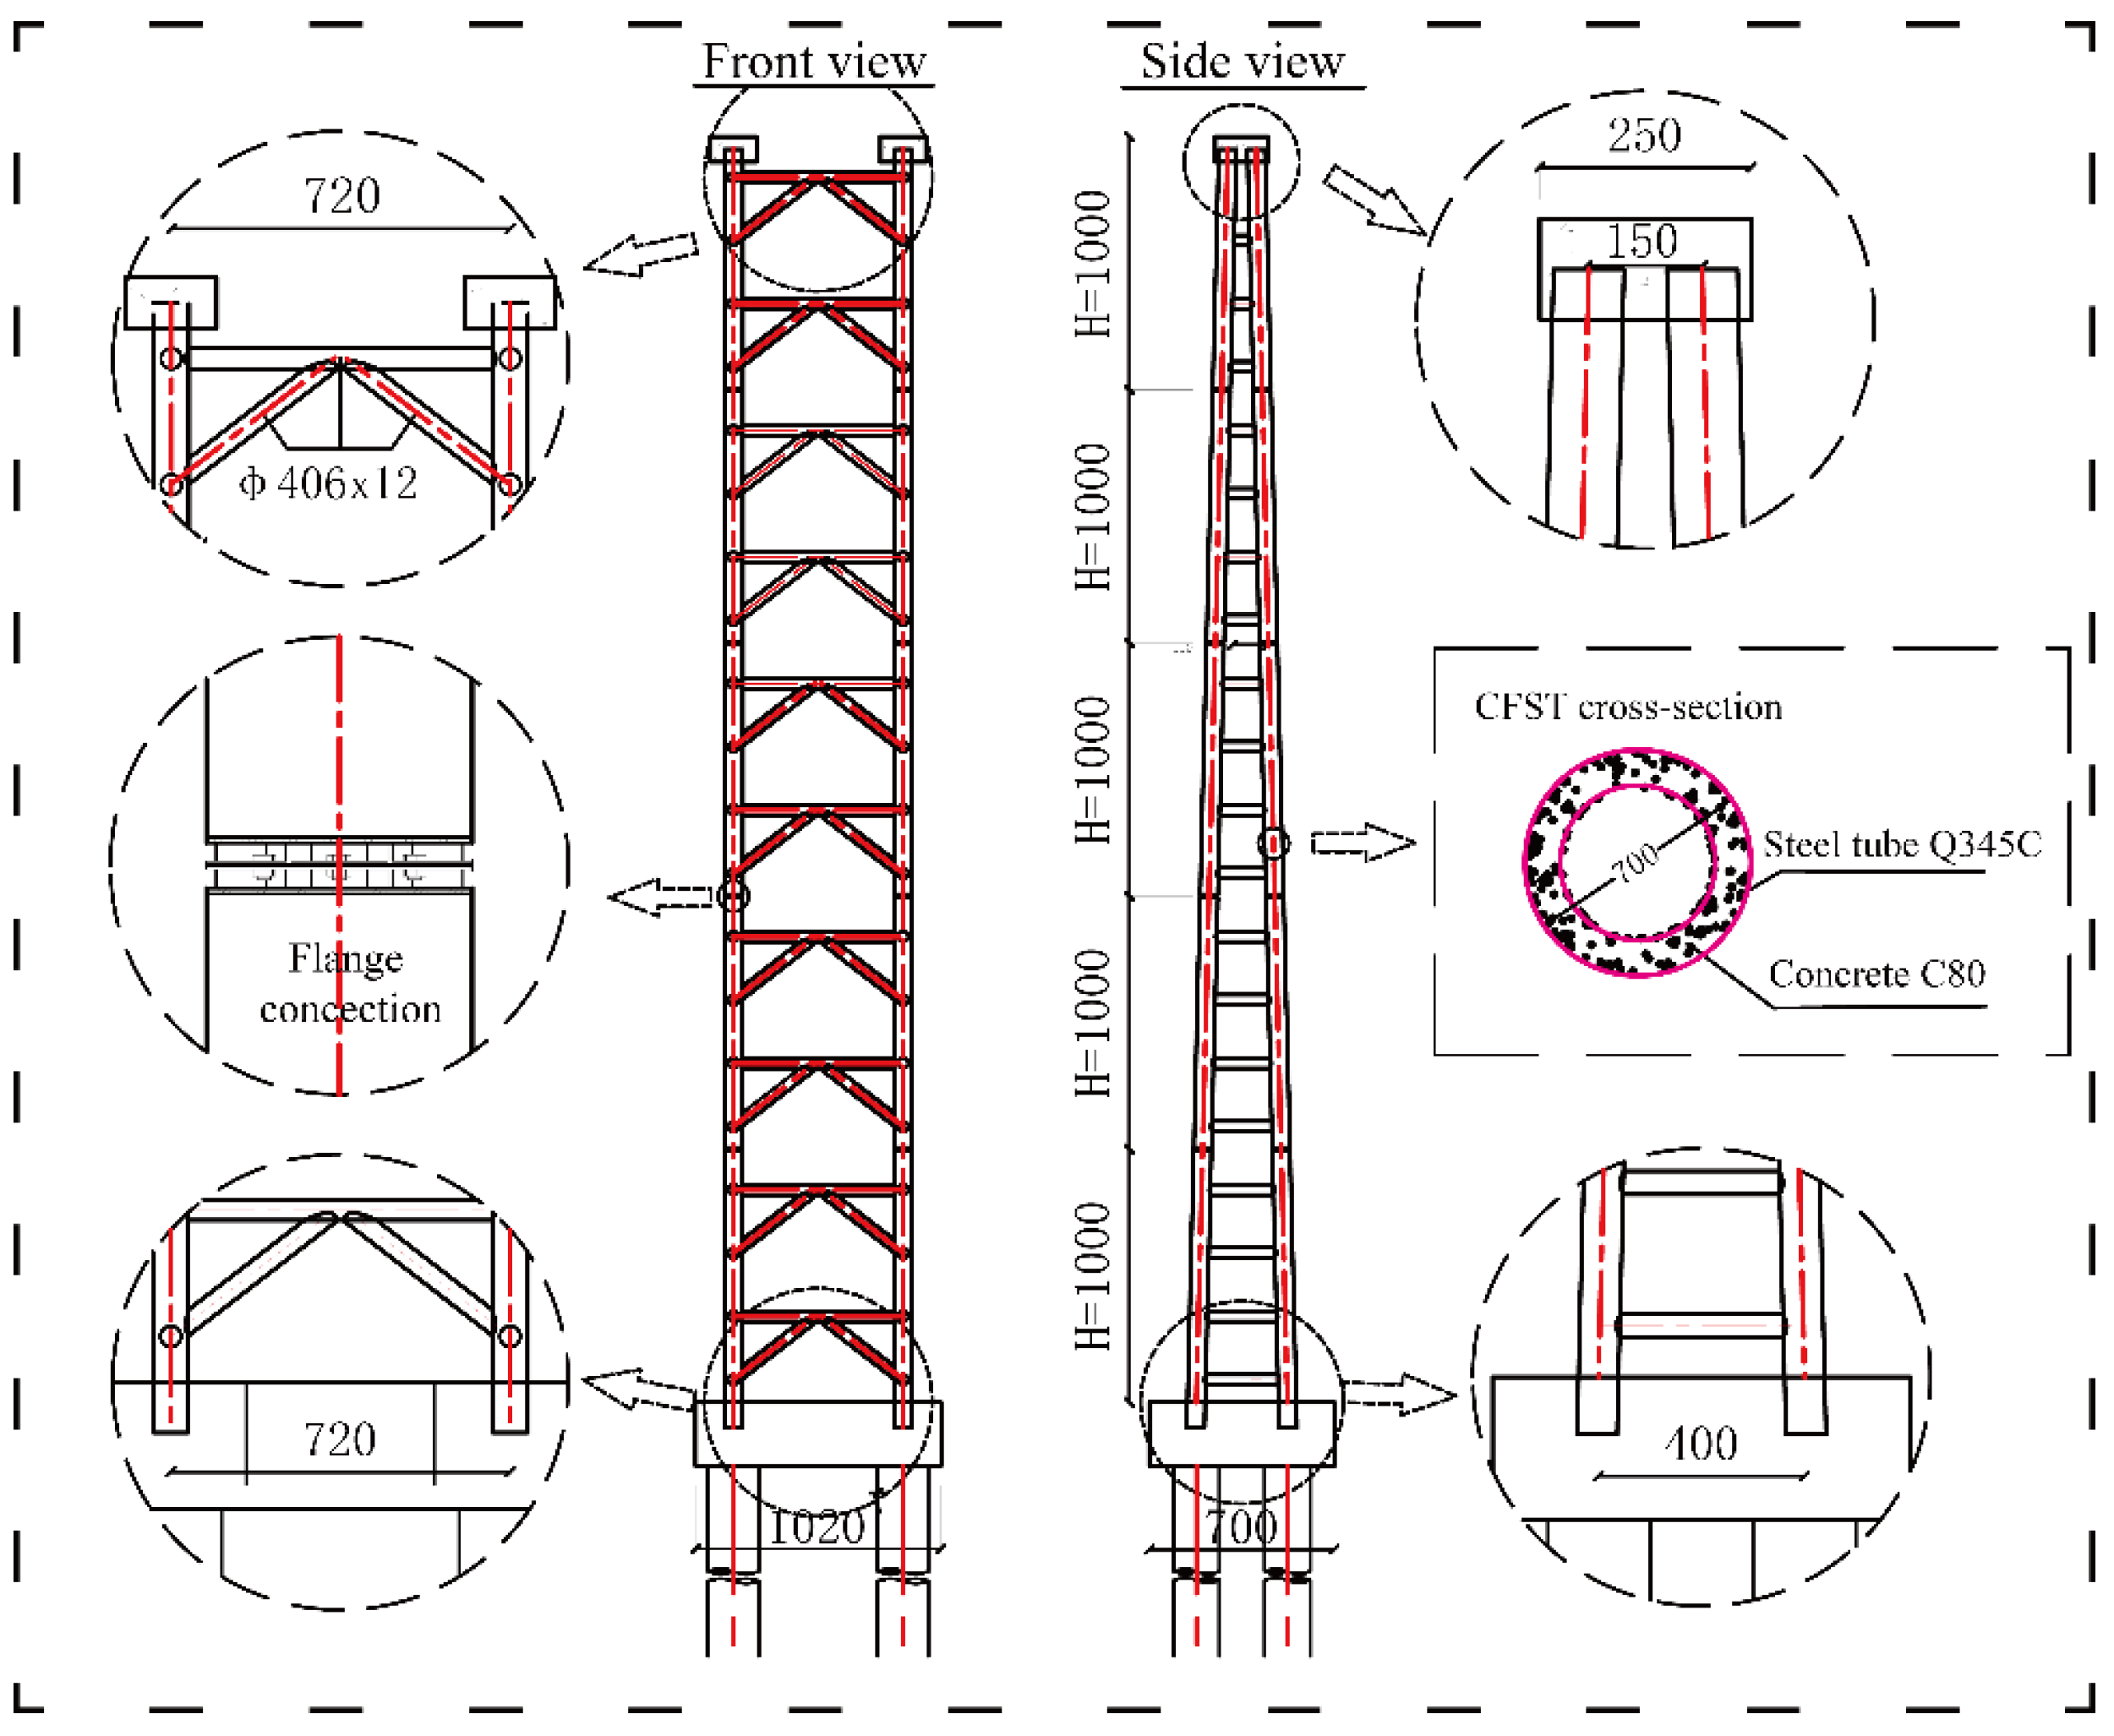
For the steel–concrete composite girders of the bridge superstructure, which consist of I-shaped steel girders and concrete deck slabs. The concrete deck slab is 12.9 m wide and takes C40 concrete (i.e., the cubic compressive strength is 40 MPa). The steel girder consists of two I-shaped beams 1.7 m high; more detailed information about the superstructures is illustrated in Figure 7. The bridge substructures are 50 m high and consist of 5 sections of four-limb CFST-laced columns connected by flanges. Additionally, CFSTs are 700 mm in diameter, and their total wall thickness is 110 mm, of which the wall thickness of steel tube is 12 mm. Steel pipes of 406 mm diameter and wall thickness of 12 mm are adopted in steel lacing tube, and arrangement type of steel lacing tube is K-shaped layout. Q345B steel is used for the Lacing tube, steel pipes, and flanges in CFST-laced columns. C80 high-strength concrete was used for the core concrete in CFTC, C40 concrete was used for cover beam, and C35 underwater concrete was used for the piles. Detailed information about the substructures and the material properties are shown in Figure 8 and Table 2.
The bridge is oriented in the longitudinal direction as the X-axis, the transverse direction as the Y-axis, and the vertical direction as the Z-axis, and FEM of CFST-laced columns bridges was conducted based on SAP2000 (2014). The design parameters of the original bridge scheme are shown in Table 3 and Figure 6, Figure 7 and Figure 8.

2.3.2. Steel–Concrete Composite Girders (SCCG) of the Bridge Superstructure

In general, the bridge superstructure is in an elastic state under seismic action [18,19,20,21,22,23,24]. Due to the small stiffness and mass of the steel–concrete composite girders in this bridge, a reasonable simulation of the actual distribution of stiffness and mass may have some influence on the seismic response of the bridge. Thus, to investigate the effect of the simulation method of steel–concrete composite girders on the seismic response, the frame model (simplified model) and refined model were established in this section. For the frame model, the elastomeric frame element (frame) was chosen to simulate the steel–concrete composite girders without considering the effect of its actual distribution of stiffness and mass on the seismic response. For the refined model, shell element was used to simulate concrete deck slabs, steel girders were simulated by elastomeric frame element, and the shear nail connections between girders and slabs were simulated by Link units, and shear nail stiffnesses were considered in this model. The refined model is able to take into account not only the effect of the actual distribution of stiffness and mass of the composite girder, but also the effect of the mechanical properties of the shear nail connection on the seismic response. However, the refined model is more computationally expensive, especially when performing nonlinear dynamic time history analysis.

2.3.3. Support Installment

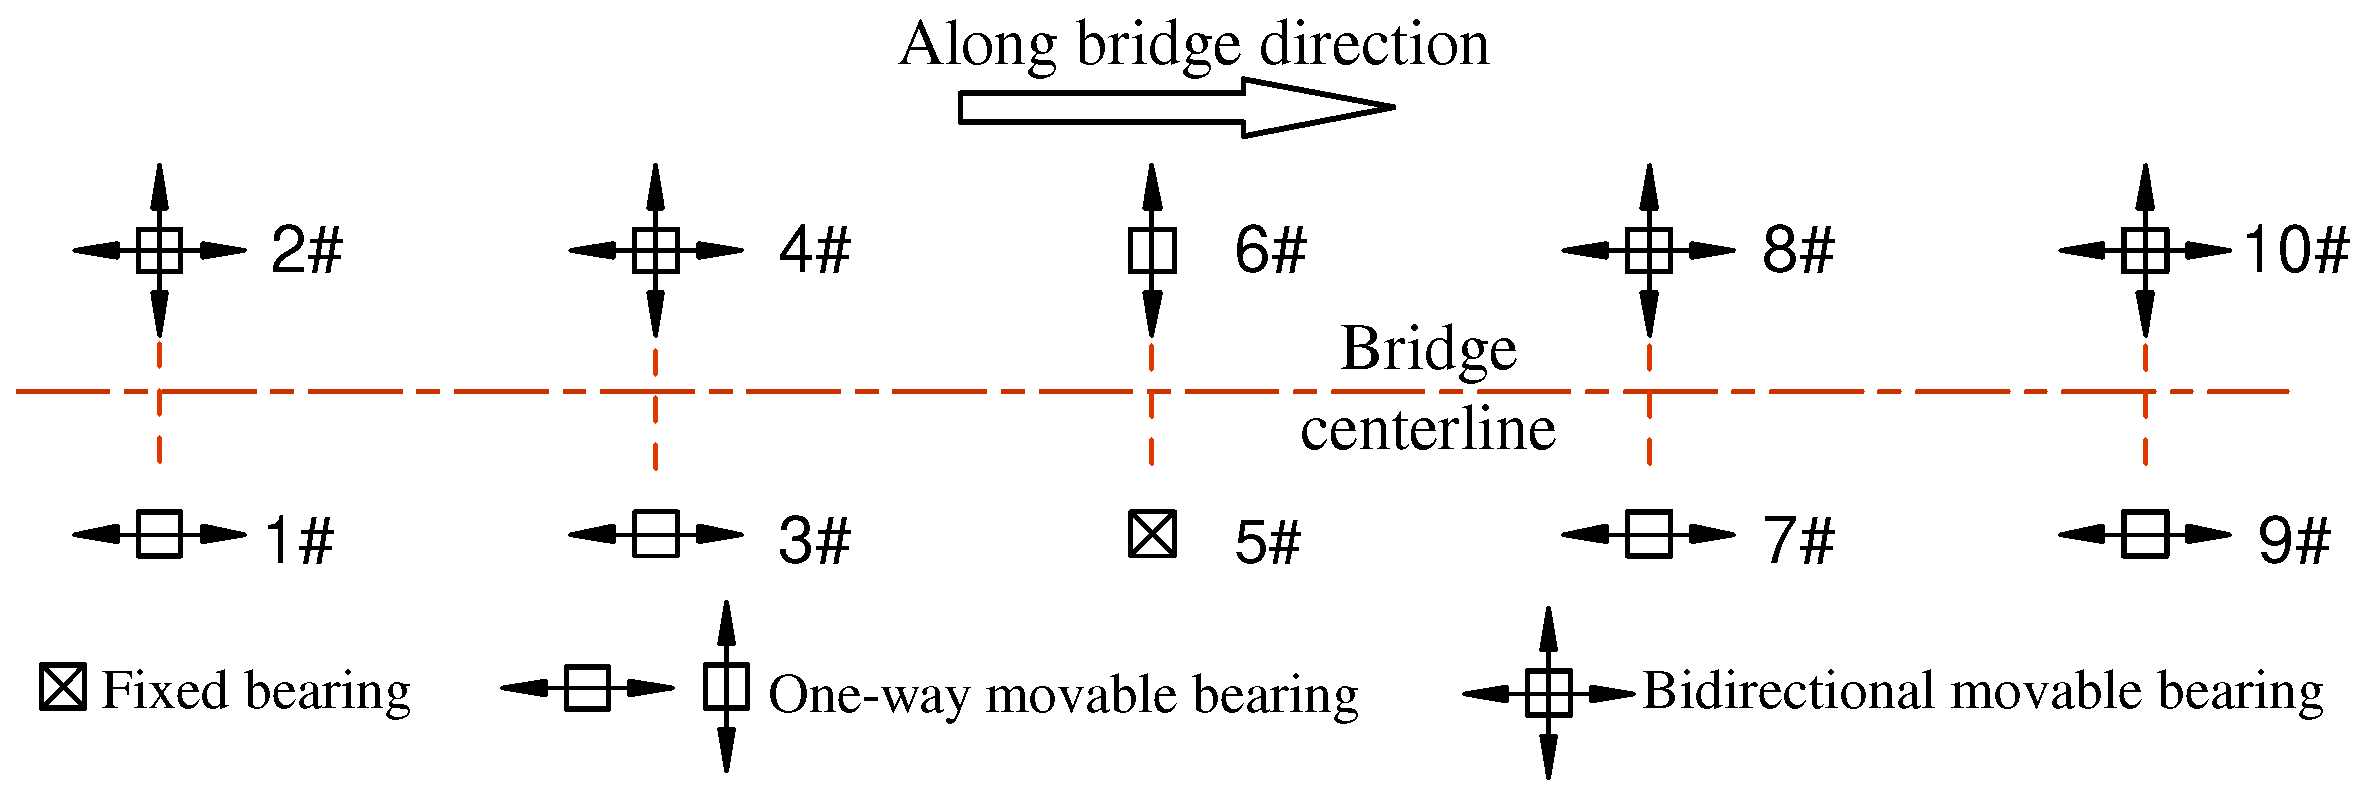
Spherical bearings were used in this bridge, which was simulated by master–slave constraint + Link unit for the dynamic characteristic analysis and elastic dynamic response spectrum analysis. In the nonlinear dynamic time history analysis, the bearings were simulated by the Plastic–Wen elements, and the bearing arrangement of the bridge is shown in Figure 9. This bridge is located in a mountainous area, which has good geological conditions; the soil layer of foundation is hard and can be treated as a rigid foundation; thus, pile–soil interaction is directly simulated by the consolidation method.

2.3.4. Concrete-Filled Steel Tubular (CFST) Laced Columns

Frame elements (frame) were adopted to simulate CFST-laced columns in this study, where the column limbs are steel–concrete combined sections (see Figure 8), and there are two methods of FEM for column limbs.
  • The combined section of CFST;
  • Equivalent section replaced CFST combined section, i.e., simplifying the cross-section based on the principle of equivalent bending stiffness and axial stiffness, and the specific calculation formula is as follows.
Equivalent section flexural stiffness,
E I = E c I c + E s I s
Equivalent cross-sectional axial stiffness,
E A = E c A c + E s A s
In which Ec and Es are elastic moduli of concrete and steel, respectively. Ac and As are the cross-sectional areas of concrete and steel, respectively. Ic and Is are the area moment of inertia of concrete and steel, respectively.

2.3.5. Seismic Wave Selection

According to the Specification for Seismic Design of Highway Bridges (JTG/T2231-01-2020) [25], this bridge is located in a Class II site, which is a Class B bridge with a seismic intensity of Ⅶ degrees. Therefore, the transverse and vertical design acceleration response spectra corresponding to E2 seismic level are generated, as shown in Figure 10. The Reference [26] presents a methodology for synthesizing artificial seismic waves, enabling the generation of seven seismic waves that correspond to the horizontal and vertical design acceleration response spectra of E2. These seven seismic waves are then employed for comprehensive time history analysis, facilitating a thorough investigation of the seismic response.

3. Results and Discussions

3.1. Comparative Analysis of Different Modeling Methods

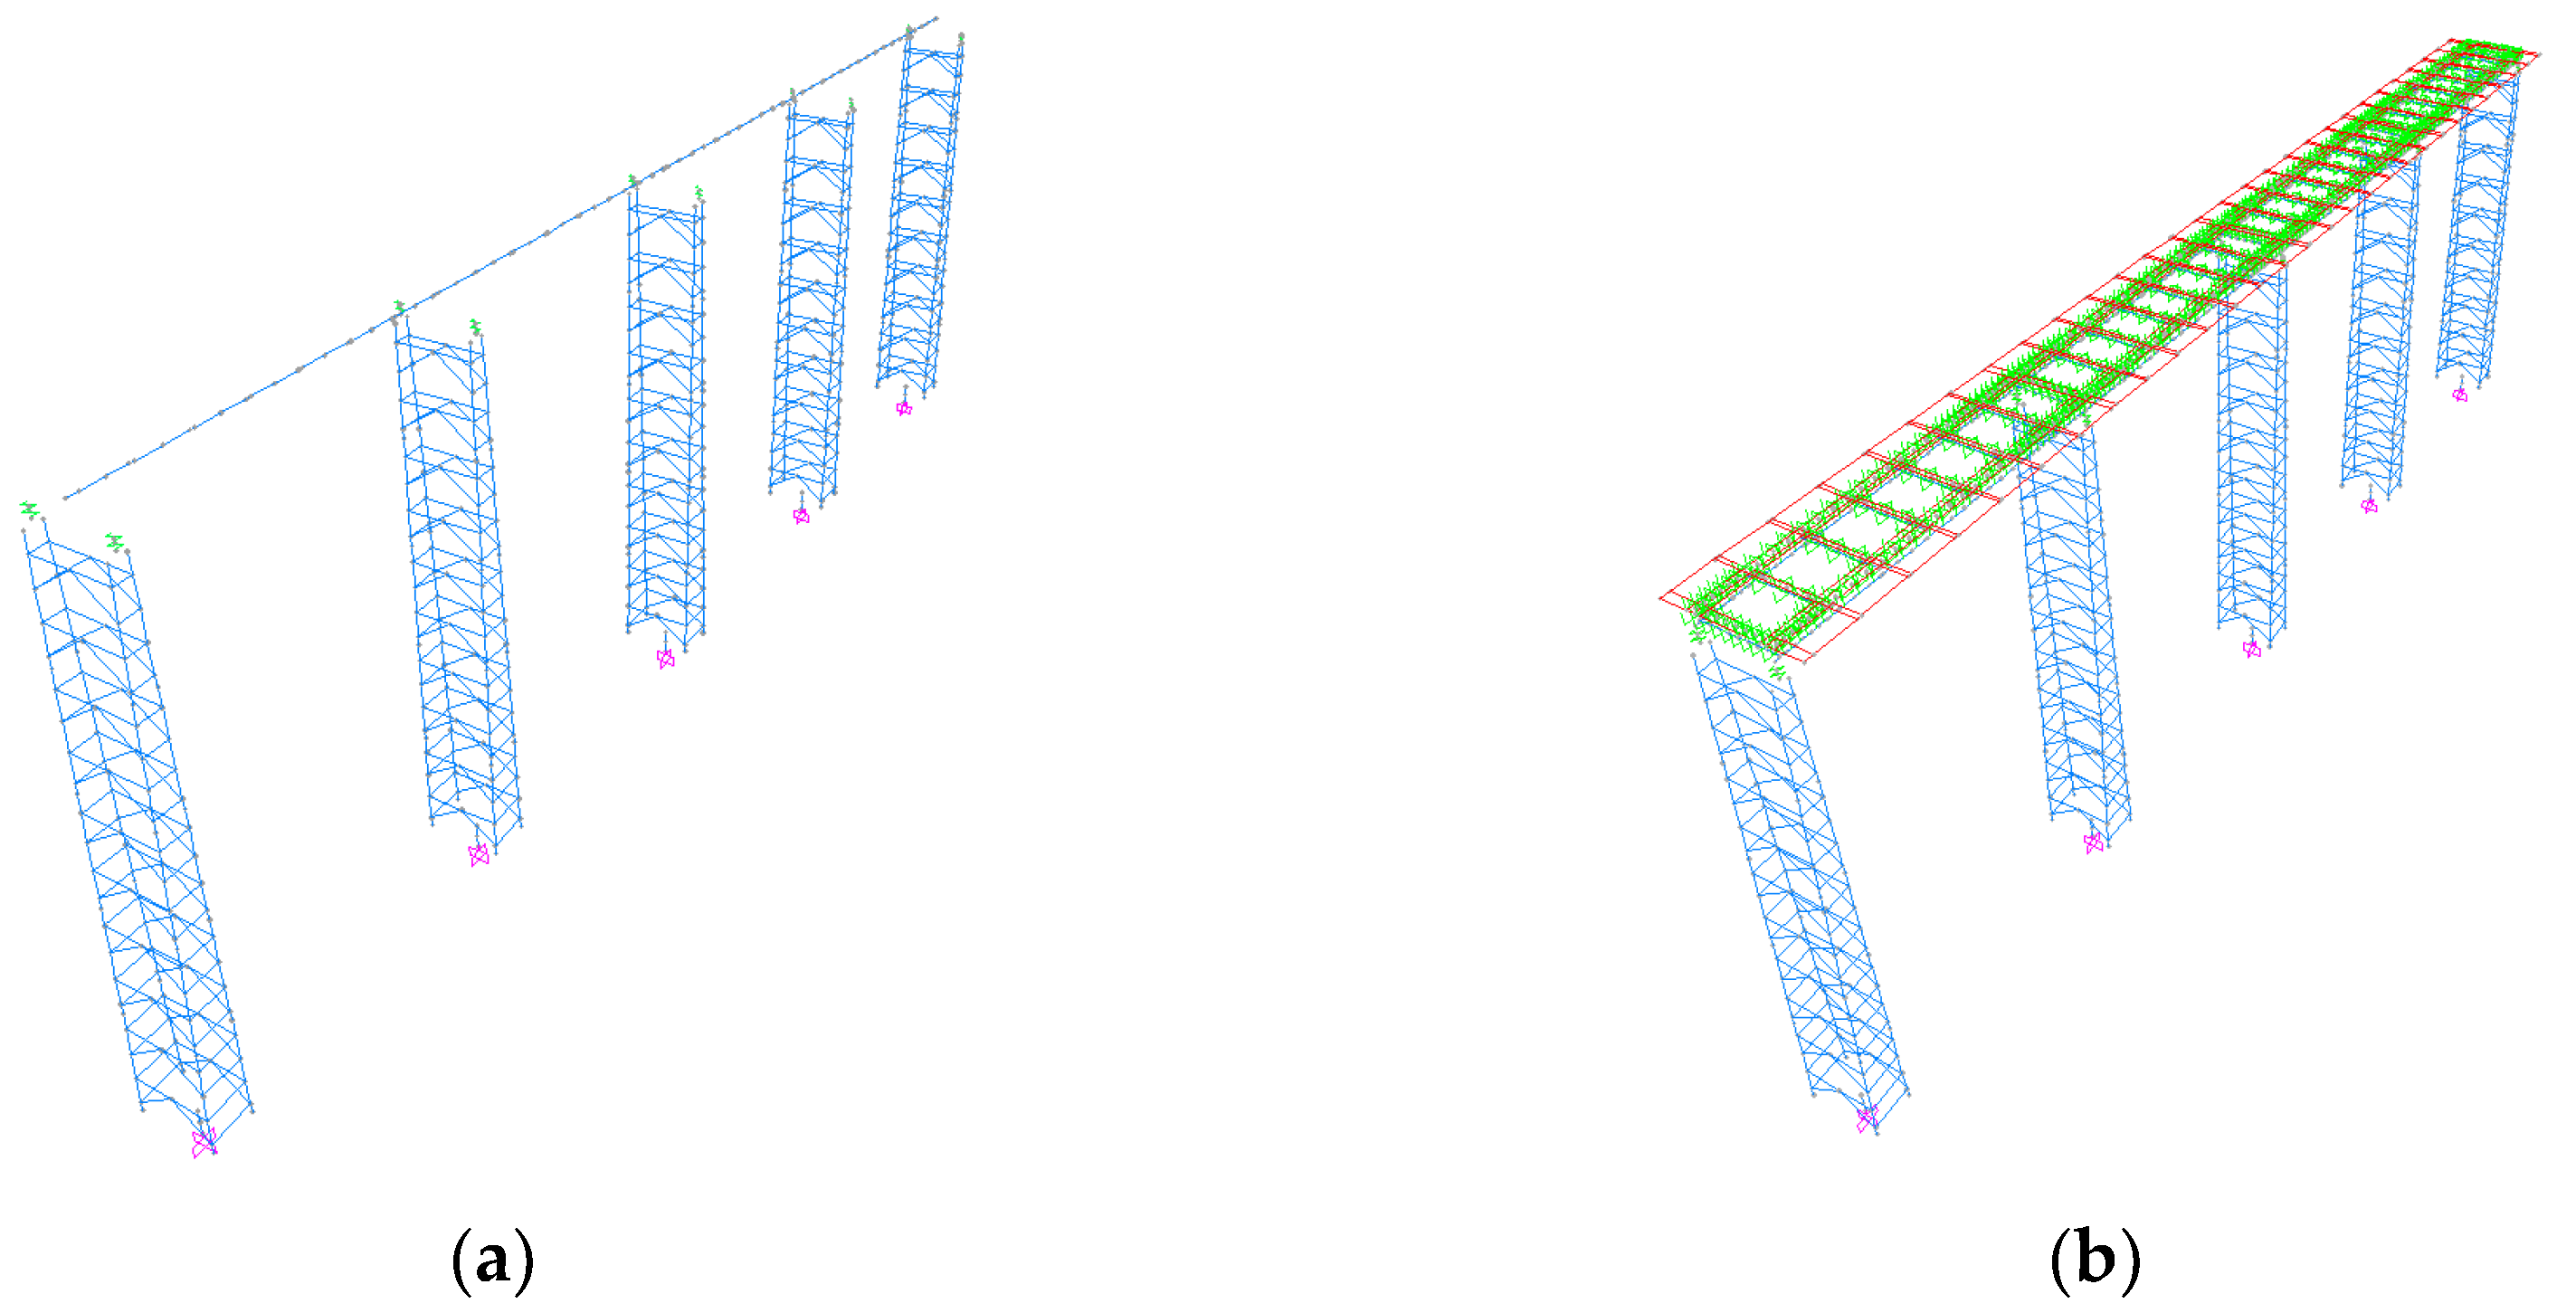
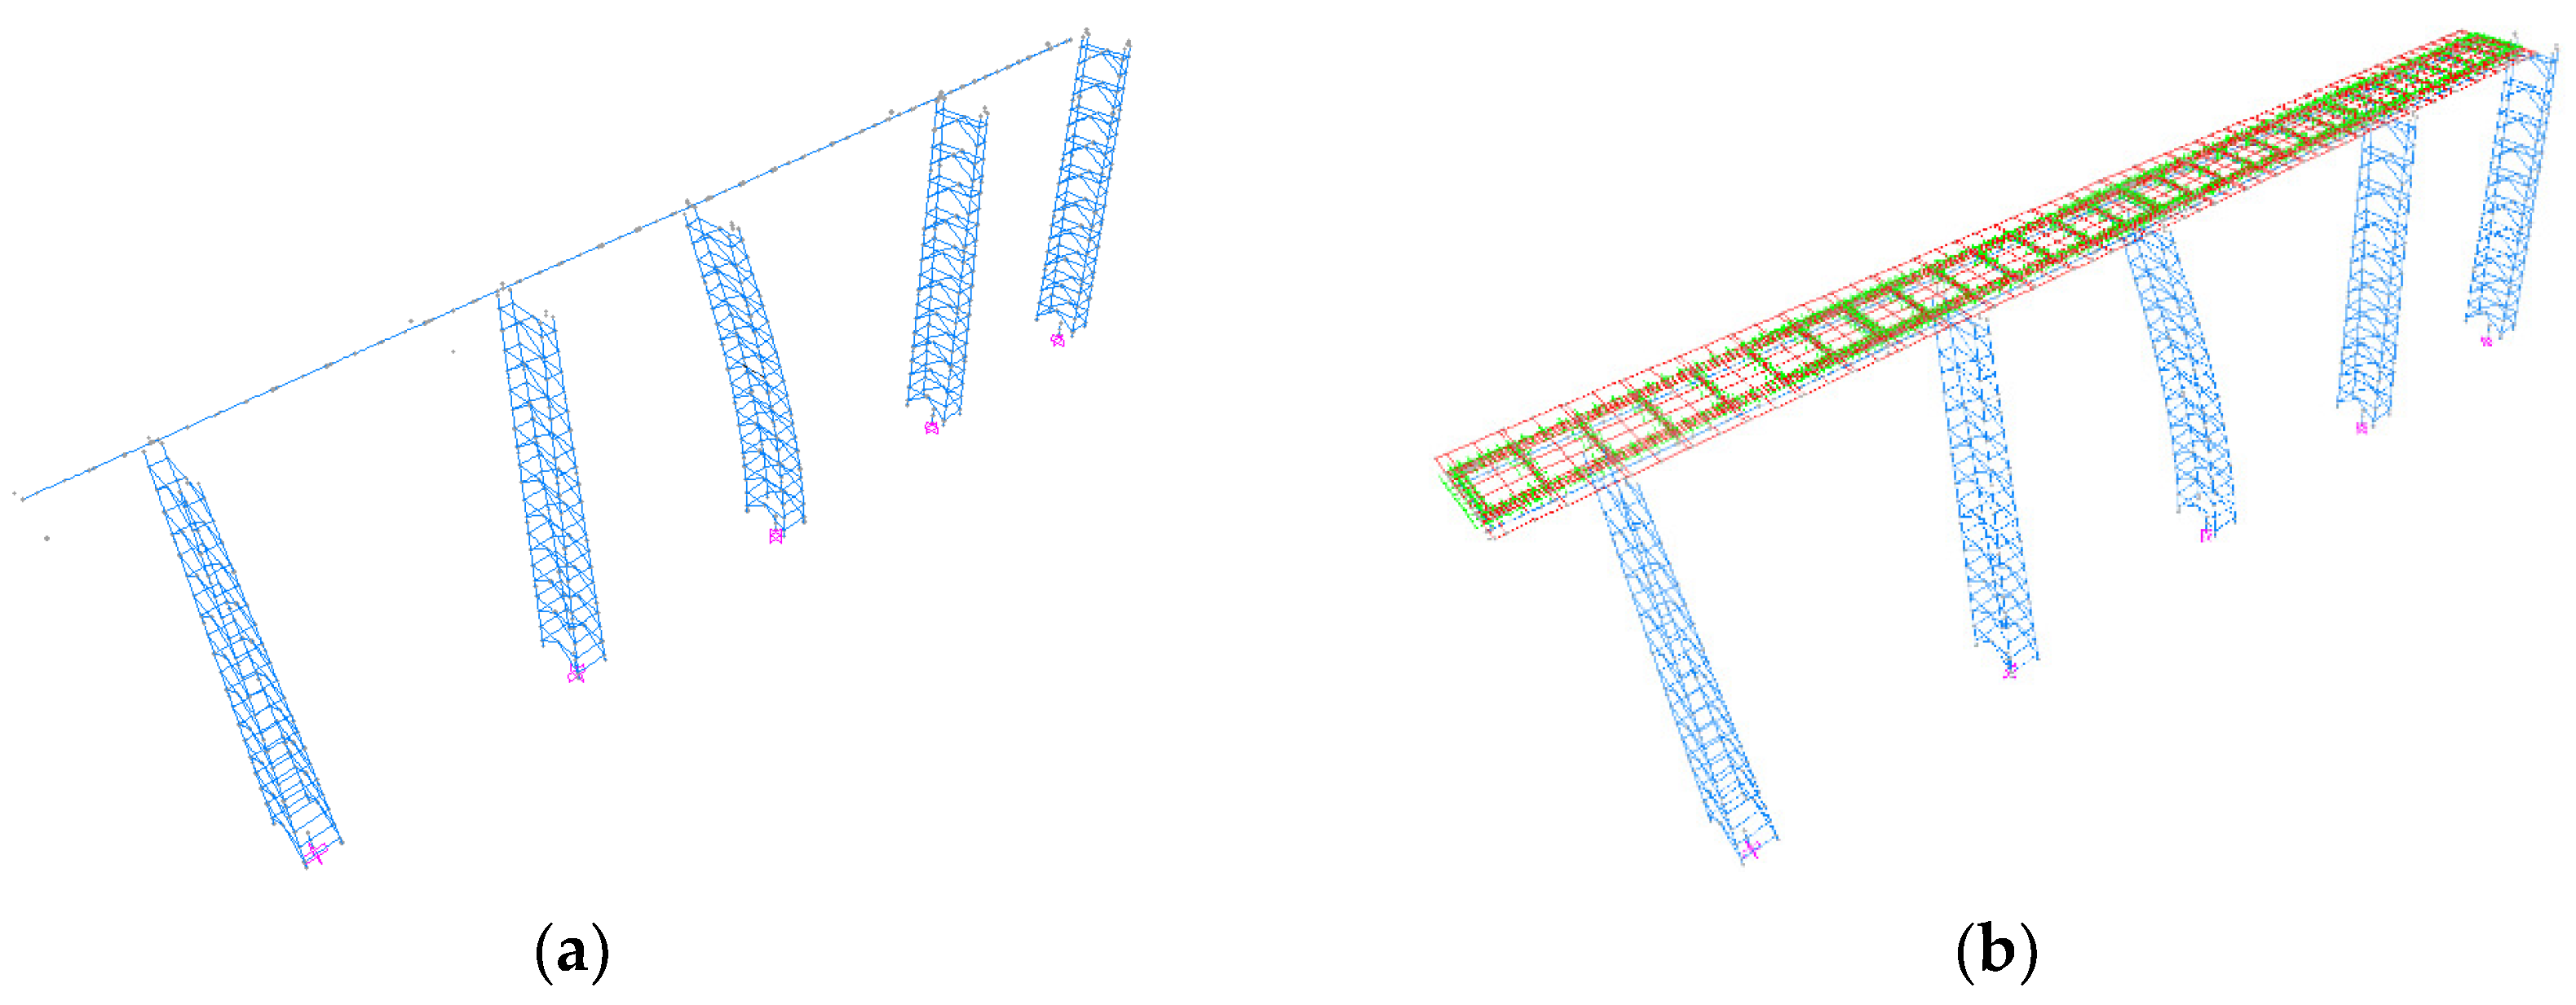
To investigate the effect of the simulation method of this bridge on the seismic response, the refined model and simplified model were established based on the validated FEM of the CFST column (see Section 2). The differences between the FEM results of those models are compared by static and dynamic analysis and seismic response analysis. The differences between the above two models are shown in Table 4, and FEM is shown in Figure 11.

3.1.1. Static Characterization Analysis

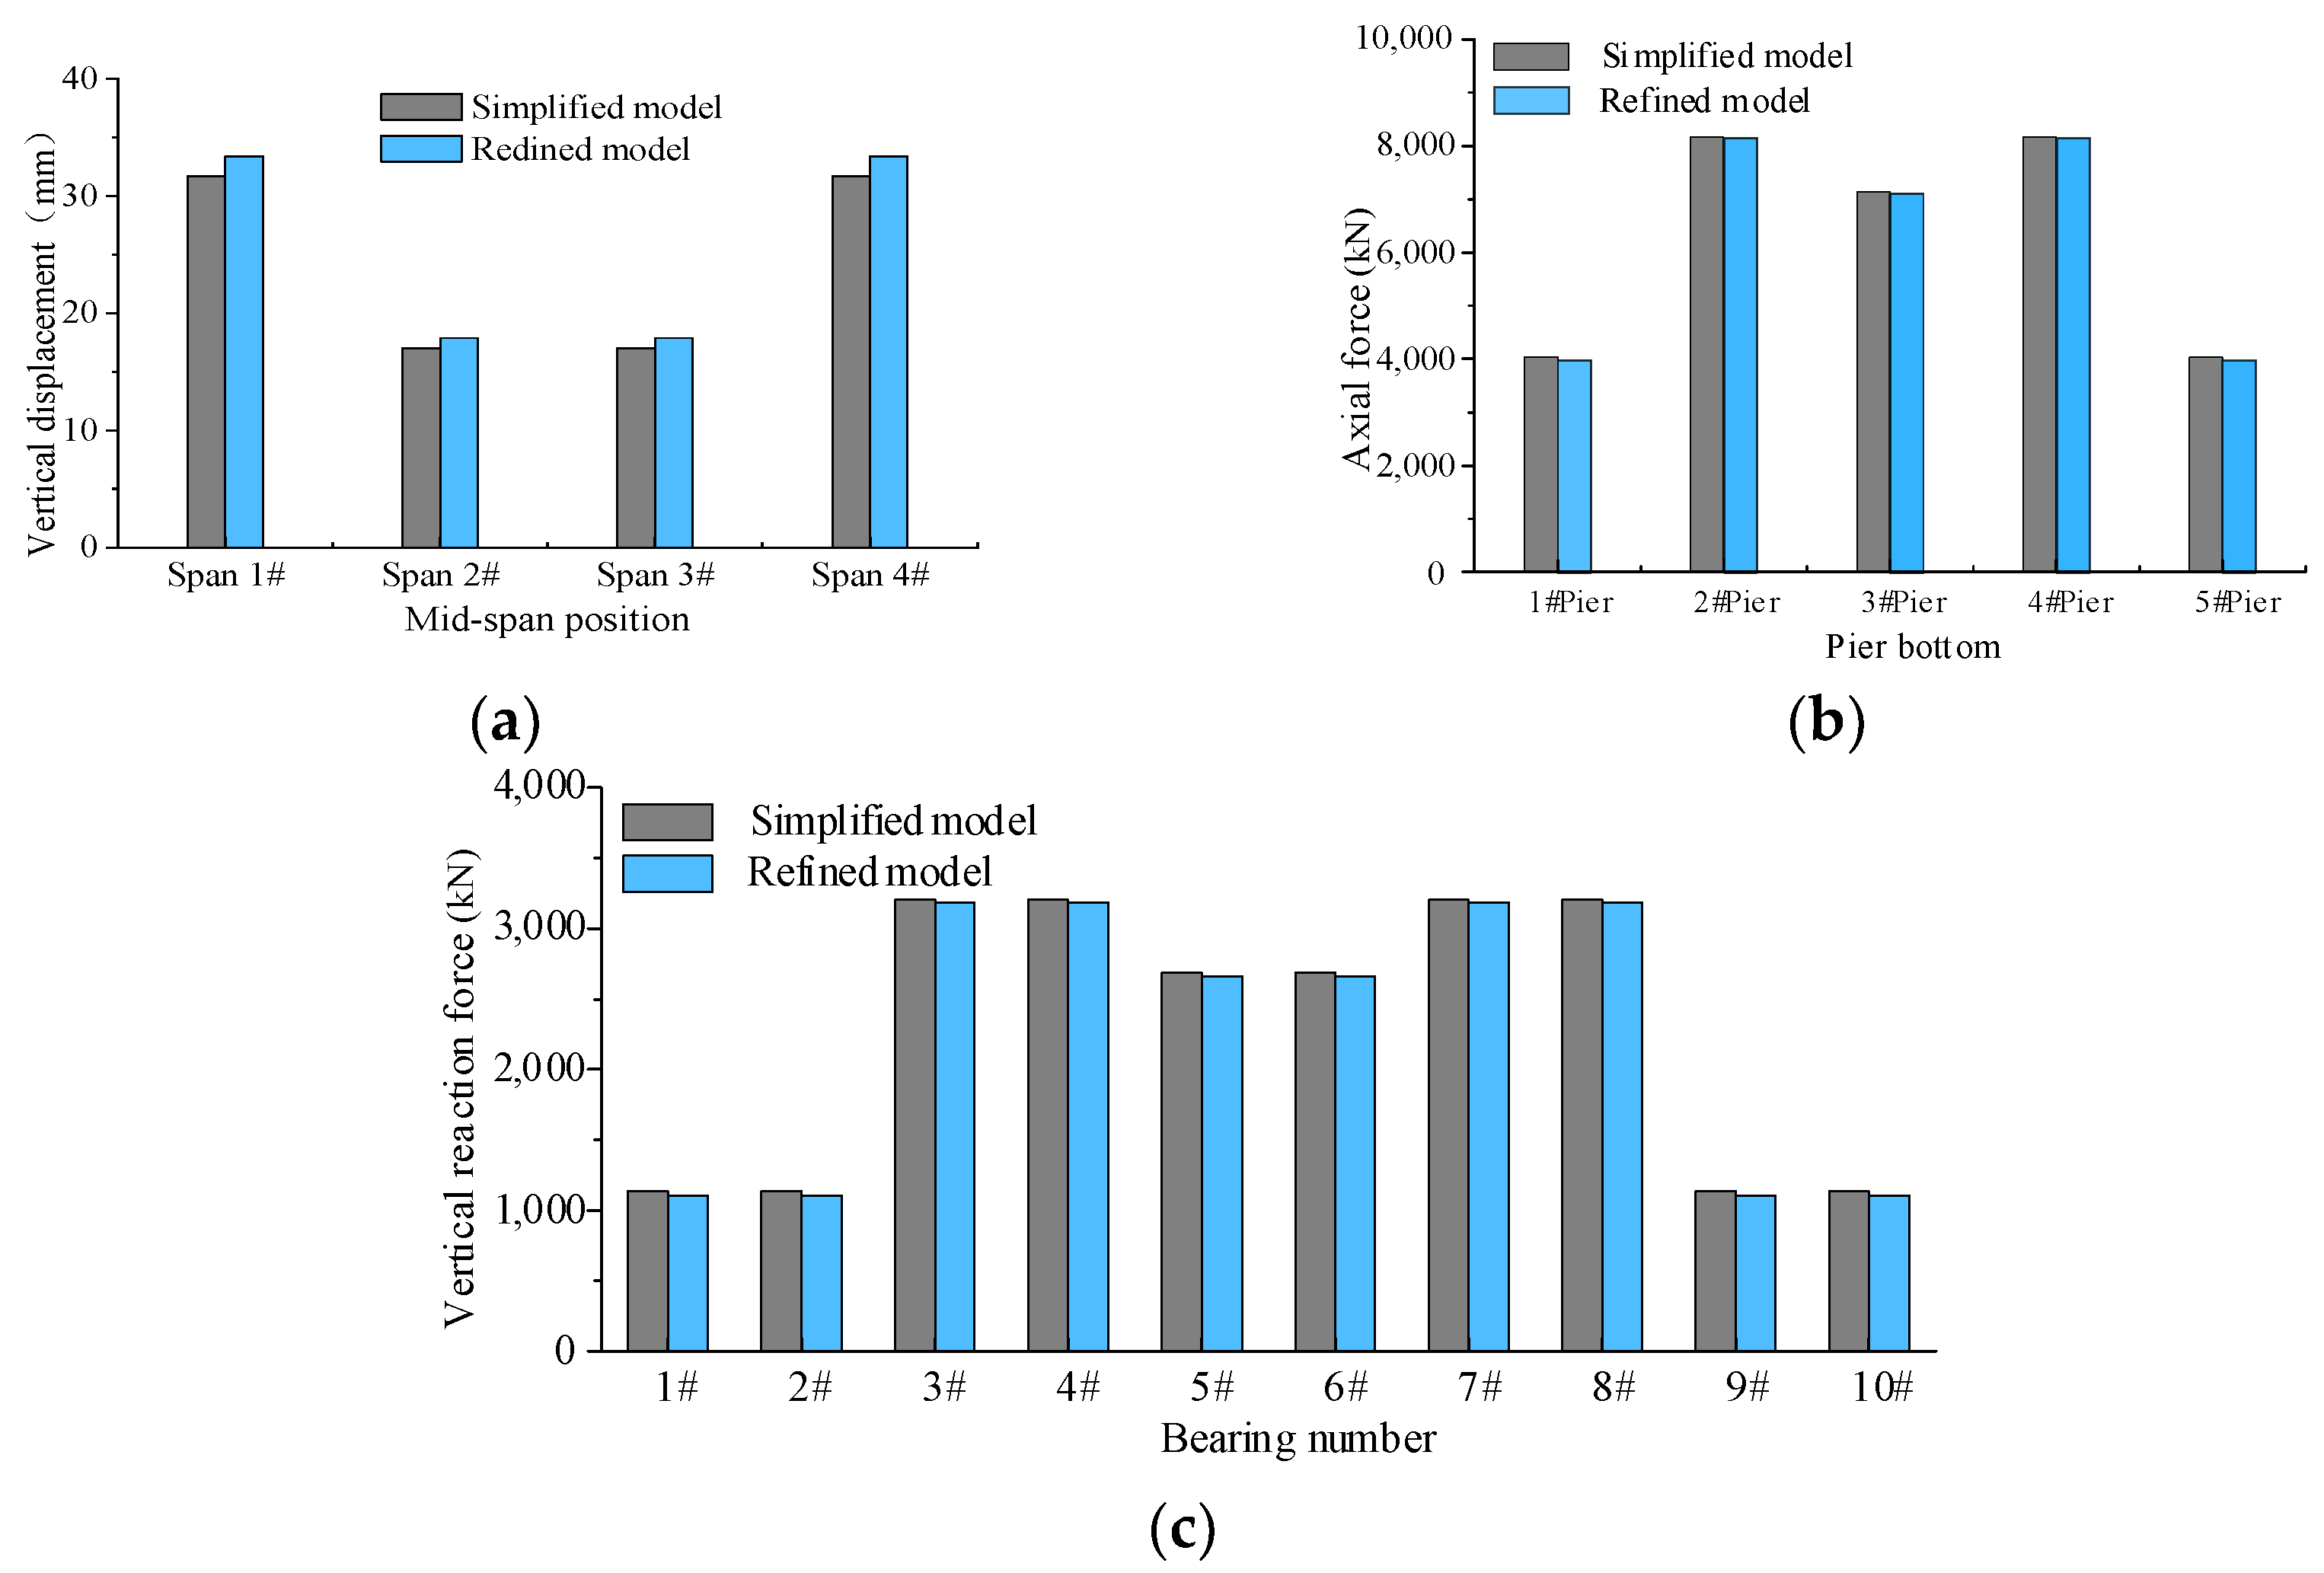
To compare the differences between the above two models for the bridge under self-weight and secondary dead load, static analysis was carried out; the comparison factors were mid-span deflection, pier bottom axial force, and support reaction force, and the analysis results are shown in Figure 12. From Figure 12, it can be seen that the changing pattern of deflection, pier bottom axial force, and vertical reaction force of bearing in each span of the two models are consistent, and the difference in the results is very limited. For the vertical displacement of each span, the error of span 1# and span 4# is the largest, at 5.1%; for the axial force at the bottom of each pier, the error of pier 1# and pier 5# is the largest, at 1.36%. Similarly, the error of bearing reaction force in 1#, 2#, 9#, and 10# is the largest, at 2.44%.

3.1.2. Dynamic Characterization Analysis

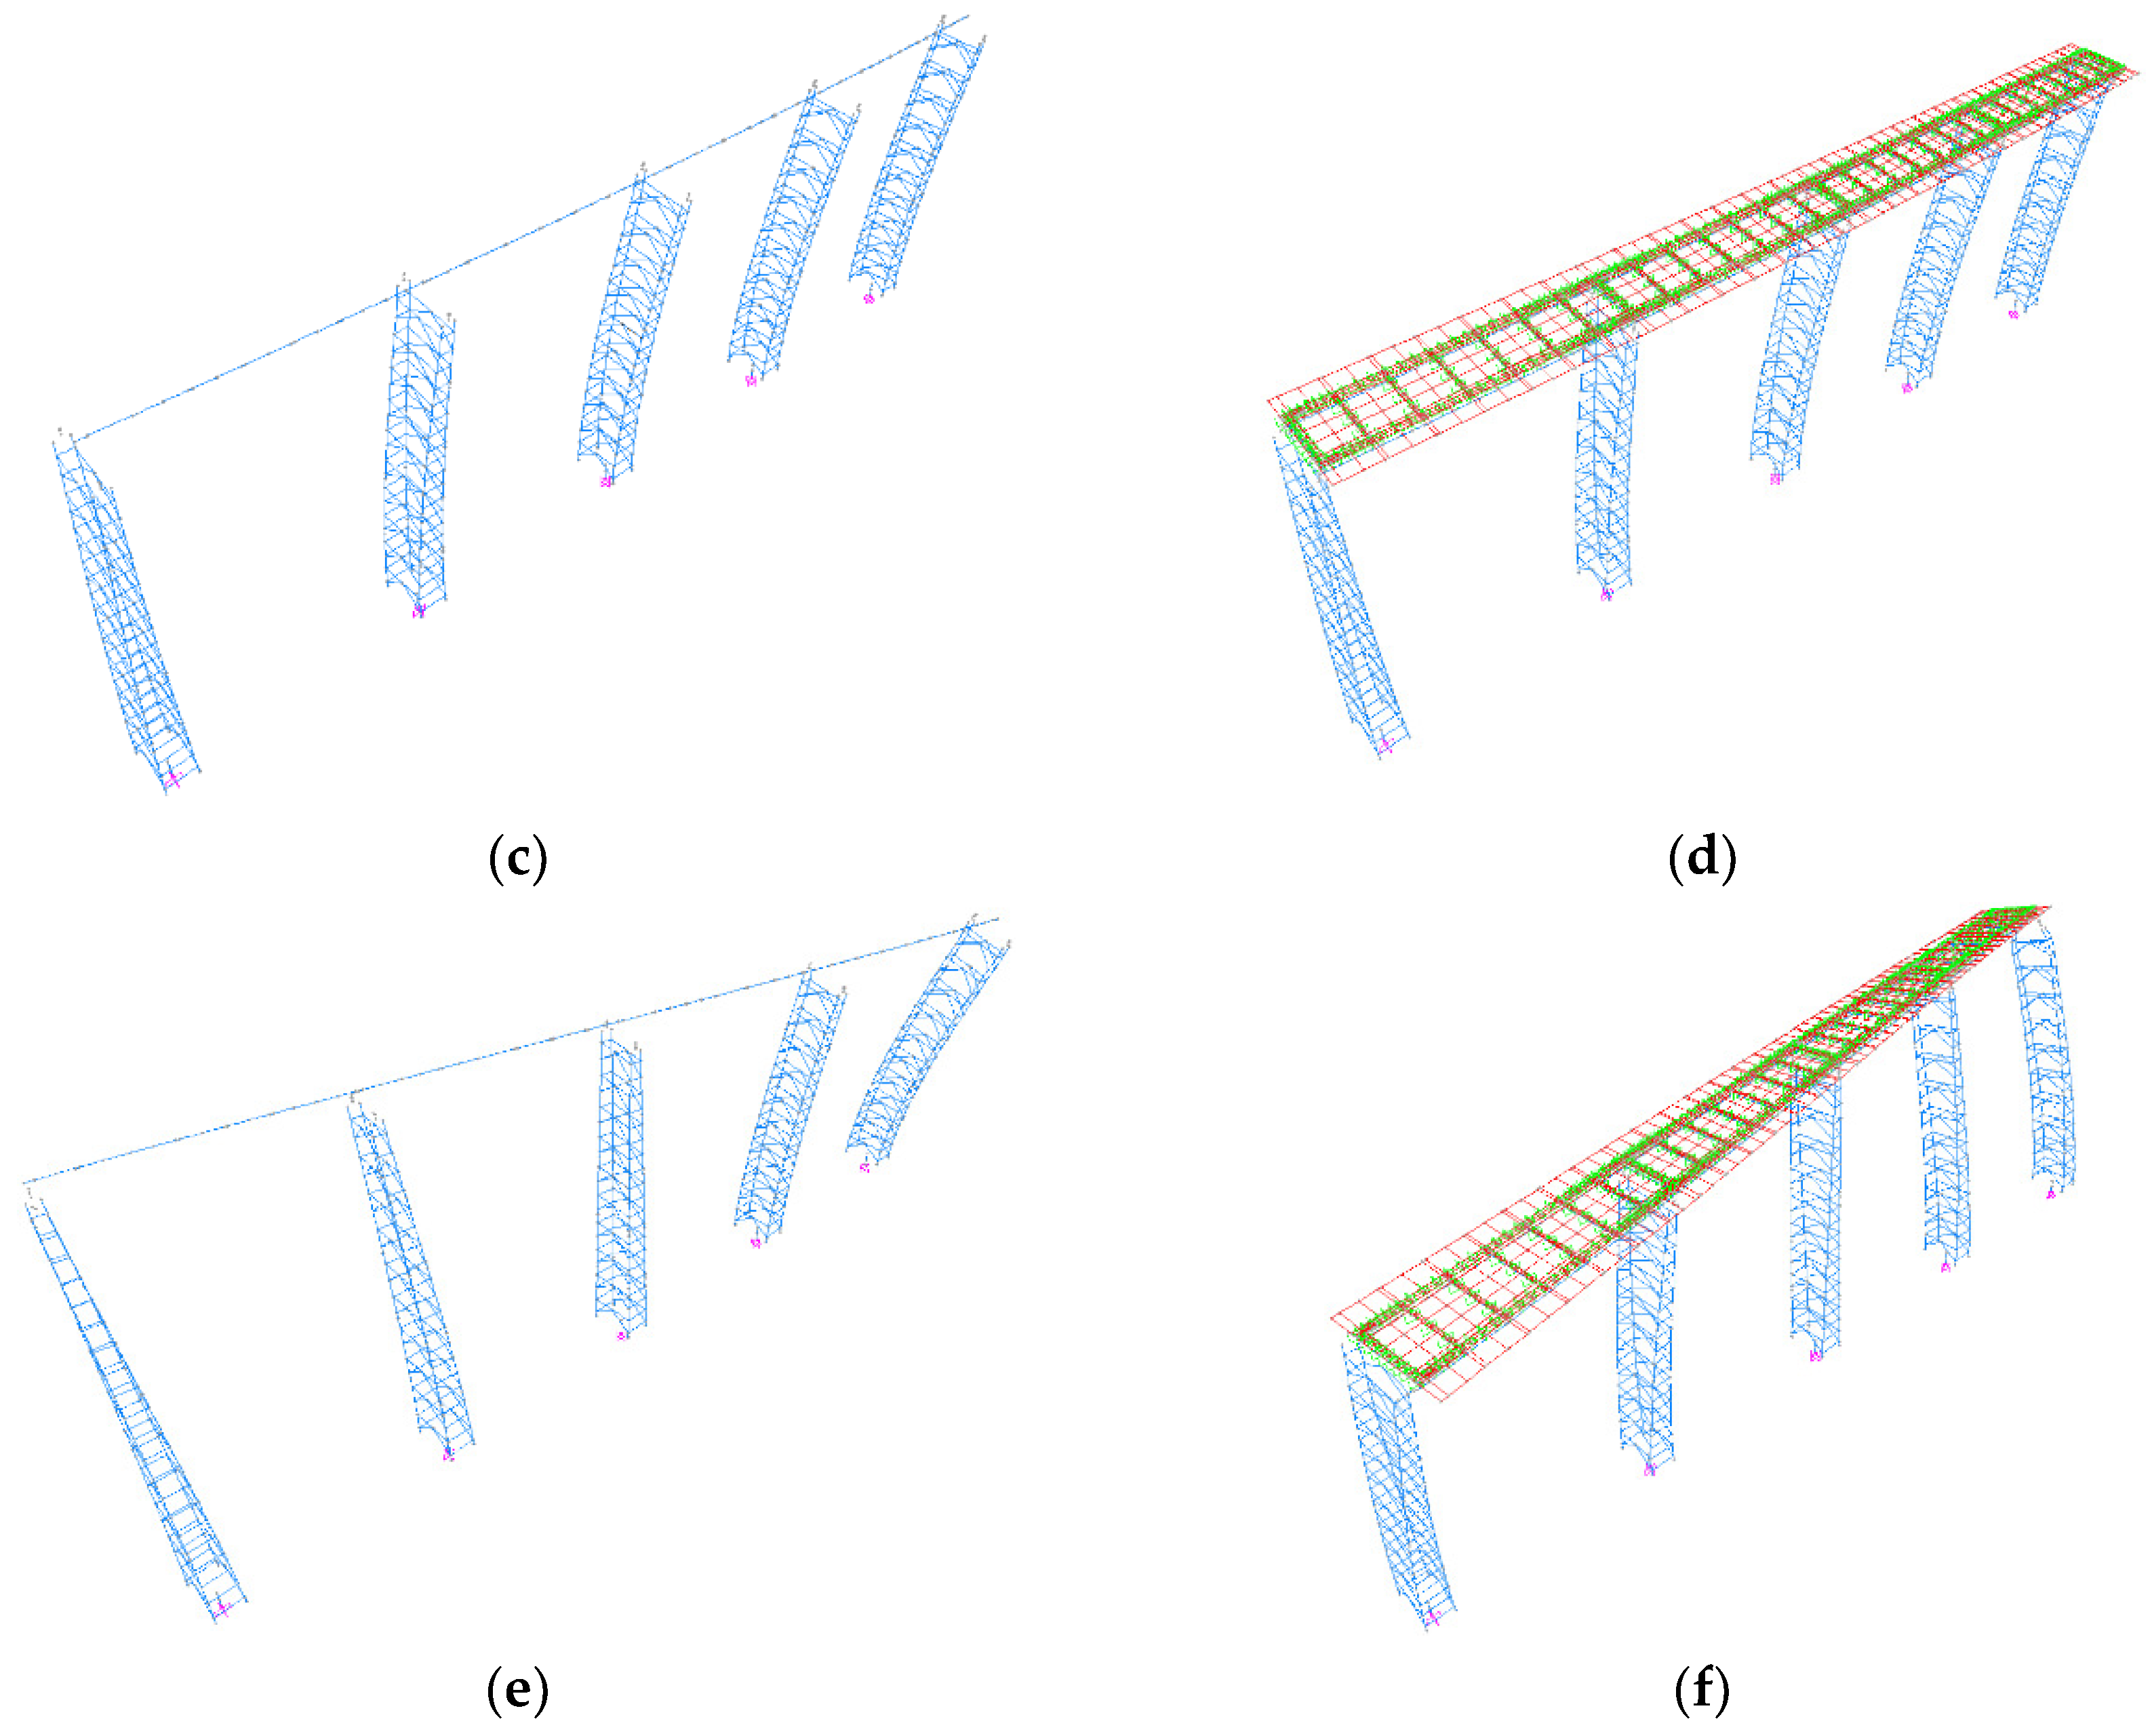
To compare the differences in the dynamic characteristics of the simplified model and the refined model, the two models were also analyzed based on SAP2000, and the natural periods, mass participation factors, and shapes of the first 10 orders of vibration are listed, which are shown in Table 5 and Table 6. Meanwhile, the first three modes of the simplified and refined model are listed in Figure 8. From Table 5 and Table 6 and Figure 13, the differences in structural natural periods between the two models are small, but the mode shapes are slightly different, because the refined model can take into account the actual distribution of the superstructure stiffness and mass; for example, in the third order vibration shape, the refined model can show the torsional vibration pattern of the superstructure, while the rod system model cannot.

3.1.3. Time History Analysis

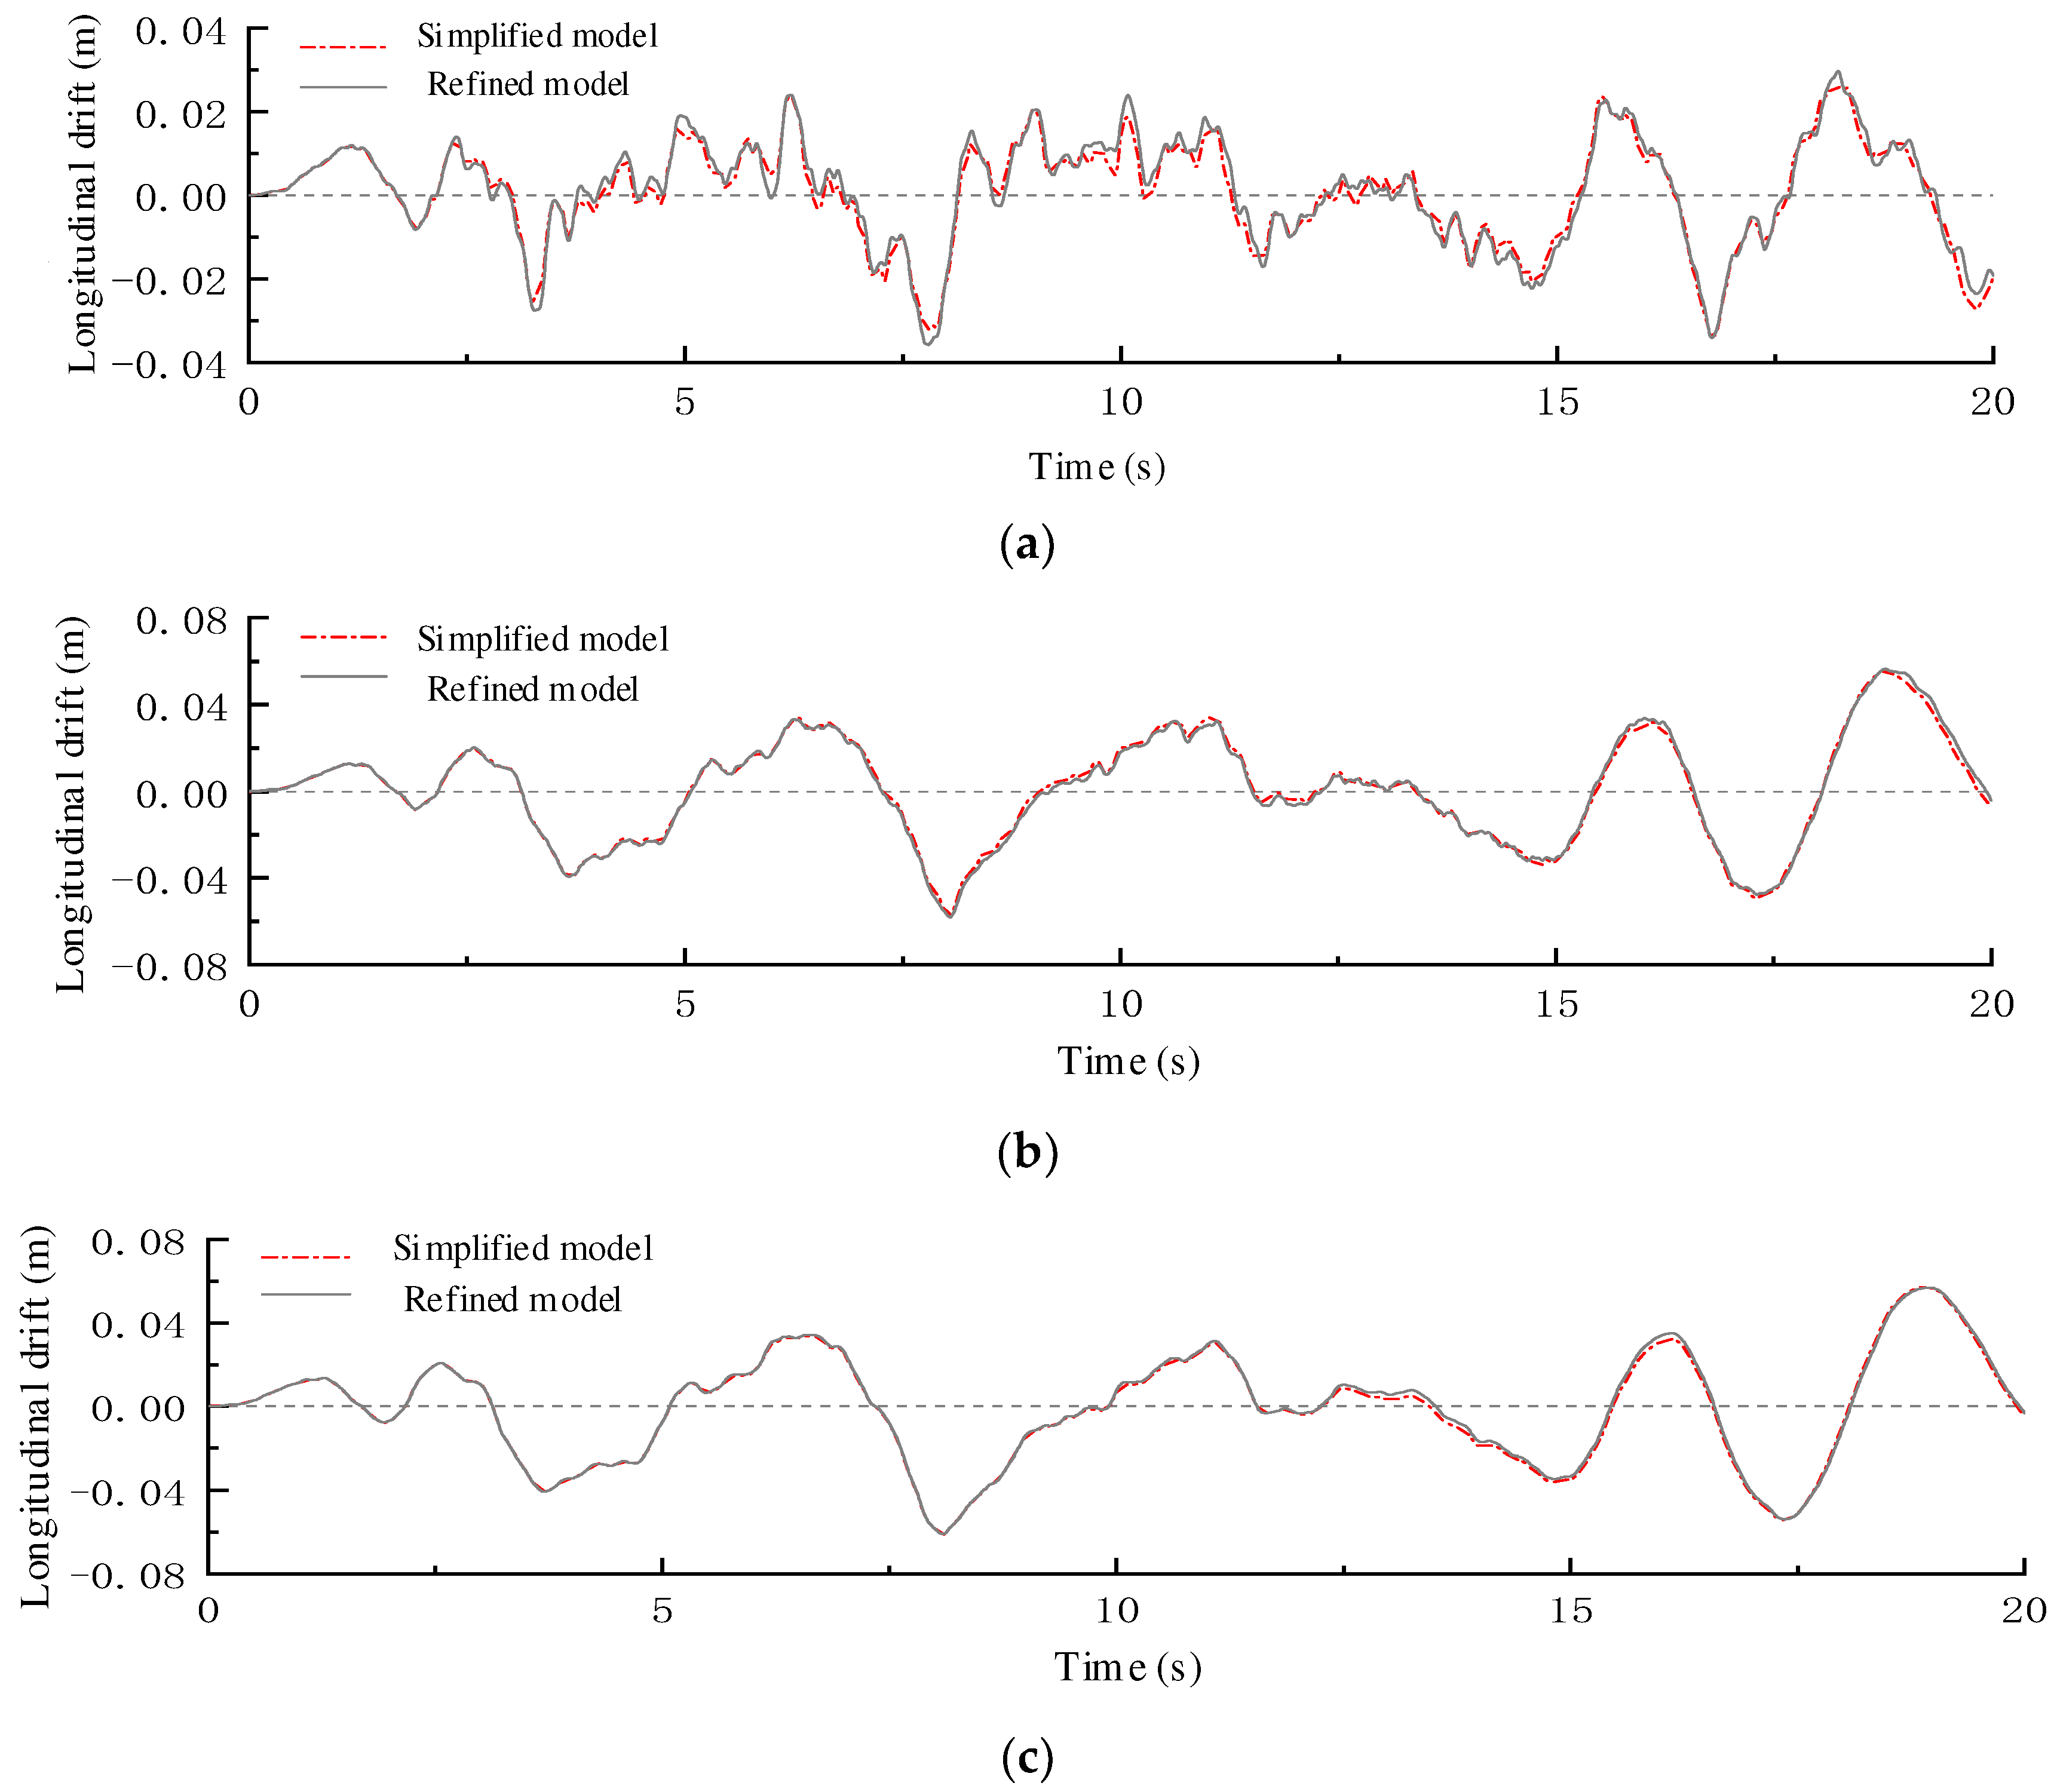
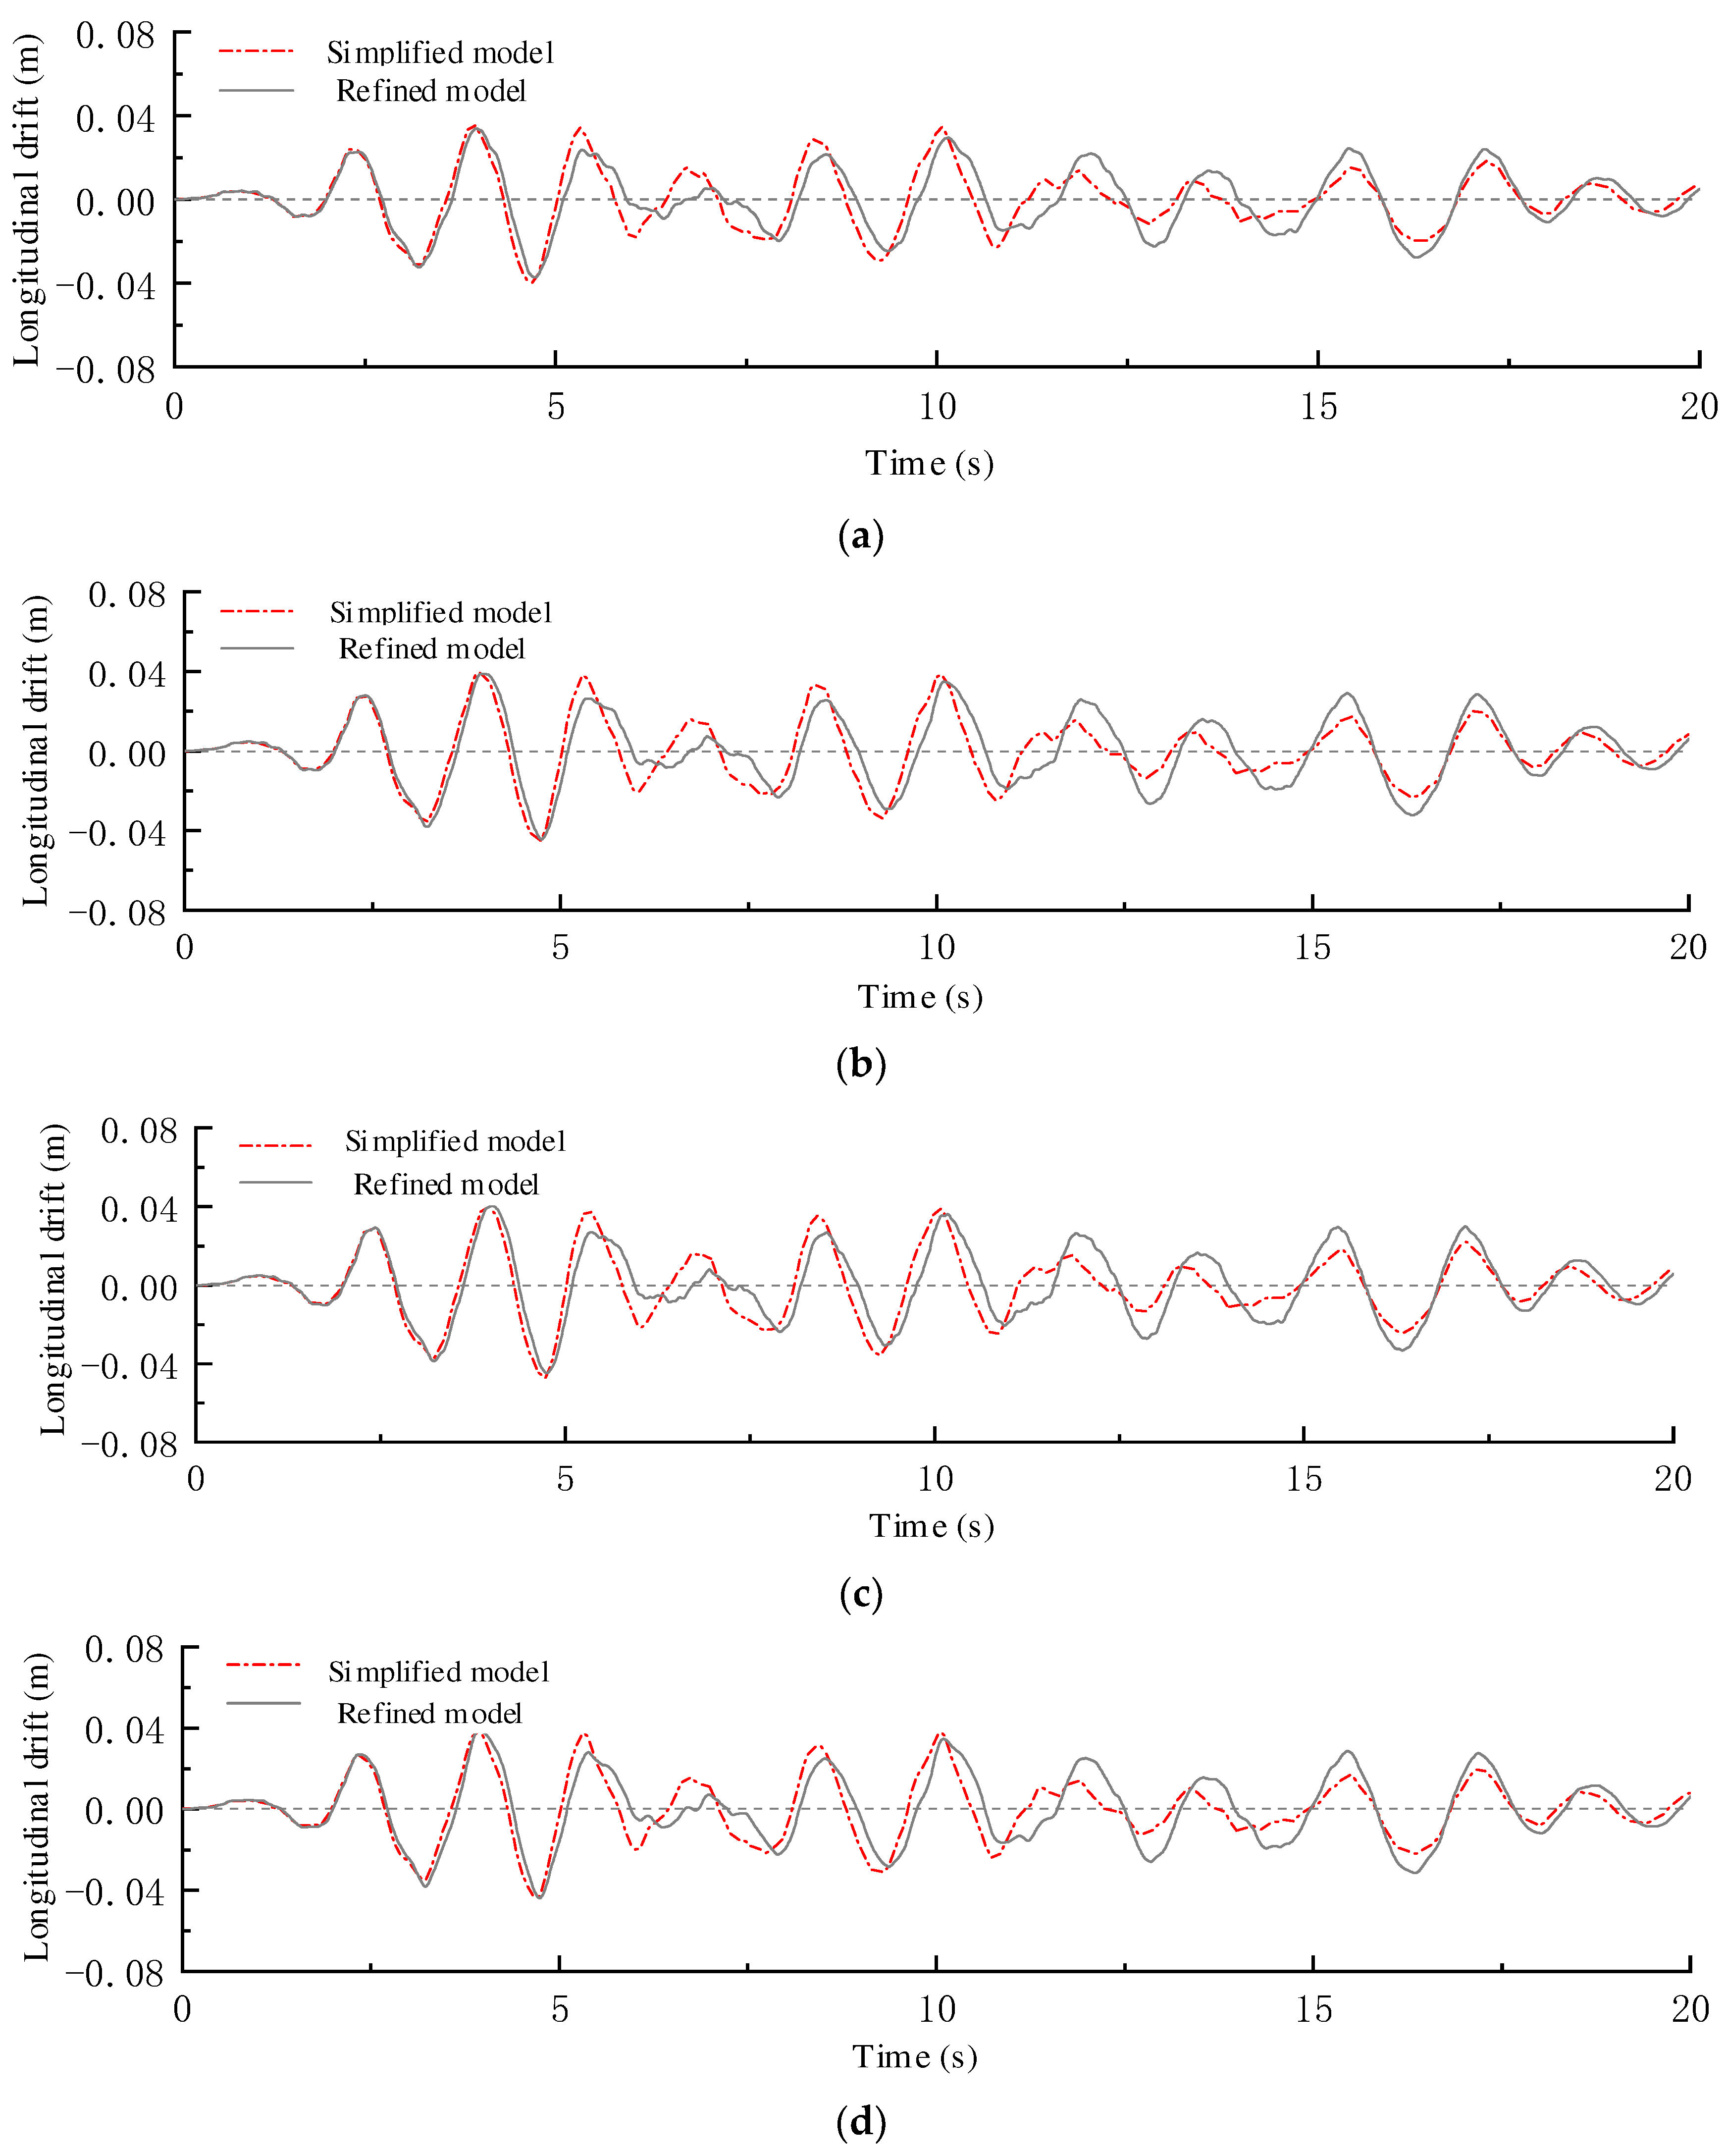
According to the combination of seven horizontal and seven vertical artificial waves generated in Section 3.1.2, nonlinear dynamic time history analysis was performed on the simplified and refined models, with the input directions in the longitudinal + vertical and lateral + vertical directions, respectively. Taking the top displacement of the pier and superstructure displacement as the seismic response parameters, half of the structure was chosen for analysis according to the symmetry of the bridge, and the displacement response of the bridge under seismic action is obtained, as shown in Figure 14 and Figure 15. It is clear that the two models are basically the same for the seismic response in the lateral and longitudinal directions, including the seismic response time curve and the response peak.
Based on the above discussion, There is little difference between the simplified model and the refined model for the static and dynamic characterization and seismic response, while the refined model for the seismic response analysis is significantly less efficient than the simplified model due to its more complex model. Thus, the seismic response of the bridge with a laced pier will be analyzed by the simplified model in the subsequent study.

3.1.4. Seismic Responses

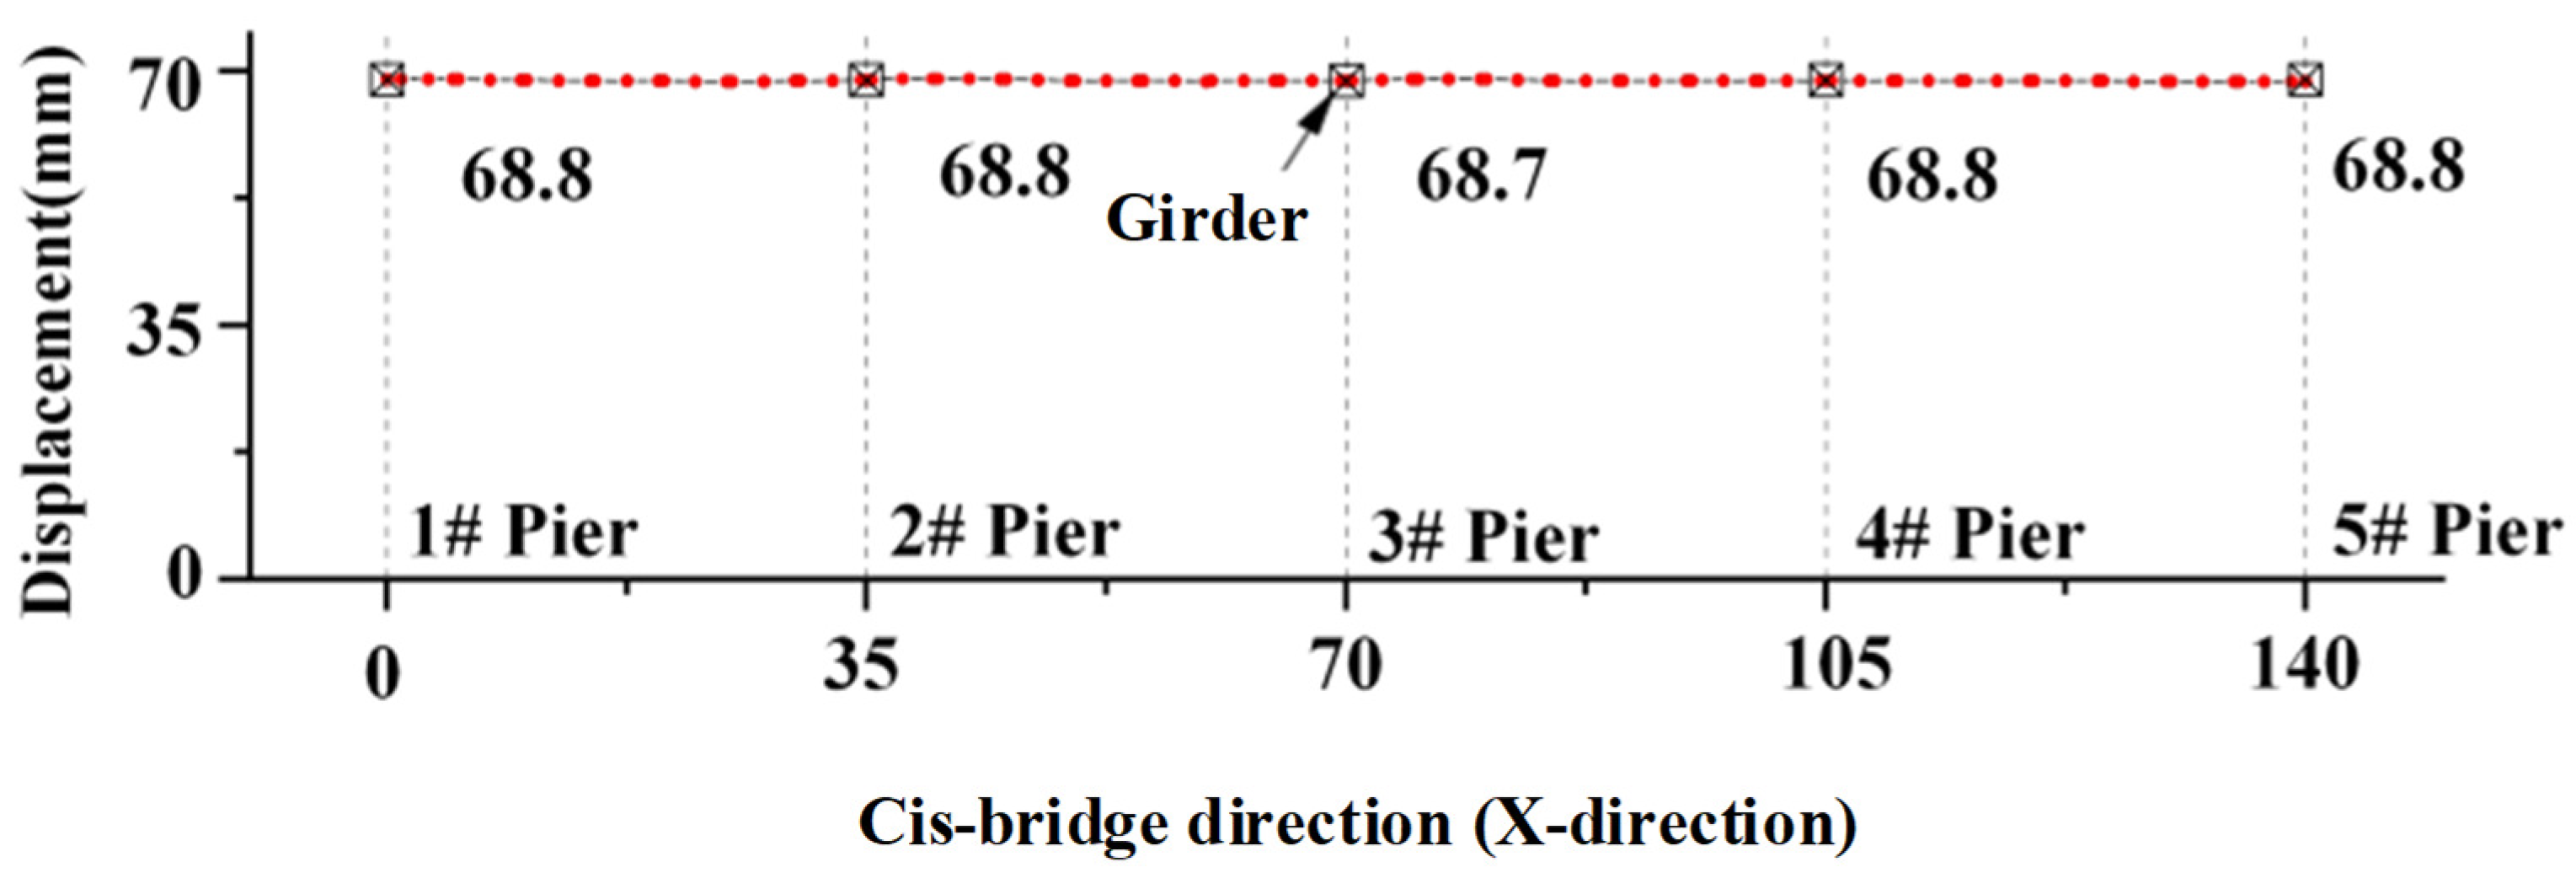
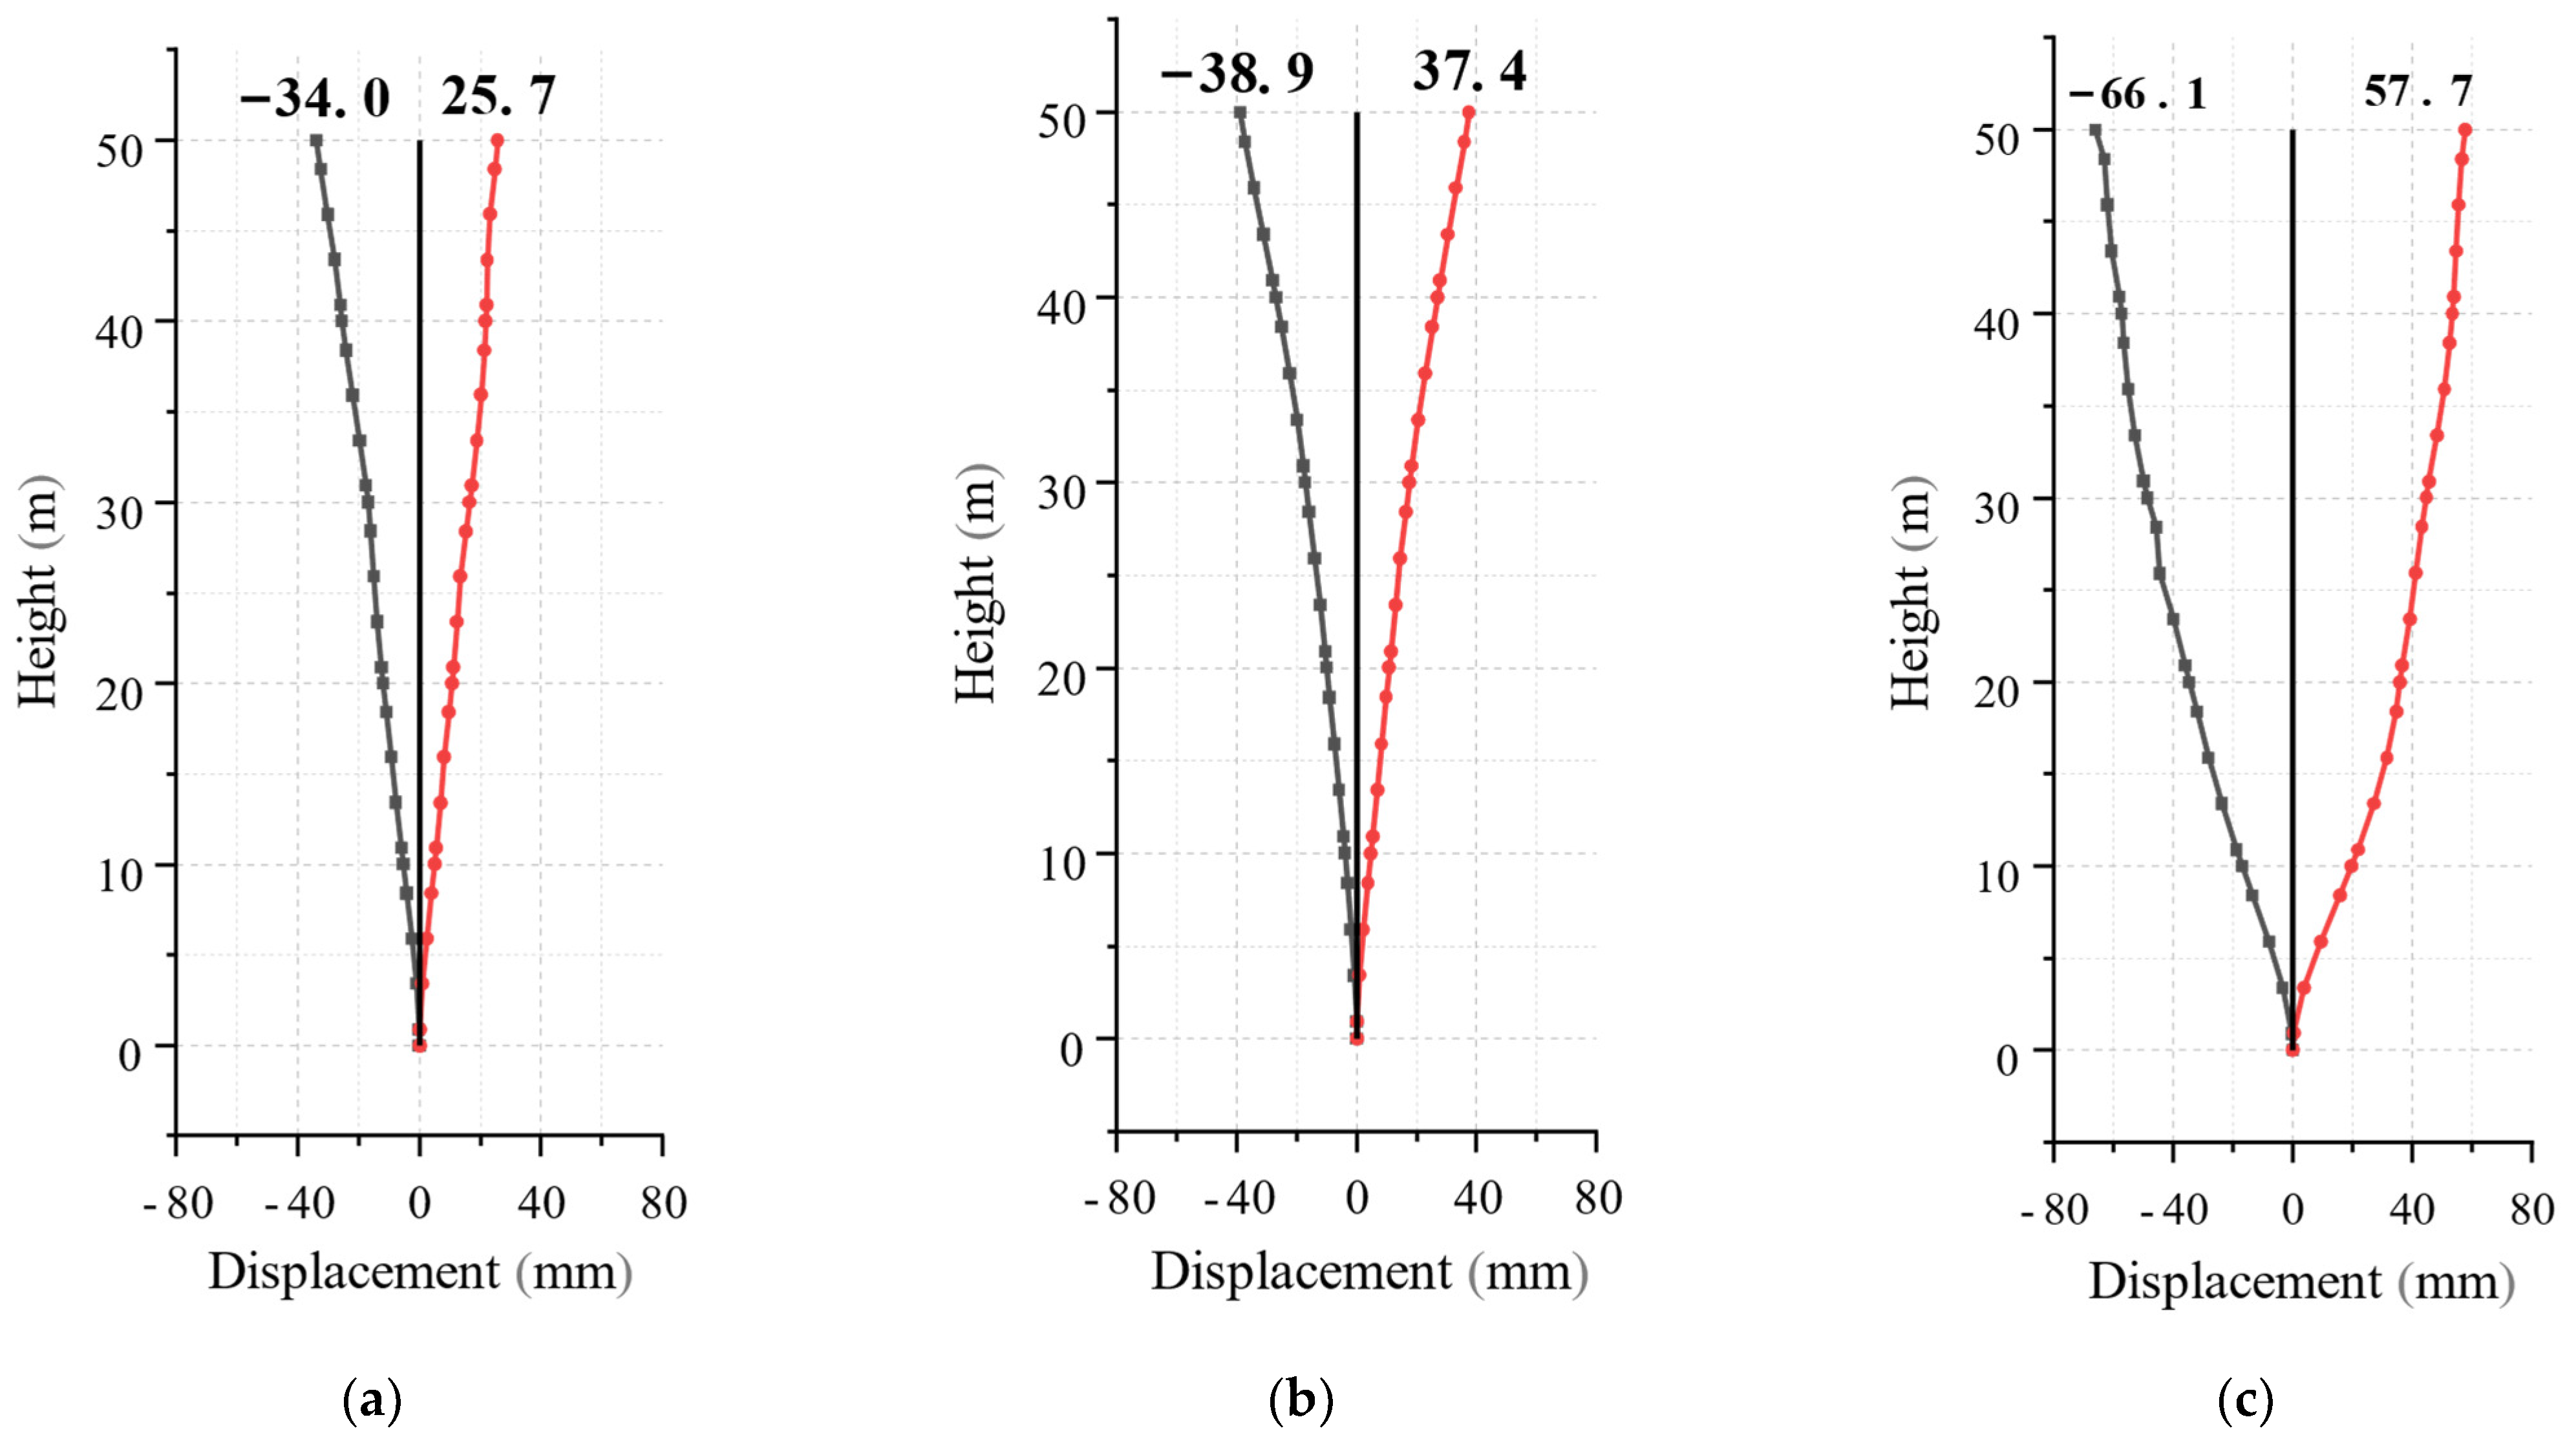
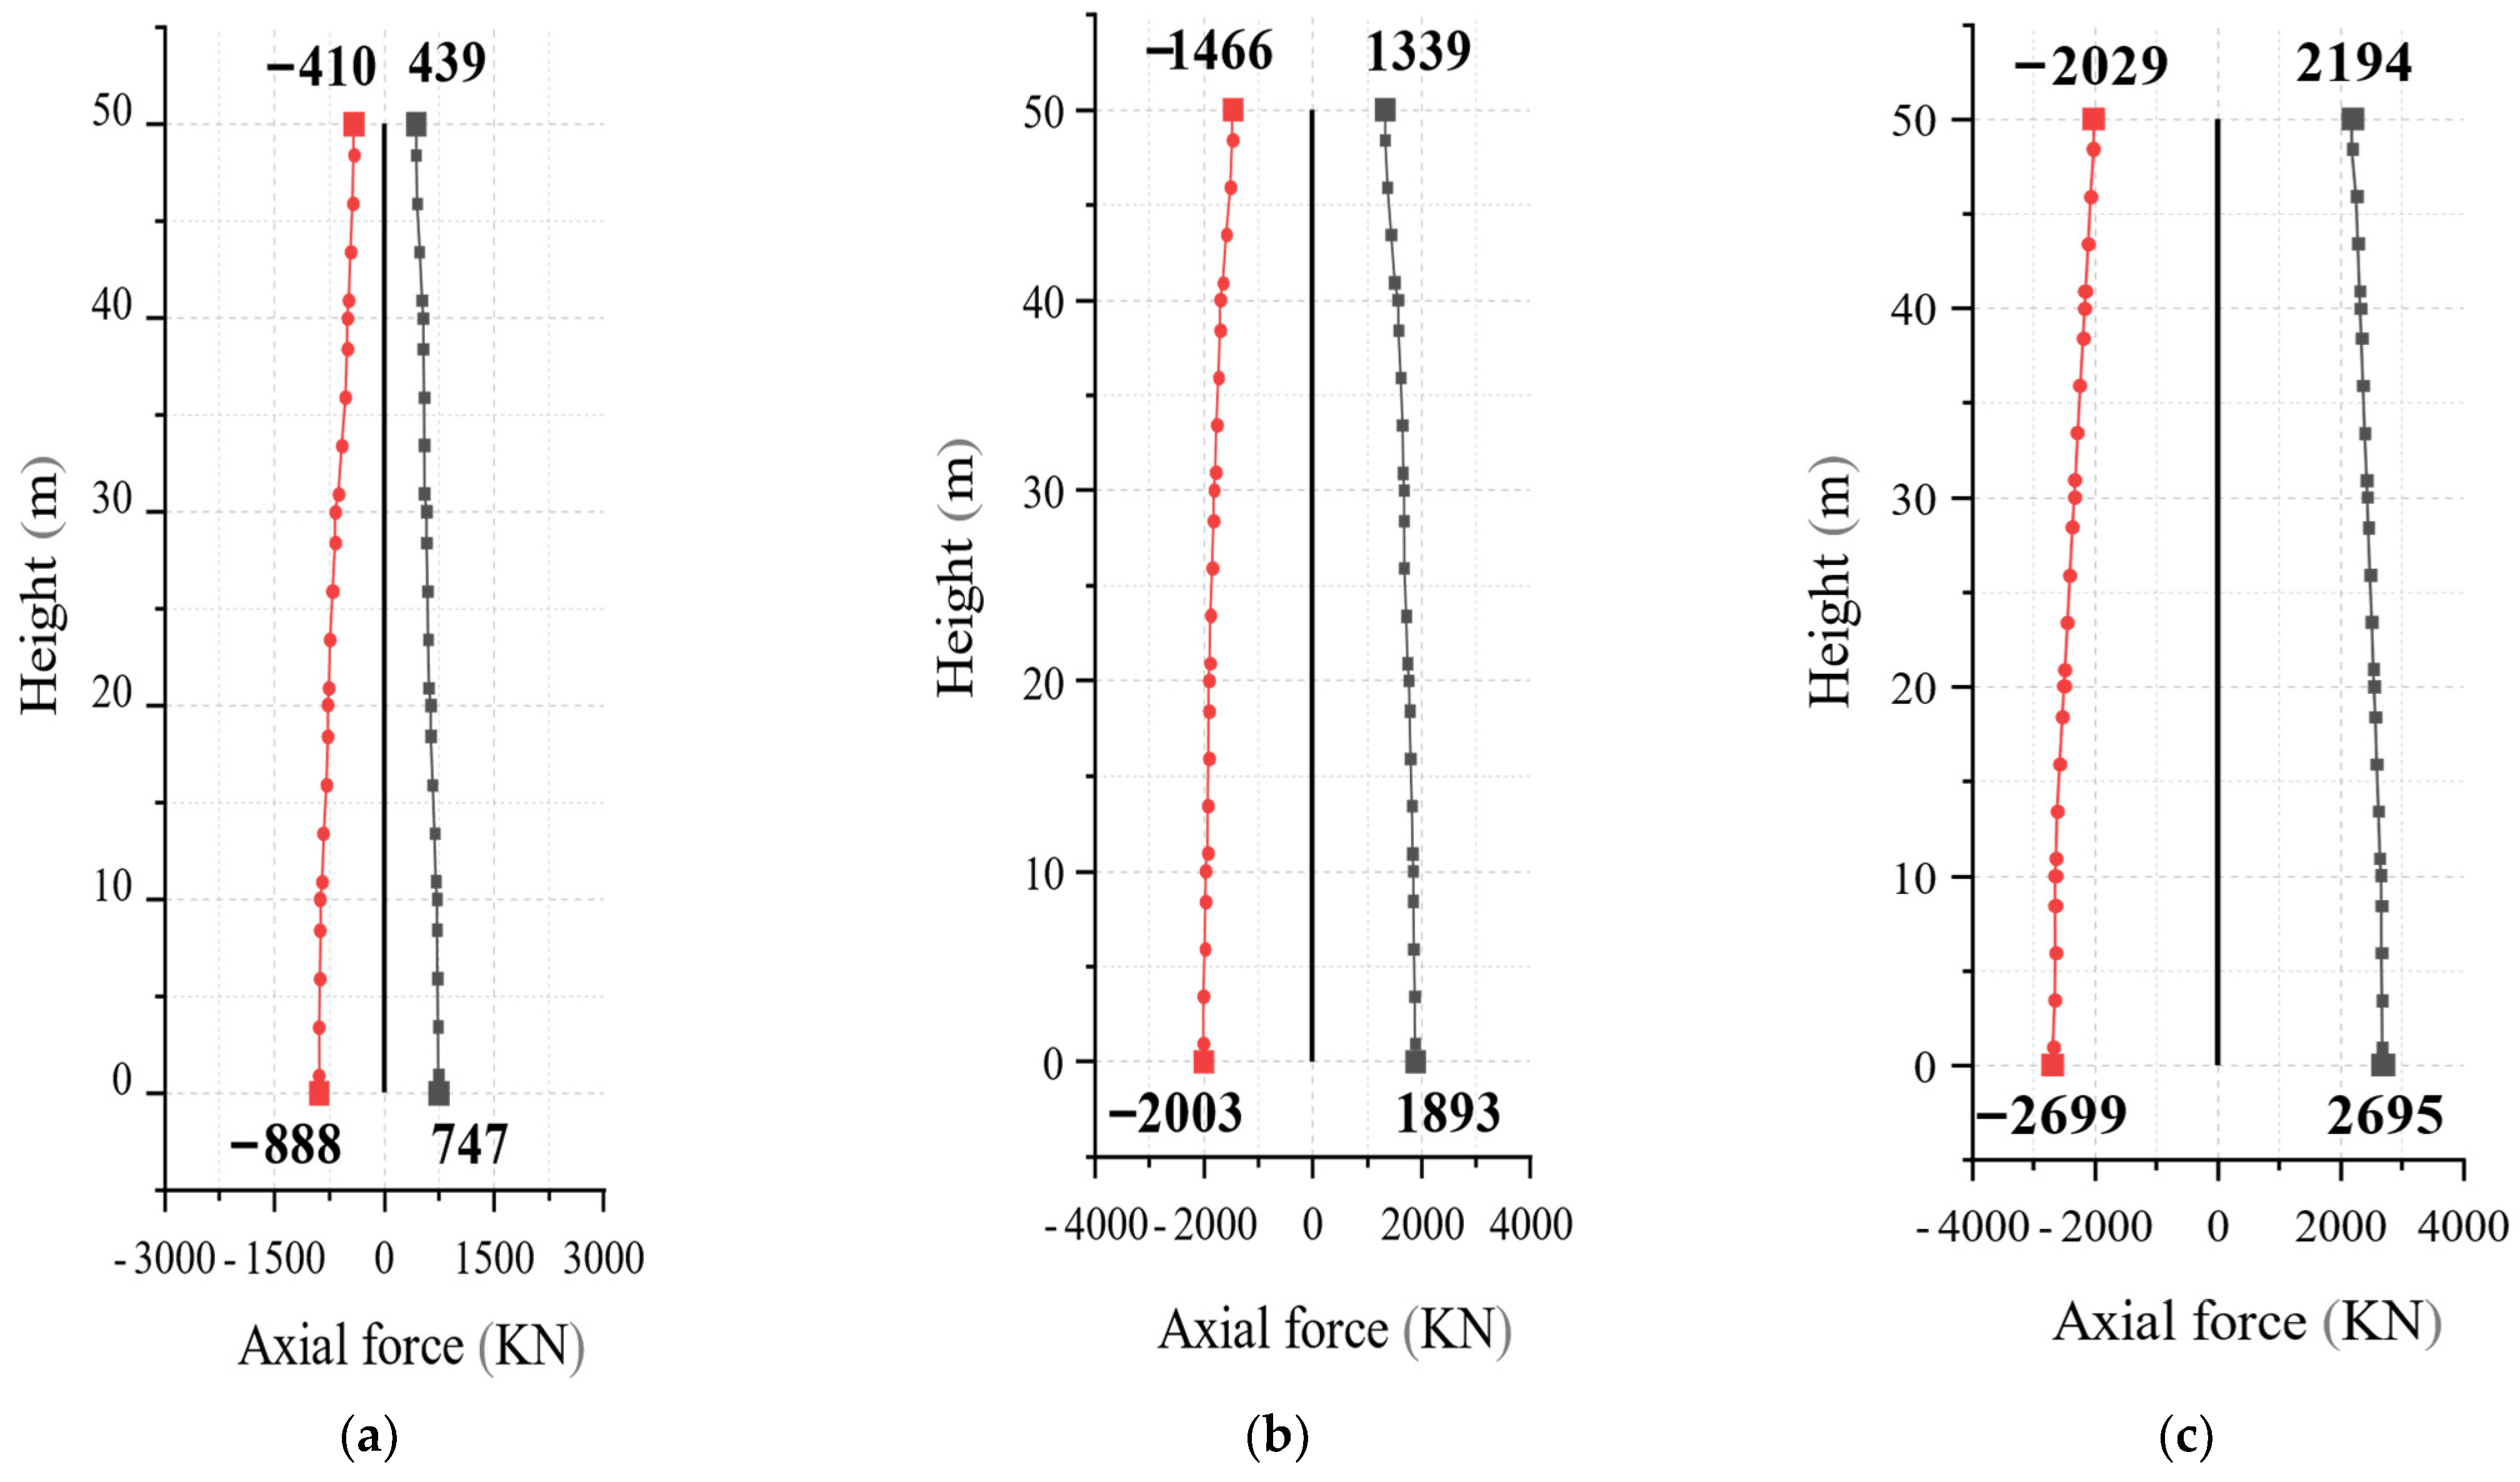
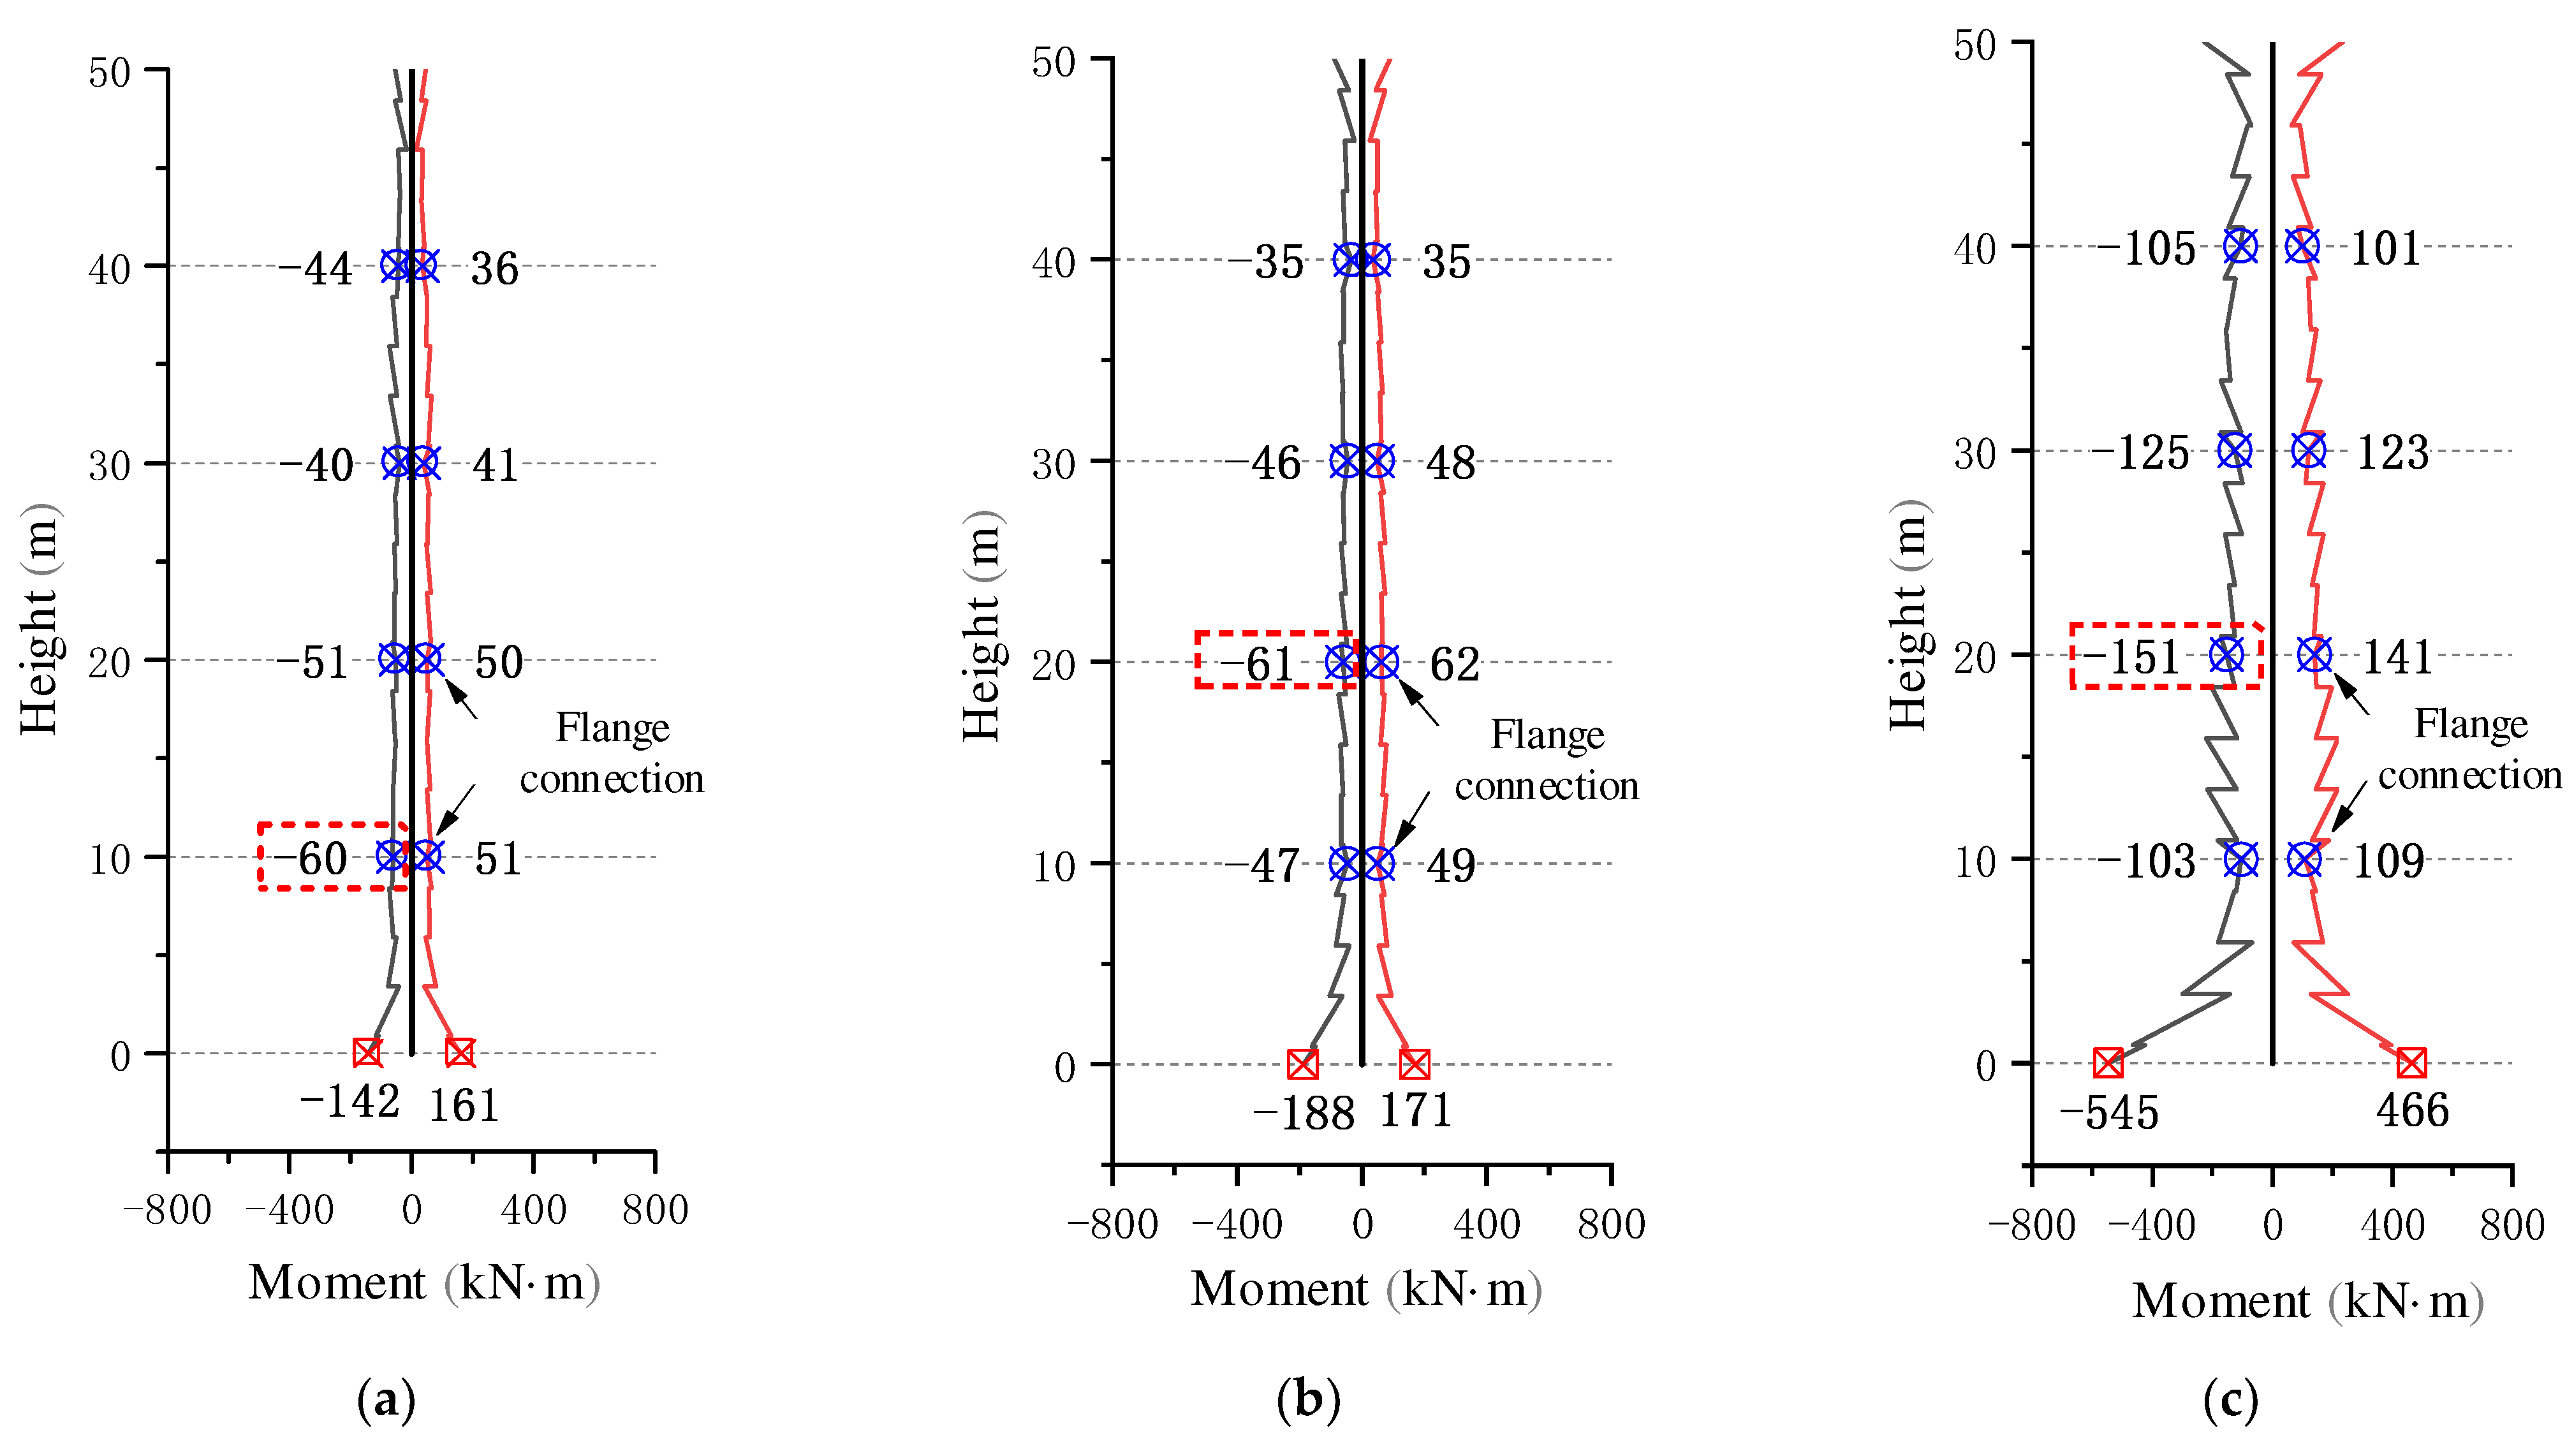
In this section, the S-model and the seismic waves selected in Section 2.3.5 are used to calculate the seismic responses of the bridge. The metrics that reflect the seismic responses include structural displacements (displacement of the girder and columns), axial forces, and bending moments (steel pipe concrete column limbs at the pier bottom and flange connections). According to the symmetry, analysis of half of the bridge is permitted, which is listed in Figure 16, Figure 17, Figure 18 and Figure 19.
Figure 16 and Figure 17 show that the longitudinal displacement of each node of the girder is basically the same under the ground motion, and the horizontal displacement of each point of the bridge pier develops with the increase in pier height.
From Figure 18 and Figure 19, the displacement and force of the 3#pier are significantly larger than the movable pier; the maximum axial force and bending moment occur at the bottom of the pier, the maximum axial force and bending moment of the flange connection also occurs near the bottom of the pier, and the two flange connections near the bottom of the pier may be subjected to large loads.

3.2. Sensitivity Analysis of Key Design Parameters for Seismic Resistance of Laced Columns

To further explore the seismic response law of laced piers, this section investigates the seismic performance of laced piers by considering the effects of parameters, for instance, pier height, axial compression ratio, steel ratio of CFST column, arrangement type of lacing tube, and longitudinal slope of column limbs, on their seismic performance. The seismic input direction is x and z direction, and the maximum displacement of the pier top, the maximum axial force of the pier bottom, the maximum bending moment of the pier bottom, the maximum bending moment at the flange connection of 3# pier’s maximum concrete stress of pier bottom, and maximum steel tube stress of pier bottom are discussed.

3.2.1. Pier Height

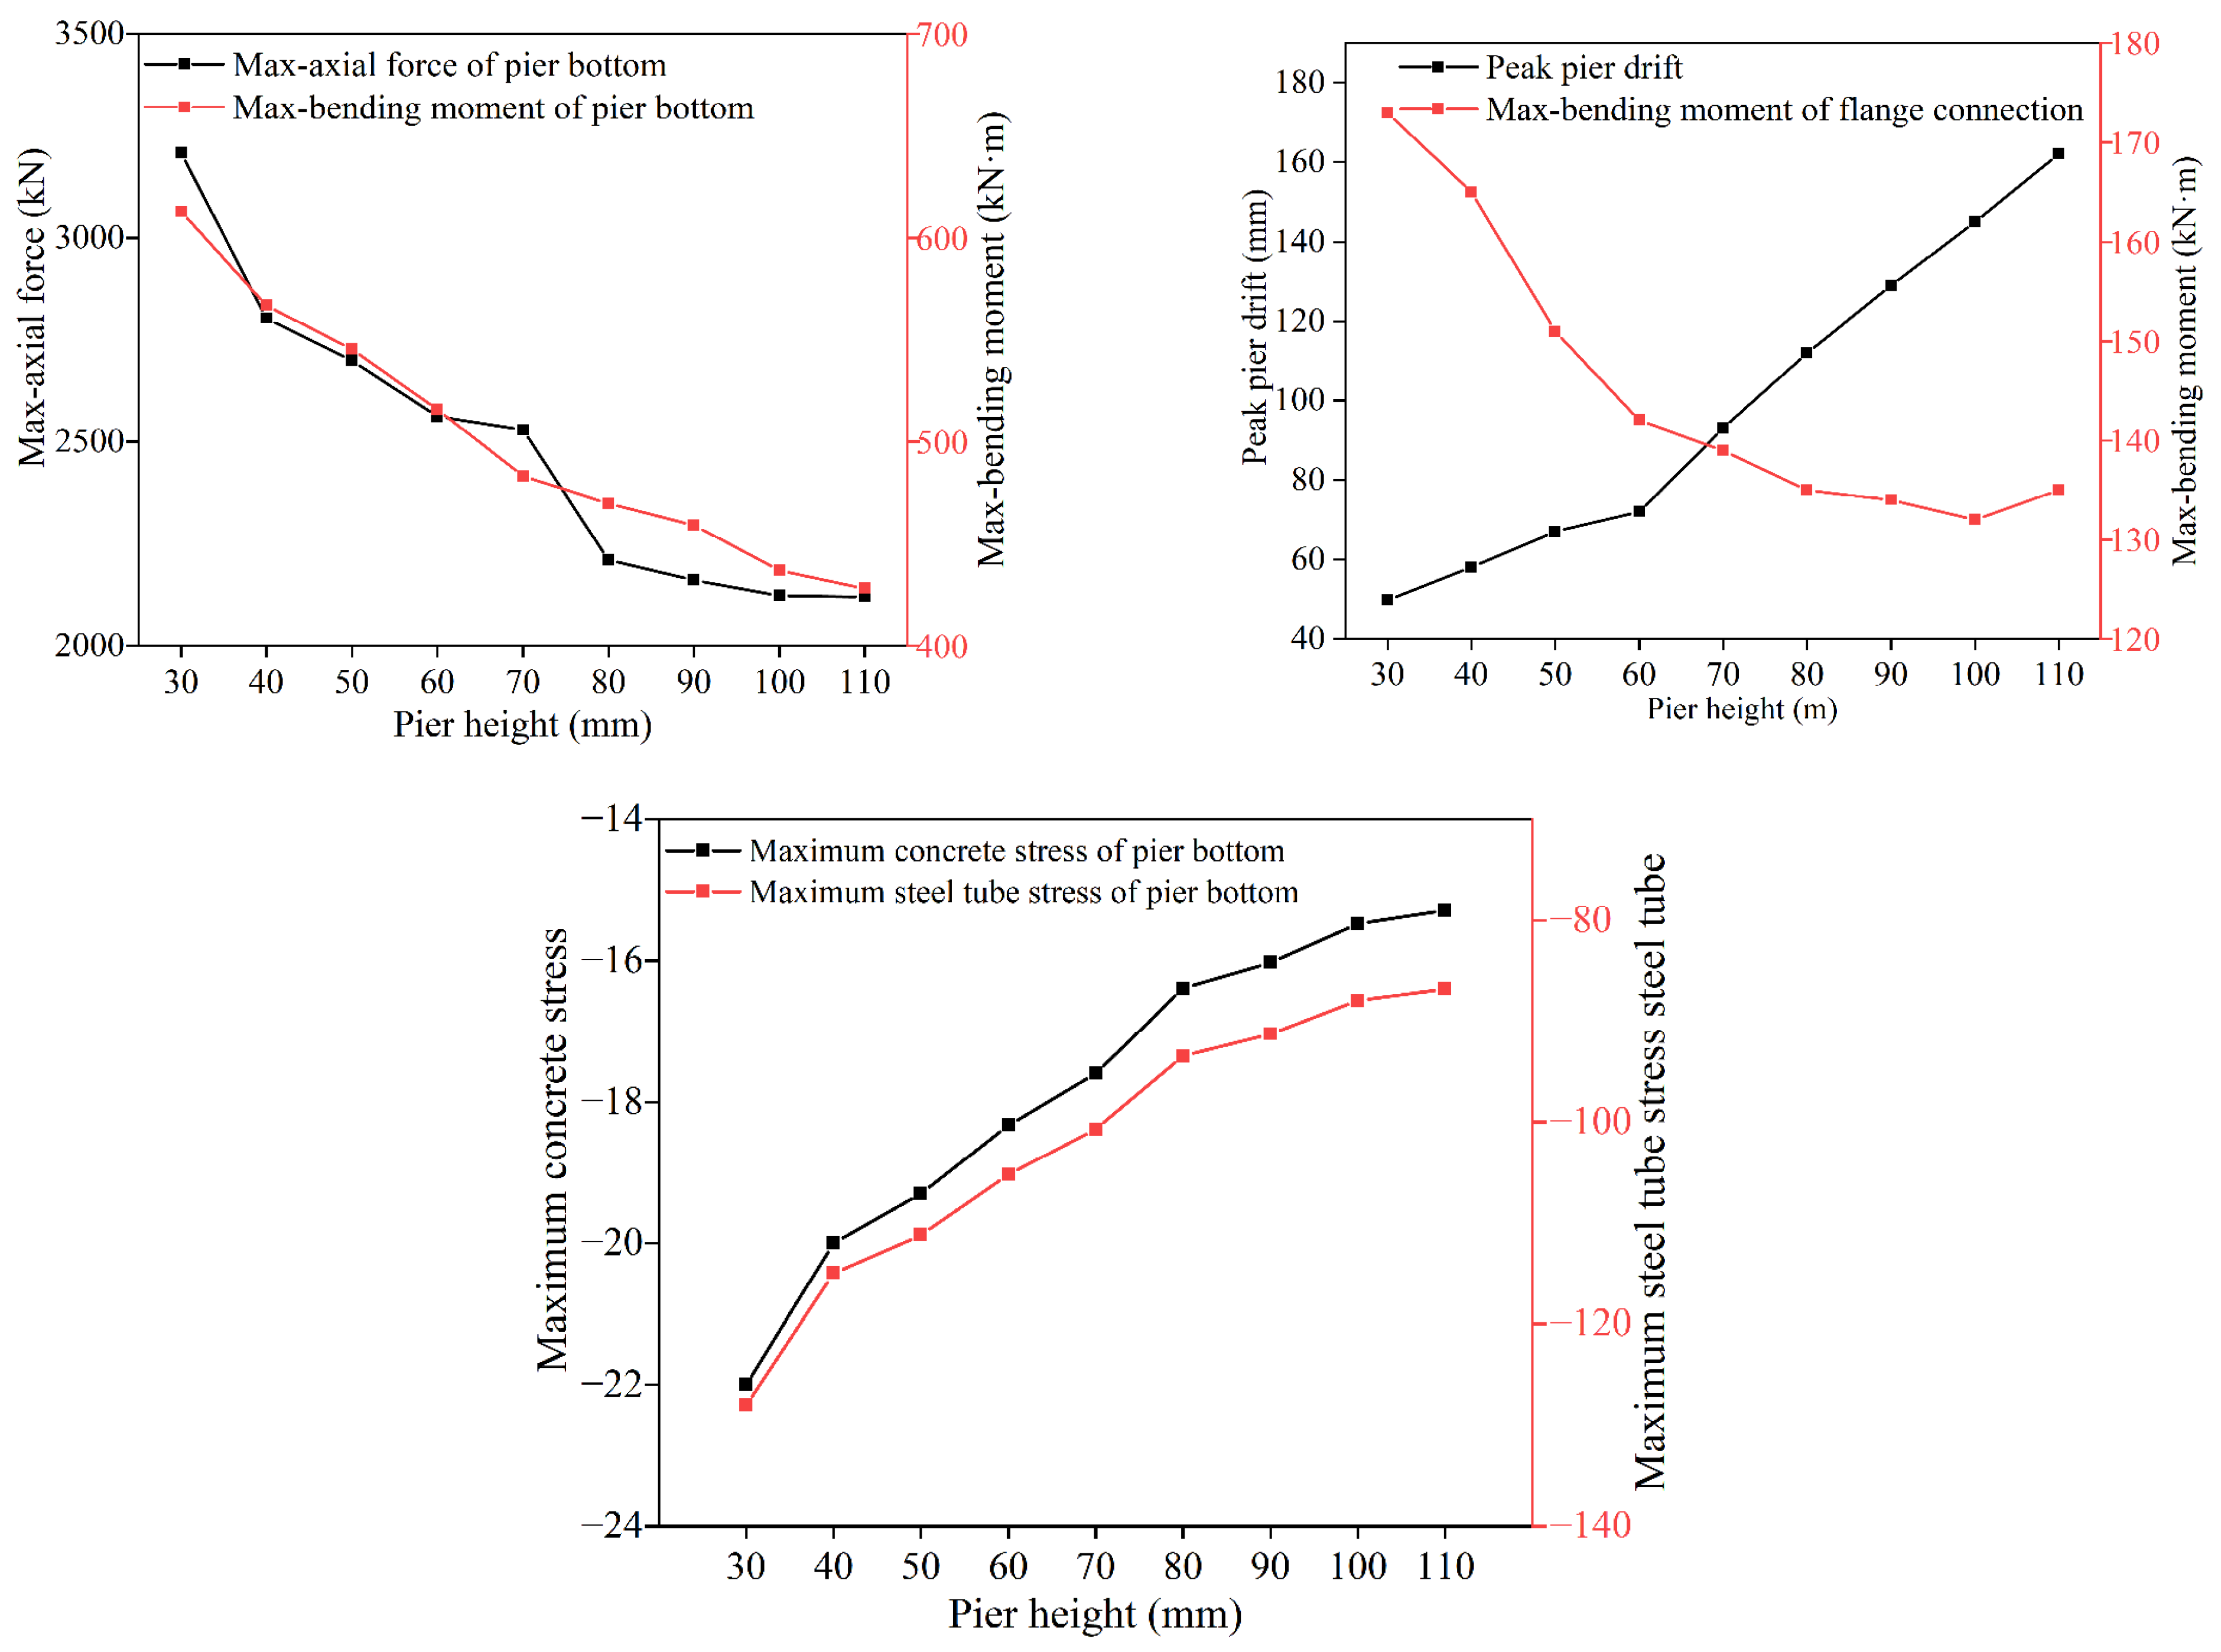
On the basis of the original design scheme, a total of nine models are formed by changing the pier height, with the pier height of 0 m, 40 m, 50 m, 60 m, 70 m, 80 m, 90 m, 100 m, and 110 m in order. The structural response under the seismic action in the cis-bridge direction (X-direction) is shown in Figure 20 and the first-mode period of different structures is shown in Table 7. From Figure 20, the horizontal drift of the pier top gradually increases with the pier height, while the axial force and bending moment of the flange connection and stress at the bottom section of the pier gradually decreases, but the degree of decrease is inapparent.

3.2.2. Axial Compression Ratios

By changing the axial compression ratios of the bridge pier in this section, a total of five models were formed, with the axial compression ratios of 0.1, 0.15, 0.2, 0.25, and 0.3 in order. The FEM results are shown in Figure 21. From Figure 21, increasing the axial compression ratios will enhance the top displacement, the bottom axial force of the pier, and the stress at the bottom section of the pier, but the impact on the bottom bending moment of the pier and the bending moment of the flange connection is inapparent. So, it is recommended that the axial compression ratios of the pier should be about 0.1 in such bridges.

3.2.3. Steel Ratios of CFST Columns

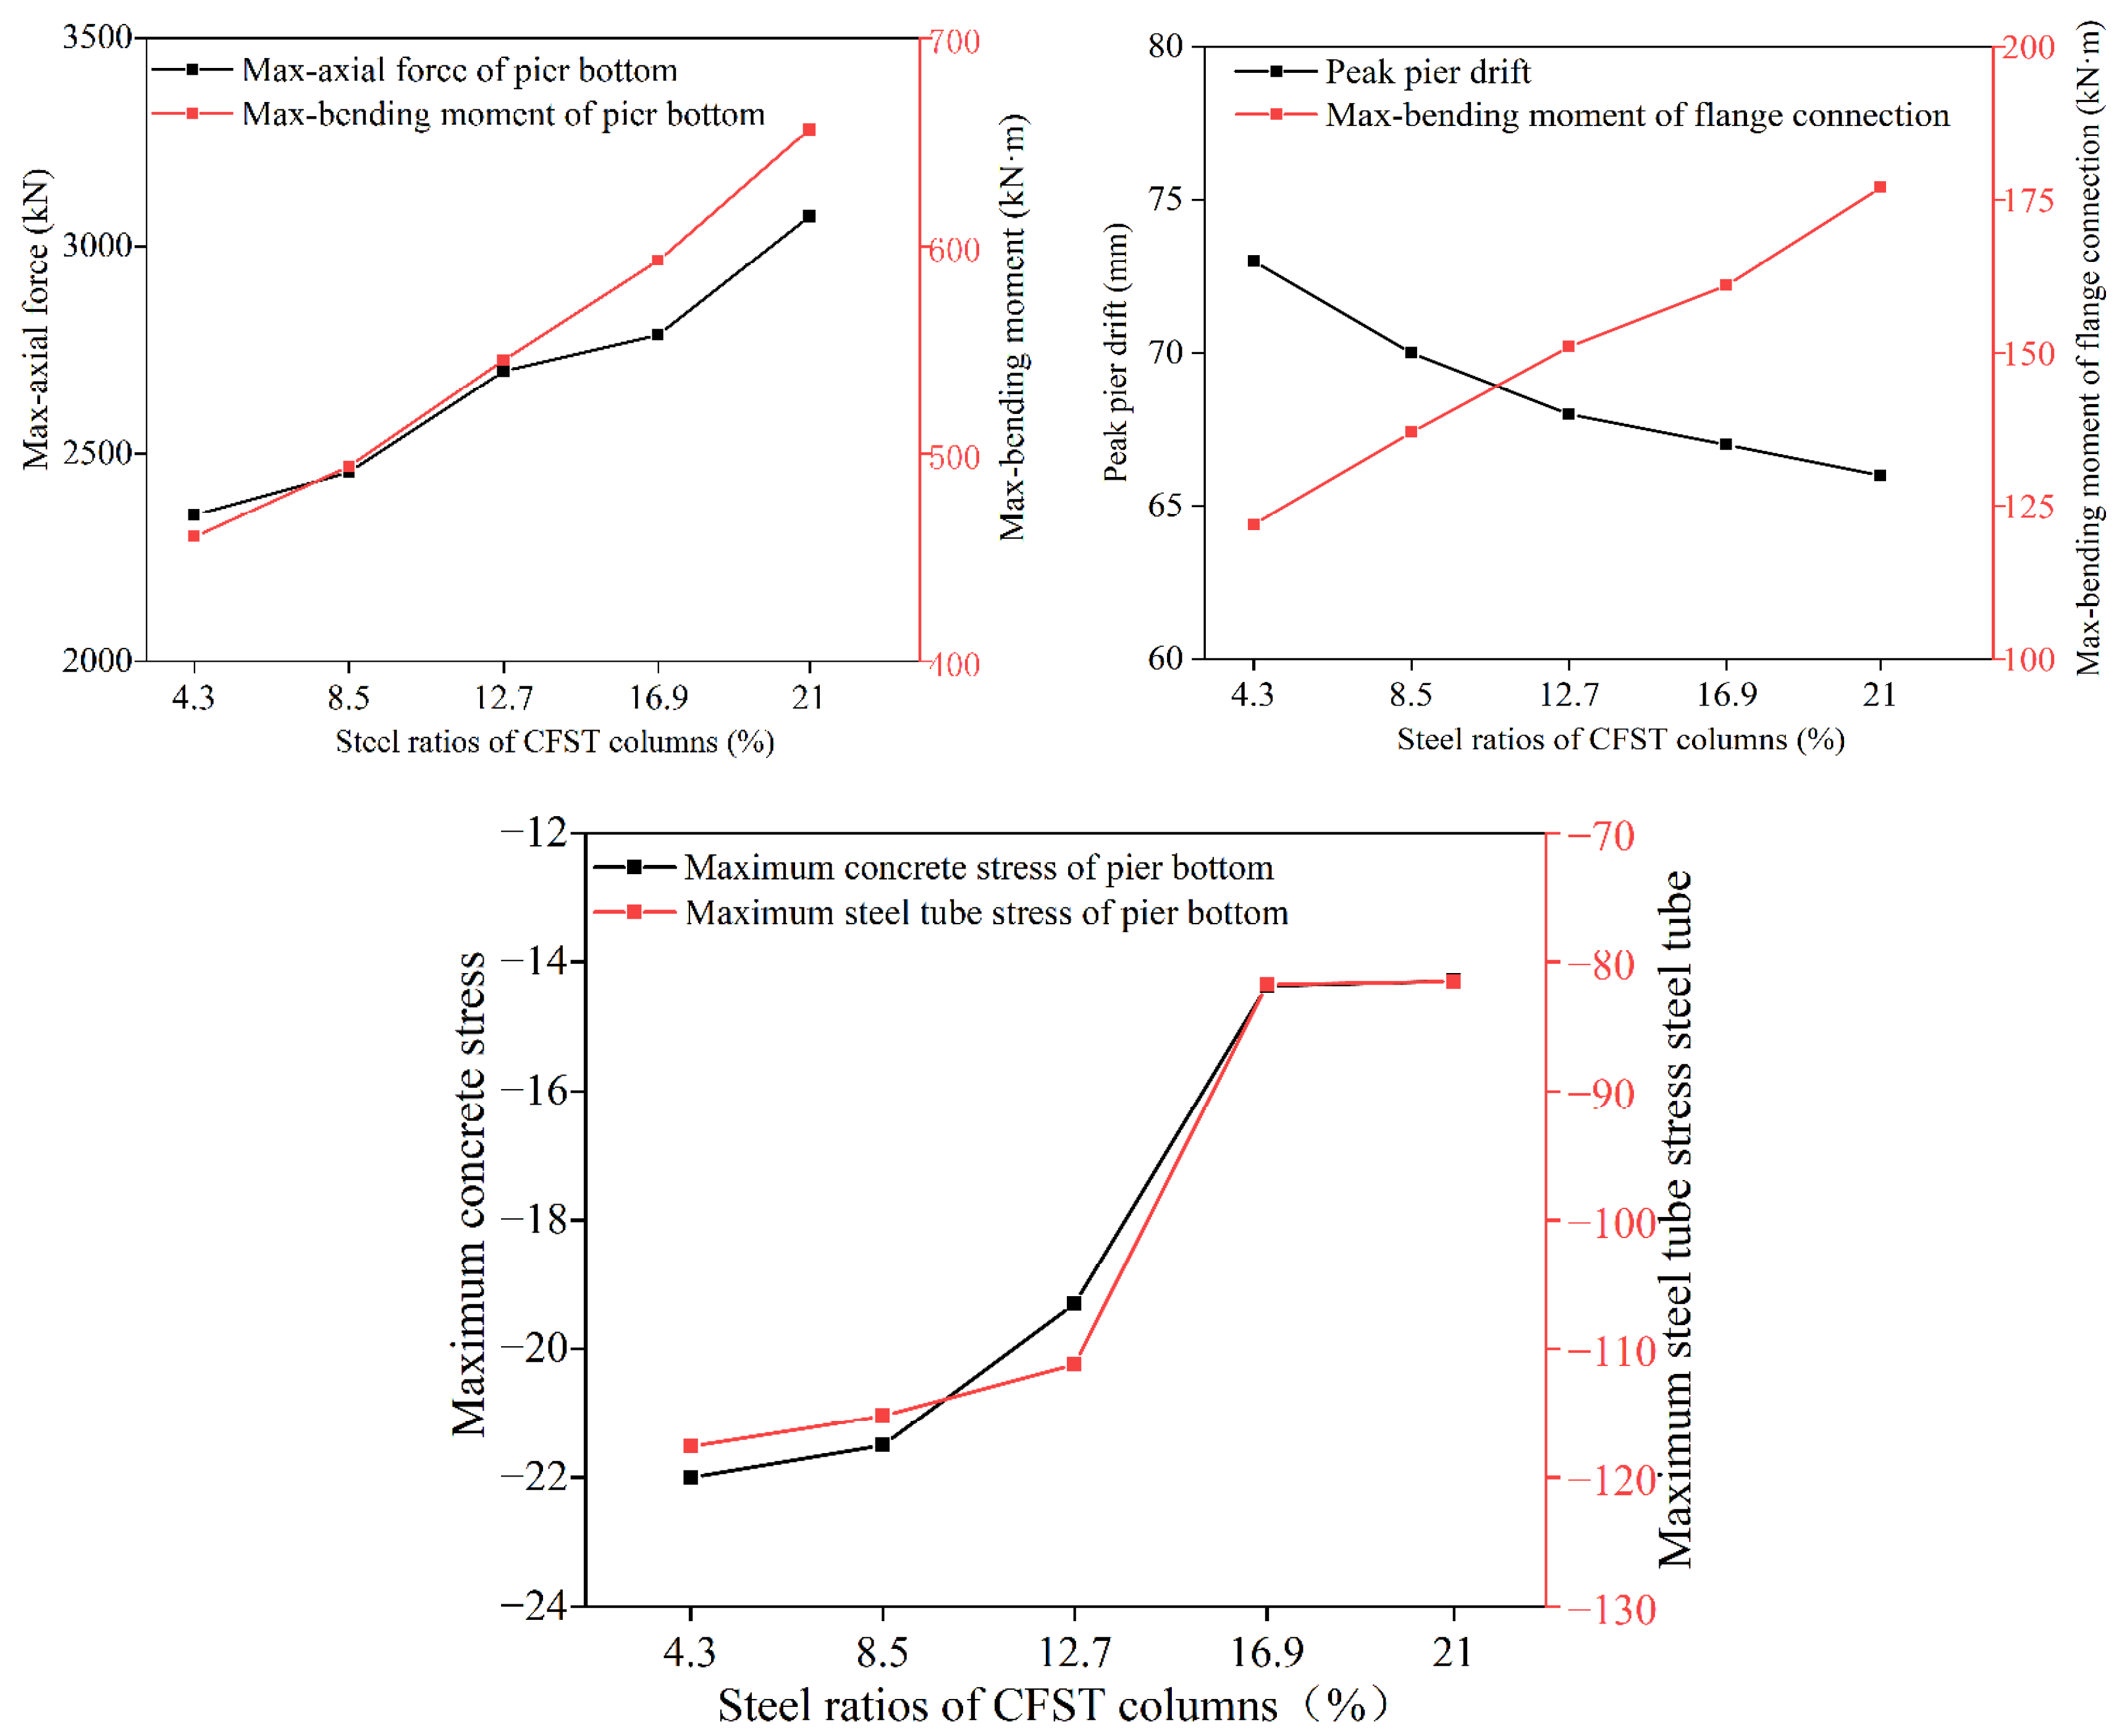
To investigate the steel rations of CFST columns on the seismic performance of the bridge, five models are carried out with 4.3%, 8.5%, 12.7%, 16.9%, and 21.0% of steel ratios of CFST by changing the wall thickness of the CFST columns to 4 mm, 8 mm, 12 mm, 16 mm, and 20 mm, respectively. The structural response under the seismic action in the cis-bridge direction is shown in Figure 22 and the first-mode period of different structures is shown in Table 8. From Figure 22, the effect of increasing the steel ratios of CFST column limbs on the displacement of the top of the pier is not obvious, but it will enhance the force of the column limbs and flange connection. At the same time, increasing the wall thickness of CFST can effectively improve the flexural stiffness of the section, reduce the stress in the bottom section of the pier, and thus effectively enhance the seismic performance of the CFST pier. Considering that increasing the steel ratios of CFST columns may significantly increase the cost of the project, a laced column with a variable cross-section can be considered according to the force characteristics of the laced pier.

3.2.4. Arrangement Type of Steel Lacing Tube

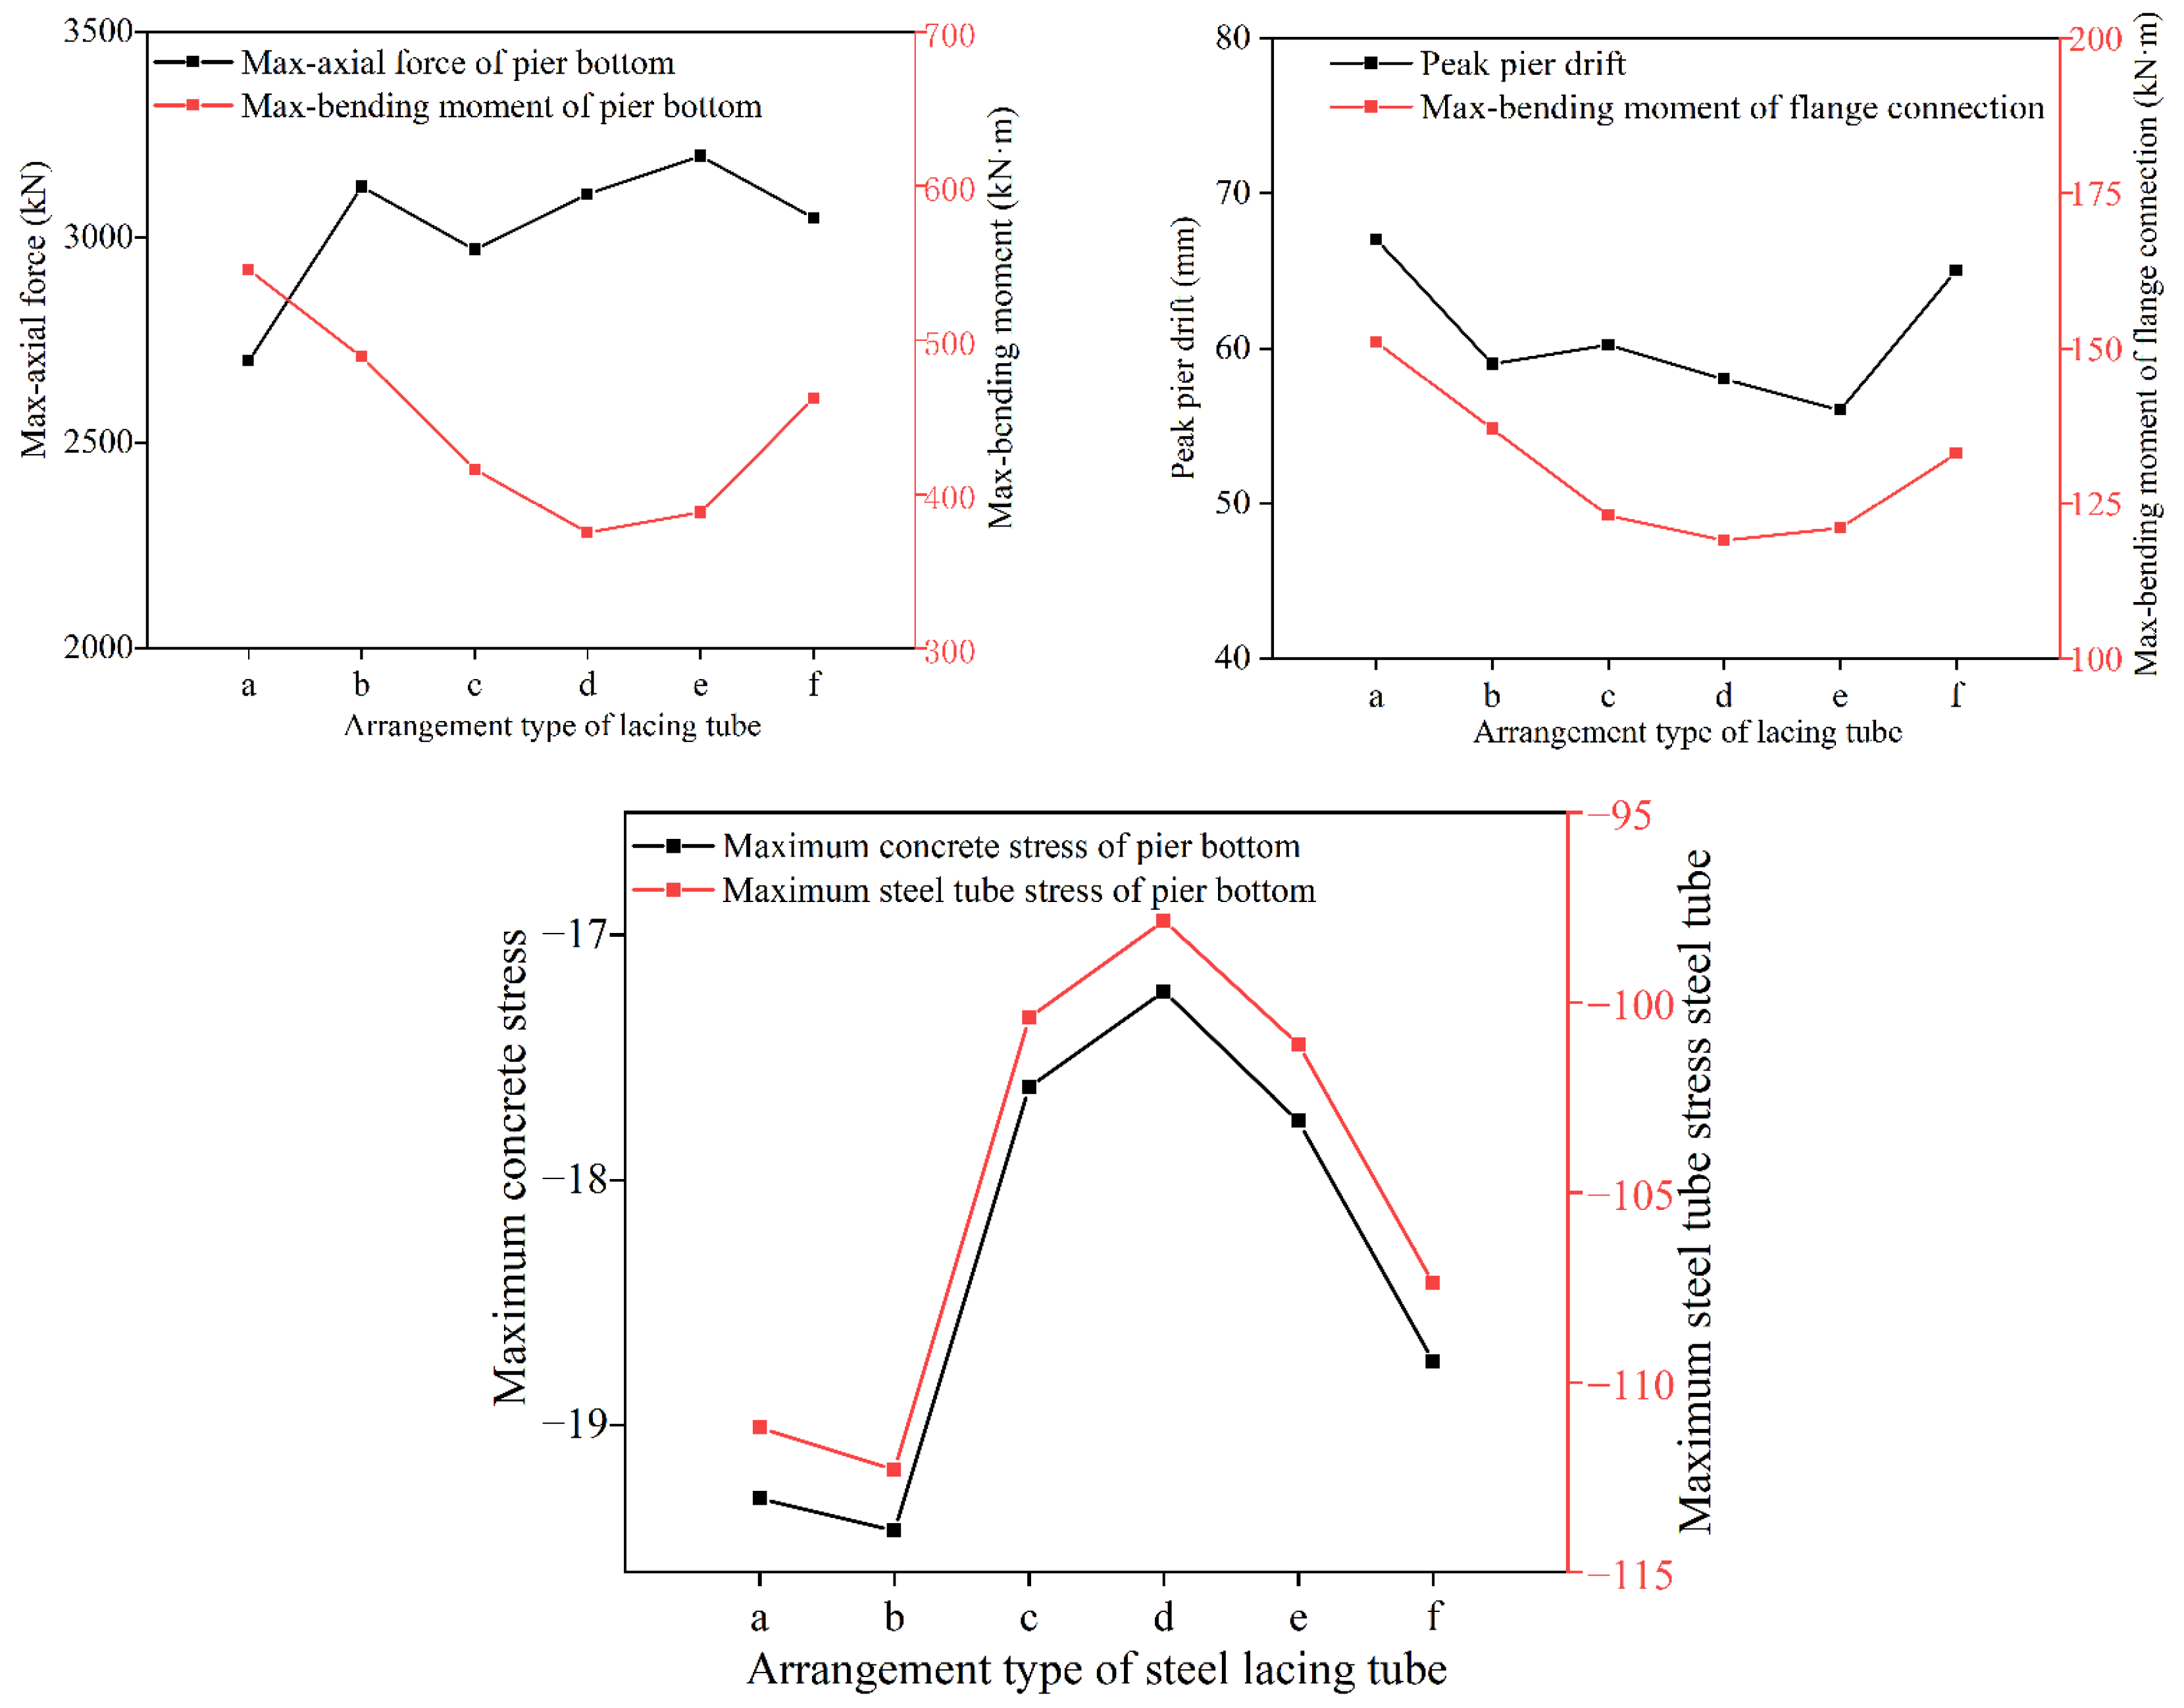
To investigate the arrangement type of lacing tube on the seismic performance of the bridge, a total of six kinds of laced piers were designed, as shown in Figure 23. The seismic response curves for each seismic action in the X-direction are shown in Figure 24 and the first-mode period of different structures is shown in Table 9. To some extent, the use of C-type, D-type, and E-type arrangement forms can reduce the displacement of the top of the pier and column limbs and the force of flange connection, but considering the comprehensive economy and construction difficulties, it is recommended to give priority to the A-type, C-type, and D-type forms in this study.

3.2.5. Longitudinal Slope

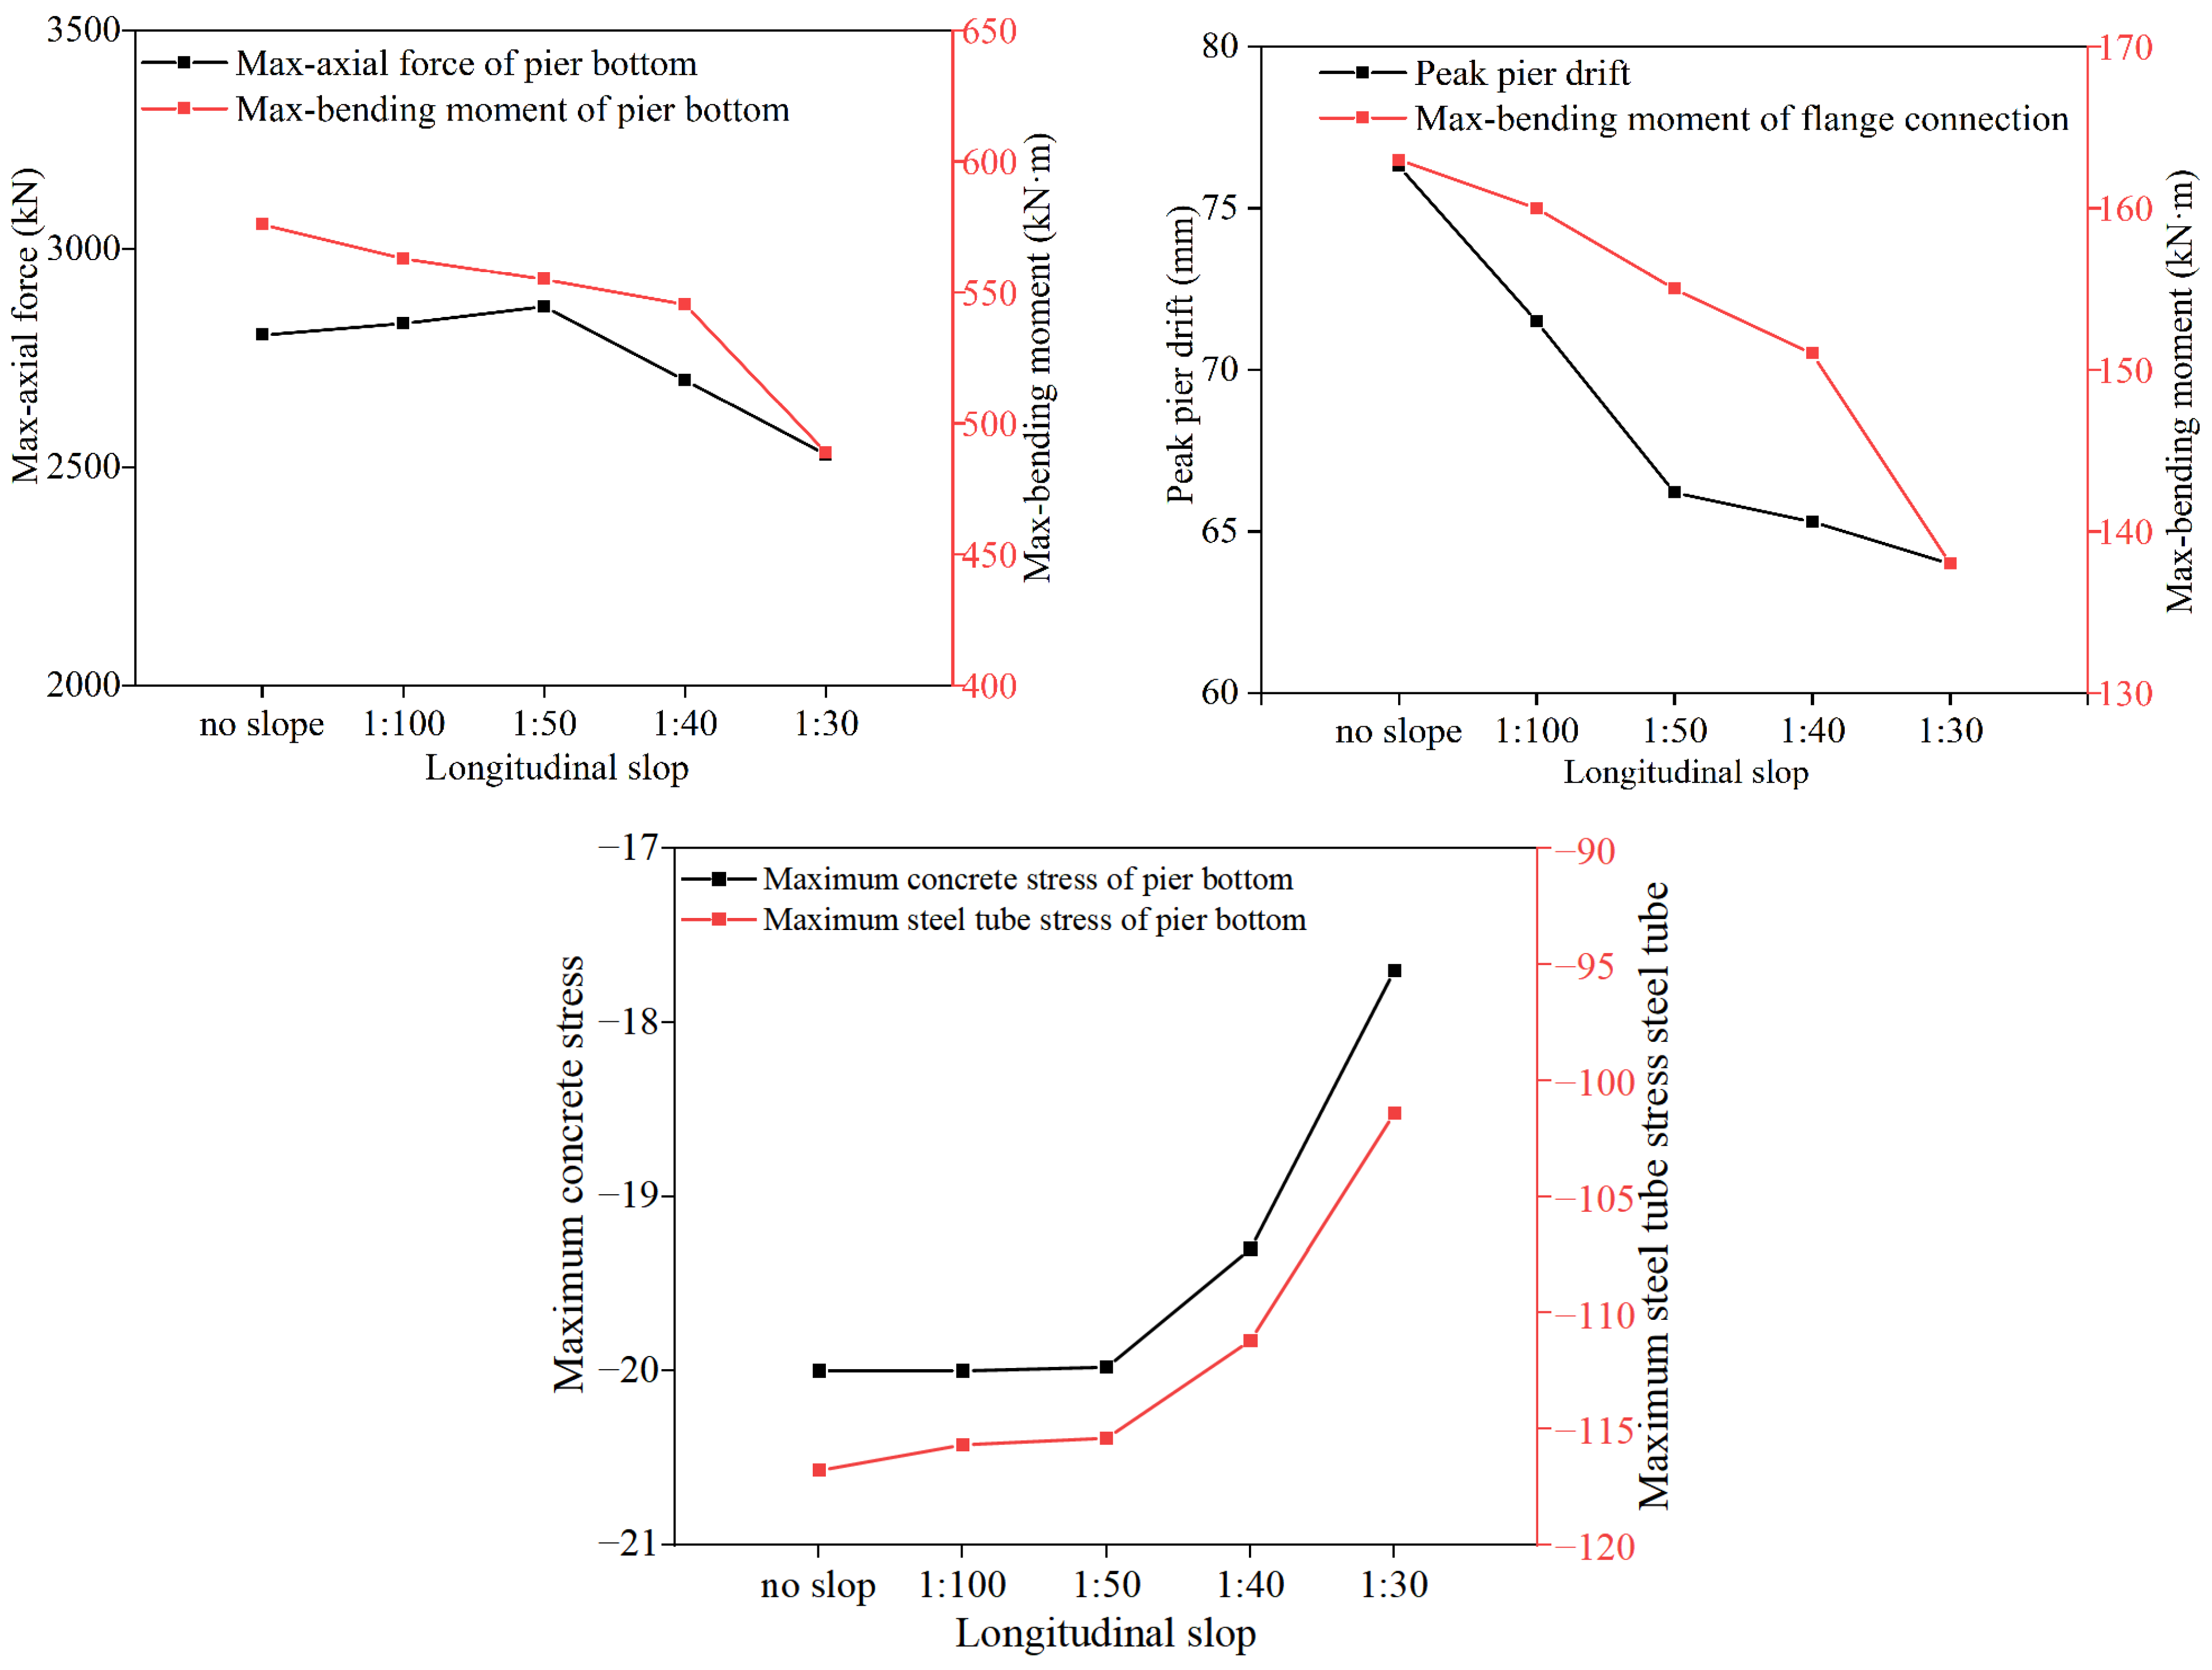
In order to study the effect of the longitudinal slope of the column limbs on the seismic performance of the bridge, five conditions are designed in this section, which consider the longitudinal slope as no slope, 1:100, 1:50, 1:40, and 1:30, respectively. The structural response under the seismic action in the cis-bridge direction is shown in Figure 25 and the first-mode period of different structures is shown in Table 10. Increasing the longitudinal slope has no significant effect on the displacement of the top of the pier, the force of the column limb, and the flange connection. When the slope exceeds 1:50, the stress on the pier bottom section decreases significantly, reducing seismic response to some extent. Therefore, it is recommended to adopt a slope of 1:50 to 1:30.
Based on the above discussion, the effect of each parameter on the seismic response of the bridge is derived, as shown in Table 11. It should be noted that a positive correlation indicates that the seismic response value increases with the increase in the design parameter value; a negative correlation indicates that the seismic response value decreases with the increase in the design parameter value. Moreover, insignificant (insign), less important (less im), important (im), and more important (more im) means the impact range is 0~10%, 10~30%, 30~50%, and more than 10%, respectively.

3.2.6. Seismic Performance Optimization of CFST-laced Piers

To obtain an optimal design of laced piers, it is necessary to consider the seismic performance of the structure, as well as to take into account various factors such as economy, aesthetics, and construction ease. Based on the analysis of Section 3.2, the original design scheme of the laced piers was optimized, in which the pier height was kept unchanged, and the rest of the design parameters were selected according to the recommended values in Table 12. The comparison of the parameters before and after optimization is shown in Table 8. The optimized model was analyzed, and a comparison of the seismic response results between the original model and the optimized model was obtained, which is illustrated in Figure 23. In Table 8, variable cross-section means that the wall thickness of Section 1 is 14 mm, the wall thickness of Sections 2 to 3 is 12 mm, and the wall thickness of Sections 4 to 5 of the CFST pier is 10 mm with a height of 50 m.
Figure 26 shows that the differences between the peak displacement of the pier top and the axial force of the pier bottom are small between the original and optimized models. This is because the bridge superstructure, input seismic waves, and bearing arrangement system are unchanged. However, the differences in the maximum bending moment of the pier bottom and the bending moment of the flange connection are large; therefore, the seismic response of the laced piers can be effectively reduced by using the optimized design scheme, and the seismic resistance of the key sections (such as the pier bottom) and members (such as column limbs and flanges) of the laced piers are not reduced. Therefore, the seismic response of the laced piers can be effectively reduced by using the optimized scheme.

4. Conclusions

Two kinds of FEM were developed for the bridge with hollow CFST-laced piers in this study, namely, a simplified model for simple engineering analysis considerations, and a refined model considering the mass and stiffness distribution of the superstructure. The applicability of the two models was evaluated through the analysis of structural static and dynamic properties and seismic response. Moreover, the seismic response law of assembled flange-connected hollow CFST lattice piers was studied, and their seismic design was optimized with five optimized parameters, such as pier height, axial compression ratios, steel ratios of CFST columns, arrangement type of steel lacing tube and longitudinal slope. The main conclusions obtained were as follows:
(1)
By comparison, the differences between the simplified model and the refined model for the static and dynamic characterization and seismic response are very small. Thus, this study suggests the use of a simplified FEM for the seismic analysis of a bridge with hollow CFST-laced piers;
(2)
FEM results show that the maximum axial force and bending moment of CFST column limbs occur at the bottom of the pier, and the flanges that are subject to large bending moments are generally located at the two connections above the bottom of the pier. In addition, the pier height, axial compression ratio, steel ratio of CFST column, and the arrangement type of lacing tube have an influence on the seismic performance of this laced pier, but the influence of the longitudinal slope of the column limbs is inapparent;
(3)
Based on the results of the parametric analysis, the optimization of the design scheme for the CFST-laced pier is carried out by changing the longitudinal slope, steel ratios of CFST, and arrangement type of the lacing tube, and the results indicate that 0.1 axial pressure ratios and 1:30 longitudinal slope of column limbs with variable cross-section CFST have good seismic performance.

Author Contributions

Conceptualization, L.C., Z.W. and X.J.; Methodology, L.C. and Z.W.; Writing—original draft, L.C. and R.Z.; Writing—review & editing, Y.Z., D.Y., J.L. and X.J. All authors have read and agreed to the published version of the manuscript.

Funding

This research received no external funding.

Informed Consent Statement

Not applicable.

Data Availability Statement

Not applicable.

Acknowledgments

This work was supported by the National Natural Science Foundation of China (Grant No: 52178135) and the Anhui Province Natural Science Foundation of China (Grant No: 2208085ME151).

Conflicts of Interest

The authors declare no conflict of interest.

References

  1. Han, L.H.; Song, T.Y.; Zhou, K.; Cui, Z.Q. Fire Performance of CFST Triple-Limb Laced Columns. J. Struct. Eng. 2018, 144, 400–412. [Google Scholar] [CrossRef]
  2. Ou, Z.; Chen, B.; Hsieh, K.H.; Halling, M.W.; Barr, P.J. Experimental and Analytical Investigation of Concrete Filled Steel Tubular Columns. J. Struct. Eng. 2011, 137, 635–645. [Google Scholar] [CrossRef]
  3. Huang, F.; Chen, B.C.; Li, J.Z.; Yu, G. Experimental study on influence of initial stress on concrete filled steel tubular lattice columns subjected to axial load. J. Build. Struct. 2013, 34, 109–115. [Google Scholar]
  4. Cheng, B.; Xiang, S.; Zuo, W.; Teng, N. Behaviors of partially concrete-filled welded integral T-joints in steel truss bridges. Eng. Struct. 2018, 166, 16–30. [Google Scholar] [CrossRef]
  5. Tang, Y.C.; Li, L.J.; Feng, W.X.; Liu, F.; Zhu, M. Study of seismic behavior of recycled aggregate concrete-filled steel tubular columns. J. Constr. Steel Res. 2018, 148, 1–15. [Google Scholar] [CrossRef]
  6. Han, L.H.; Hou, C.C.; Wu, X. Seismic performance of concrete-encased column base for hexagonal concrete-filled steel tube: Numerical study. J. Constr. Steel Res. 2018, 149, 225–238. [Google Scholar] [CrossRef]
  7. Aguirre, D.; Kowalsky, M.; Nau, J.; Gabr, M.; Lucier, G. Seismic performance of reinforced concrete filled steel tube drilled shafts with inground plastic hinges. Eng. Struct. 2018, 165, 106–119. [Google Scholar] [CrossRef]
  8. Zhang, X.; Xia, X.; Han, S. Quasi-static test of the lattice-type railway bridge pier with replaceable connection component. Structures 2022, 43, 635–644. [Google Scholar] [CrossRef]
  9. Hajjar, J.F.; Gourley, B.C. Representation of Concrete-Filled Steel Tube Cross-Section Strength. J. Struct. Eng. 1996, 122, 1327–1336. [Google Scholar] [CrossRef]
  10. Hajjar, J.F.; Gourley, B.C. A cyclic nonlinear model for concrete-filled tubes. I: Formulation. J. Struct. Eng. 1997, 123, 736–744. [Google Scholar] [CrossRef]
  11. Aval, S.B.B.; Saadeghvaziri, M.A.; Golafshani, A.A. Comprehensive Composite Inelastic Fiber Element for Cyclic Analysis of Concrete-Filled Steel Tube Columns. J. Eng. Mech. 2002, 128, 428–437. [Google Scholar] [CrossRef]
  12. Ou, Z.; Lin, J.; Chen, S.; Lin, W. Experimental Research on Seismic Performance of Four-Element Variable Cross-Sectional Concrete Filled Steel Tubular Laced Columns. IOP Conf. Ser. Mater. Sci. Eng. 2017, 250, 012039. [Google Scholar] [CrossRef]
  13. Hu, Z.; Wei, B.; Jiang, L.; Li, S.; Yu, Y.; Xiao, C. Assessment of optimal ground motion intensity measure for high-speed railway girder bridge (HRGB) based on spectral acceleration. Eng. Struct. 2021, 252, 113728. [Google Scholar] [CrossRef]
  14. Wei, B.; Hu, Z.; He, X.; Jiang, L. Evaluation of optimal ground motion intensity measures and seismic fragility analysis of a multi-pylon cable-stayed bridge with super-high piers in Mountainous Areas. Soil Dyn. Earthq. Eng. 2020, 129, 105945. [Google Scholar] [CrossRef]
  15. CSI. SAP2000 User’s Manual; Computers and Structures, Inc.: Walnut Creek, CA, USA, 2016. [Google Scholar]
  16. Mao, Y.; Ye, F.; Tang, Q.; Lu, T. Experimental study on flexural bearing capacity of SC pile. Eng. Constr. 2015, 29, 24–29. [Google Scholar]
  17. Mander, J.B.; Priestley MJ, N.; Park, R. Theoretical stress-strain model for confined concrete. J. Struct. Eng. 1988, 1114, 1804–1826. [Google Scholar] [CrossRef]
  18. Yang, T.; Yuan, X.; Zhong, J.; Yuan, W. Near-fault pulse seismic ductility spectra for bridge columns based on machine learning. Soil Dyn. Earthq. Eng. 2023, 164, 107582. [Google Scholar] [CrossRef]
  19. Xiang, N.; Chen, X.; Alam, M.S. Probabilistic seismic fragility and loss analysis of concrete bridge piers with superelastic shape memory alloy-steel coupled reinforcing bars. Eng. Struct. 2020, 207, 110229. [Google Scholar] [CrossRef]
  20. Chen, X.; Xiang, N.; Guan, Z.; Li, J. Seismic vulnerability assessment of tall pier bridges under mainshock-aftershock-like earthquake sequences using vector-valued intensity measure. Eng. Struct. 2022, 253, 113732. [Google Scholar] [CrossRef]
  21. Chen, L.; Yan, J.; Xiang, N.; Zhong, J. Shear performance of ultra-high performance concrete multi-keyed epoxy joints in precast segmental bridges. Structures 2022, 46, 1696–1708. [Google Scholar] [CrossRef]
  22. Wei, B.; Hu, Z.; He, X.; Jiang, L. Probabilistic Seismic Evaluation and Experimental Tests of Multi-Direction Damping System on a Super-Long Column-Pylon Cable-Stayed Bridge. J. Earthq. Eng. 2023, 1–24. [Google Scholar] [CrossRef]
  23. Zhong, J.; Zhu, Y.; Han, Q. Impact of vertical ground motion on the statistical analysis of seismic demand for frictional isolated bridge in near-fault regions. Eng. Struct. 2023, 278, 115512. [Google Scholar] [CrossRef]
  24. Yang, T.; Wei, Y.; Zhong, J. Potential bias of conventional structural seismic fragility for bridge structures under pulse-like ground motions: Bias evaluation and strategy improvement. Soil Dyn. Earthq. Eng. 2023, 166, 197787. [Google Scholar] [CrossRef]
  25. JTG/T2231-01-2020; Specification for Seismic Design of Highway Bridges. Ministry of Transport of the People’s Republic of China: Beijing, China, 2020.
  26. Liang, Y.; Xiao, C.; Wu, T.; Xu, Z.; Fan, J.G. Synthesis and Application of Artificial Seismic Waves Based on Building Code Response Spectra. J. Sichuan Univ. Sci. Eng. 2016, 29, 83–87. [Google Scholar]
Figure 1. Cross-sectional view of the SC1 specimen.
Sustainability 15 08318 g001
Figure 2. (a) In situ photos of bending test [16]; (b) bending test apparatus. Bending performance test of the SC1 specimen.
Sustainability 15 08318 g002
Figure 3. FEM of test specimens.
Sustainability 15 08318 g003
Figure 4. Material constitutive models in SAP2000. (a) Mander constitutive model for infilled concrete; (b) steel tube bilinear model.
Sustainability 15 08318 g004
Figure 5. Comparison of experimental and simulated bending moment–deflection data.
Sustainability 15 08318 g005
Figure 6. General layout of bridge with CFST-laced piers.
Sustainability 15 08318 g006
Figure 7. Cross-section of superstructure (unit: cm).
Sustainability 15 08318 g007
Figure 8. General layout of CFST-laced piers (unit: cm).
Sustainability 15 08318 g008
Figure 9. The layout of the support.
Sustainability 15 08318 g009
Figure 10. E2 acceleration response spectrum.
Sustainability 15 08318 g010
Figure 11. (a) S-model; (b) R-model. Diagrams of FEM.
Sustainability 15 08318 g011
Figure 12. (a) Comparison of mid-span deflection; (b) comparison of pier bottom axial force; and (c) vertical reaction force of bearing. Comparison of static performance of two models.
Sustainability 15 08318 g012
Figure 13. Comparison of the first three modes of the two models. (a) Simplified model—the first mode; (b) refined model—the first mode; (c) simplified model—the second mode; (d) refined model—the second mode; (e) simplified model—the third mode; and (f) refined model—the third mode.
Sustainability 15 08318 g013aSustainability 15 08318 g013b
Figure 14. Comparison diagram of time history curve of lateral displacement (Y-axis direction). (a) Lateral drift of 1# pier top; (b) lateral drift of 2# pier top; (c) lateral drift of 3# pier top; and (d) lateral drift of mid-span superstructure.
Sustainability 15 08318 g014aSustainability 15 08318 g014b
Figure 15. Comparison diagram of time history curve of longitudinal displacement (X-axis direction). (a) Longitudinal drift of 1# pier top; (b) longitudinal drift of 2# pier top; (c) longitudinal drift of 3# pier top; (d) and longitudinal drift of mid-span superstructure.
Sustainability 15 08318 g015
Figure 16. Peak longitudinal displacement of the girder.
Sustainability 15 08318 g016
Figure 17. Horizontal displacement envelope diagram of each pier. (a) 1#Pier; (b) 2#Pier; (c) 3#Pier.
Sustainability 15 08318 g017
Figure 18. Axial force envelope diagram of each pier. (a) 1#Pier; (b) 2#Pier; (c) 3#Pier.
Sustainability 15 08318 g018
Figure 19. Envelope diagram of bending moment of each pier. (a) 1#Pier; (b) 2#Pier; (c) 3#Pier.
Sustainability 15 08318 g019
Figure 20. Comparison of maximum seismic response under different pier heights.
Sustainability 15 08318 g020
Figure 21. Comparison of response peaks under different axial compression ratios.
Sustainability 15 08318 g021
Figure 22. Comparison of maximum seismic response under different column steel ratios.
Sustainability 15 08318 g022
Figure 23. Arrangement type of steel lacing tube. (a) A-type; (b) B-type; (c) C-type; (d) D-type; (e) E-type; and (f) F-type.
Sustainability 15 08318 g023
Figure 24. Comparison of the maximum seismic response under different arrangement types of steel lacing tube.
Sustainability 15 08318 g024
Figure 25. Comparison of maximum seismic response under different column slopes.
Sustainability 15 08318 g025
Figure 26. Comparison of seismic response peaks before and after optimization.
Sustainability 15 08318 g026
Table 1. SC1 test specimen material properties.
ComponentCompressive Strength (Mpa)Yield Strength (Mpa)Tensile Strength (Mpa)
Grout-filled concrete (C80)50.2
Steel pipe (Q235B) 243.5512.3
Table 2. Material properties.
ComponentCompressive Strength (Mpa)Yield Strength (Mpa)Tensile Strength (Mpa)
C3523.4
C4026.8
C8050.2
Q235B 243.5512.3
Q345B 356.4623.8
Table 3. The design parameters of the original bridge scheme.
ParametersValuesParametersValues
Pier height50 mSingle span35 m
Longitudinal slope1:40Steel ratio of CFST (wall thickness of steel tube)12.7% (12 mm)
Axial compression ratio0.1Strength of steelQ345
Arrangement type of lacing tubeK-shaped layoutConcrete strength of CFSTC80
Table 4. The difference between the two finite element models.
SuperstructuresSubstructures (Laced Columns)Others
Simplified modelFrame elementEquivalent sectionIdentical
Refined modelshell element, frame element, and Link unitsCombined section of CFST
Table 5. The first ten cycles comparison table.
Mode OrderSimplified ModelRefined ModelRelative Errors
Natural Periods (s)Mass Participation FactorsNatural Periods (s)Mass Participation Factors
16.2250.5976.2370.5970.19%
21.53001.58103.23%
31.25601.31804.70%
40.8973.753 × 10−100.8956.773 × 10−160.22%
50.8970.01760.8950.01770.22%
60.8972.041 × 10−50.8952.844 × 10−130.22%
70.8973.25 × 10−100.8921.002 × 10−60.56%
80.4940.04510.5140.045213.89%
90.47500.47600.21%
100.3952.692 × 10−60.4391.421 × 10−69.94%
Note: The relative error in the table is the ratio of the absolute value of the difference between S-model and R-model. The mass participation factors in the table vary along the longitudinal direction of the bridge.
Table 6. The first ten vibration characteristics.
Mode OrderMode Shapes
Simplified ModelRefined Model
1Longitudinal vibration of superstructure
2Symmetrical lateral bending of superstructure
3Antisymmetrical lateral bending of superstructureTransverse antisymmetric bending and twisting of superstructure
45# Pier longitudinal bending
51# Pier longitudinal bending
64# Pier longitudinal bending
73# Pier longitudinal bending
8Symmetrical lateral bending of superstructure, 1#, 5# pier floating horizontallySymmetrical lateral bending of superstructure
93# Pier longitudinal bending
10Antisymmetric vertical bending of superstructure
Table 7. Comparison of first mode period under different pier heights.
Pier HeightFirst Mode Period (s)
30 m4.648
40 m5.423
50 m6.225
60 m6.973
70 m7.938
80 m8.522
90 m9.591
100 m10.072
110 m11.175
Table 8. Comparison of first mode period under different column steel ratios.
Column Steel RatiosFirst Mode Period (s)
4.36.840
8.56.496
12.76.225
16.96.005
215.712
Table 9. Comparison of first mode period under different arrangement types of steel lacing tube.
Arrangement Type of Steel Lacing TubeFirst Mode Period (s)
A9.290
B6.039
C6.030
D6.048
E6.076
F8.906
Table 10. Comparison of first mode period under different Longitudinal Slope.
Column SlopesFirst Mode Period (s)
No slope7.367
1:1007.034
1:506.641
1:406.225
1:305.167
Table 11. Influence law of different design parameters of lattice pier.
ParameterDisplacement of Top of PierAxial Force of Bottom of PierBending Moment of Bottom of PierBending Moment of FlangeImportanceRecommended Value
Pier heightpositive correlationpositive correlationnegative correlationnegative correlationIm——
Axial compression ratiospositive correlationpositive correlationpositive correlationpositive correlationImAbout 0.1
Steel ratios of CFST columnsnegative correlationpositive correlationpositive correlationpositive correlationMore imvariable cross-section
Arrangement type of lacing tubeIt mainly affects the bending moment of pier bottom and flangeLess imA, C, D-type
Longitudinal slopenegative correlationnegative correlationnegative correlationnegative correlationInsign1:50~1:30
Table 12. Comparison of design parameters of laced piers before and after optimization.
ParametersOriginal Design SchemeOptimized Design Scheme
Axial compression ratios0.10.1
Steel ratios of CFST12.7%variable cross-section of steel tube
Arrangement type of lacing tubeA-typeD-type
Longitudinal slope1:401:30
Disclaimer/Publisher’s Note: The statements, opinions and data contained in all publications are solely those of the individual author(s) and contributor(s) and not of MDPI and/or the editor(s). MDPI and/or the editor(s) disclaim responsibility for any injury to people or property resulting from any ideas, methods, instructions or products referred to in the content.