Article

Characteristics of Tetracycline Adsorption on Commercial Biochar from Synthetic and Real Wastewater in Batch and Continuous Operations: Study of Removal Mechanisms, Isotherms, Kinetics, Thermodynamics, and Desorption

1
Khatib and Alami, Giza 12655, Egypt
2
Sanitary and Environmental Engineering Division, Faculty of Engineering, Cairo University, Giza 12613, Egypt
*
Author to whom correspondence should be addressed.
Sustainability 2023, 15(10), 8249; https://doi.org/10.3390/su15108249
Submission received: 19 March 2023 / Revised: 13 May 2023 / Accepted: 15 May 2023 / Published: 18 May 2023

Abstract

:
Tetracycline (TC) is an antibiotic commonly used to treat bacterial infections. It is detected in wastewater and is considered an emerging contaminant that must be removed before discharge to water bodies. This study examined its adsorption on commercial biochar, a low-cost and sustainable adsorbent produced from the agricultural waste of citrus trees, in both batch and continuous flow systems and from synthetic and real wastewater. The surface area of the biochar was determined using Brunauer–Emmett–Teller (BET) analysis to be 364.903 m2/g. Batch experiments were conducted using biochar doses of 1.5–3.5 g/50 mL; initial TC concentrations of 30–90 mg/L; pH values of 4, 7, and 11; and temperatures of 20, 30, and 40 °C. The results show that TC was successfully removed from both synthetic and real wastewater at removal rates reaching 87% at pH = 4, an adsorbent dose of 3.5 g/50 mL, an initial adsorbate concentration of 90 mg/L, and a temperature of 20 °C in batch experiments for synthetic wastewater and at removal rates reaching 95% for real wastewater. Thermodynamic parameter estimation results revealed that the process is exothermic and spontaneous, while kinetic results showed that adsorption is a multi-step process. TC adsorption on biochar was found to be a physical process. In continuous-mode operation, removal reached 37% at a bed depth of 3 cm. Scanning electron microscopy (SEM) morphologies and Fourier-transform infrared (FTIR) spectroscopy confirmed the occurrence of adsorption.

1. Introduction

Emerging contaminants (ECs) are pollutants that have recently gained particular attention. They include, among other contaminants, pharmaceuticals and personal care products (PPCPs). As a result of the excessive use of pharmaceuticals for both humans and animals in the past few decades, scientific research has focused on their removal from wastewater using mainly physical or chemical methods, such as coagulation and sedimentation, flotation, adsorption, advanced oxidation processes, photodegradation, and electrochemical and membrane separation processes [1,2].
Antibiotics are antimicrobial medications used to treat bacterial infections. Tetracycline (TC) is a widely used broad-spectrum antibiotic that can inhibit bacterial growth [3,4,5,6,7]. It is commonly used to treat bacterial infections in humans and animals and is added to animals’ food for growth improvement [7]. It has been detected in groundwater, wastewater treatment plants’ influents, effluents, sludge, and drinking water [4]. The main concern with antibiotics’ accumulation in the environment, if not removed from discharged wastewater effluents, is the development of antibiotic-resistant strains of bacteria that make antibiotics ineffective for some humans and animals and have negative side effects on humans when contaminated water is consumed [7,8].
The removal of TC from wastewater using biological treatment methods, advanced oxidation processes (AOPs), and electrochemical methods has been investigated and reported in the literature. These methods have several drawbacks. The microorganisms involved in biological treatment are usually affected by TC toxicity, and the electrochemical processes involved in AOPs are costly in terms of the consumption of chemicals and energy [9].
Adsorption is an economical and easily implementable treatment method for removing pharmaceuticals from wastewater. It is characterized by its high efficiency and the availability of different types of adsorbents with a wide range of adsorption capacities [8,9,10,11]. The removal of TC by adsorption has been studied using different types of adsorbents, such as biochar produced from agricultural wastes [9], carbon nanotubes [12], graphene oxide [13,14], activated carbon fibers [15], bentonite [16], modified biochar [8], and magnetic resins [17]. Zhu et al. [18] investigated the adsorption of TC on a graphene oxide/calcium alginate and found that the maximum adsorption capacity was 131.6 mg/g at pH = 6. Increasing the graphene oxide/calcium alginate dose and initial concentration of TC increased the adsorption capacity, achieving 69.4% removal at an initial TC concentration of 50 mg/L and an adsorbent dose of 30 gm.
Biochar is a carbon-based material produced by the pyrolysis of biomass from agricultural wastes, waste from the food industry, and sludge. It is characterized by its high carbon content, relatively large surface area, and pore volume [19]. Burmese grape seed biochar has been used to eliminate methylene blue (MB) from an aqueous solution. The BET specific surface area was estimated at 19.90 m2/g, 85% MB removal was achieved, and the adsorption capacity was 166.30 mg/g [20]. Biochar derived from Citrus macroptera peel has been tested for use in textile dye wastewater treatment [21]. Cow manure biochar has been used for TC adsorption, with three types of biochar produced at different pyrolysis temperatures. The biochar produced at 700 °C achieved a maximum removal efficiency of approximately 47% at pH = 3 and a biochar dose of 1.25 g/L [22]. With biochar prepared from a water treatment plant’s sludge and used for TC adsorption, the removal efficiency achieved was 96.72% at a biochar dose of 4 g/L and an initial TC concentration of 60 mg/L [23]. ZVI@biochar has been used to remove tetracycline, oxytetracycline (OTC), and chlortetracycline (CTC) from aqueous solutions and wastewater. The ZVI@biochar had a specific surface area of 172.9 m2/g, the dose used was 4 g/L, and the initial antibiotic concentration range was 100–500 mg/L. The best removal obtained was in the pH range of 6–7, and equilibrium was reached after 40 min. Adsorption data were fitted to Langmuir and pseudo-second order models. For wastewater collected from a pig farm with an OTC concentration of 12.9 mg/L and wastewater collected from a poultry farm with a CTC of 17.5 mg/L, OTC and CTC removal efficiencies of 95.2% and 96.6%, respectively, have been achieved [24]. The removal of tetracycline hydrochloride from aqueous solutions was investigated using biochar produced from the pyrolysis of mixed food scraps and plant trimmings in a novel heat pipe reactor at 300 °C for 12 h. At a biochar dose of 5 g/L and pH of 7, adsorption capacities reached 2.98 mg/g and 8.23 mg/g for TC initial concentrations of 20 mg/L and 100 mg/L, respectively. The results were found to be best described by Freundlich isotherm and Elovich kinetic models [25]. In a study of TC removal using NaOH-activated biochar derived from alfalfa hay with a specific surface area of 796.50 m2/g, an adsorption capacity of 302.37 mg/g was achieved, which is similar to that achieved with the commercial activated carbon Calgon F400 [26].
The use of low-cost adsorbents is a practical approach to removing contaminants from wastewater. Several studies have examined the use of low-cost adsorbents to remove various classes of pollutants; however, most of these studies focused on batch experiments. In addition to batch experiments, it is essential to conduct continuous-mode experiments to assess the feasibility of full-scale application of the process in wastewater treatment plants. To the best of the authors’ knowledge, TC removal from real wastewater in continuous-mode operation has not been studied previously. Therefore, the main aim of this research was to assess the removal of TC from synthetic and real wastewater in both batch and continuous operation modes under various operating conditions using commercial biochar derived from citrus tree waste, which is a sustainable treatment alternative. The specific objectives of the study were as follows: (1) investigation of TC adsorption from synthetic wastewater onto biochar for ranges of pH, contact time, initial concentration, and temperature; (2) investigation of TC adsorption onto biochar from real wastewater in batch mode under optimal conditions; (3) investigation of TC adsorption onto biochar from synthetic wastewater under optimal conditions in fixed-bed/continuous-mode operation; and (4) estimation of the cost of using biochar as an adsorbent. The results of this study provide essential information about the mechanism associated with the adsorption process in the removal of TC using biochar and the economic feasibility of using such a treatment process in real applications.

2. Materials and Methods

2.1. Adsorbate and Adsorbent

The tetracycline hydrochloride (TC), C22H25ClN2O8, used in this study was supplied by the Middle East for Laboratory Tools, Cairo, Egypt. It was provided in the form of a fine bright yellow powder. Its molecular weight was 480.9 g/mol. The core structure of the TC antibiotic has four rings: three saturated carbon centers and one aromatic ring.
The adsorbent was biochar, a low-cost adsorbent. The biochar used in this research was supplied by MIEGOS and was produced by the pyrolysis of citrus tree waste. A 21 kg package was provided. This type of biochar is commonly used for soil fertility improvement. It was ground to increase its surface area. Table 1 summarizes the chemical composition of the biochar, according to information provided by the supplier.

2.2. Experiments

Adsorption experiments were conducted in batch and continuous-flow systems. The batch experiments were carried out under various operating conditions. An aqueous solution was prepared by dissolving a preset amount of TC in distilled water. The aqueous solution with the designated initial TC concentration was then added to Falcon tubes containing variable biochar weights, according to the experimental program. The tubes were put on an orbital shaker and shaken for the specified time at 200 rpm to ensure adequate contact of the solution with the adsorbent. The samples were collected and filtered, and the filtered solution was then analyzed to determine the final TC concentration. To test the applicability of the biochar to TC adsorption from real wastewater, wastewater collected from the secondary settling tanks of the Zenein wastewater treatment plant in Giza, Egypt, was used in the final run of the batch experiments. The wastewater characteristics are summarized in Table 2.
To determine the rate at which the adsorbent regenerates, chemical desorption experiments were carried out at four different HCl concentrations (0.2, 0.4, 0.6, and 0.8 moles) at a predetermined exhausted biochar weight of 3.5 g biochar/50 mL of aqueous solution, shaken for 3 h at 20 ± 3 °C, at six different adsorbate concentrations (50, 60, 70, 80, 90, and 100 mg/L). At the end of each experiment, the TC concentration was estimated, and the desorption percentage was calculated.
For the continuous-flow column experiments, the aqueous solution was prepared as explained earlier and then added to a feeding tank placed at a higher elevation than the adsorption column bed. The feeding tank supplied the solution by gravity at a fixed flow rate, adjusted using a controllable faucet, to columns containing biochar with different bed depths. Each bed was placed in a glass tube with an inner diameter of 2.2 cm. The column was operated at a continuous flow rate of 1 mL/min, an initial TC concentration of 30 mg/L, a feed solution pH of 4.0, and at room temperature. The adsorbent bed depths tested were 1, 2, and 3 cm, corresponding to 1.6, 3.2, and 4.8 gm of biochar, respectively. The solution collected from the bottom of each column was then filtrated and analyzed. The continuous-flow experimental setup is shown in Figure 1.
To determine the point of zero charge, a NaCl 0.01 molar solution was prepared and distributed among 3 beakers in which the pH was adjusted using either HCl or NaOH to obtain pH values of 4, 7, and 11. The solutions were moved to Falcon tubes to which 3.5 mg/L of biochar was added. The tubes were shaken for 24 h, the final pH values were measured, and the relationship between initial and final pH was determined.

2.3. Analysis

Ultraviolet-visible (UV-Vis) spectrophotometry was used to measure TC light absorption in the ultraviolet and visible ranges of the electromagnetic spectrum. TC concentrations were measured using a UV spectrophotometer (Shimadzu, Tokyo, Japan, model UV-1800 UV-V) at a 360 nm wavelength. High-performance liquid chromatography (HPLC, model YL9100, YL Instruments, Republic of Korea) was used to analyze the real wastewater samples. A pH meter (inoLab WTW series pH720, Xylem-WTW, Germany) was used to measure the pH of each solution. All analyses were conducted in duplicate, and average values were recorded. The biochar surface before and after adsorption was examined using a scanning electron microscope (SEM, model SEM Quanta FEG 250, field emission gun) attached to a unit for energy dispersive X-ray (EDX) analysis with an accelerating voltage of 30 kV and a magnification range of 14 to 1,000,000×. Brunauer–Emmett–Teller (BET) analysis was conducted using NOVA touch–Quantachrome instruments, USA. Particle sizes were estimated using the NICOMP particle sizing system. Fourier-transform infrared (FTIR) samples were prepared using the KBr pelleting technique, and the FTIR analysis was conducted using a UV-visible spectrophotometer (Thermo Scientific Nicolet iS50 FT-IR, MA, USA).

2.4. Calculations

The adsorption equilibrium capacity (qe, mg/g) and percent removal were estimated as per the following equations:
qe = (CoCe) V/M
% Removal = [(CoCe)/Co)] × 100
Co and Ce are the TC concentrations at time = 0 and equilibrium in mg/L, V is the volume in liters, and M is the mass of the biochar in grams.

2.5. Equilibrium Studies and Kinetic Models

The adsorption of TC onto biochar was studied using Langmuir, Freundlich, Dubinin–Radushkevich, and Temkin isotherms [27,28,29,30]:
Langmuir isotherm:
1 q e = ( 1 Q m a x K L ) 1 C e + 1 Q m a x
Freundlich isotherm:
log qe = nlog Ce + log KF
Dubinin–Radushkevich isotherm:
ln q e = K D R R 2 T 2 l n 2 ( 1 + 1 C e ) + ln q D R
Temkin isotherm:
Qe = B1 ln KT + B1 ln Ce
To study the adsorption of TC onto biochar, the following kinetic models were used in their linear forms [23,28]:
Pseudo-first order (PFO):
ln (qeqt) = ln (qe) − k1t
Pseudo-second order (PSO):
t q t = 1 q e t + 1 k 2 q e 2
Elovich equation:
q t = 1 β ln ( α β ) + 1 β ln ( t )
Qmax is the maximum capacity of adsorption in mg/g; KL is a constant denoting the affinity between the adsorbate and adsorbent; n is the Freundlich isotherm intensity factor; KF is the Freundlich constant in (mg/g)/(mg/L)n; KDR is a constant indicating the adsorption energy in mol2/J2; qDR is the adsorption capacity in mg/g; R is the ideal gas constant, equal to 8.31 J/mol·K; T is the temperature in K; B1 is a Temkin isotherm constant; KT is a constant for the Temkin isotherm equilibrium binding in L/g; t is the time in min; k1 is the rate constant of the PFO in min−1; k2 is the rate constant of the PSO in g/mg/min; α is the initial rate constant in mg/g/min; and β is the desorption constant in mg/g.

2.6. Adsorption Mechanism

The adsorption mechanism usually proceeds as follows: film diffusion, in which the adsorbate molecules migrate from the solution to the external surface of the adsorbent; particle diffusion, which is the movement of the adsorbate molecules to the insides of the adsorbent pores; and, finally, solute adsorption onto the interior surfaces of the adsorbent pores [20].

2.6.1. Intraparticle Diffusion Model

The intraparticle diffusion model is described by the following equation [27,28,29,30]:
qt = Ki t0.5 + C

2.6.2. Boyd Kinetic Model

The Boyd kinetic model is described by the following equation [27,28,29,30]:
Bt = −0.4977 − ln(qt/qe − 1)
where qt is the amount of TC adsorbed per gram of biochar in mg/g, Ki is the intraparticle diffusion rate constant in mg/g/min0.5, and C is a constant.

2.7. Adsorption Thermodynamics Studies

ΔG°, the standard Gibbs free energy change in kJ/mol, was calculated as follows [27]:
ΔG° = −RT ln(Kc)
where Kc is the equilibrium constant, calculated as follows:
K c = C o C e C e
ΔH° and ΔS° were estimated, as follows, using the van’t Hoff equation:
ln ( K c ) = Δ H ° R   1 T + Δ S ° R
where ΔH° is the standard change in enthalpy in kJ/mol, and ΔS° is the standard change in entropy in J/mol/K.

3. Results and Discussion

3.1. Adsorbent Characterization

The particle size distribution of the biochar was determined using dynamic light scattering (DLS). The mean particle diameter was 393.92 nm, and the polydispersity index (PI) was 0.52.
The BET analysis results indicate that the average surface area of the biochar was 364.9 m2/g, the average pore size was 1.0779 nm, the total pore volume was 0.1967 cc/g, and the average particle radius was 3.737 nm. The surface area was considered low compared to that of commercial activated carbon, which can be as high as 2000 m2/g [31], but relatively high compared to that of other unmodified biochar samples [19,23].
The results of the XRF analysis are shown in Table 3. CaO was the largest oxide component of the biochar used.
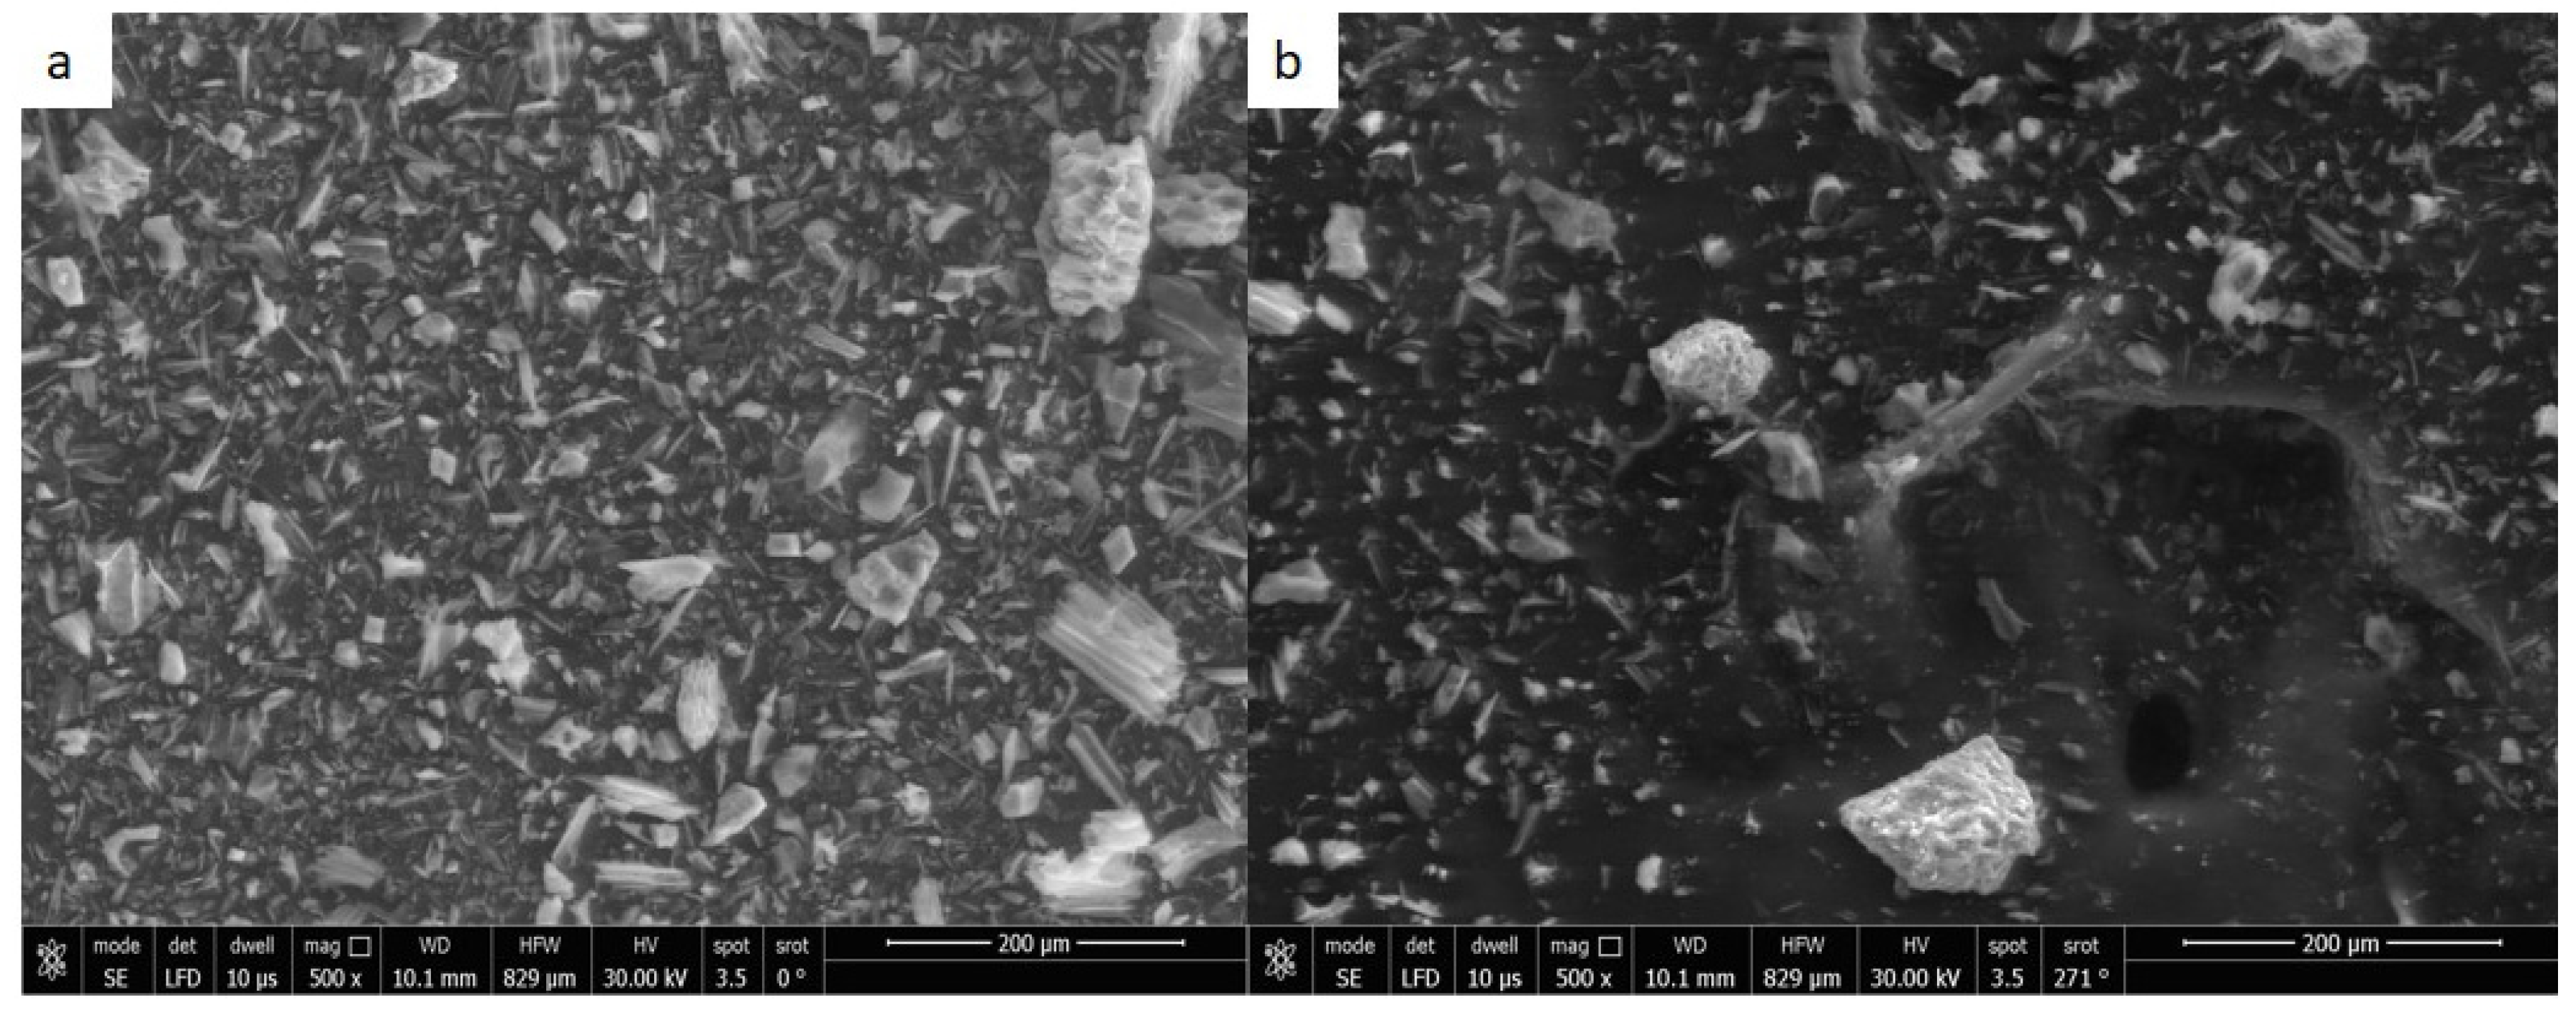
Figure 2a,b show the surface morphology of the biochar before and after the adsorption of TC at magnification 500×. The figures show that the biochar surface had a heterogeneous, porous structure. A fiber-like appearance can also be observed [21]. After adsorption, the pores were smaller and filled with small molecules of adsorbate, confirming the adsorption of TC onto the biochar surface.
FTIR spectroscopic analysis was conducted in the range of 400–4000 cm−1 to identify the functional groups present on the biochar surface and how they contribute to the adsorption process, as they help explain the adsorption mechanisms. As Figure 3 shows, the most distinct peaks were obtained at 3431, 2918, 2851, 1600, 1573, 1432, 875, and 470 cm−1. The peak at 3431 cm−1 can be attributed to O–H stretching [32], those at 2918 and 2851 cm−1 to alkane C–H stretching [9], that at 1574 cm−1 to aromatic C=C stretching and C=O stretching [9,32], that at 1432 cm−1 to C–H bending, and that at 875 cm−1 to aromatic C–H bending [9].
The FTIR spectra after adsorption show a shift in some peaks and damping in others, while some new peaks appeared in the range from 1500 to 500 cm−1, which is the fingerprint area. This proves the formation of new bonds, confirming the occurrence of the adsorption process [5,10]. The new peaks appeared at 753 cm−1, due to C-Cl stretching, and at 681 cm−1, due to C–H “oop” stretching.

3.2. Effects of Initial pH and Adsorbent Dose

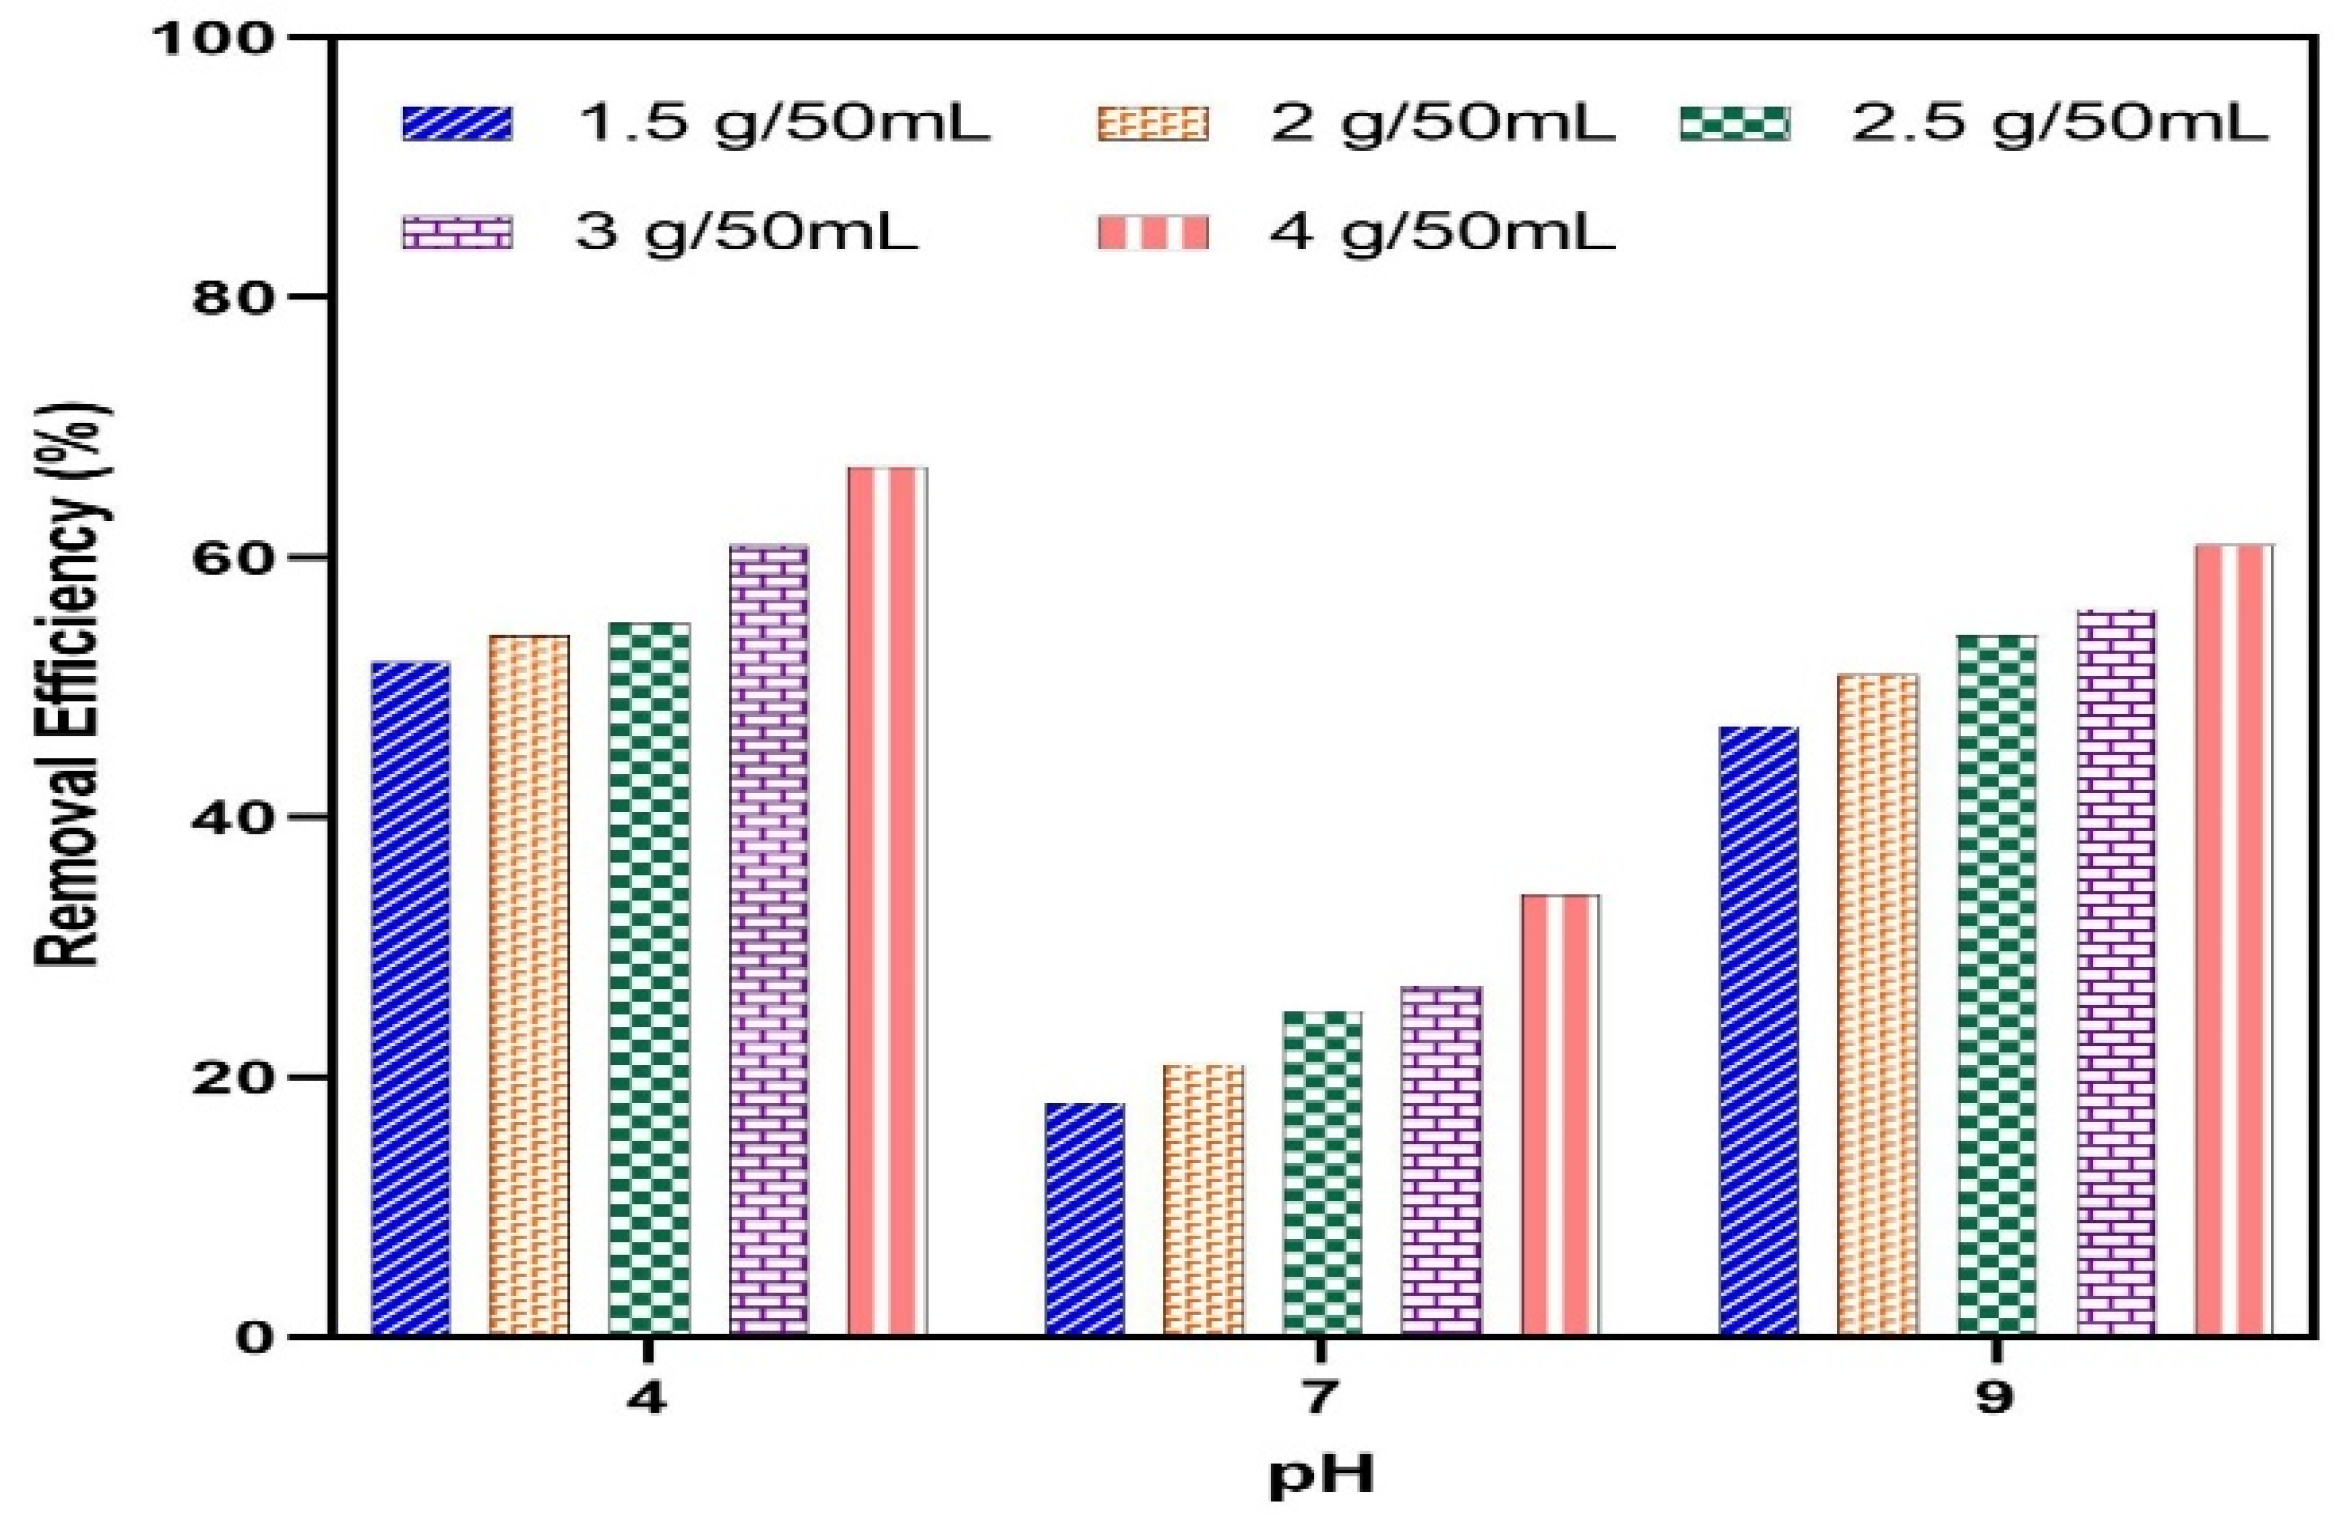
pH is a key parameter affecting the adsorption process, which is why it was essential to study its effect to determine its optimum value for use in subsequent experiments. Figure 4 shows the effect of varying the solution’s pH on the removal efficiency of TC at different biochar doses. The best removal was achieved at pH = 4 for all biochar doses, with increasing removal as the biochar dose increased, up to a maximum of 67% removal at 3.5 g/50 mL of biochar. The isoelectric point of the biochar was found to be 9.5, which is close to values reported in the literature [23,33]. This means that below 9.5, the biochar surface is positively charged. TC is usually found in the following ionic forms: cationic at pH values < 3.3, zwitterionic at pH values in the range of 3.3–7.8, and anionic at pH values higher than 7.8 [9,22,34]. This implies that the high removal rate obtained at pH = 4, at which both the adsorbent and adsorbate were positively charged, was due to the π–π electron donor–acceptor (EDA) interaction [9,13], which is a weak bond that usually occurs between aromatic rings as an electron transfer occurs between an electron donor and an acceptor. This mechanism is common in the adsorption processes of several pollutants on carbonaceous materials, such as biochar, when used to adsorb TC [8,22].

3.3. Effect of Initial Concentration

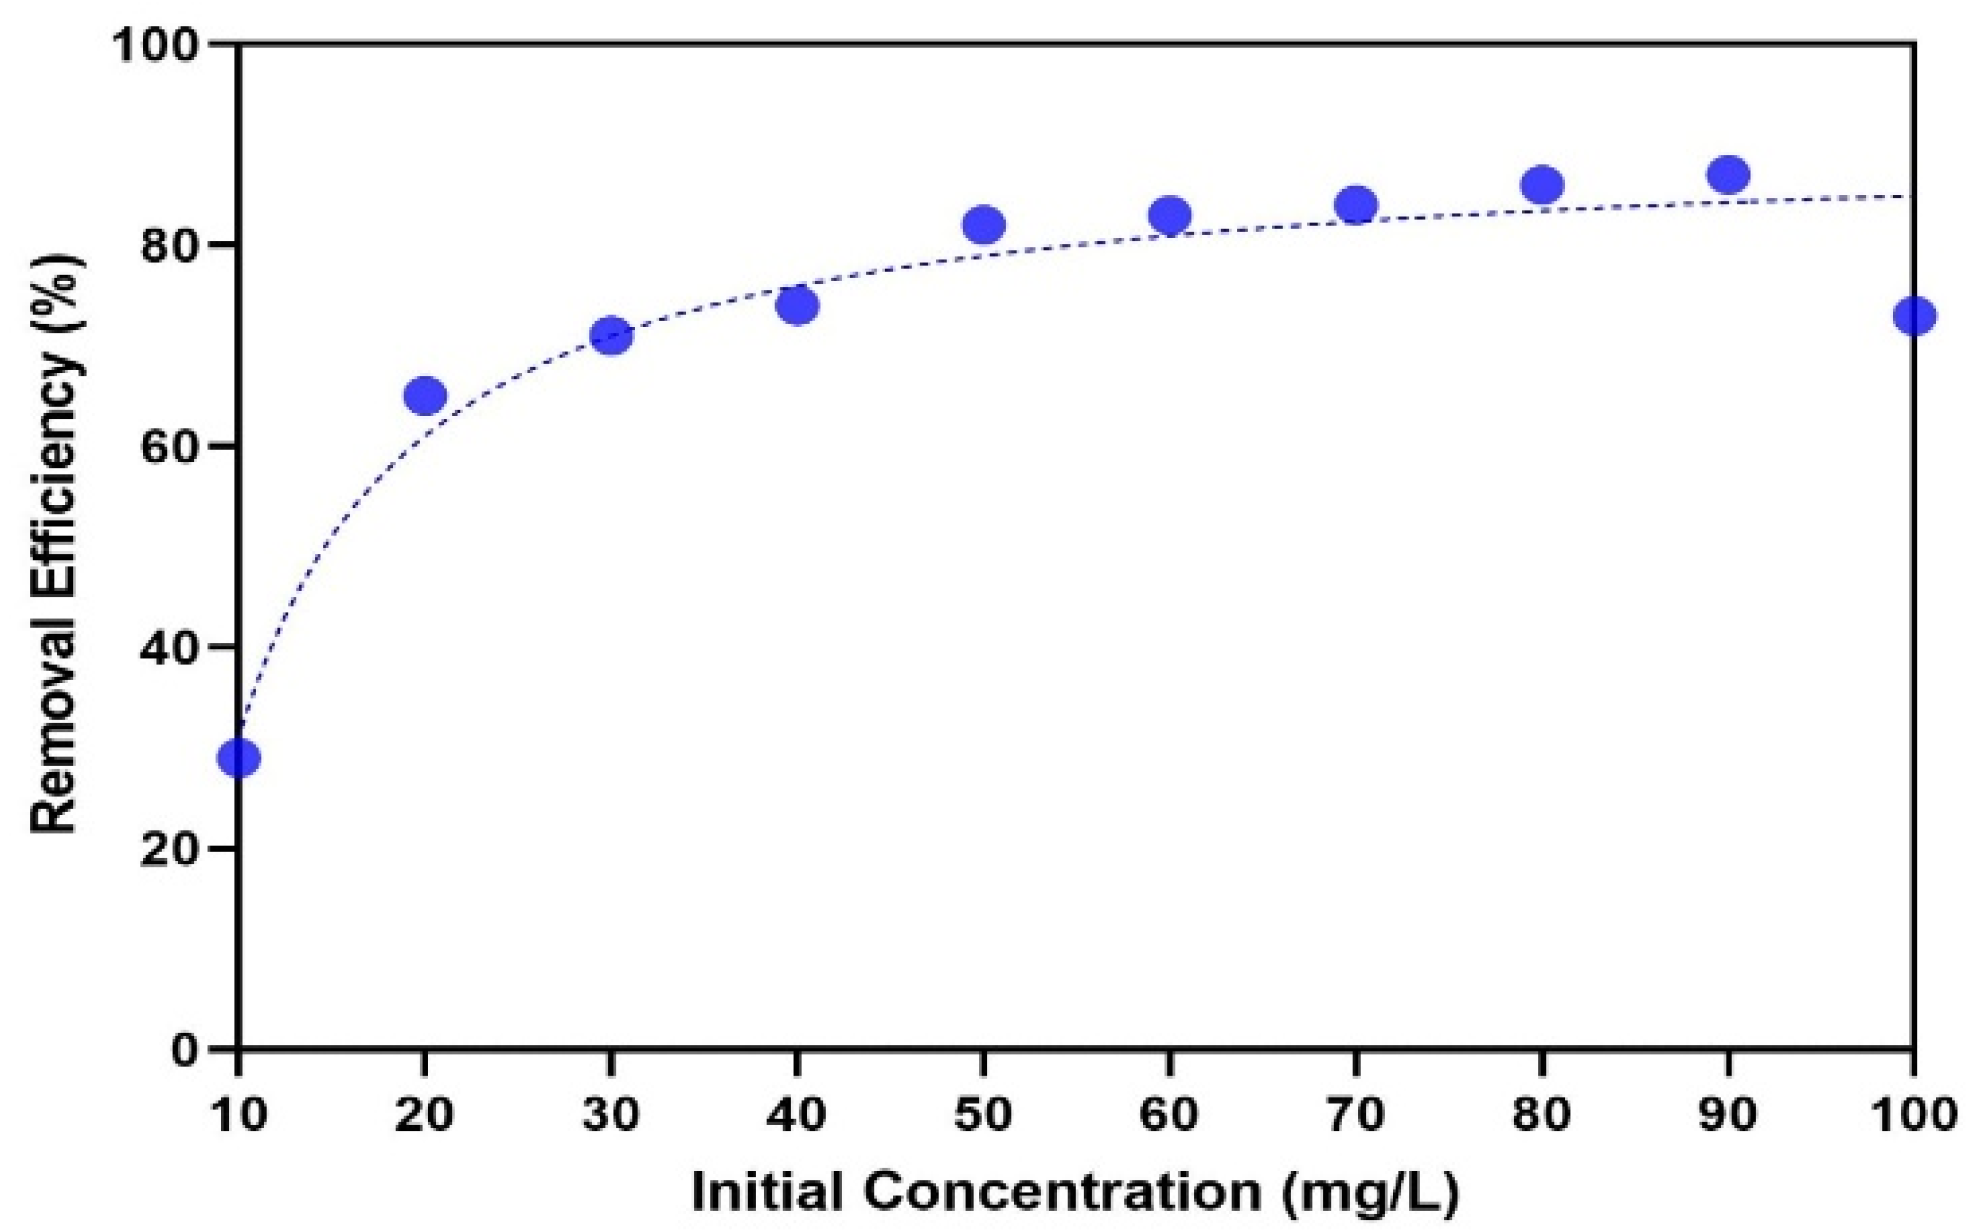
As Figure 5 shows, the initial concentration of TC has a major effect on the removal efficiency: a lower initial concentration corresponds to lower removal efficiency. This can be attributed to the biochar having more vacant sites at lower initial TC concentrations. The removal efficiency increased rapidly with the initial TC concentration up to 20 mg/L and more slowly thereafter, up to 90 mg/L, before decreasing. This trend is attributable to a significant initial concentration gradient creating a driving force for TC transfer to the surface of the biochar [5]. Based on these results, initial TC concentrations in the range of 50–100 mg/L were studied in subsequent experiments.

3.4. Effect of Reaction Time

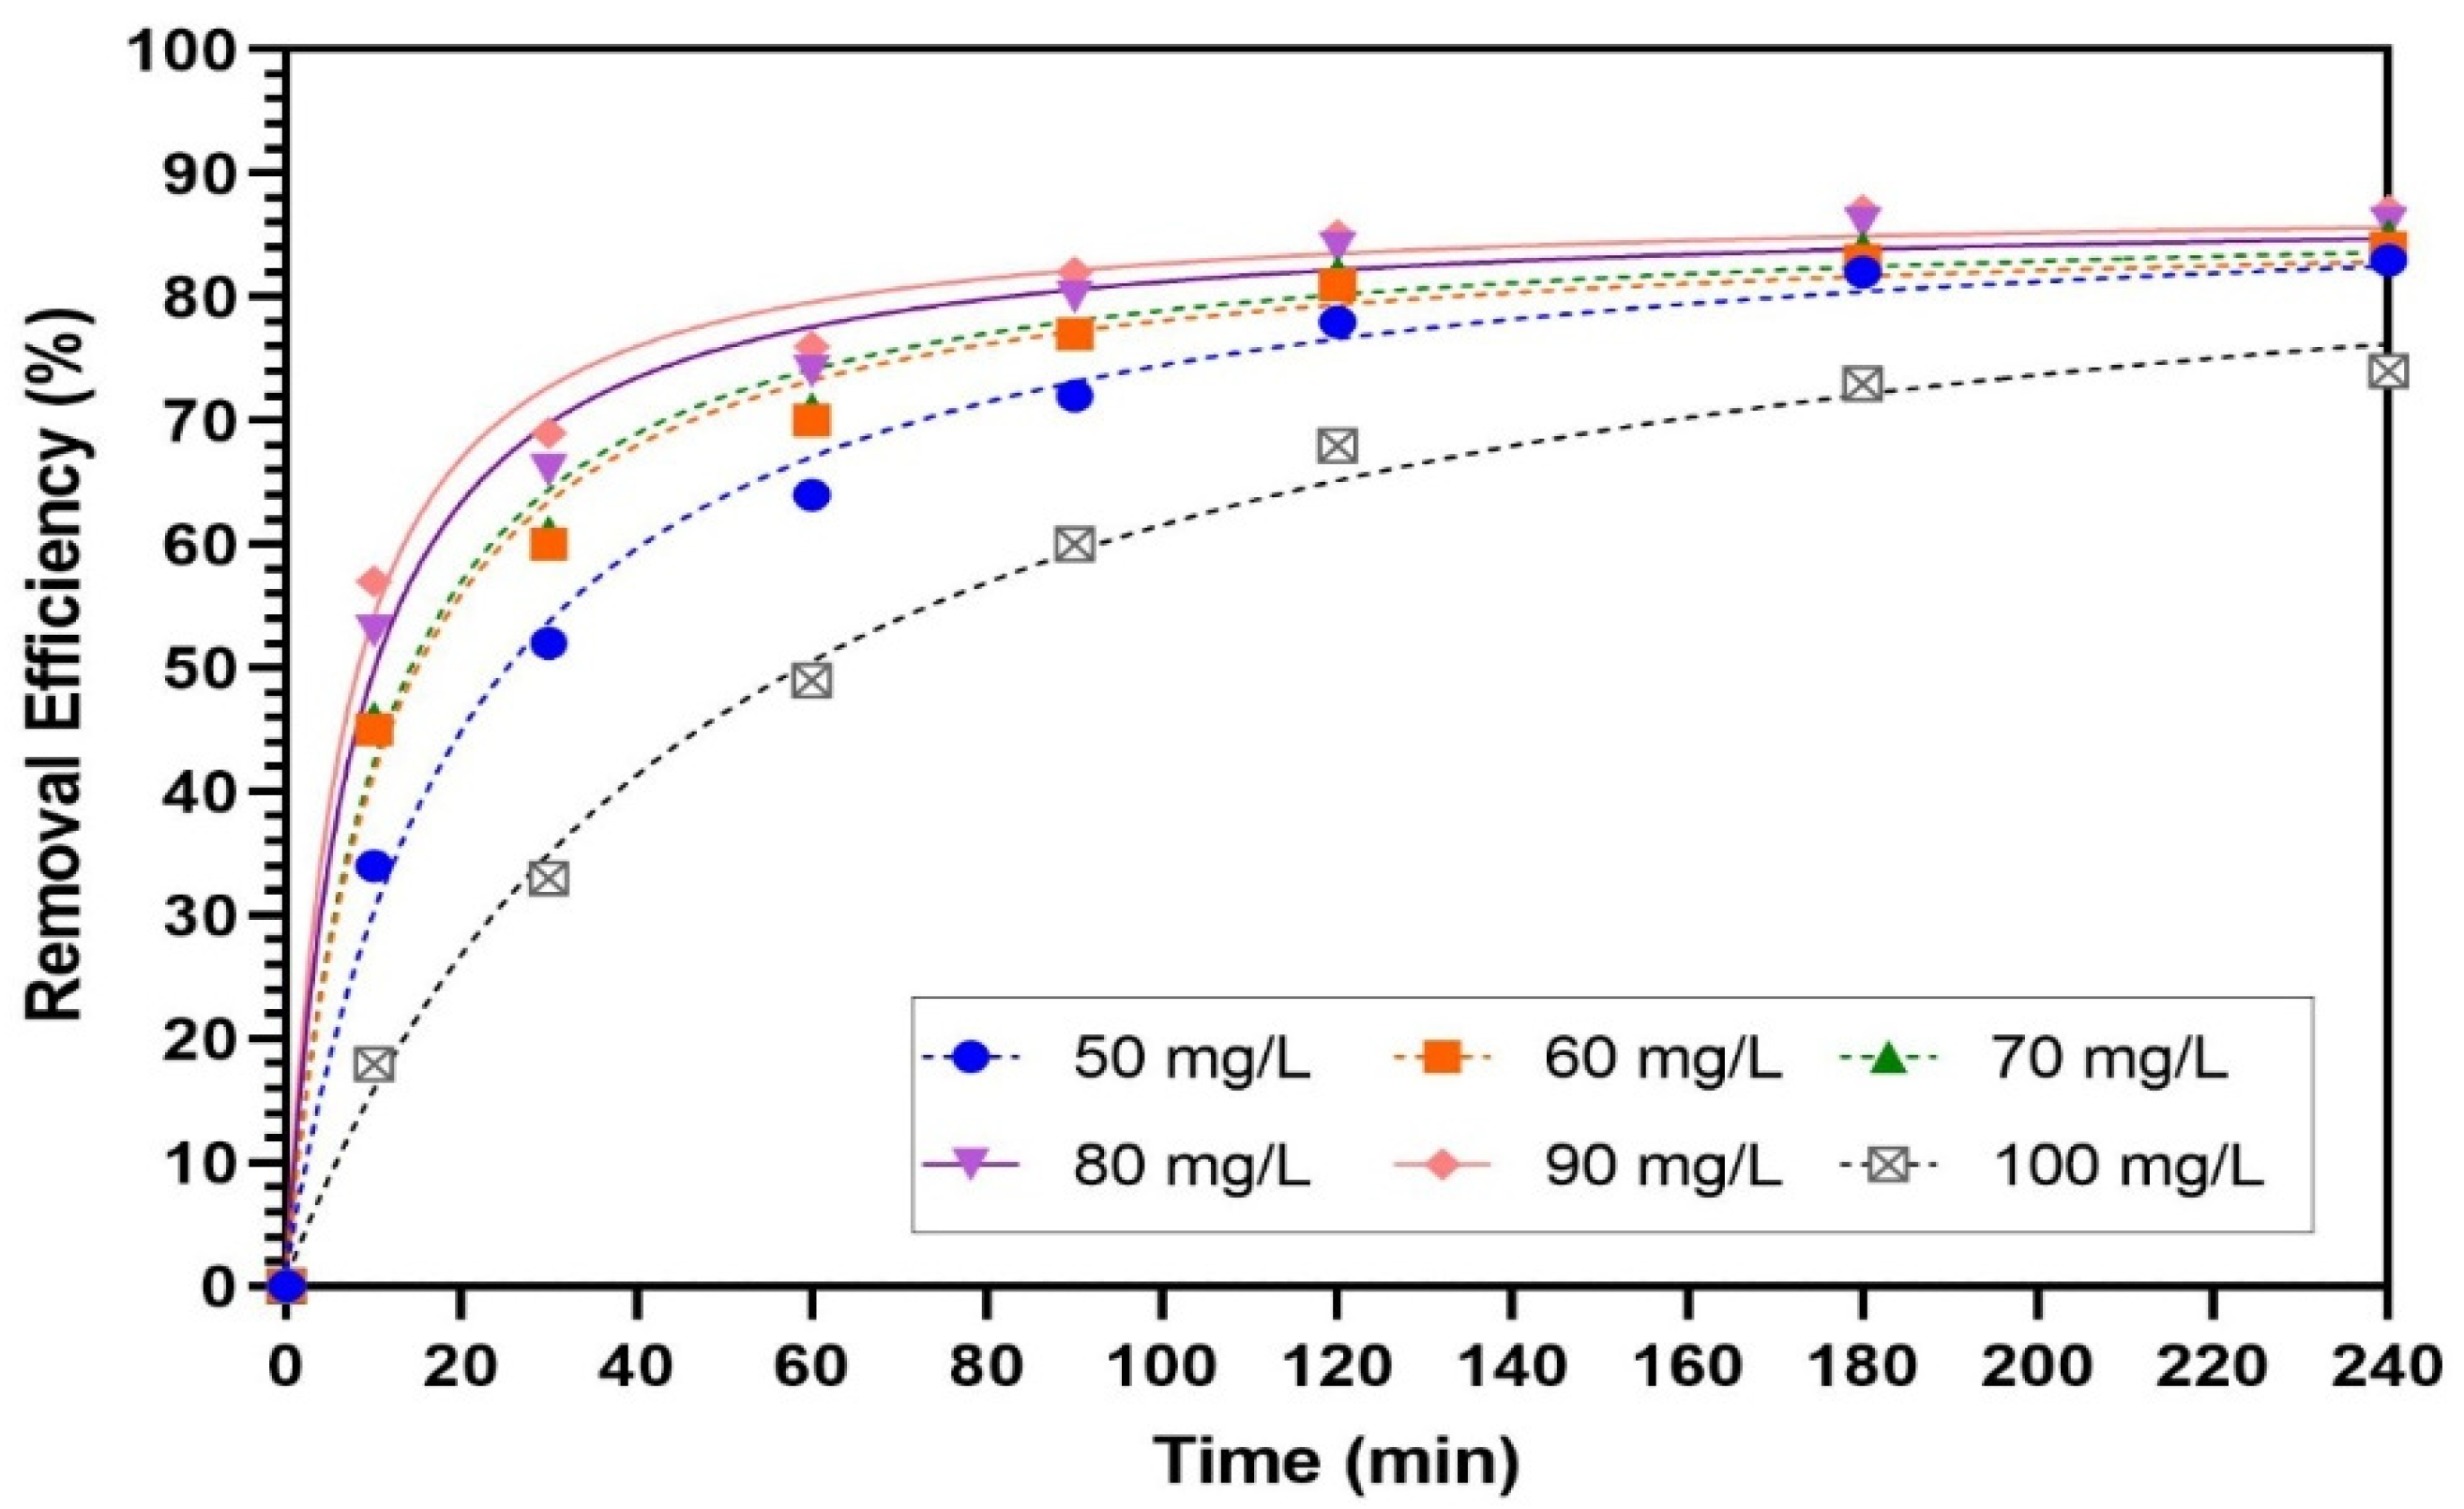
As Figure 6 shows, the removal rate of TC was very high in the first 20 min and then decreased, reaching an equilibrium at approximately 120 min. This pattern is common in an adsorption process, as vacant adsorption sites are abundant at the start of the process and become occupied over time. It is also consistent with TC adsorption patterns observed by He et al. [23] and Dai et al. [33].

3.5. Adsorption Isotherms

Table 4 shows that the Langmuir isotherm does not represent the data well. For the Freundlich isotherm, the coefficient of determination R2 is 0.9059, which indicates that the Freundlich model fits the adsorption data well and that the surface is heterogeneous. In addition, 0.1 < 1/n < 0.5 indicates that TC was readily adsorbed onto the biochar surface [22]. The maximum adsorption capacity reached was 14.23 mg/g. The R2 of 0.878 for the Temkin model is the lowest R2 for all of the isotherms considered, which suggests that it does not describe the experimental data well either. The Dubinin–Radushkevich model describes TC adsorption onto biochar well, as indicated by the R2 of 0.9043 for ln qe versus ε2. The calculated value of Ea was 0.2092 (kJ/mol), which means that a free energy change of 0.2092 kJ/mol is needed to adsorb one mole of TC onto the biochar surface. A physical adsorption mechanism is implied by the value of Ea being less than 8 kJ/mol [14,35]. TC structures have aromatic rings that are adsorbed onto biochar by the π–π EDA interaction as multi-layer adsorption [6].

3.6. Adsorption Kinetics

Table 5 shows the kinetic parameter values for PFO, PSO, and the Elovich equations and the coefficient of determination, R2. The R2 values are high for all models and highest in the case of PSO. The difference between the calculated qe values and the experimental qe values was high in the case of PFO, indicating that PFO does not represent the data well, whereas, for PSO, this difference was less significant, and PSO provides a good fit to the data, as does the Elovich equation.

3.7. Adsorption Mechanism

3.7.1. Intraparticle Diffusion Model

As Figure 7 shows, TC adsorption onto biochar is a two-step mechanism. The first step is the liquid film diffusion process, and the second step is the internal diffusion process. The fact that the plotted lines do not pass the origin indicates that intraparticle diffusion is not the only controlling step [22,29].

3.7.2. Boyd Model

Boyd’s kinetic model was used to determine which step in the adsorption process was the slowest. As Figure 8 shows, the plots of Bt versus time for all initial TC concentrations are linear but do not pass through the origin, indicating that TC adsorption onto biochar is mainly due to film diffusion, which makes it the rate-limiting step [22,28].

3.8. Adsorption Thermodynamics Studies

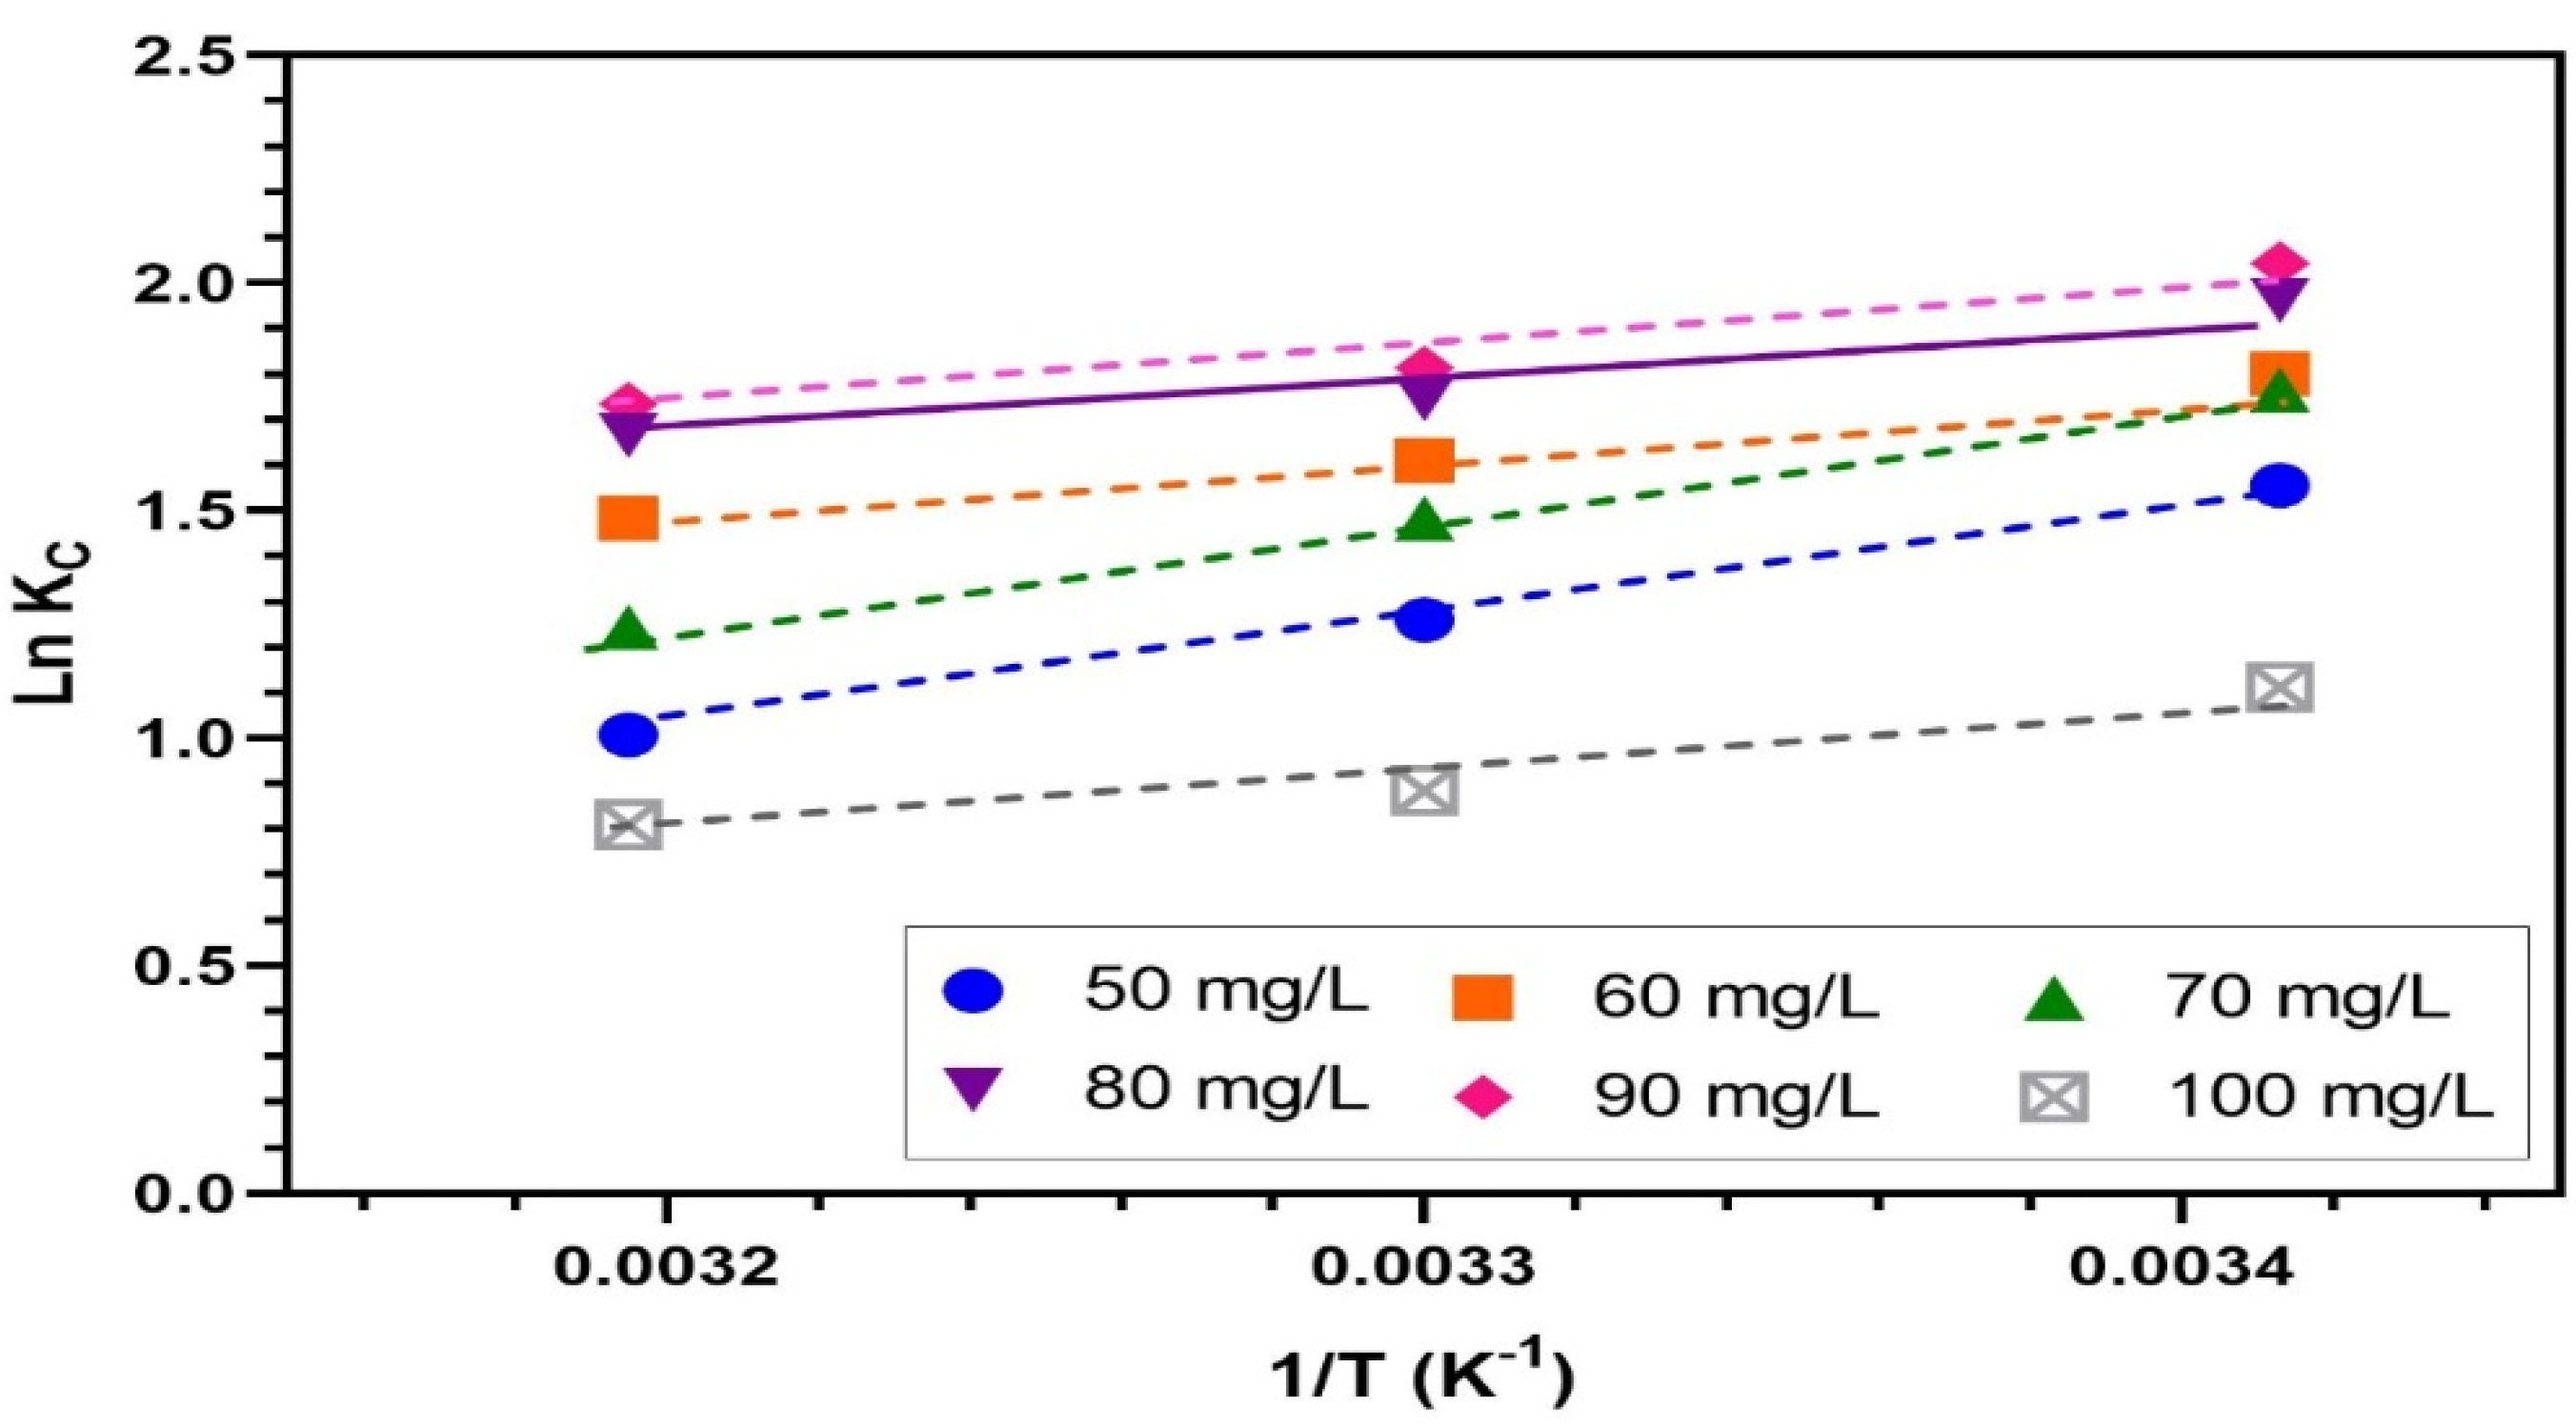
As Figure 9 shows, the van’t Hoff plots of ln (Kc) vs. 1/T show linear correlations for all adsorbate concentrations (50, 60, 70, 80, and 90 mg/L), with high values of R2 > 0.90. The estimated values of the thermodynamic parameters (ΔG°, ΔH°, and ΔS°) based on the experimental results are shown in Table 6. The fact that ΔG° has a negative charge indicates that the TC adsorption onto the biochar was both spontaneous and possible. The exothermic adsorption of TC is indicated by the negative value of ΔH°. The reduction in randomness at the liquid–solid interface during the adsorption process is demonstrated by the negative ΔS° charge. Adsorption enthalpy can be used to classify the adsorption process as either chemical (40–800 kJ/mol) or physical (5–40 kJ/mol). TC may adsorb onto biochar physically, according to the ΔH° value shown in Table 6. TC adsorption onto various carbon-based adsorbents, including activated carbon from tomato industrial processing waste [5], graphene oxide [14], and magnetic porous carbon from waste hydrochar [36], has been found to be physical.

3.9. Desorption

The biochar’s potential for useful applications was established by evaluating its reusability. HCl was used at four different concentrations (0.2, 0.4, 0.6, and 0.8 M) as a desorbing agent. The desorption percentage increased with increasing HCl concentration, as shown in Table 7. The desorption efficiency at 0.8 M HCL reached 87.24% for a TC concentration of 50 mg/L, 88.04% for 60 mg/L, 88.51% for 70 mg/L, 92.95% for 80 mg/L, 91.26% for 90 mg/L, and 91.71% for 100 mg/L. The successful desorption of TC from biochar indicates its high potential for being used several times, which would reduce the cost of the adsorption process.

3.10. Real Wastewater Experiments

To assess the applicability of biochar for TC adsorption from real wastewater, wastewater was collected from the effluent channel of the final settling tanks of Zenein WWTP, Giza, Egypt. The wastewater characteristics were previously indicated in Table 2. TC was added to the wastewater. Biochar at a dose of 3.5 g/50 mL removed TC from the real wastewater at efficiencies of 95, 93, and 91% for initial TC concentrations of 70, 80, and 90 mg/L, respectively. These removal efficiencies are higher than those obtained for synthetic wastewater, which may be because of the presence of dissolved solids in the water that act as “salting out agents” [37].

3.11. Column Test Experiment

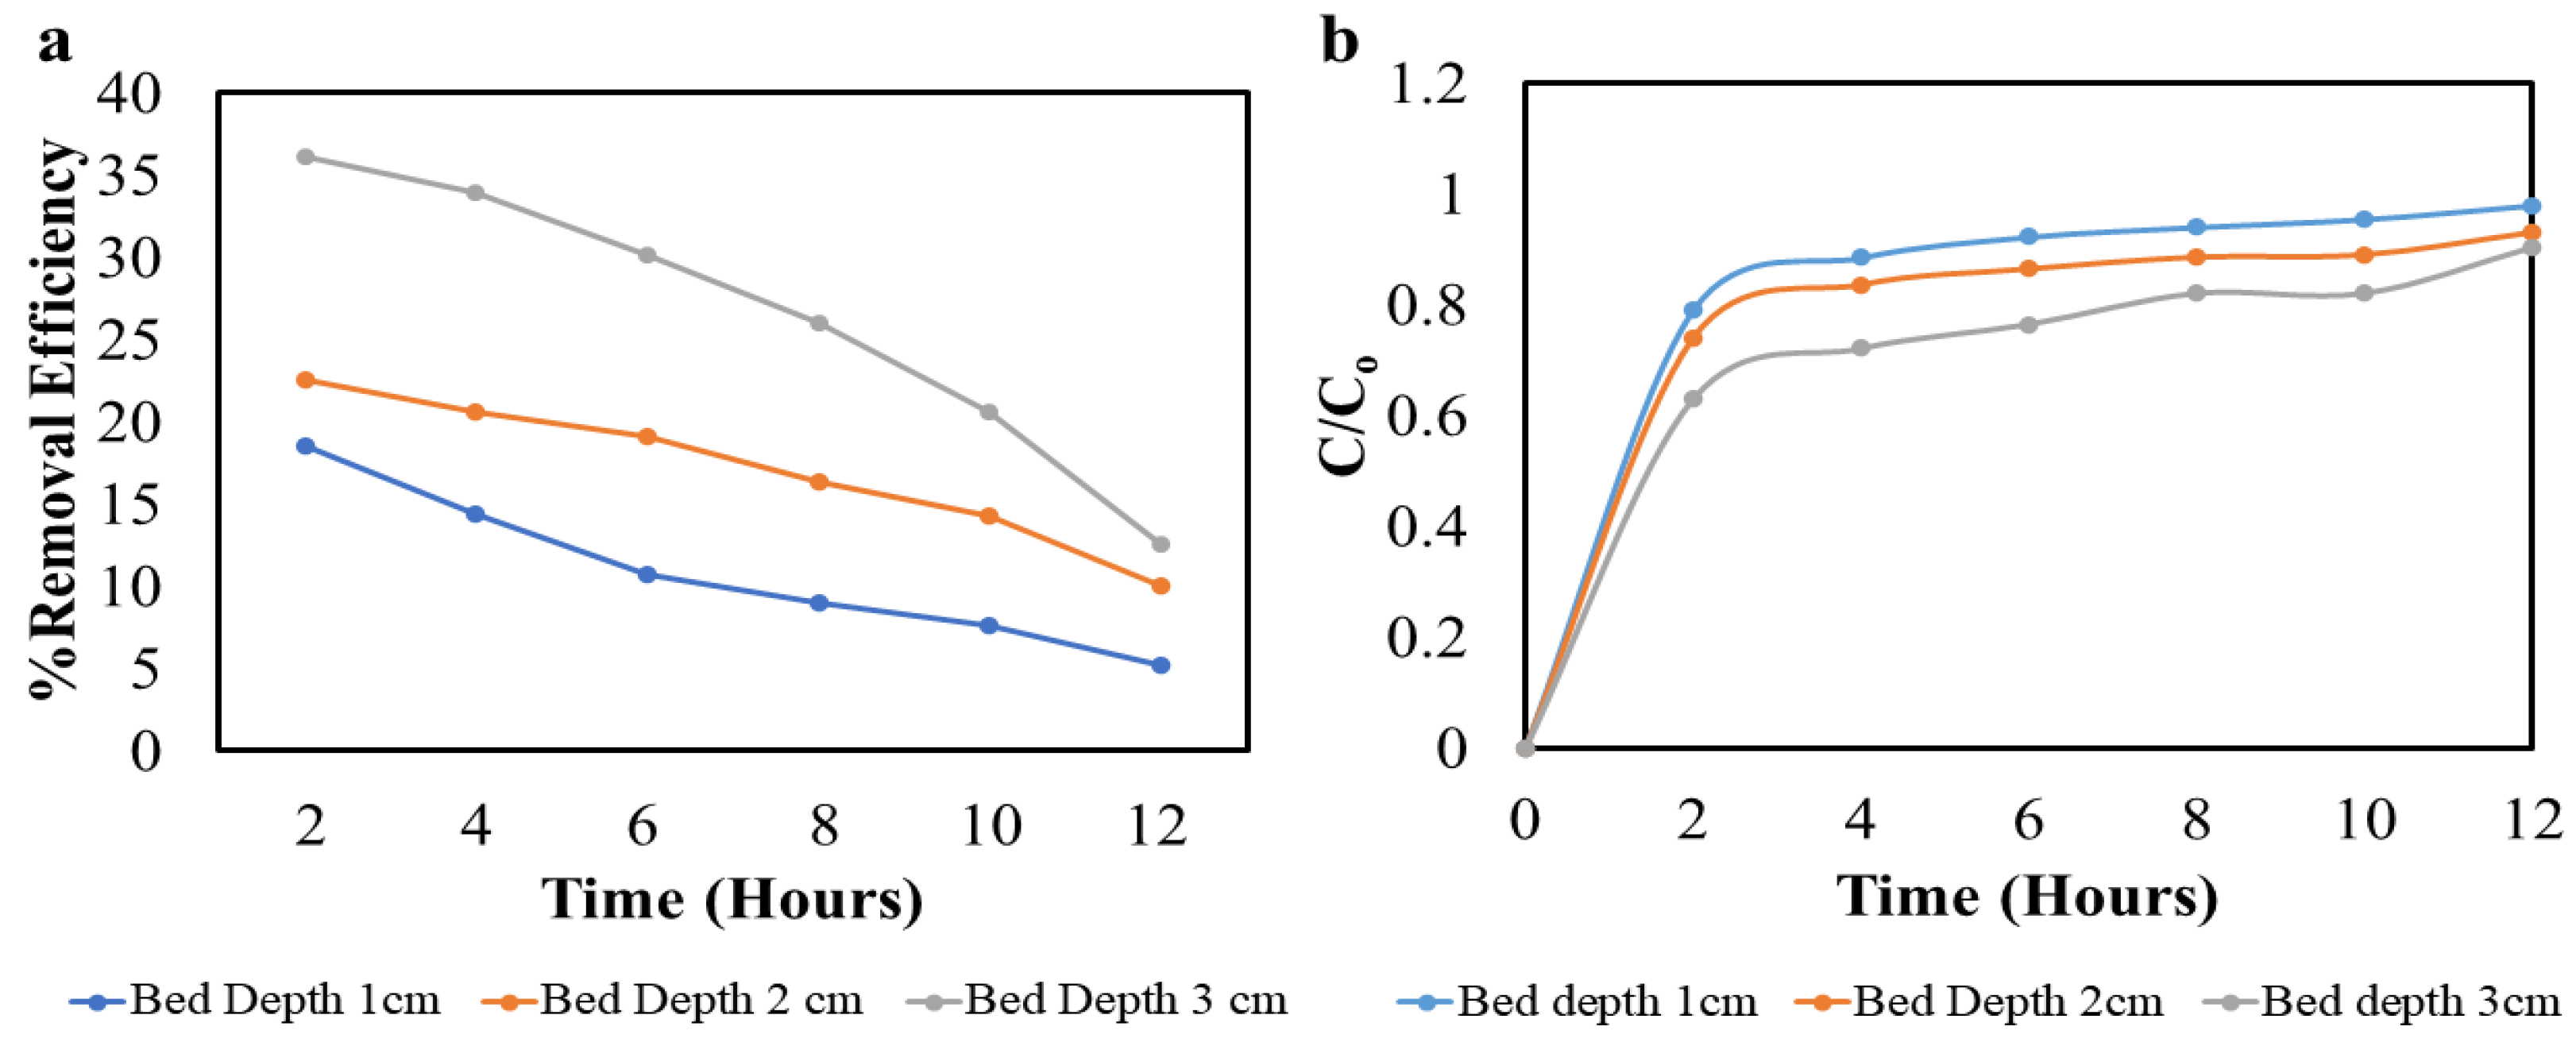
The solution was introduced at the top of the column and traveled for a certain time that depended on the column’s height. When the adsorbate is detected in the effluent at the column’s end, this is known as a breakthrough. At a height of 1 cm, the solution took 40 min to reach the exit; at 2 cm, it took 65 min; and at 3 cm, it took 90 min. Figure 10a shows the relation between removal efficiency and time for biochar bed depths of 1, 2, and 3 cm, while Figure 10b shows the breakthrough curve. The removal efficiency was high during the first 2 h and then decreased with time. This can be explained by the decreasing availability of adsorption sites on the fresh biochar’s surface. As time passes, TC fills the available adsorption sites, and the removal efficiency decreases until the biochar surface is saturated, as indicated by the effluent’s concentration equaling the influent’s concentration. It was also observed that the removal efficiency increased with increasing bed depth. As shown in Figure 10a, the removal efficiencies for the first 2 h were 19%, 23%, and 36% for bed depths of 1, 2, and 3 cm, respectively. This is attributable to the increase in the surface area available for adsorption on the surface of the biochar.

3.12. Cost Analysis

Biochar is sold in Egypt in a 21 kg pack for USD 3.7, i.e., USD 0.18/kg. The optimal dose of biochar was found to be 3.5 g/50 mL, i.e., 70 g/L. Thus, the expected biochar cost to treat 1 m3 of wastewater would be USD 12.6. For commercial activated carbon, reported doses range between 0.2 and 20 g/L, at a cost of USD 45.71/kg, which means that the cost to treat 1 m3 of wastewater is USD 9.1 to 914.2 [9]. This analysis shows that although the biochar dose required for TC removal is high compared to that of commercial activated carbon, its cost is competitive.

3.13. Research Findings in Comparison with the Literature

Table 8 and Table 9 present comparisons of this study’s findings with published research work on the adsorption of TC in batch-mode and continuous-mode operation, respectively. The results of the comparison indicate that this study’s findings are similar to those obtained in other studies, even for doses similar to those of other adsorbents of similar nature.

4. Conclusions

TC is a commonly used antibiotic found in wastewater effluents. Its removal was studied using biochar, a low-cost, sustainable adsorbent derived from citrus tree waste with a surface area of 364.903 m2/gm. TC was removed at an efficiency of 87% in batch-mode operation at pH = 4, a biochar dose = 3.5 g/50 mL, a temperature of 20 °C, and an initial TC concentration of 90 mg/L. The Freundlich isotherm best described the equilibrium conditions (R2 = 0.905). The kinetic model that best described the data was PSO, and thermodynamic analysis indicated that the adsorption process was exothermic and spontaneous. The study results suggest that TC adsorption onto biochar is a physical adsorption process with possible π–π EDA interaction. For real wastewater containing TC, the removal efficiency reached 95% under the previously mentioned operating conditions. In the continuous-flow operation mode studied in a fixed column, the removal efficiency reached 36% after 2 h at a 3 cm bed height. A cost analysis showed that the cost of biochar required to remove TC from 1 m3 of wastewater was approximately USD 12.6. The research findings for real wastewater treatment are promising, but more research is needed to achieve better removal efficiency for continuous flow.

Author Contributions

B.M.R.: investigation, software, resources, data curation. M.M.G.: conceptualization, methodology, supervision. M.E.M.: conceptualization, methodology, data curation, validation, formal analysis, writing—original draft preparation, visualization. All authors have read and agreed to the published version of the manuscript.

Funding

This research received no external funding.

Institutional Review Board Statement

Not applicable.

Informed Consent Statement

Not applicable.

Data Availability Statement

Not applicable.

Conflicts of Interest

The authors declare no conflict of interest.

References

  1. Guo, Y.; Qi, P.S.; Liu, Y.Z. A Review on Advanced Treatment of Pharmaceutical Wastewater. IOP Conf. Ser. Earth Environ. Sci. 2017, 63, 012025. [Google Scholar] [CrossRef]
  2. Akter, S.; Islam, M.S.; Kabir, M.H.; Shaikh, M.A.A.; Gafur, M.A. UV/TiO2 photodegradation of metronidazole, ciprofloxacin and sulfamethoxazole in aqueous solution: An optimization and kinetic study. Arab. J. Chem. 2022, 15, 103900. [Google Scholar] [CrossRef]
  3. Dan, A.; Zhang, X.; Dai, Y.; Chen, C.; Yang, Y. Occurrence and removal of quinolone, tetracycline, and macrolide antibiotics from urban wastewater in constructed wetlands. J. Clean. Prod. 2020, 252, 119677. [Google Scholar]
  4. Priya, S.S.; Radha, K. A Review on the Adsorption Studies of Tetracycline onto Various Types of Adsorbents. Chem. Eng. Commun. 2017, 204, 821–839. [Google Scholar] [CrossRef]
  5. Sayğili, H.; Güzel, F. Effective removal of tetracycline from aqueous solution using activated carbon prepared from tomato (Lycopersicon esculentum Mill.) industrial processing waste. Ecotoxicol. Environ. Saf. 2016, 131, 22–29. [Google Scholar] [CrossRef]
  6. Bao, J.; Zhu, Y.; Yuan, S.; Wang, F.; Tang, H.; Bao, Z.; Zhou, H.; Chen, Y. Adsorption of Tetracycline with Reduced Graphene Oxide Decorated with MnFe2O4 Nanoparticles. Nanoscale Res. Lett. 2018, 13, 396. [Google Scholar] [CrossRef]
  7. Ahmed, M.J. Adsorption of quinolone, tetracycline, and penicillin antibiotics from aqueous solution using activated carbons: Review. Environ. Toxicol. Pharmacol. 2017, 50, 1–10. [Google Scholar] [CrossRef]
  8. Cheng, N.; Wang, B.; Wu, P.; Lee, X.; Xing, Y.; Chen, M.; Gao, B. Adsorption of emerging contaminants from water and wastewater by modified biochar: A review. Environ. Pollut. 2021, 273, 116448. [Google Scholar] [CrossRef] [PubMed]
  9. Cheng, D.; Ngo, H.H.; Guo, W.; Chang, S.W.; Nguyen, D.D.; Zhang, X.; Varjani, S.; Liu, Y. Feasibility study on a new pomelo peel derived biochar for tetracycline antibiotics removal in swine wastewater. Sci. Total. Environ. 2020, 720, 137662. [Google Scholar] [CrossRef] [PubMed]
  10. Mohammed, A.A.; Kareem, S.L. Adsorption of tetracycline from wastewater by using Pistachio shell coated with ZnO nanoparticles: Equilibrium, kinetic and isotherm studies. Alexandria Eng. J. 2019, 58, 917–928. [Google Scholar] [CrossRef]
  11. Islam, S.; McPhedran, K.N.; Messele, S.A.; Liu, Y.; El-Din, M.G. Isotherm and kinetic studies on adsorption of oil sands process-affected water organic compounds using granular activated carbon. Chemosphere 2018, 202, 716–725. [Google Scholar] [CrossRef] [PubMed]
  12. Yu, F.; Ma, J.; Han, S. Adsorption of tetracycline from aqueous solutions onto multi-walled carbon nanotubes with different oxygen contents. Sci. Rep. 2014, 4, 5326. [Google Scholar] [CrossRef] [PubMed]
  13. Gao, Y.; Li, Y.; Zhang, L.; Huang, H.; Hu, J.; Shah, S.M.; Su, X. Adsorption and removal of tetracycline antibiotics from aqueous solution by graphene oxide. J. Colloid Interface Sci. 2012, 368, 540–546. [Google Scholar] [CrossRef]
  14. Ghadim, E.E.; Manouchehri, F.; Soleimani, G.; Hosseini, H.; Kimiagar, S.; Nafisi, S. Adsorption properties of tetracycline onto graphene oxide: Equilibrium, kinetic and thermodynamic studies. PLoS ONE 2013, 8, e79254. [Google Scholar] [CrossRef] [PubMed]
  15. Li, G.; Li, H.; Li, Y.; Chen, J.; Zhu, M.; Zhang, X. Adsorption of tetracycline by activated carbon fibre. In Proceedings of the 2010 4th International Conference on Bioinformatics and Biomedical Engineering, Chengdu, China, 18–20 June 2010; pp. 1–4. [Google Scholar]
  16. Khalaf, S.M.; Al-Mahmoud, S.M. Adsorption of tetracycline antibiotic from aqueous solutions using natural Iraqi bentonite. Egypt. J. Chem. 2021, 64, 5511–5519. [Google Scholar]
  17. Zhou, Q.; Li, Z.; Shuang, C.; Li, A.; Zhang, M.; Wang, M. Efficient removal of tetracycline by reusable magnetic microspheres with a high surface area. Chem. Eng. J. 2012, 210, 350–356. [Google Scholar] [CrossRef]
  18. Zhu, H.; Chen, T.; Liu, J.; Li, D. Adsorption of tetracycline antibiotics from an aqueous solution onto graphene oxide/calcium alginate composite fibers. RSC Adv. 2018, 8, 2616–2621. [Google Scholar] [CrossRef]
  19. Tomczyk, A.; Sokołowska, Z.; Boguta, P. Biochar physicochemical properties: Pyrolysis temperature and feedstock kind effects. Rev. Environ. Sci. Bio/Technol. 2020, 19, 191–215. [Google Scholar] [CrossRef]
  20. Roy, H.; Sarkar, D.; Pervez, N.; Paul, S.; Cai, Y.; Naddeo, V.; Firoz, S.H.; Islam, S. Synthesis, Characterization and Performance Evaluation of Burmese Grape (Baccaurea ramiflora) Seed Biochar for Sustainable Wastewater Treatment. Water 2023, 15, 394. [Google Scholar] [CrossRef]
  21. Roy, H.; Prantika, T.R.; Riyad, M.H.; Paul, S.; Islam, M.S. Synthesis, characterizations, and RSM analysis of Citrus macroptera peel derived biochar for textile dye treatment. S. Afr. J. Chem. Eng. 2022, 41, 129–139. [Google Scholar] [CrossRef]
  22. Zhang, P.; Li, Y.; Cao, Y.; Han, L. Characteristics of tetracycline adsorption by cow manure biochar prepared at different pyrolysis temperatures. Bioresour. Technol. 2019, 285, 121348. [Google Scholar] [CrossRef] [PubMed]
  23. He, L.; Chen, Y.; Li, Y.; Sun, F.; Zhao, Y.; Yang, S. Adsorption of Congo red and tetracycline onto water treatment sludge biochar: Characterisation, kinetic, equilibrium and thermodynamic study. Water Sci. Technol. 2022, 85, 1936–1951. [Google Scholar] [CrossRef] [PubMed]
  24. Hao, D.; Chen, Y.; Zhang, Y.; You, N. Nanocomposites of zero-valent iron@biochar derived from agricultural wastes for adsorptive removal of tetracyclines. Chemosphere 2021, 284, 131342. [Google Scholar] [CrossRef] [PubMed]
  25. Hoslett, J.; Ghazal, H.; Katsou, E.; Jouhara, H. The removal of tetracycline from water using biochar produced from agricultural discarded material. Sci. Total. Environ. 2020, 751, 141755. [Google Scholar] [CrossRef] [PubMed]
  26. Jang, H.M.; Kan, E. Engineered biochar from agricultural waste for removal of tetracycline in water. Bioresour. Technol. 2019, 284, 437–447. [Google Scholar] [CrossRef]
  27. Kumar, P.S.; Ramalingam, S.; Kirupha, S.D.; Murugesan, A.; Vidhyadevi, T.; Sivanesan, S. Adsorption behavior of nickel(II) onto cashew nut shell: Equilibrium, thermodynamics, kinetics, mechanism and process design. Chem. Eng. J. 2011, 167, 122–131. [Google Scholar] [CrossRef]
  28. Safwat, S.M.; Matta, M.E. Adsorption of urea onto granular activated alumina: A comparative study with granular activated carbon. J. Dispers. Sci. Technol. 2018, 39, 1699–1709. [Google Scholar] [CrossRef]
  29. Safwat, S.M.; Medhat, M.; Abdel-Halim, H. Phenol adsorption onto kaolin and fuller’s earth: A comparative study with bentonite. Desalination Water Treat. 2019, 155, 197–206. [Google Scholar] [CrossRef]
  30. Safwat, S.M.; Ali, A.; Matta, M.E. Adsorption of Copper using Fuller’s Earth: Kinetics, Equilibrium and Thermodynamics. J. Eng. Appl. Sci. 2020, 67, 1729–1746. [Google Scholar]
  31. Gupta, V.K.; Carrott, P.J.M.; Ribeiro Carrott, M.M.L.; Suhas. Low-Cost Adsorbents: Growing Approach to Wastewater Treatment—A Review. Crit. Rev. Environ. Sci. Technol. 2009, 39, 783–842. [Google Scholar] [CrossRef]
  32. Kwak, J.H.; Islam, M.S.; Wang, S.; Messele, S.A.; Naeth, M.A.; El-Din, M.G.; Chang, S.X. Biochar properties and lead(II) adsorption capacity depend on feedstock type, pyrolysis temperature, and steam activation. Chemosphere 2019, 231, 393–404. [Google Scholar] [CrossRef] [PubMed]
  33. Dai, J.; Meng, X.; Zhang, Y.; Huang, Y. Effects of modification and magnetization of rice straw derived biochar on adsorption of tetracycline from water. Bioresour. Technol. 2020, 311, 123455. [Google Scholar] [CrossRef] [PubMed]
  34. Wang, H.; Fang, C.; Wang, Q.; Chu, Y.; Song, Y.; Chen, Y.; Xue, X. Sorption of tetracycline on biochar derived from rice straw and swine manure. RSC Adv. 2018, 8, 16260–16268. [Google Scholar] [CrossRef] [PubMed]
  35. Bonilla-Petriciolet, A.; Mendoza-Castillo, D.I.; Reynel-Ávila, H.E. Adsorption Processes for Water; Springer International Publishing: Berlin/Heidelberg, Germany, 2017. [Google Scholar]
  36. Zhu, X.; Liu, Y.; Qian, F.; Zhou, C.; Zhang, S.; Chen, J. Preparation of magnetic porous carbon from waste hydrochar by simultaneous activation and magnetization for tetracycline removal. Bioresour. Technol. 2014, 154, 209–214. [Google Scholar] [CrossRef]
  37. Adak, A.; Bandyopadhyay, M.; Pal, A. Adsorption of Anionic Surfactant on Alumina and Reuse of the Surfactant-Modified Alumina for the Removal of Crystal Violet from Aquatic Environment. J. Environ. Sci. Health Part A 2005, 40, 167–182. [Google Scholar] [CrossRef]
  38. Korkut, F.; Saloglu, D. Synthesis, characterization, and tetracycline adsorption behavior of activated carbon dopped alginate beads: Isotherms, kinetics, thermodynamic, and adsorption mechanism. Desalin. Water Treat. 2020, 206, 315–330. [Google Scholar] [CrossRef]
  39. Marzbali, M.H.; Esmaieli, M. Fixed bed adsorption of tetracycline on a mesoporous activated carbon: Experimental study and neuro-fuzzy modeling. J. Appl. Res. Technol. 2017, 15, 454–463. [Google Scholar] [CrossRef]
  40. Wang, J.; Liu, X.; Yang, M.; Han, H.; Zhang, S.; Ouyang, G.; Han, R. Removal of tetracycline using modified wheat straw from solution in batch and column modes. J. Mol. Liq. 2021, 338, 116698. [Google Scholar] [CrossRef]
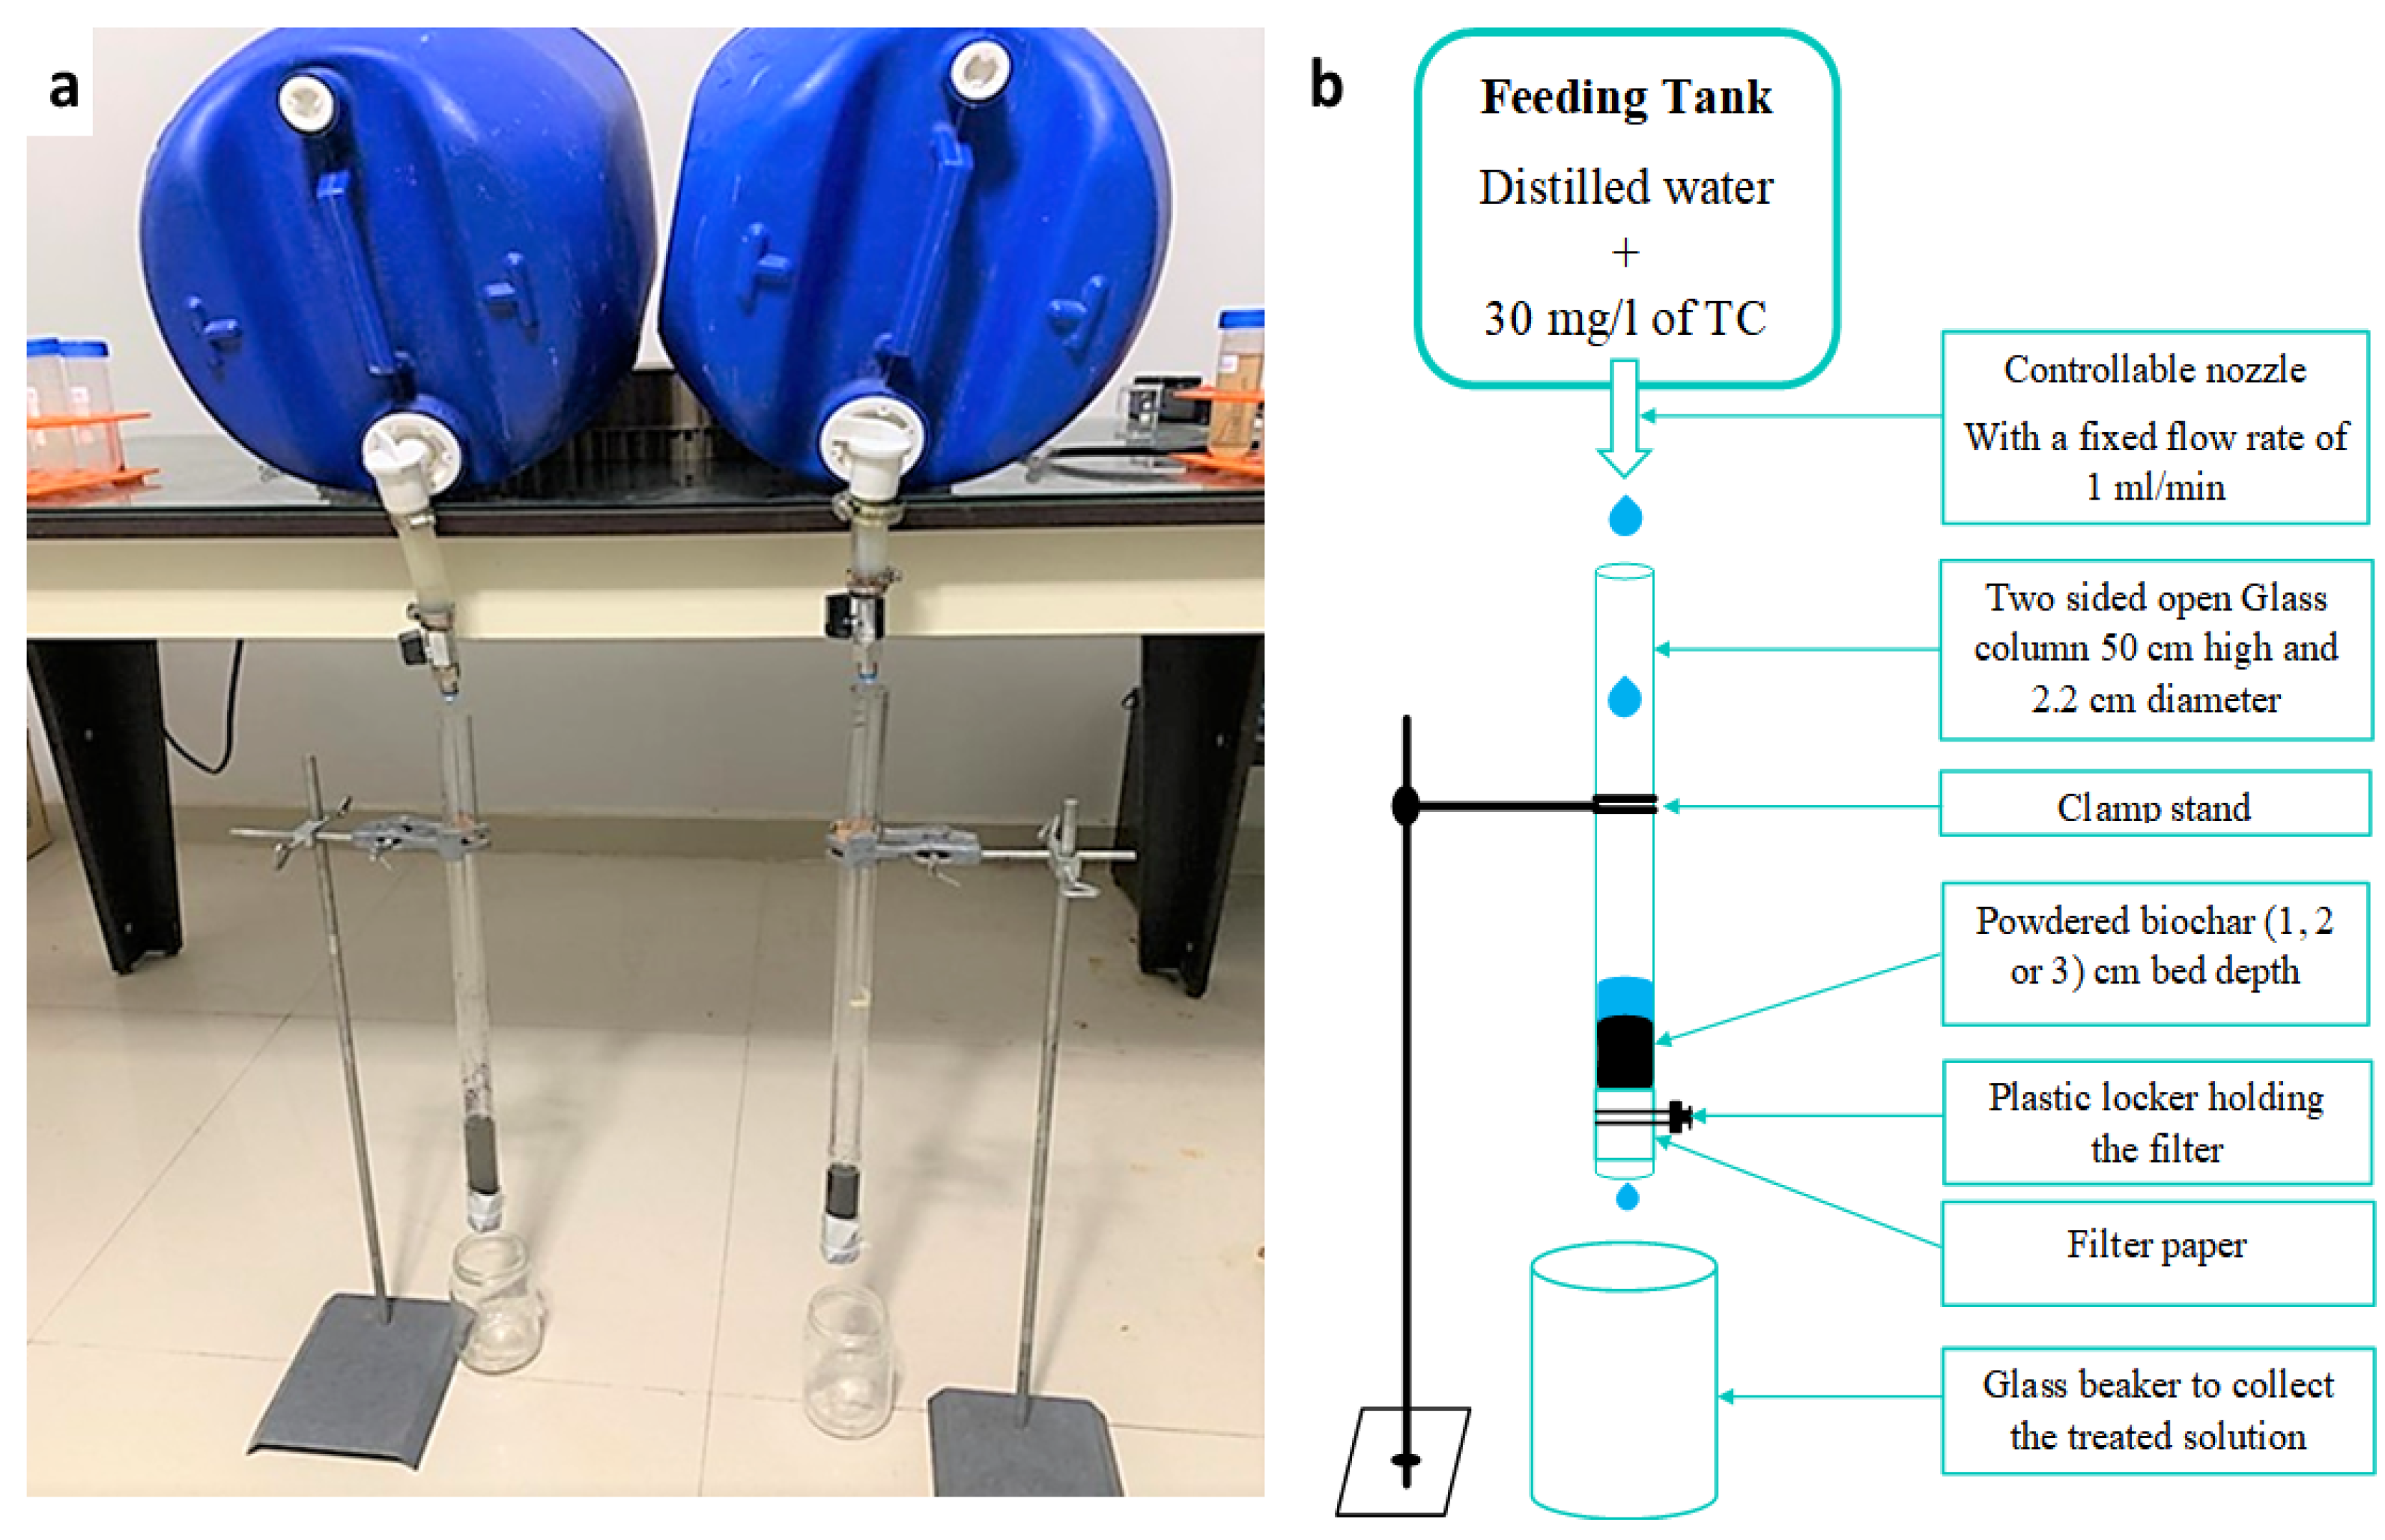
Figure 1. Fixed-bed column setup: (a) photograph of the setup, (b) schematic diagram of the process.
Sustainability 15 08249 g001
Figure 2. SEM images of biochar (a) before adsorption and (b) after adsorption.
Sustainability 15 08249 g002
Figure 3. FTIR spectra for biochar before and after TC adsorption.
Sustainability 15 08249 g003
Figure 4. Effect of solution’s pH on TC adsorption at different biochar doses.
Sustainability 15 08249 g004
Figure 5. Effect of initial TC concentration at pH = 4, biochar dose = 3.5 g/mL, and T = 20 ± 3 °C.
Sustainability 15 08249 g005
Figure 6. Effect of reaction time on TC adsorption at pH = 4, biochar dose = 3.5 g/mL, and T = 20 ± 3 °C.
Sustainability 15 08249 g006
Figure 7. Intraparticle model at different initial TC concentrations for biochar dose = 3.5 g/mL and T = 20 ± 3 °C.
Sustainability 15 08249 g007
Figure 8. Boyd plot at different TC initial concentrations, biochar dose = 3.5 g/mL and T = 20 ± 3 °C.
Sustainability 15 08249 g008
Figure 9. Van’t Hoff ln(KC) versus 1/T plots at different temperatures.
Sustainability 15 08249 g009
Figure 10. (a) TC removal over time in fixed columns for various bed depths (b) breakthrough curve.
Sustainability 15 08249 g010
Table 1. Biochar composition and characteristics.
ParameterValue
pH8.5
EC (DS/M)2.52
N (%)1.5
P (%)7
K (%)2
Organic C (%)70
O/C0.6
H/C0.36
Table 2. Real wastewater characteristics.
ParameterValue
pH7.45
Total suspended solids (TSS) (mg/L)15.5
Volatile suspended solids (VSS) (mg/L)11.3
Biochemical oxygen demand (BOD5) (mg/L)17.3
Table 3. Oxide contents (%) of adsorbent determined by X-ray fluorescence.
CaOCoOClFeOK2OMnOMoO3Nb2O5P2O5SO3SrOSiO2TiO2ZnOZrO2Sum
50.990.087.546.7214.710.190.380.310.944.200.439.010.920.750.1897.35
Table 4. Isotherm parameters for TC adsorption at T = 20 ± 3 °C, t = 240 min, pH = 4, and biochar dosage of 3.5 g/50 mL).
FreundlichLangmuirTemkinDubinin–Radushkevich
1/n (g/L)0.35Qmax (mg/g)−0.3263B1 (mg/L)1.6949qDR (mg/g)11.4146
Kf (mg/g)(mg/L)n0.001038245KL (L/mg)−0.0678KT (L/mg)0.1512KDR (mg2/J2)−2.3912 × 10−6
R20.9059R20.9245b (J/mol)1430.1327Ea (kJ/mol)0.2093
R20.8788R20.9034
Table 5. Kinetic parameters for the adsorption of TC onto biochar (T = 20 ± 3° C, pH = 4, and biochar dosage of 3.5 mg/50 mL).
Kinetic ModelParameterInitial Concentration of TC (mg/L)
5060708090100
PFOK1 (min−1)0.01930.01980.01890.02090.01950.0215
qe (exp)(mg/g)0.47850.57920.68600.79660.91000.8537
qe (calc)(mg/g)0.34800.31150.35940.37720.38620.9481
R20.99780.9850.99250.99540.99600.9897
PSOK2 (g/mg/min)0.09040.12470.10830.12030.11710.0185
qe (exp)(mg/g)0.47850.57920.68600.79660.91000.8537
qe (calc)(mg/g)0.51920.60930.71750.82760.93821.0750
R20.99770.99850.99850.99880.99890.9924
Elovichα (g/mg/min)0.07070.24600.33521.026591.963800.0480
β (g/mg)10.245910.52639.19969.29378.82614.3122
R20.99710.99150.99380.99370.99460.9806
Table 6. Thermodynamic parameters of TC adsorption by biochar at different temperatures.
T (°C)Initial TC Concentration (mg/L)
5060708090
∆H° (kJ/mol) −20.45−19.47−11.88−11.15−11.61
∆S° (J/mol/K) −57.19−52.11−25.97−22.24−23.19
∆G° (kJ/mol)20−3.70−4.20−4.27−4.63−4.82
30−3.13−3.68−4.01−4.41−4.59
40−2.55−3.16−3.75−4.19−4.35
Table 7. Desorption of TC from biochar using HCl.
TC Initial Concentration
(mg/L)
Average Removal Efficiency (%)Percentage of Desorption (%) vs. HCl Concentrations
0.2 M0.4 M0.6 M0.8 M
5082%80.50%83.27%84.62%87.24%
6083%84.58%85.48%86.81%88.04%
7084%83.99%85.10%87.18%88.51%
8086%88.57%91.31%91.73%92.95%
9087%88.27%88.83%89.52%91.26%
10074%88.31%89.20%91.17%91.71%
Table 8. Comparison of study findings and published research on optimal conditions for TC adsorption on biochar in batch mode.
Adsorbent UsedDose
(g/L)
pHT °CTC Initial Conc.
(mg/L)
Surf. Area
(m2/g)
IsothermKinetic ModelThermodynamicsRemoval Efficiency
(%)
Ref.
Pistachio shell Coated with ZnO Nanoparticles8042570-FreundlichPSOEXO.84.87[10]
Natural Iraqi Bentonite0.26–720–4020-Langmuir and FreundlichPSOEXO.90[16]
Cow manure biochar1.253255031.23FreundlichPSOENDO.47[22]
Water treatment sludge biochar44 6034.22Langmuir and FreundlichPSOENDO.99[23]
Activated carbon Dopped alginate beads0.272520850Langmuir and FreundlichPSOENDO.100[38]
Citrus trees biochar7042090364.903FreundlichPSOEXO.87Current
study
Table 9. Comparison of study findings and published research on optimal conditions for TC adsorption on biochar in continuous mode.
Adsorbent UsedBed Height (cm)Q (mL/min)C0 (mg/L)pHRemovalRef.
Granular nanoporous activated carbon prepared from apricot shell4450538[39]
Modified wheat straw by diethylenetriamine, chloroacetic acid, and zirconium52200748[40]
Citrus trees biochar3130436Current study
Disclaimer/Publisher’s Note: The statements, opinions and data contained in all publications are solely those of the individual author(s) and contributor(s) and not of MDPI and/or the editor(s). MDPI and/or the editor(s) disclaim responsibility for any injury to people or property resulting from any ideas, methods, instructions or products referred to in the content.