
On Effects of Personality Traits on Travelers’ Heterogeneous Preferences: Insights from a Case Study in Urumqi, China


Abstract
1. Introduction
2. Literature Review
3. Data Collection
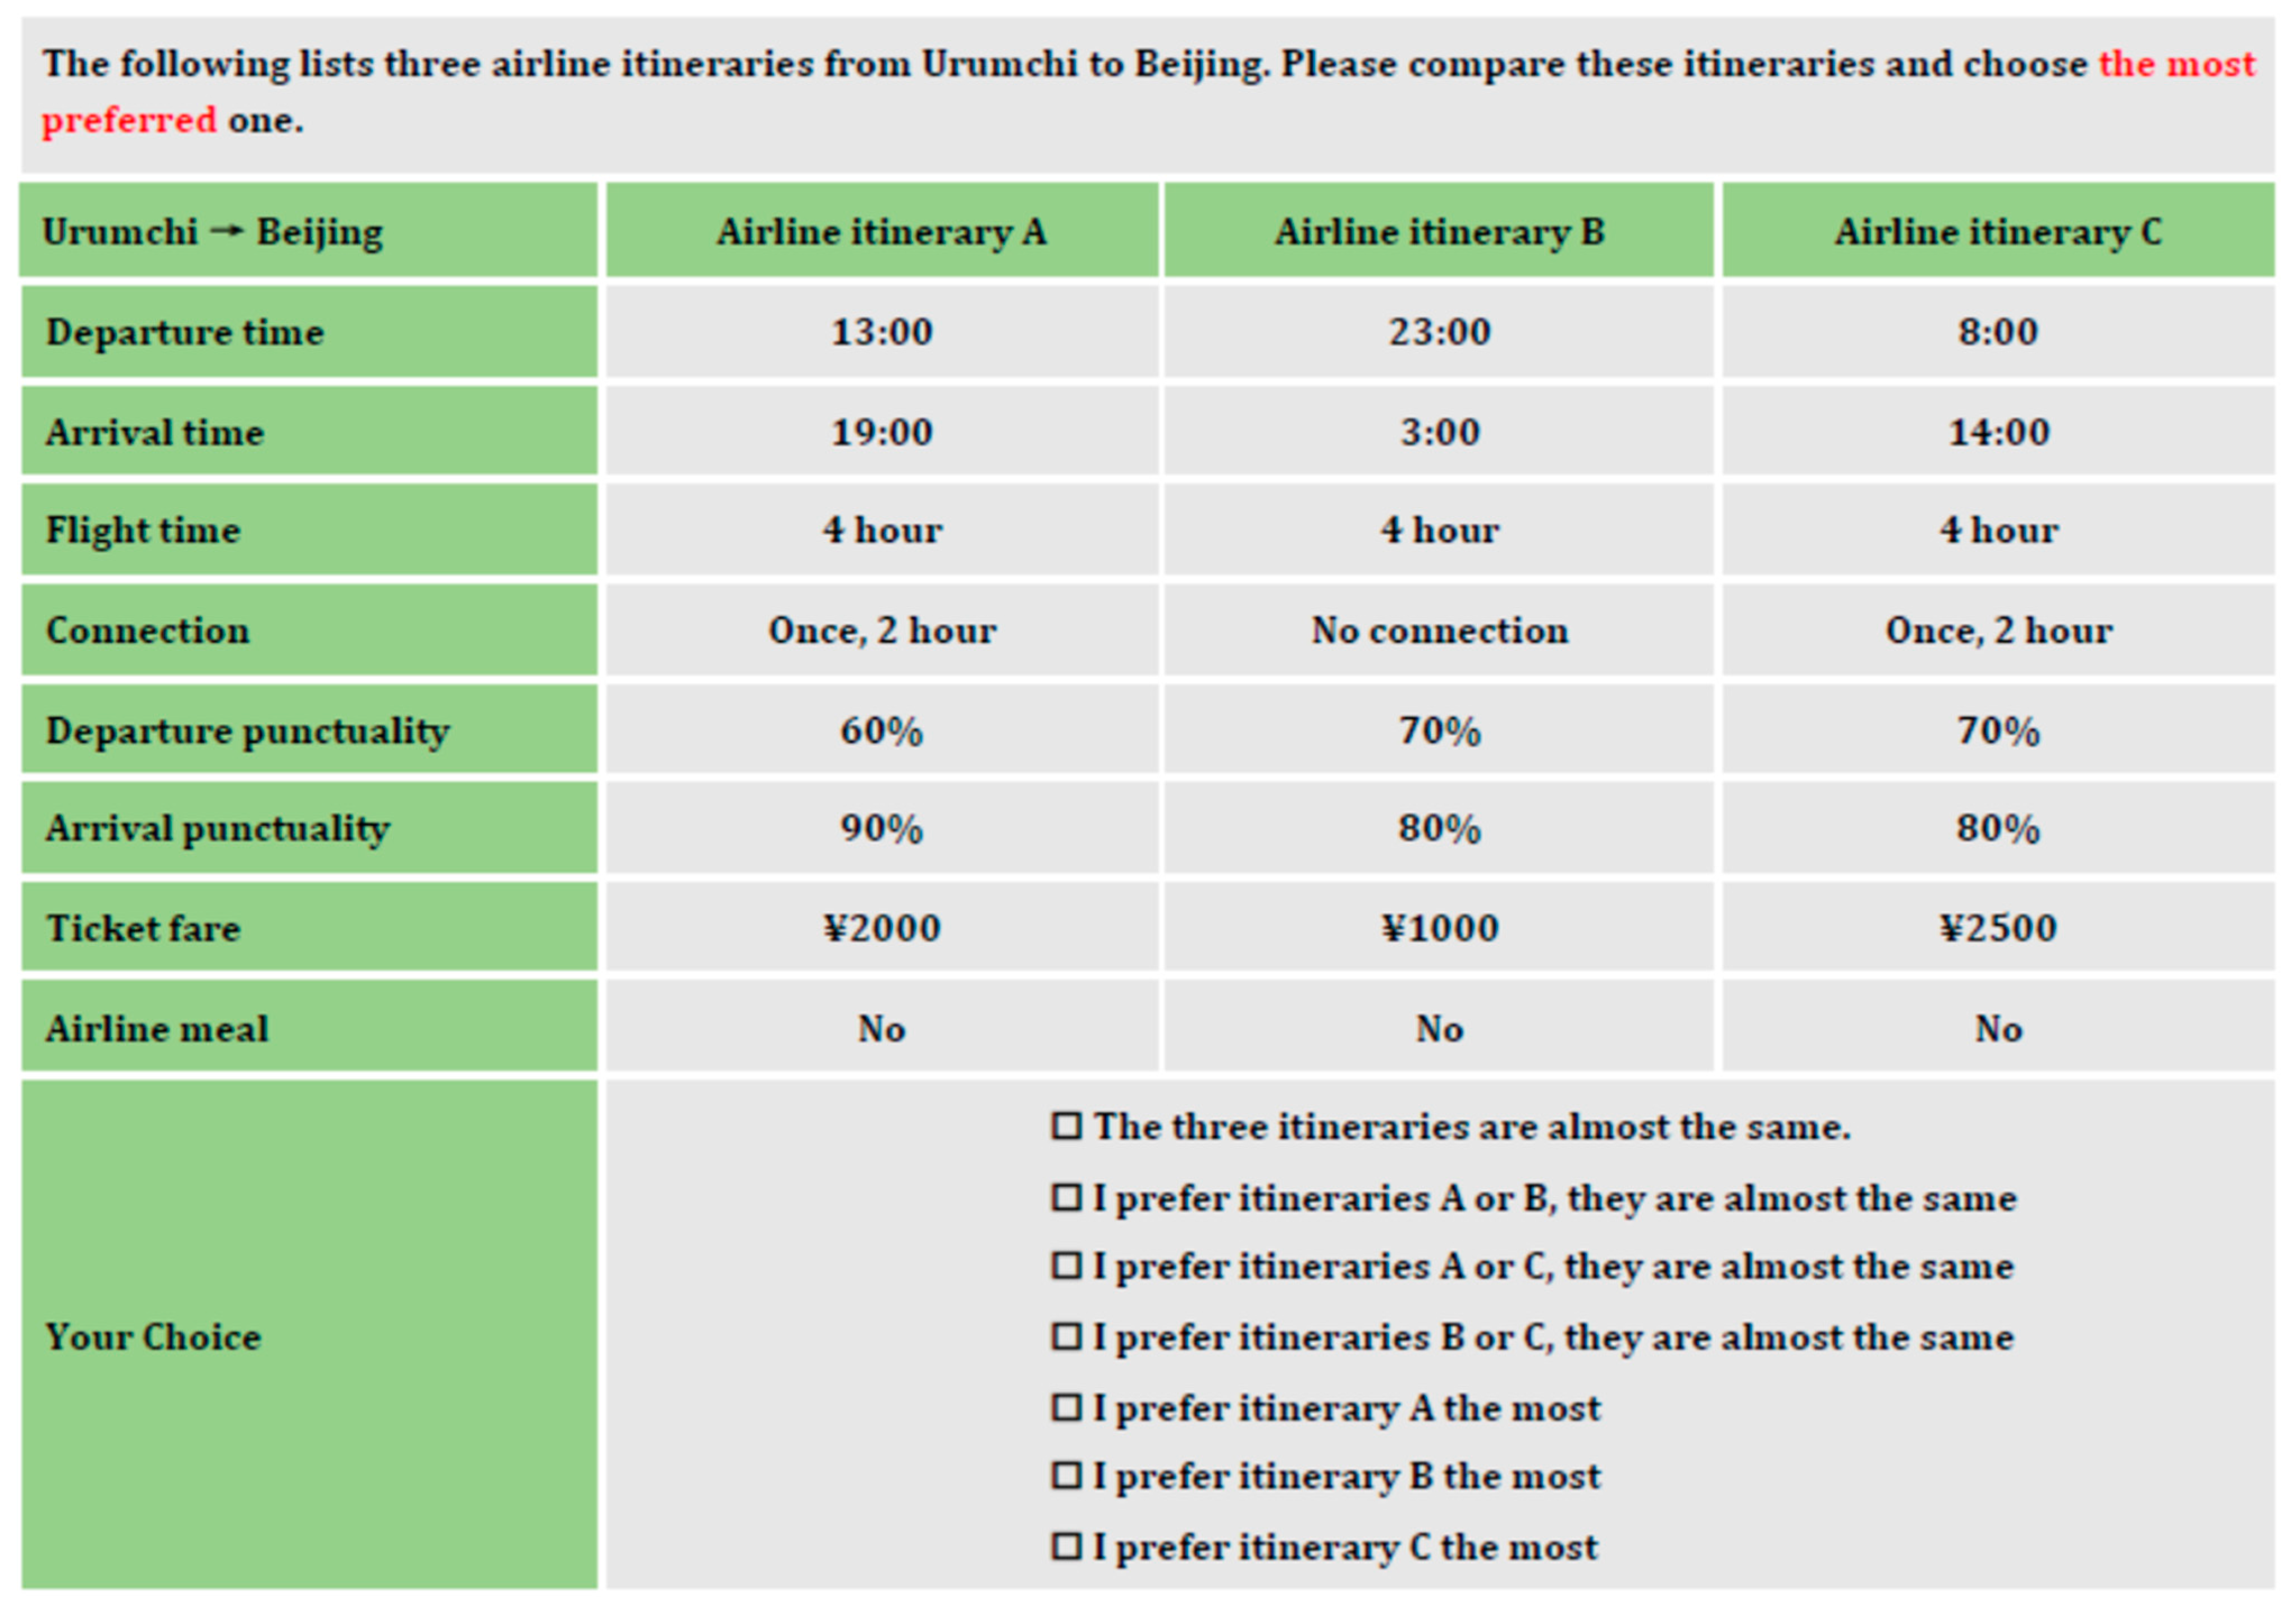
3.1. Questionnaire
3.2. Data Description
4. Exploratory Factor Analysis
5. Models
6. Results Analysis
6.1. Model Estimation
6.2. Analysis of Alternative-Specific Attributes
6.3. Analysis of Personality Traits and Socio-Demographic Attributes
7. Conclusions, Limitations and Paths for Future Research
7.1. Conclusions
7.2. Limitations and Future Works
Author Contributions
Funding
Institutional Review Board Statement
Informed Consent Statement
Data Availability Statement
Acknowledgments
Conflicts of Interest
References
- Tversky, A.; Kahneman, D. Advances in prospect theory: Cumulative representation of uncertainty. J. Risk Uncertain. 1992, 5, 297–323. [Google Scholar] [CrossRef]
- Novemsky, N.; Kahneman, D. The boundaries of loss aversion. J. Mark. Res. 2005, 42, 119–128. [Google Scholar] [CrossRef]
- Loomes, G.; Sugden, R. Regret theory: An alternative theory of rational choice under uncertainty. Econ. J. 1992, 92, 805–824. [Google Scholar] [CrossRef]
- Coon, D.; Mitterer, J.O. Introduction to Psychology: Gateway to Mind and Behavior, 13th ed.; Cengage Learning: Belmont, MA, USA, 2011. [Google Scholar]
- Allport, G. Personality: A psychological Interpretation; Holt: New York, NY, USA, 1937. [Google Scholar]
- Costa, P.T.; McCrae, R.R.; Dye, D.A. Facet scales for agreeableness and conscientiousness: A revision of the NEO personality inventory. Personal. Individ. Differ. 1991, 12, 887–898. [Google Scholar] [CrossRef]
- IPIP. Available online: https://ipip.ori.org/ (accessed on 2 April 2018).
- Kamargianni, M.; Polydoropoulou, A. Hybrid choice model to investigate effects of teenagers’ attitudes toward walking and cycling on mode choice behavior. Transp. Res. Rec. J. Transp. Res. Board 2013, 2382, 151–161. [Google Scholar] [CrossRef]
- Van, H.T.; Choocharukul, K.; Fujii, S. The effect of attitudes toward cars and public transportation on behavioral intention in commuting mode choice-A comparison across six Asian countries. Transp. Res. Part A Policy Pract. 2014, 69, 36–44. [Google Scholar] [CrossRef]
- Ajzen, I. Attitudes, Personality and Behaviour, 2nd ed.; Open University Press: Maidenhead, UK, 2005. [Google Scholar]
- Poó, F.M.; Ledesma, R.D. A study on the relationship between personality and driving styles. Traffic Inj. Prev. 2013, 14, 346–352. [Google Scholar] [CrossRef]
- Constantinou, E.; Panayiotou, G.; Konstantinou, N.; Loutsiou-Ladd, A.; Kapardis, A. Risky and aggressive driving in young adults: Personality matters. Accid. Anal. Prev. 2011, 43, 1323–1331. [Google Scholar] [CrossRef]
- Lucidi, F.; Mallia, L.; Lazuras, L.; Violani, C. Personality and attitudes as predictors of risky driving among older drivers. Accid. Anal. Prev. 2014, 72, 318–324. [Google Scholar] [CrossRef]
- Wood, D.; Penmetsa, P.; Adanu, E.K.; Rentfrow, P.J.; Harms, P.D.; Gosling, S.D.; Potter, J. Associations between self-rated personality traits and automobile fatality rates across small geographic areas. Transp. Res. Interdiscip. Perspect. 2020, 6, 100175. [Google Scholar] [CrossRef]
- Monteiro, R.P.; Coelho, G.L.d.H.; Hanel, P.H.P.; Pimentel, C.E.; Gouveia, V.V. Personality, dangerous driving, and involvement in accidents: Testing a contextual mediated model. Transp. Res. Part F: Traffic Psychol. Behav. 2018, 58, 106–114. [Google Scholar] [CrossRef]
- Nordfjærn, T.; SŞimşekoǧlu, Ö.; Zavareh, M.F.; Hezaveh, A.M.; Mamdoohi, A.R.; Rundmo, T. Road traffic culture and personality traits related to traffic safety in Turkish and Iranian samples. Saf. Sci. 2014, 66, 36–46. [Google Scholar] [CrossRef]
- Shen, B.; Ge, Y.; Qu, W.; Sun, X.; Zhang, K. The different effects of personality on prosocial and aggressive driving behaviour in a Chinese sample. Transp. Res. Part F Traffic Psychol. Behav. 2018, 56, 268–279. [Google Scholar] [CrossRef]
- Kim, J.; Schmöcker, J.D.; Bergstad, C.J.; Fujii, S.; Gärling, T. The influence of personality on acceptability of sustainable transport policies. Transportation 2014, 41, 855–872. [Google Scholar] [CrossRef]
- Lopez-Carreiro, I.; Monzon, A.; Lois, D.; Lopez-Lambas, M.E. Are travellers willing to adopt MaaS? Exploring attitudinal and personality factors in the case of Madrid, Spain. Travel Behav. Soc. 2021, 25, 246–261. [Google Scholar] [CrossRef]
- Yazdanpanah, M.; Hosseinlou, M.H. The influence of personality traits on airport public transport access mode choice: A hybrid latent class choice modeling approach. J. Air Transp. Manag. 2016, 55, 147–163. [Google Scholar] [CrossRef]
- Roos, J.M.; Sprei, F.; Holmberg, U. Sociodemography, geography, and personality as determinants of car driving and use of public transportation. Behav. Sci. 2020, 10, 93. [Google Scholar] [CrossRef]
- Gao, Y.; Rasouli, S.; Timmermans, H.; Wang, Y. Understanding the relationship between travel satisfaction and subjective well-being considering the role of personality traits: A structural equation model. Transp. Res. Part F Traffic Psychol. Behav. 2017, 49, 110–123. [Google Scholar] [CrossRef]
- Gao, Y.; Rasouli, S.; Timmermans, H.J.P.; Wang, Y. Effects of traveller’s mood and personality on ratings of satisfaction with daily trip stages. Travel Behav. Soc. 2017, 7, 1–11. [Google Scholar] [CrossRef]
- Munoz, C.; Laniado, H. Airline choice model for international round-trip flights: The role of travelers’ satisfaction and personality traits. Res. Transp. Econ. 2021; in press. [Google Scholar] [CrossRef]
- Johansson, M.V.; Heldt, T.; Johansson, P. The effects of attitudes and personality traits on mode choice. Transp. Res. Part A Policy Pract. 2006, 40, 507–525. [Google Scholar] [CrossRef]
- Mussone, L.; Changizi, F. The relationship between subjective well-being and individual characteristics, personality traits, and choice of transport mode during the first lock-down in Milan, Italy. J. Transp. Health 2023, 30, 101600. [Google Scholar] [CrossRef] [PubMed]
- Anagnostopoulou, E.; Urbančič, J.; Bothos, E.; Magoutas, B.; Bradesko, L.; Schrammel, J.; Mentzas, G. From mobility patterns to behavioural change: Leveraging travel behaviour and personality profiles to nudge for sustainable transportation. J. Intell. Inf. Syst. 2020, 54, 157–178. [Google Scholar] [CrossRef]
- Irfan, M.; Ahmad, M. Relating consumers’ information and willingness to buy electric vehicles: Does personality matter? Transp. Res. Part D Transp. Environ. 2021, 100, 103049. [Google Scholar] [CrossRef]
- Pan, X.; Rasouli, S.; Timmermans, H.J.P. Modeling social influence from a perspective of shift: An elaborated model. Transp. A Transp. Sci. 2021; published online. [Google Scholar] [CrossRef]
- Adler, T.; Falzarano, C.S.; Spitz, G. Modeling service trade-offs in air itinerary choices. Transp. Res. Rec. J. Transp. Res. Board 2005, 1915, 20–26. [Google Scholar] [CrossRef]
- Warburg, V.; Bhat, C.R.; Adler, T. Modeling demographic and unobserved heterogeneity in air passengers’ sensitivity to service attributes in itinerary choice. Transp. Res. Rec. J. Transp. Res. Board 2006, 1951, 7–16. [Google Scholar] [CrossRef]
- Rezaei, A.; Puckett, S.M.; Nassiri, H. Heterogeneity in preferences of air travel itinerary in a low-frequency market. Transp. Res. Rec. J. Transp. Res. Board 2011, 2214, 10–19. [Google Scholar] [CrossRef]
- Seelhorst, M.; Liu, Y. Latent air travel preferences: Understanding the role of frequent flyer programs on itinerary choice. Transp. Res. Part A Policy Pract. 2015, 80, 49–61. [Google Scholar] [CrossRef]
- Pan, X.; Rasouli, S.; Timmermans, H.J.P. Modeling social influence using sequential stated adaptation experiments: A study of city trip itinerary choice. Transp. Res. Part A Policy Pract. 2019, 130, 652–672. [Google Scholar] [CrossRef]
- Aizaki, H. Basic functions for supporting an implementation of choice experiments in R. J. Stat. Softw. 2012, 50, 1–24. [Google Scholar] [CrossRef]
- Cantillo, V.; Amaya, J.; Ortúzar, J.D. Thresholds and indifference in stated choice surveys. Transp. Res. Part B Methodol. 2010, 44, 753–763. [Google Scholar] [CrossRef]
- Pan, X.; Zuo, Z. Exploring the role of utility-difference threshold in choice behavior: An empirical case study of bus service choice. Int. J. Transp. Sci. Technol. 2020, 9, 128–136. [Google Scholar] [CrossRef]
- John, O.P.; Srivastava, S. The Big-Five trait taxonomy: History, measurement, and theoretical perspectives. In Handbook of Personality: Theory and Research; Guilford Press: New York, NY, USA, 1999; Volume 2. [Google Scholar]
- Cerny, B.A.; Kaiser, H.F. A study of a measure of sampling adequacy for factor-analytic correlation matrices. Multivar. Bahavioral Res. 1977, 12, 43–47. [Google Scholar] [CrossRef] [PubMed]
- Hair, J.; Black, W.; Babin, B.; Anderson, R. Multivariate Data Analysis, 7th ed.; Pearson: New York, NY, USA, 2010. [Google Scholar]
- Cronbach, L.J. Coefficient alpha and the internal structure of tests. Psychometrika 1951, 16, 297–334. [Google Scholar] [CrossRef]
- Walker, J.L.; Ben-Akiva, M. Generalized random utility model. Math. Soc. Sci. 2002, 43, 303–343. [Google Scholar] [CrossRef]
- Abou-Zeid, M.; Ben-Akiva, M. Hybrid choice models. In Handbook of Choice Modelling; Hess, S., Daly, A., Eds.; Edward Elgar Publishing: Cheltenham, UK, 2007; pp. 383–412. [Google Scholar]
- Vij, A.; Walker, J.L. How, when and why integrated choice and latent variable models are latently useful. Transp. Res. Part B Methodol. 2016, 90, 192–217. [Google Scholar] [CrossRef]
- Hensher, D.A.; Rose, J.M.; Greene, W.H. Applied Choice Analysis, 2nd ed.; Cambridge University Press: Cambridge, UK, 2015. [Google Scholar]
- Train, K.E. Discrete Choice Methods with Simulation, 2nd ed.; Cambridge University Press: Cambridge, UK, 2009. [Google Scholar]
- Henningsen, A.; Toomet, O. maxLik: A package for maximum likelihood estimation in R. Comput. Stat. 2011, 26, 443–458. [Google Scholar] [CrossRef]
- Braaten, E.; Weller, G. An improved low-discrepancy sequence for multidimensional quasi-Monte Carlo integration. J. Comput. Phys. 1979, 33, 249–258. [Google Scholar] [CrossRef]
- Bhat, C.R. Simulation estimation of mixed discrete choice models using randomized and scrambled Halton sequences. Transp. Res. Part B Methodol. 2003, 37, 837–855. [Google Scholar] [CrossRef]
- Louviere, J.J.; Hensher, D.A.; Swait, J. Stated Choice Methods: Analysis and Applications; Cambridge University Press: Cambridge, UK, 2000. [Google Scholar]


| Attributes | Description | Levels |
|---|---|---|
| Departure time | The time moment that the airplane take off in the airport | 6:00; 12:00; 18:00; 24:00 |
| Arrival time | The time moment that the airplane arrives at the destination airport | Calculated based on departure time and flight time |
| Flight time | Travel time from origin to destination airports, including the connection | 3.5 h; 4 h |
| Connection | Whether the itinerary contains an intermediate stop | No connection; Once, 2 h |
| Departure punctuality | Average punctuality about departure for an air itinerary (%) | 60%; 70%; 80%; 90% |
| Arrival punctuality | Average punctuality about departure for an air itinerary (%) | 60%; 70%; 80%; 90% |
| Ticket fare | Price of a ticket for an air itinerary (RMB) | ¥1000; ¥1500; ¥2000; ¥2500 |
| Airline meal | Whether the airline provides meals on the flight | Yes; No |
| Personality Traits | Items | Statements |
|---|---|---|
| Agreeableness | item24 | Likes to cooperate with others |
| item5 | Is helpful and unselfish with others | |
| item12 | Has a forgiving nature | |
| item15 | Is generally trusting | |
| item21 | Is considerate and kind to almost everyone | |
| Conscientiousness | Item23 | Makes plans and follows through with them |
| Item2 | Does a thorough job | |
| Item8 | Is a reliable worker | |
| Item18 | Perseveres until the task is finished | |
| Item26 | Does things efficiently | |
| Extraversion | Item1 | Is talkative |
| Item7 | Is full of energy | |
| Item11 | Generates a lot of enthusiasm | |
| Item17 | Has an assertive personality | |
| Item22 | Is outgoing, sociable | |
| Neuroticism | Item13 | Worries a lot |
| Item19 | Can be moody | |
| Item9 | Can be tense | |
| Item3 | Is depressed, blue | |
| Item25 | Gets nervous easily | |
| Openness | Item10 | Is ingenious, a deep thinker |
| Item14 | Has an active imagination | |
| Item16 | In inventive | |
| Item4 | Is original, comes up with new ideas | |
| Item20 | Values artistic, aesthetic experiences | |
| Item6 | Is curious about many different things | |
| Item27 | Is sophisticated in art, music, or literature |
| Mean | Median | Mode | Standard Deviation | Minimum | Maximum | |
|---|---|---|---|---|---|---|
| item1 | 3.23 | 3 | 3 | 1.05 | 1 | 5 |
| item2 | 3.39 | 3 | 3 | 1.01 | 1 | 5 |
| item3 | 2.62 | 3 | 3 | 1.09 | 1 | 5 |
| item4 | 3.33 | 3 | 3 | 0.97 | 1 | 5 |
| item5 | 3.76 | 4 | 4 | 0.96 | 1 | 5 |
| item6 | 3.57 | 4 | 3 | 1.01 | 1 | 5 |
| item7 | 3.55 | 4 | 3 | 0.99 | 1 | 5 |
| item8 | 3.82 | 4 | 4 | 0.97 | 1 | 5 |
| item9 | 2.79 | 3 | 3 | 1.13 | 1 | 5 |
| item10 | 3.48 | 3 | 3 | 1.05 | 1 | 5 |
| item11 | 3.46 | 3 | 3 | 1.02 | 1 | 5 |
| item12 | 3.74 | 4 | 4 | 1.06 | 1 | 5 |
| item13 | 3.28 | 3 | 3 | 1.20 | 1 | 5 |
| item14 | 3.48 | 3 | 3 | 1.03 | 1 | 5 |
| item15 | 3.46 | 3 | 3 | 1.05 | 1 | 5 |
| item16 | 3.30 | 3 | 3 | 1.04 | 1 | 5 |
| item17 | 2.81 | 3 | 3 | 1.16 | 1 | 5 |
| item18 | 3.38 | 3 | 3 | 1.11 | 1 | 5 |
| item19 | 2.61 | 3 | 3 | 1.24 | 1 | 5 |
| item20 | 3.14 | 3 | 3 | 1.19 | 1 | 5 |
| item21 | 3.63 | 4 | 4 | 1.04 | 1 | 5 |
| item22 | 3.47 | 3 | 3 | 1.06 | 1 | 5 |
| item23 | 3.35 | 3 | 3 | 1.08 | 1 | 5 |
| item24 | 3.41 | 3 | 4 | 1.08 | 1 | 5 |
| item25 | 3.14 | 3 | 3 | 1.15 | 1 | 5 |
| item26 | 3.40 | 3 | 3 | 0.97 | 1 | 5 |
| item27 | 3.36 | 3 | 3 | 1.20 | 1 | 5 |
| Socio-Demographic Characteristic | Level | Percentage |
|---|---|---|
| Gender | Male | 75.1% |
| Female | 24.9% | |
| Education | Bachelor | 37.9% |
| Master/PhD | 62.1% | |
| Household location | Rural | 53.3% |
| Urban | 46.7% | |
| Monthly expenditure | 0~1000 | 22.5% |
| 10,001~15,000 | 0.5% | |
| 1001~2000 | 46.2% | |
| 15,001~20,000 | 0.2% | |
| 2001~3000 | 19.6% | |
| 3001~4000 | 3.9% | |
| 4001~5000 | 2.9% | |
| 5001~6000 | 3.0% | |
| 6001~7000 | 0.2% | |
| 8001~9000 | 0.8% | |
| above 20,000 | 0.2% | |
| Occupation | Government Staff | 2.4% |
| University Student | 93.0% | |
| Company Staff | 3.4% | |
| Others | 1.2% | |
| Age | 16 | 0.2% |
| 17 | 0.8% | |
| 18 | 9.3% | |
| 19 | 10.7% | |
| 20 | 6.6% | |
| 21 | 3.9% | |
| 22 | 7.4% | |
| 23 | 14.2% | |
| 24 | 13.6% | |
| 25 | 10.3% | |
| 26 | 4.9% | |
| 27 | 3.2% | |
| 28 | 3.4% | |
| 29 | 3.7% | |
| 30 | 3.4% | |
| 31 | 1.2% | |
| 32 | 1.0% | |
| 33 | 0.5% | |
| 34 | 0.2% | |
| 35 | 0.3% | |
| 37 | 0.2% | |
| 38 | 0.3% | |
| 39 | 0.2% | |
| 40 | 0.5% |
| KMO Measuring of Sampling Adequacy | Overall MSA | 0.857 |
|---|---|---|
| Bartlett test of sphericity | 3737 | |
| Degree of freedom | 351 | |
| p-value | <0.001 |
| Factor 1 | Factor 2 | Factor 3 | Factor 4 | Factor 5 | |
|---|---|---|---|---|---|
| item12 | 0.763 | ||||
| item8 | 0.547 | ||||
| item7 | 0.542 | ||||
| item14 | 0.530 | ||||
| item15 | 0.528 | ||||
| item11 | 0.507 | ||||
| item5 | |||||
| item10 | |||||
| item23 | 0.725 | ||||
| item2 | 0.650 | ||||
| item26 | 0.625 | ||||
| item18 | 0.579 | ||||
| item24 | 0.545 | ||||
| item21 | |||||
| item1 | 0.751 | ||||
| item4 | 0.625 | ||||
| item22 | 0.615 | ||||
| item16 | 0.523 | ||||
| item6 | |||||
| item3 | 0.744 | ||||
| item9 | 0.721 | ||||
| item19 | 0.672 | ||||
| item25 | 0.636 | ||||
| item13 | 0.584 | ||||
| item17 | 0.506 | ||||
| item20 | 0.823 | ||||
| item27 | 0.771 |
| Estimate | Std. Error | p-Value | |
|---|---|---|---|
| alternative-specific constant | |||
| air itinerary A | 0.0000 | ||
| air itinerary B | −0.1837 | 0.0676 | 0.0066 *** |
| air itinerary C | −0.3330 | 0.0737 | 0.0000 *** |
| alternative-specific attribute | |||
| departure time | |||
| 8:00 | 0.2357 | ||
| 13:00 | 0.4401 | 0.0571 | 0.0000 *** |
| 18:00 | 0.0756 | 0.0623 | 0.2249 |
| 23:00 | −0.7514 | 0.0643 | 0.0000 *** |
| flight time | |||
| 3.5 h | 0.1475 | ||
| 4 h | −0.1475 | 0.0449 | 0.0010 *** |
| connection | |||
| no connection | 0.3500 | ||
| once, 2 h | −0.3500 | 0.0269 | 0.0000 *** |
| departure punctuality | 0.9191 | 0.2723 | 0.0007 *** |
| arrival punctuality | 2.3012 | 0.2690 | 0.0000 *** |
| ticket fare | −0.2340 | 0.0316 | 0.0000 *** |
| interaction effect | |||
| departure time × gender | |||
| 8:00 × male | −0.1857 | ||
| 13:00 × male | −0.0115 | ||
| 18:00 × male | −0.0065 | ||
| 23:00 × male | 0.2037 | ||
| 8:00 × female | 0.1857 | ||
| 13:00 × female | 0.0115 | 0.0544 | 0.8329 |
| 18:00 × female | 0.0065 | 0.0606 | 0.9145 |
| 23:00 × female | −0.2037 | 0.0581 | 0.0005 *** |
| departure time × household location | |||
| 8:00 × rural | −0.0204 | ||
| 13:00 × rural | 0.0741 | ||
| 18:00 × rural | −0.1046 | ||
| 23:00 × rural | 0.0509 | ||
| 8:00 × urban | 0.0204 | ||
| 13:00 × urban | −0.0741 | 0.0493 | 0.1329 |
| 18:00 × urban | 0.1046 | 0.0558 | 0.0609 * |
| 23:00 × urban | −0.0509 | 0.0504 | 0.3133 |
| departure time × NEU | |||
| 8:00 × NEU | −0.3045 | ||
| 13:00 × NEU | 0.1575 | 0.1022 | 0.1234 |
| 18:00 × NEU | −0.1754 | 0.1129 | 0.1204 |
| 23:00 × NEU | 0.3224 | 0.1049 | 0.0021 *** |
| flight time × education | |||
| 3.5 h × bachelor | 0.0929 | ||
| 3.5 h × master/PhD | −0.0929 | ||
| 4 h × bachelor | −0.0929 | ||
| 4 h × master/PhD | 0.0929 | 0.0423 | 0.0282 ** |
| connection × household location | |||
| no connection × rural | −0.0791 | ||
| no connection × urban | 0.0791 | ||
| once, 2 h × rural | 0.0791 | ||
| once, 2 h × urban | −0.0791 | 0.0241 | 0.0010 *** |
| connection × NEU | |||
| no connection × NEU | −0.0927 | ||
| once, 2 h × NEU | 0.0927 | 0.0518 | 0.0739 * |
| arrival punctuality × education | |||
| arrival punctuality × bachelor | 0.8618 | ||
| arrival punctuality × master/PhD | −0.8618 | 0.2616 | 0.0010 *** |
| ticket fare × age | 0.0049 | 0.0013 | 0.0001 *** |
| ticket fare × CON | −0.0555 | 0.0148 | 0.0002 *** |
| ticket fare × NEU | 0.0288 | 0.0131 | 0.0278 ** |
| panel effect | 0.2890 | 0.0585 | 0.0000 *** |
| number of scrambled Halton draw | 100 | ||
| sample size | 2342 | ||
| initial log-likelihood | −2572.950 | ||
| final log-likelihood | −2012.686 | ||
| rho-squared | 0.2178 | ||
| adjusted rho-squared | 0.2065 | ||
| Factor | Indicator | Estimate | Std. Error | p-Value | ||
|---|---|---|---|---|---|---|
| Measurement relationship | Measurement parameter | Conscientiousness | item2 | 1.2394 | 0.1891 | 0.0000 *** |
| item18 | 1.1647 | 0.1831 | 0.0000 *** | |||
| item23 | 1.4581 | 0.2272 | 0.0000 *** | |||
| item26 | 1.0000 | |||||
| Neuroticism | item3 | 1.2978 | 0.1896 | 0.0000 *** | ||
| item9 | 1.3576 | 0.2019 | 0.0000 *** | |||
| item13 | 0.8251 | 0.1655 | 0.0000 *** | |||
| item19 | 1.1888 | 0.2098 | 0.0000 *** | |||
| item25 | 1.0000 | |||||
| scale constant | Conscientiousness | item2 | 3.3710 | 0.0588 | 0.0000 *** | |
| item18 | 3.3644 | 0.0658 | 0.0000 *** | |||
| item23 | 3.3236 | 0.0595 | 0.0000 *** | |||
| item26 | 3.3772 | 0.0541 | 0.0000 *** | |||
| Neuroticism | item3 | 2.6292 | 0.0608 | 0.0000 *** | ||
| item9 | 2.7806 | 0.0619 | 0.0000 *** | |||
| item13 | 3.2805 | 0.0673 | 0.0000 *** | |||
| item19 | 2.6071 | 0.0724 | 0.0000 *** | |||
| item25 | 3.1657 | 0.0648 | 0.0000 *** | |||
| scale std. deviation | Conscientiousness | item2 | 0.7658 | 0.0402 | 0.0000 *** | |
| item18 | 0.9185 | 0.0426 | 0.0000 *** | |||
| item23 | 0.7779 | 0.0398 | 0.0000 *** | |||
| item26 | 0.8105 | 0.0356 | 0.0000 *** | |||
| Neuroticism | item3 | 0.7672 | 0.0409 | 0.0000 *** | ||
| item9 | 0.7782 | 0.0420 | 0.0000 *** | |||
| item13 | 1.0948 | 0.0587 | 0.0000 *** | |||
| item19 | 1.0105 | 0.0490 | 0.0000 *** | |||
| item25 | 0.9858 | 0.0509 | 0.0000 *** | |||
| Structural relationship | factor constant | Conscientiousness | 0.0000 | |||
| Neuroticism | 0.0000 | |||||
| factor std. deviation | Conscientiousness | 0.5295 | 0.0599 | 0.0000 *** | ||
| Neuroticism | 0.6066 | 0.0766 | 0.0000 *** | |||
Disclaimer/Publisher’s Note: The statements, opinions and data contained in all publications are solely those of the individual author(s) and contributor(s) and not of MDPI and/or the editor(s). MDPI and/or the editor(s) disclaim responsibility for any injury to people or property resulting from any ideas, methods, instructions or products referred to in the content. |
© 2023 by the authors. Licensee MDPI, Basel, Switzerland. This article is an open access article distributed under the terms and conditions of the Creative Commons Attribution (CC BY) license (https://creativecommons.org/licenses/by/4.0/).
Share and Cite
Hu, J.; Pan, X.; Zhong, M. On Effects of Personality Traits on Travelers’ Heterogeneous Preferences: Insights from a Case Study in Urumqi, China. Sustainability 2023, 15, 8186. https://doi.org/10.3390/su15108186
Hu J, Pan X, Zhong M. On Effects of Personality Traits on Travelers’ Heterogeneous Preferences: Insights from a Case Study in Urumqi, China. Sustainability. 2023; 15(10):8186. https://doi.org/10.3390/su15108186
Chicago/Turabian StyleHu, Jiangong, Xiaofeng Pan, and Ming Zhong. 2023. "On Effects of Personality Traits on Travelers’ Heterogeneous Preferences: Insights from a Case Study in Urumqi, China" Sustainability 15, no. 10: 8186. https://doi.org/10.3390/su15108186
APA StyleHu, J., Pan, X., & Zhong, M. (2023). On Effects of Personality Traits on Travelers’ Heterogeneous Preferences: Insights from a Case Study in Urumqi, China. Sustainability, 15(10), 8186. https://doi.org/10.3390/su15108186