1. Introduction
With the rapid development of China’s economy and urbanization, the contradiction between social and economic development on the one hand, and resources and the environment on the other hand, is becoming increasingly prominent [
1,
2]. As a fundamental condition and a hard constraint for achieving sustainable development goals, the level of carrying capacity directly affects the quality of economic development [
3,
4]. During the progress of human society, ecological and energy resources have been significantly depleted, resulting in increasing problems such as soil erosion, resource shortages, and ecological environment deterioration. Geological environment issues are also receiving widespread attention and research [
5]. Conducting an evaluation of regional geo-environment carrying capacity is of great practical significance for improving the ecological environment, protecting the ecological environment, and promoting sustainable development in the region.
Geo-environmental carrying capacity emphasizes the relationship between human production, life, and the geo-environment [
6]. Its main feature is the maximum tolerance of the geo-environmental system to external environmental changes and the continuous exchange of material, information [
7], and energy with the human social system to ensure effective, smooth, and sustainable development of the human social system and to satisfy all human production activities to the fullest extent possible [
8]. Geo-environmental carrying capacity is a direct reflection of the structure and function of the geo-environmental system, which can be accurately measured by combining qualitative and quantitative methods [
9]. Furthermore, geo-environmental carrying capacity is easily influenced by human activities and the natural environment, and it decreases relatively with the advancement of technology and the strengthening of environmental protection awareness [
10,
11]. In this study, we understand geo-environmental carrying capacity from the perspective of the coordinated relationship between the human social system and the geo-environmental system. It refers to the maximum capacity of the geo-environmental system to withstand the influence of human social production activities and external forces within a certain area and timeframe, under the conditions determined by the natural environment, in order to maintain the structure of the geo-environmental system without qualitative changes, for the sustainable development of human society and economy [
12,
13]. This maximum capacity allows the geo-environmental system to withstand the impact of human social production activities and external forces, while ensuring sustainable socio-economic development.
Geo-environmental carrying capacity evaluation emerged in the 1990s. It studies the geo-environmental carrying capacity through the interaction mechanism of resources, environment, and human socio-economy [
14]. Its influencing factors are characterized by complexity, fuzziness, and uncertainty. The expression of evaluation indexes has mixed multi-attribute characteristics such as crisp value, interval type [
15], and linguistic. The evaluation model focuses on system theory and prediction theory and establishes mathematical models and methods to explore the differences of regional geological environment from the perspective of sustainable development. The main evaluation methods include the index evaluation method, system dynamics method, and multi-objective optimization model, among others [
16]. With the in-depth application of mathematical models, the accuracy and breadth of geo-environmental carrying capacity evaluation results have been improved [
17,
18]. The evaluation methods mainly include gray system theory model, hierarchical analysis method, fuzzy comprehensive evaluation method, set-pair analysis model, and system dynamics model [
19]. However, it is known that these methods and models may not be accurate due to the loss of information during data processing.
China has conducted a series of large-scale comprehensive surveys to investigate the background data of resources and environment in different regions of the country at different times [
20,
21]. Big data on resources and environment are different from traditional web data in terms of data structure, content, and presentation, and it is necessary to deeply understand the characteristics of the data when solving practical objective problems and apply their own unique “data science” [
22]. Zhang et al. used economic data, environmental data, and ecological data to construct a research framework for the analysis of the geological status of western ecological fragile areas. They applied weighting and triangular fuzzy number weighting and used a judgment matrix to calculate the relative importance among the indicators in the evaluation system to assess the geological carrying capacity of the coastal area of Laizhou Bay in Shandong Province [
23]. Zhang et al. mainly evaluated the ecological geological environment of the urban area of Lanzhou City, China, and used hierarchical analysis and weighted synthesis method to construct the model and calculate the analysis of the carrying capacity [
24]. Wu et al. proposed a regional geo-ecological environment carrying capacity evaluation method based on carrying capacity quality evaluation and spatial coupling, based on GIS platform and evaluation index system. They used the hierarchical analysis method to determine the weights of each evaluation index factor and used the ranking technique of approximating ideal solution (TOPSIS) to calculate the comprehensive quality of carrying capacity [
25]. Li et al. constructed a TOPSIS model based on entropy weight for evaluating ecological geo-environmental carrying capacity [
18]. Xi et al. constructed a geo-environmental carrying capacity evaluation system using 17 evaluation indexes of geological, ecological, and social environment, and chose a fuzzy affiliation function to quantify each index to evaluate the carrying capacity of the geological environment in Huangshi, China [
26].
Numerous studies have shown that intuitionistic fuzzy theory and TOPSIS model have a good effect on geo-environmental carrying capacity evaluation [
27,
28,
29]. Due to the complexity, diversity, and uncertainty of the geo-environmental system itself, as well as the limitations of the researchers’ own technical level and other factors, there is no unified definitive evaluation of the regional geo-environmental carrying capacity. In order to adapt to socio-economic changes and comprehensiveness, the influence factors in the region must be considered comprehensively when measuring the relativity of indicators and the accuracy of models [
30]. At present, the main methods on geo-environmental carrying capacity evaluation are the ecological footprint method, state space method, comprehensive evaluation method and set-pair analysis method, and the advantages and disadvantages of each evaluation method are shown in
Table 1.
As stated above, the current evaluation of geo-environmental carrying capacity is mainly based on geo-environmental data from a certain period, and rarely provides a comprehensive analysis of the geo-environmental carrying capacity across space and time. The theories of fuzzy set and intuitionistic fuzzy set have shown excellent performance in multi-attribute decision-making, fuzzy recognition, and image noise reduction. Inspired by this, in order to address the research gap in geo-environmental carrying capacity evaluation, this study proposes a unified approach to convert interval variables, linguistic variables, and crisp value variables into intuitionistic fuzzy numbers. The interval variables are normalized by upper and lower limits, the linguistic variables are converted using an intuitionistic fuzzy number control table, and the crisp values are processed using a normalization method. The converted data are then incorporated into a unified analysis framework, effectively avoiding information loss from each index datum.
The possible innovations and contributions of this study are: (a) proposing a novel analytical framework for evaluating geo-environmental carrying capacity; (b) introducing intuitionistic fuzzy number theory and TOPSIS method into geo-environmental carrying capacity evaluation; (c) unifying the conversion of index data into intuitionistic fuzzy numbers for various types of data such as interval type, linguistic variables, and crisp values to establish a decision matrix; and (d) developing an intuitionistic fuzzy-based TOPSIS model for evaluating the geo-environmental carrying capacity. The research results demonstrate that the proposed method and model can effectively measure the geo-environmental carrying capacity.
The rest of this study is organized as follows: Part 2 introduces the research area and data sources and describes the intuitionistic fuzzy number theory and TOPSIS model. The third introduces the applied mathematical model. The fourth part is a case study, and the model is applied to the evaluation of the geological environment’s carrying capacity in Meishan City, China. Finally,
Section 5 gives the main conclusions of this study.
2. Study Area and Indicator Data
2.1. Study Area
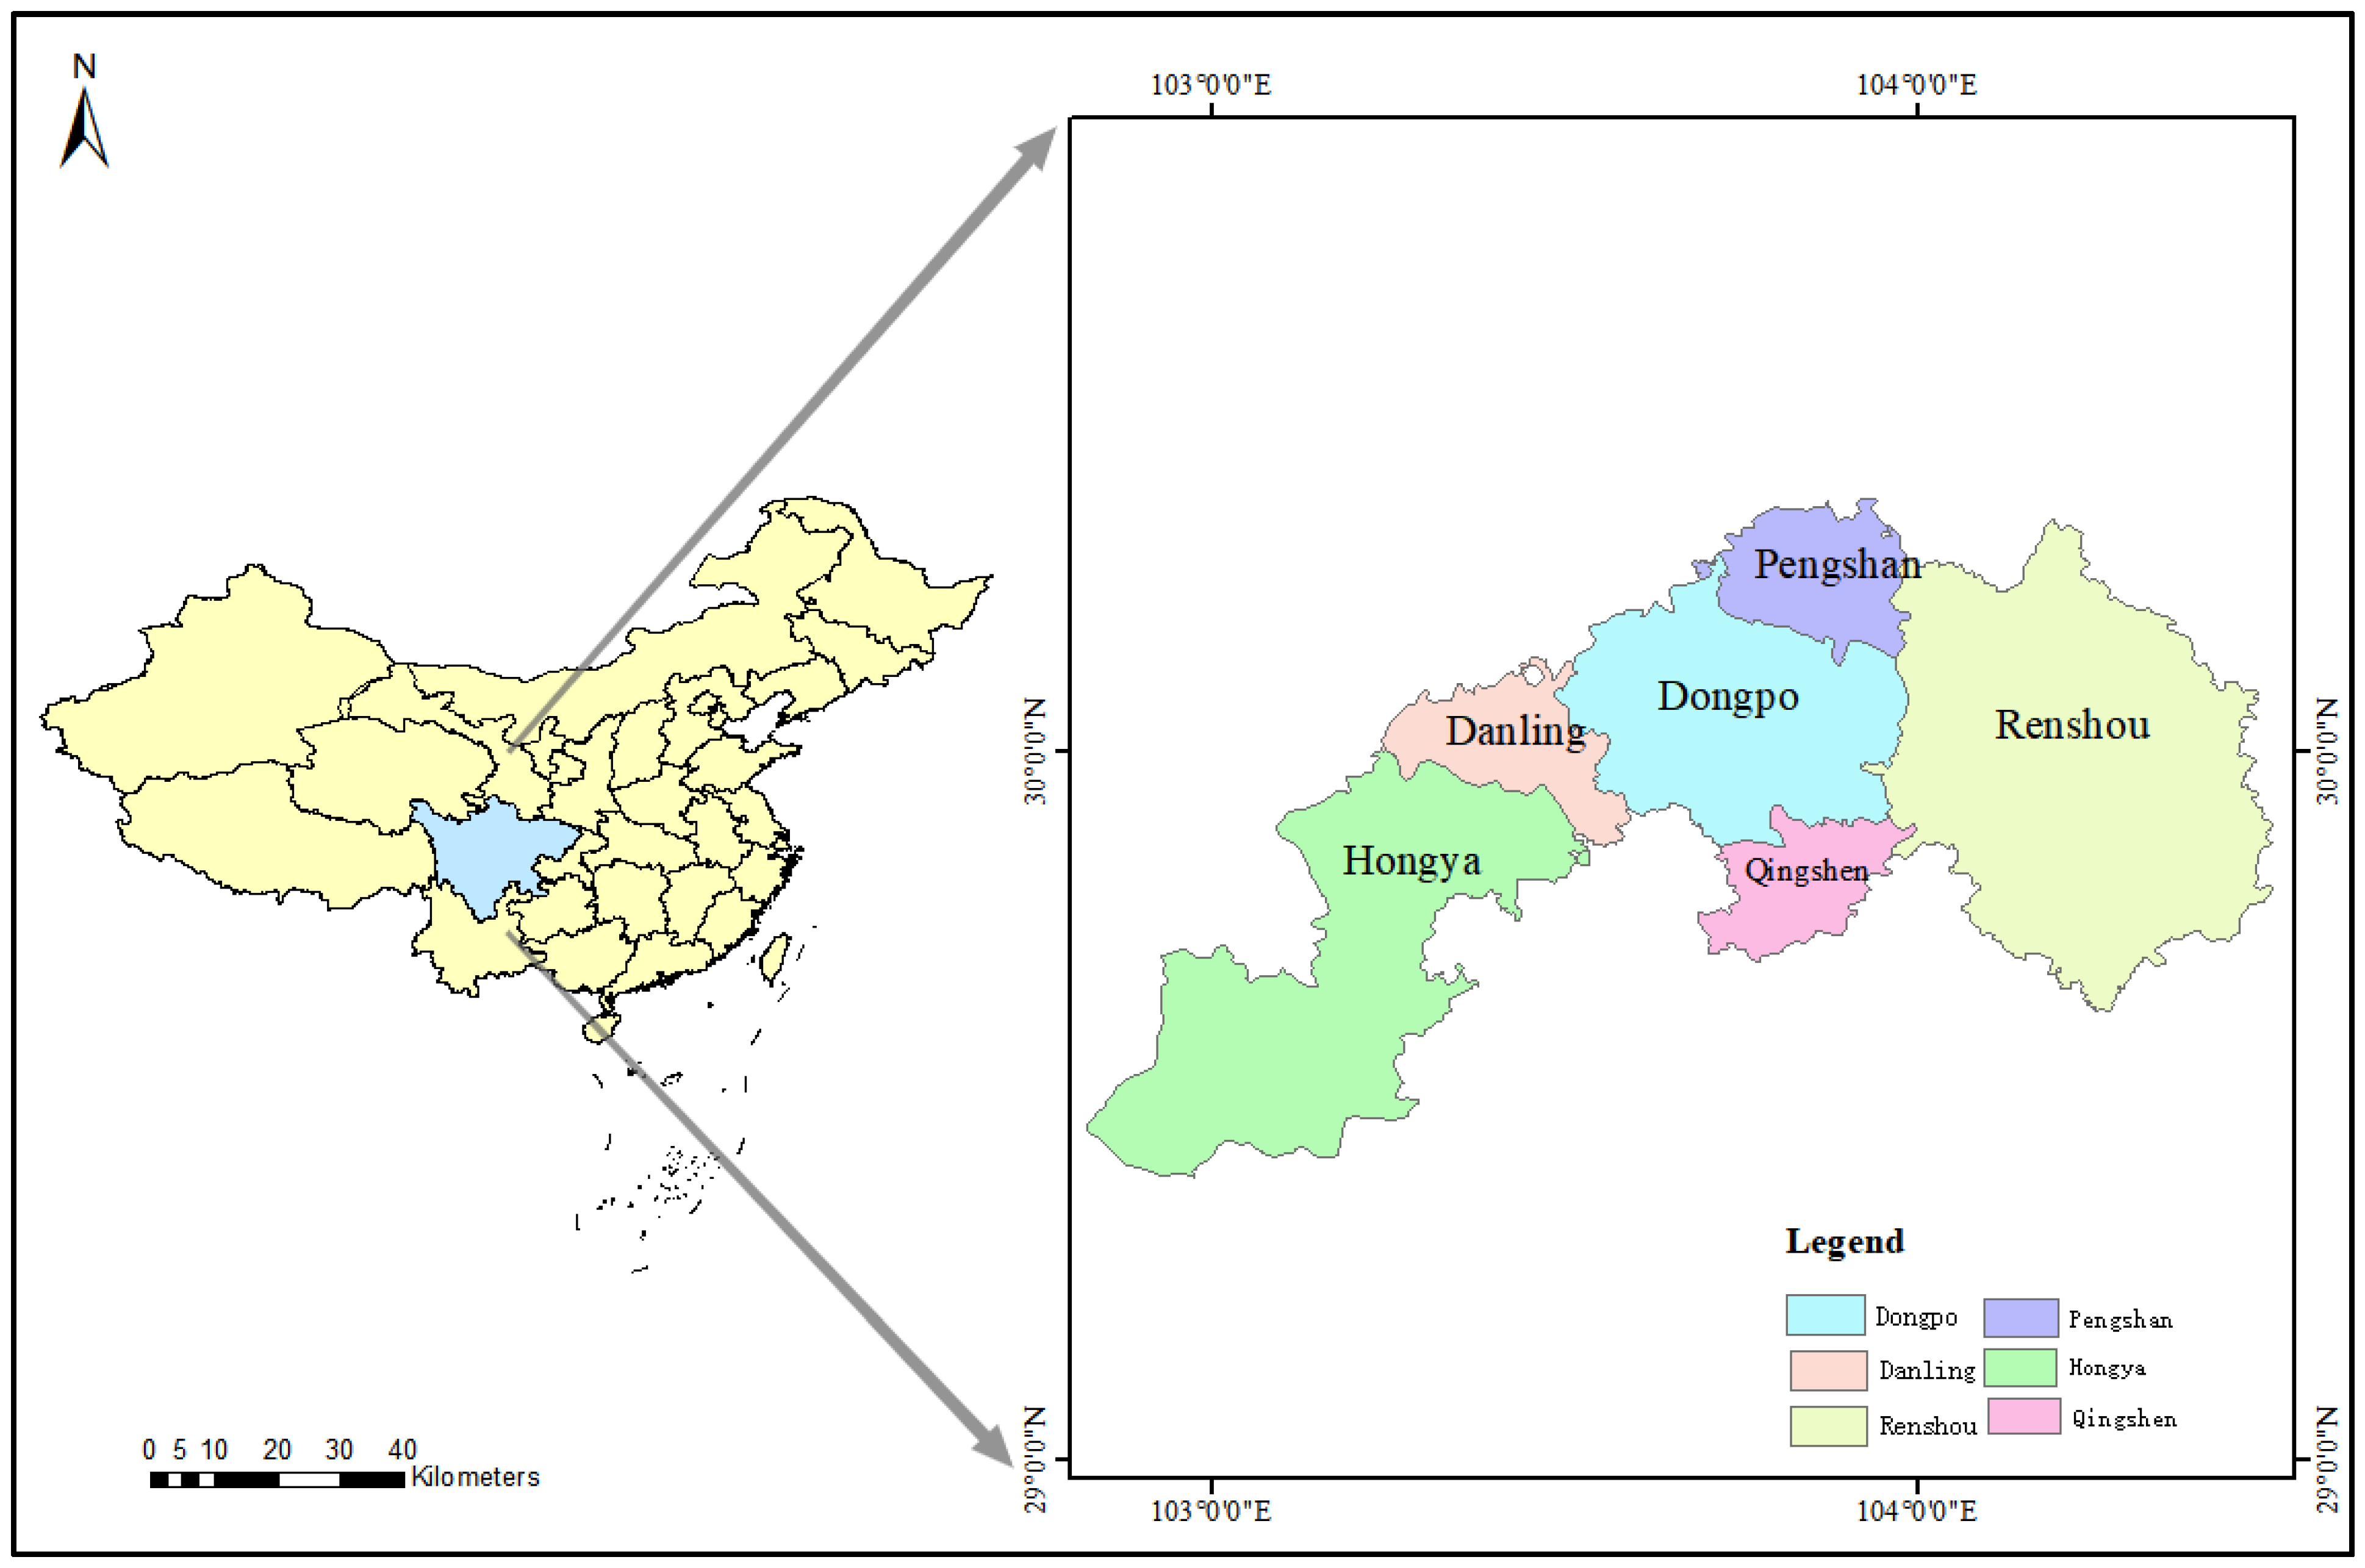
Meishan City is located in southwest China at the junction of the Minjiang River tributary and the Qingyi River fan in the upper reaches of the Yangtze River. It is adjacent to the cities of Chengdu, Leshan, Zigong, Neijiang, Ziyang, and Ya’an. There are six districts and counties under the jurisdiction of the city, namely Dongpo, Pengshan, Renshou, Hongya, Danling, and Qingshen (
Figure 1). Covering an area of 7184 square kilometers with 3,446,800 permanent residents at the end of 2020, and the city’s GDP is 125.603 billion yuan, Meishan has a superior location and well-developed transportation, with the Chengkun Railway, Chengle Expressway, and Minjiang Waterway crossing the entire territory from north to south. It is an important part of the national-level Tianfu New Area. However, with the accelerated industrialization and urban-rural integration in Meishan, the construction of transportation, water conservancy, energy, communication, and other infrastructure and towns will continue to advance, and there is a trend of increasing human-induced geohazards. The geohazard prevention and control system is not yet complete. Therefore, this study takes Meishan City as the research area to conduct an empirical study on its land carrying capacity.
2.2. Data Sources
Due to the difficulty of data collection and acquisition in this study, we conducted data collection by combining the data of units and departments with field research. Department information was mainly obtained from the Meishan Bureau of Statistics, the Natural Resources Bureau, the Forestry Bureau, and other departments, including Meishan 20 Years, the 13th Five-Year Plan of Meishan, the Meishan Water Resources Bulletin from 2015 to 2018, and the Meishan Statistical Yearbook from 2005 to 2019. In this study, we screened the original data needed to construct the evaluation index system of comprehensive land carrying capacity in Meishan City from field investigation and departmental data. Additionally, to ensure the calculation results are objective, true, and effective, we standardized the original data.
The main contents of the field investigation and verification are as follows:
(1) Geomorphological types, including the Zhongshan landform of erosion and denudation topography in Hongya, the alluvial-proluvial plain and terrace of rivers such as the Minjiang River, the Qingyi River, and the Huaxi River, and dome hills of shallow hills and wide valleys, etc., as well as the undulation, slope direction, slope, slope shape, and boundary of related topography and geomorphology.
(2) Stratigraphic lithology, including the Guankou Formation, Shaximiao Formation, Shangshaximiao Formation, Suining Formation, Penglai Town Formation, and Quaternary loose deposits, and their spatial distribution characteristics, stratigraphic occurrence, boundaries, and spatial distribution characteristics.
(3) Surface water bodies, including the Minjiang River, Qingyi River, Simeng River, Jinniu River, Anxi River, Huaxi River, and other rivers and related canal systems, as well as the distribution of related surface water bodies, watershed area, runoff, water level, water quality, water temperature, pollution, and so on.
(4) Human social engineering, soil erosion, hidden danger points of geological disasters along the way, etc. Through field verification, we mainly collected data such as topography, engineering geological rock groups, active fault distance, topographic relief, and so on.
2.3. Construction of Evaluation Index System
The construction of the evaluation index system and the identification of the key geo-environmental evaluation factors comprehensively analyze the primary geo-environmental characteristics and outstanding advantages [
31,
32], as well as the primary geo-environmental issues impeding economic and social development. The key factors affecting the evaluation of carrying capacity are identified [
33], the main causes of regional geological environment problems are clarified [
34], the historical changes of the geological environment in the evaluation area are analyzed, and the key problems in the evaluation area are identified [
35]. The development trend of regional geological environment problems is predicted by combining with the positioning of land functions [
36,
37]. Eight indicators, including terrain undulations, geomorphological type, engineering geological rock group, active fracture distance, karst development degree, average annual rainfall, earthquake peak acceleration, and land use degree, are chosen based on the evaluation’s key factors.
Table 2 displays the importance of each evaluation index and how to obtain it.
Attributes in the process of calculating the bearing capacity of the geological environment evaluation index, according to the different attribute index data of its normalization methods, are also different, according to the actual data of linguistic variable transformation with an intuitionistic fuzzy number, and some among them are the linguistic variable indicators including geomorphological type, engineering geological rock group, karst development level, and land use degree [
38]. For such qualitative attribute indicators, the degree of difference is mainly determined by combining expert evaluation and field research. Generally, qualitative language such as “good,” “bad,” “high,” “low,” “important,” and “unimportant” is used to describe them, and certain transformation rules are adopted to standardize them. Through experiments, psychologists have proposed that the linguistic index of people’s judgment of the scheme is generally between five and nine degrees [
39]. Furthermore, to facilitate the division and computing of linguistic discrimination, it can be divided into five to 10 levels, where, according to the specific situation of the decision-makers, they can choose between what may also be not-equidistant gaps in isometric, quantitative representation for each grade by normal fuzzy numbers, and then these fuzzy numbers are standardized to obtain a standardized fuzzy index.
To explore various linguistic indicators in greater detail, we referenced the studies conducted by [
39,
40,
41]. In this study, we converted the fuzzy linguistic variables involved into intuitionistic fuzzy numbers to achieve a more precise expression of geological carrying capacity. Based on the purpose and theme of this research, we classified the linguistic variables involved into 10 levels corresponding to different intuitionistic fuzzy numbers [
42]. This approach enables us to better control the accuracy and range of the fuzzy linguistic variables. For specific classification results, please refer to
Table 3.
Table 4 displays a four-scale linguistic change scale based on field survey data, including landscape type, engineering geological retro fabric, karst development level, average annual rainfall, and land use degree for the four linguistic variables. Expert opinion, reference standards of classification at home and abroad, and intuitionistic fuzzy transformation criteria were taken into account while creating this scale.
The geological environment survey data, when combined with the above-mentioned indicator system, will be transformed into intuitionistic fuzzy interval variables, among which the bearing capacity of the geological environment in the interval variables are mainly relief degree, average annual rainfall, land use degree, and ground motion peak acceleration. The specific normalization method is as follows:
Let the units to be evaluated, where the attribute set is
, then the decision matrix is
, and the expression of
is the interval number, namely
. The decision matrix is expressed as follows:
To facilitate calculation, this study adopts the following standardized formula for calculation (Yue et al., 2019 [
43]; Yang C et al., 2019 [
42]):
is benefit attribute (positive)
is cost attribute (negative)
The normalized decision matrix is a unified intuitionistic fuzzy matrix, in which the hesitancy satisfies .
2.4. Division of Geomorphological Units in the Study Area
Combined with field investigation and geomorphic genetic form, Meishan City is divided into three types: erosional tectonic geomorphic and karst geomorphic; tectonic denudation geomorphic; and erosional accumulation geomorphic [
44]. Erosional tectonics and karst geomorphics can be divided into four subtypes: fold high mountain, karst low mountain, fold low mountain, and Zhongshan low mountain. Tectonic denudation landforms can be divided into three subtypes: deep-cut camelback hills, middle-cut wide valley gentle slope hills, and shallow-cut dome hills. Erosional accumulation landforms can be divided into alluvial (accumulation) plains (flat dams) (including valleys, terraces, floodplains, and flats) and accumulation platforms. Therefore, Meishan City can be divided into four geomorphic subcategories and 33 geomorphic units (
Table 5). According to the corresponding characteristics of 33 topographic and geomorphic units (basic analysis units) in Meishan City, some indicator values involving six basic spatial units (district and county administrative units) appear to exhibit an overlapping or segmentation phenomenon, which is segmented and allocated to each basic analysis unit according to the area occupied or actual survey data.
3. Model
3.1. Intuitionistic Fuzzy Set Theory
Most of the information in the objective world is characterized by fuzziness, uncertainty, randomness, and so on. In 1965, Zadeh proposed the fuzzy set theory, which effectively solved the problems of fuzziness and system uncertainty and provided a scientific and effective tool for people to make decisions, reason, and recognize things [
45,
46]. Because it considers both membership and non-membership information, it is more practical and flexible in dealing with fuzziness and uncertainty than the traditional fuzzy set [
12], which only considers a single membership, and can describe the fuzzy nature of the objective world more delicately [
47,
48].
When dealing with the uncertainty degree of information, fuzzy entropy can be used to represent the uncertainty degree of any element in the domain
. Yue et al. proposed the definition of intuitive fuzzy entropy as follows [
43]:
Let set
, where
, then
intuitive fuzzy entropy is:
where
is A non-empty set
, and
is called intuitionistic fuzzy number, where its membership function
and non-membership function
are, respectively, the membership degree and non-membership degree of element
belonging to
in
, and meet the conditions
and
.
At the same time, the concept of intuitionistic fuzzy set under the consideration of hesitancy is given. Let any intuitionistic fuzzy number in , if , be called . Element belongs to the uncertainty or hesitancy of / when , intuitionistic fuzzy set degenerates into classical fuzzy set.
3.2. TOPSIS Method Based on Intuitionistic Fuzzy
The Technique for Order Preference by Similarity to Ideal Solution (TOPSIS) method is a sorting technique that approximates ideal points. Since its introduction by Hwang in 1981, the TOPSIS method has been widely used for optimization problems in decision-making [
49,
50]. The fundamental principle of the method is to compare the distance between alternatives and the positive and negative ideal solutions, and then rank the alternatives according to two evaluation criteria: proximity to the positive ideal solution and distance from the negative ideal solution.
The TOPSIS method is often combined with intuitionistic fuzzy multi-attribute decision-making problems to construct a decision matrix that considers both membership degree and non-membership degree. After constructing the decision matrix, the comprehensive proximity degree of each scheme is calculated. This approach allows decision-makers to consider both the degree of membership and non-membership of alternatives in the decision-making process, leading to a more comprehensive and accurate evaluation of each alternative.
The specific methods for data processing and weight calculation in this study are included in the
Supplementary Material. To provide a comprehensive understanding of the study, we outline the specific modeling steps below:
Step 1: Construct intuitionistic fuzzy decision matrix.
Construct an intuitionistic fuzzy matrix, where satisfies and has .
Step 2: Determination of positive and negative ideal solutions (scheme).
Considering the objectivity of decision-making, the ideal solution is the ideal expectation based on the scheme to be evaluated. Under the same attribute, the higher the membership degree is, the better it is, rather than the lower the membership degree is. The negative ideal solution is far from the expectation of the scheme to be evaluated, and the smaller the membership degree under the same attribute, the better it is than the larger the membership degree. The positive ideal scheme and negative ideal solution scheme of each evaluation unit in the intuitionistic fuzzy set are denoted as:
Step 3: Calculate the indicators weights of several intuitionistic fuzzy types.
Indicators weight calculation involves many methods. According to the different bases for determining attribute weight, it can be generally divided into the following categories: objective attribute weight, subjective attribute weight, and combination attribute weight. When the TOPSIS method is used to evaluate ranking, weight determination methods can be selected according to different research backgrounds. Write the weight vector as:
Step 4: Calculate the weighted distance between positive and negative ideal solutions.
The defined distance formula is used to calculate the weighted distance between each scheme to be evaluated and the positive and negative ideal solutions, and the normalized intuitionistic fuzzy set is used to calculate the weighted distance between each scheme to be evaluated and the positive and negative ideal solutions.
represents the distance between the evaluation unit and the negative ideal, and represents the distance between the evaluation unit and the positive ideal. Considering it with Formula (6), the weighted distance formula of this study is proposed. According to different weights, the calculation results are also different. The calculation is as follows.
Step 5: Calculate the comprehensive score indicators of each evaluation unit.
Calculate the comprehensive score indicators of each evaluation unit, namely, the closeness degree of each evaluation unit, and rank each evaluation unit from large to small according to the comprehensive score indicators, to complete the evaluation. Its calculation formula is as follows:
Obviously, when , . When , . Therefore, the larger is, the smaller the distance between the evaluation scheme and the positive ideal solution is, and the farther it is from the negative ideal solution.
4. Results and Discussion
4.1. Comprehensive Calculation of Geo-Environmental Carrying Capacity
4.1.1. Geo-Environmental Carrying Capacity Considering Subjective Weight
Using the intuitionistic fuzzy TOPSIS method and classification standards from
Table 6 [
51,
52] combined with subjective weight calculation,
Table 7 displays the evaluation results for the geological bearing capacity of each natural unit in Meishan City. Additionally,
Figure 2 is obtained by GIS spatial analysis. The overall results indicate that the geo-environmental carrying capacity in all natural units of Meishan City is relatively high. High bearing capacity regions are present in units A1-1, B3-2, C1-2, B3-3, B3-4, C2-2, B3-1, B3-5, B3-6, B3-7, and B2-7, while areas with even higher carrying capacity are found in units A2-2, A3-1, B2-1, B2-4, B2-5, A3-2, B1-3, B6-6, B1-5, and A3-3. Units A2-1, C1-1, C2-1, and C1-6 are the areas with the highest carrying capacity. The southwest corner and the central and northern parts of Meishan City have relatively high geological disaster densities, while the eastern part and some parts of the central and northern regions have strong human activities. Relevant standards, regulations, and policies consider the geo-environmental carrying capacity of Meishan City poor. However, subjective factors limit the full consideration of the actual situation, and relying solely on subjective weight calculation results may not effectively reflect the actual carrying capacity of the Meishan geological environment.
4.1.2. Geo-Environmental Carrying Capacity Considering Objective Weight
The geo-environmental carrying capacity of each geomorphic unit in Meishan City was evaluated using the intuitionistic fuzzy TOPSIS method, and the results were shown in
Table 8 and
Figure 3 obtained by GIS spatial analysis. The analysis of
Table 8 and
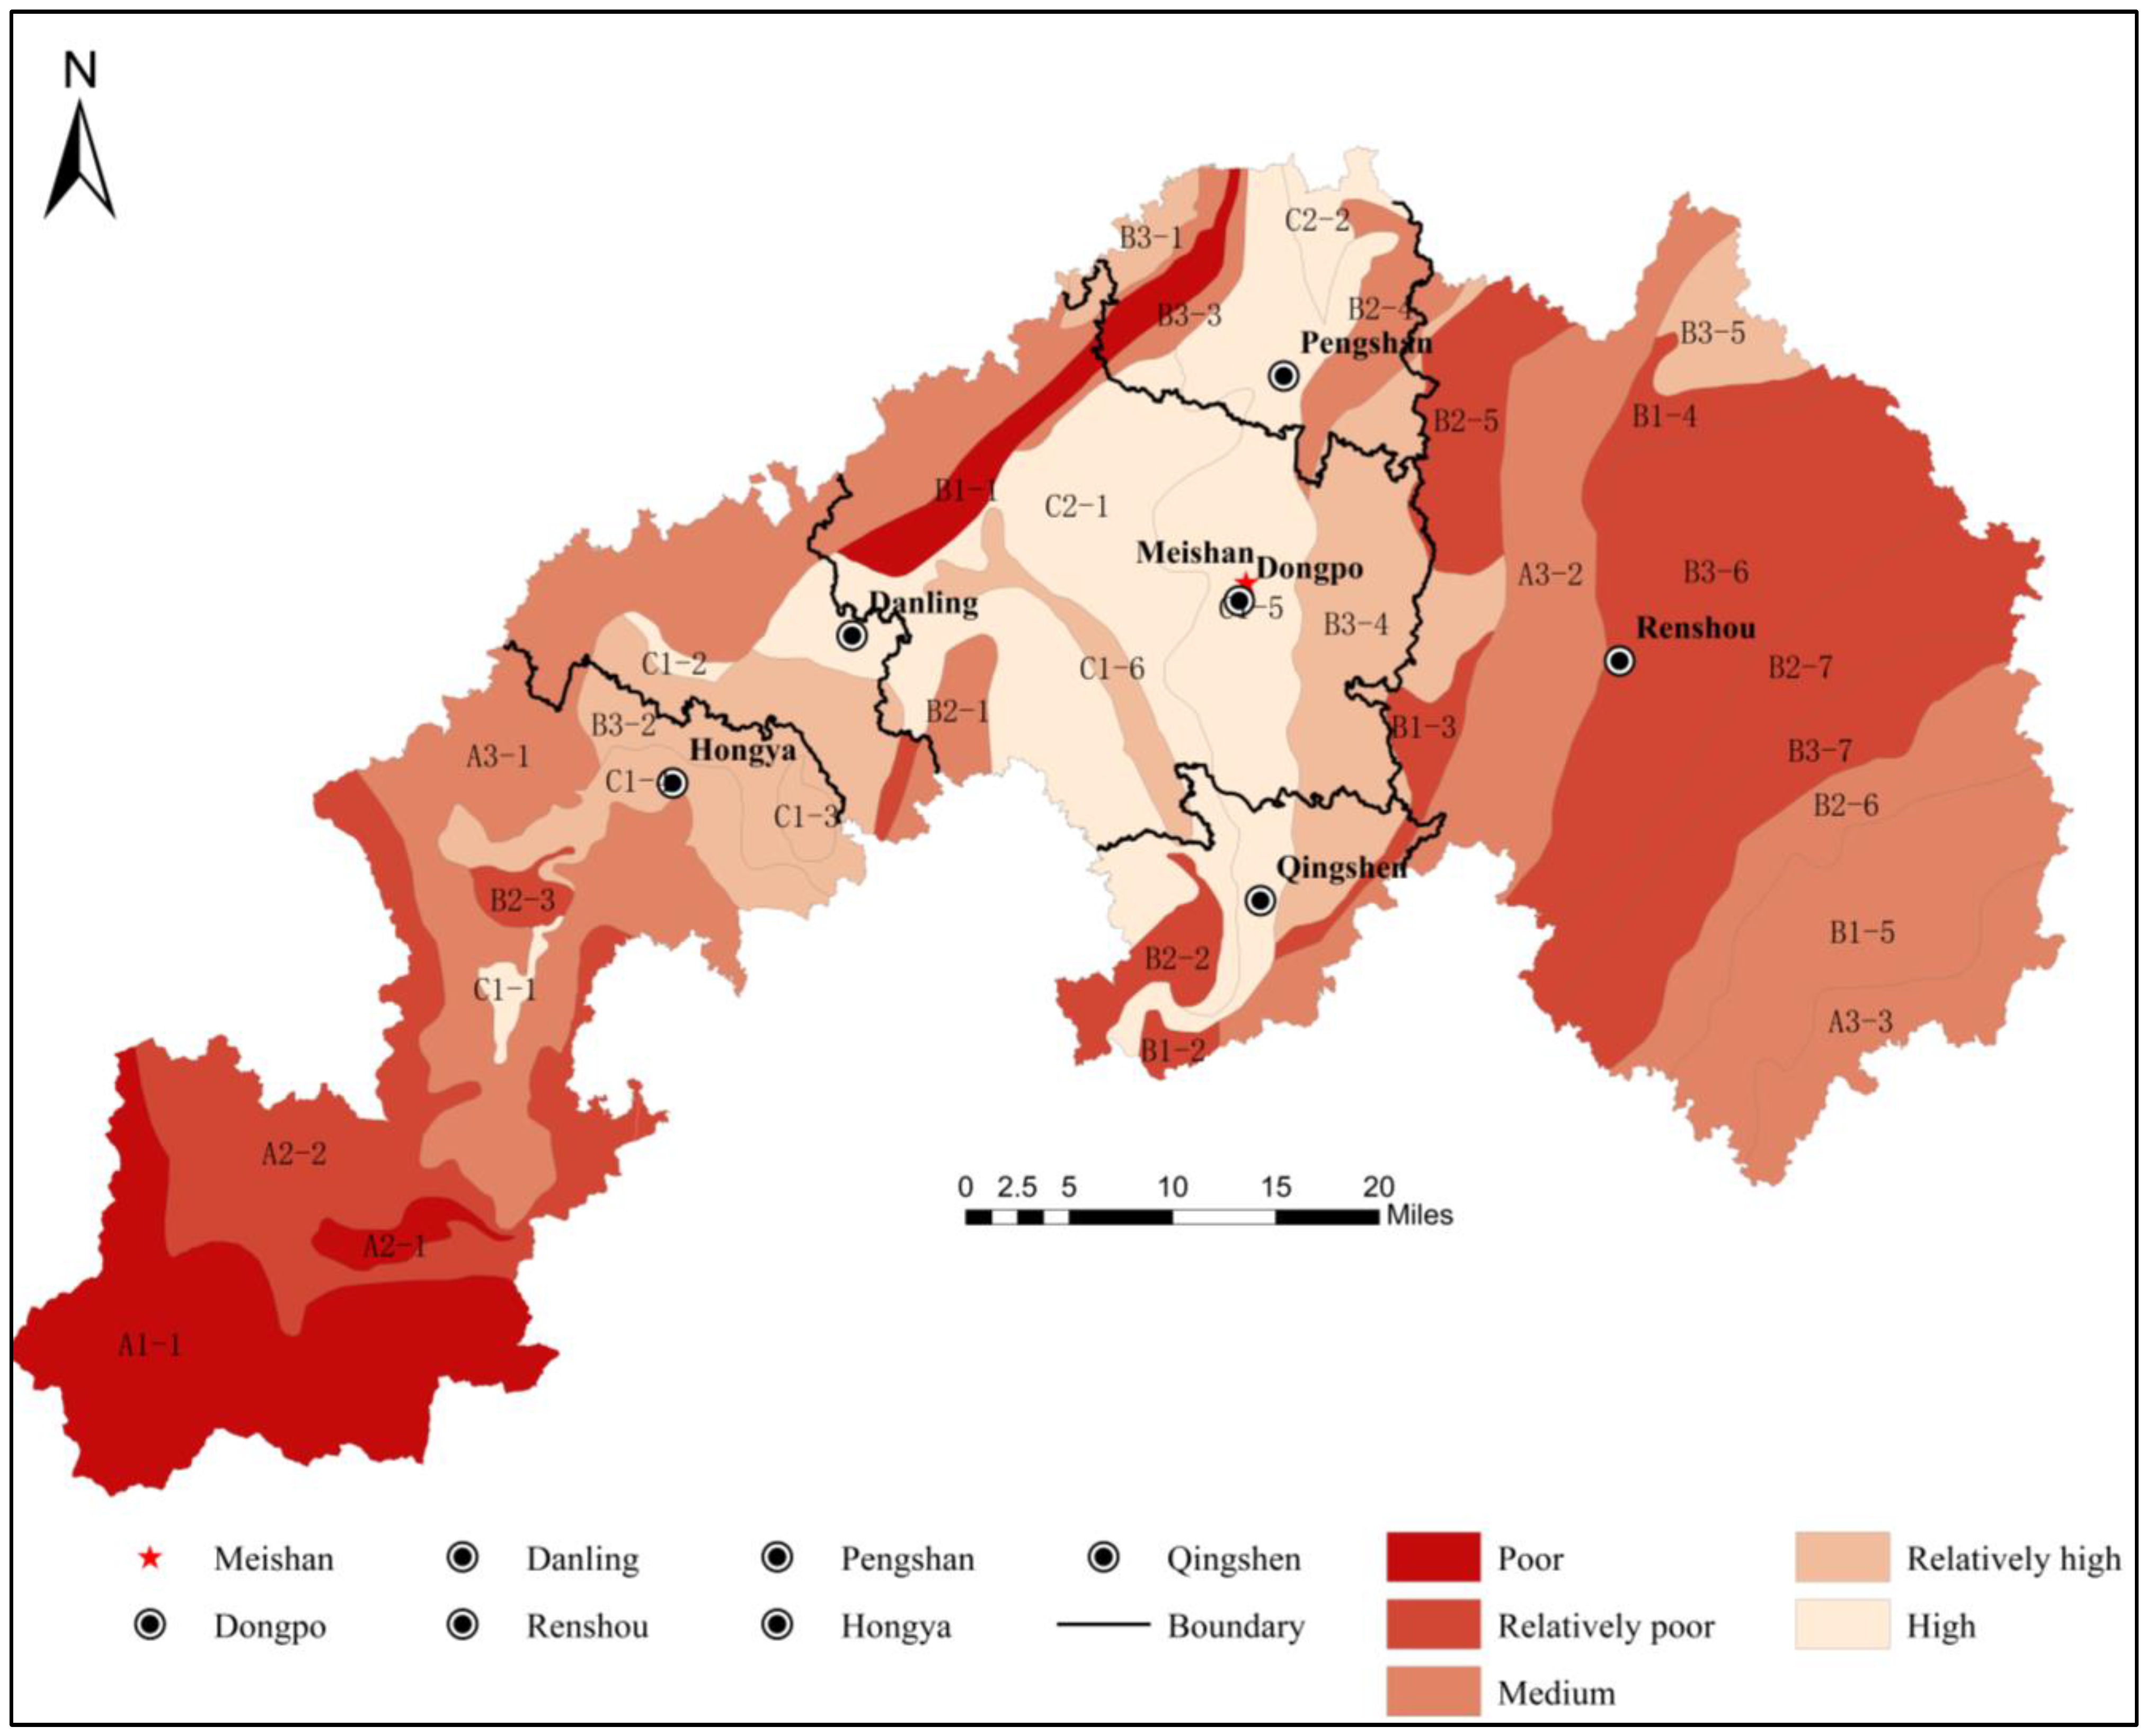
Figure 3 shows that the geo-environmental carrying capacity of each natural unit is consistent with the actual situation of Meishan City as a whole. The units with high carrying capacity are C1-1, C2-1, C1-5, and C2-2, while the units with high bearing capacity are B3-2, C1-3, B3-4, B3-5, and B3-1. The bearing capacity is mainly distributed in units A3-1, B2-4, A3-2, B6-6, B1-5, and A3-3. The regions with poor bearing capacity are distributed in units A2-2, A2-1, B2-3, B1-2, B1-3, B2-5, B3-6, B2-7, and B3-7, with the areas with the poorest bearing capacity being mainly concentrated in units A1-1 and B1-1. According to the comprehensive field investigation, the southwest corner of Meishan City has a greater density of geological disasters, while human activity in the east and some parts of the north-central region is relatively strong. The Geo-environmental carrying capacity in Meishan City is considered poor or in poor condition according to relevant standards, laws, regulations, and policies. The empress area in the eastern garden is subject to mining governance due to the Geo-environmental carrying capacity. The evaluation results obtained using the indicators system chosen in this study accurately describe the geo-environmental carrying capacity of Meishan City.
4.1.3. Geo-Environmental Carrying Capacity of Meishan City Considering Comprehensive Weight
According to the grading standards in
Table 6, the evaluation results of geological bearing capacity of each geomorphic unit in Meishan City are obtained by combining the comprehensive weight calculation, as shown in
Table 9, and
Figure 4 is obtained by using GIS spatial analysis. From the comprehensive analysis of
Table 9 and
Figure 4, it can be seen that the geo-environmental carrying capacity of each natural unit can accurately reflect the actual situation of Meishan city. The regions with high carrying capacity are distributed in c2-1, C1-5, and C2-2 units. The regions with higher bearing capacity are distributed in units C1-4, C1-3, B3-2, C1-6, B3-4, and B3-5. The bearing capacity is mainly distributed in units A3-1, B3-3, B2-4, A3-2, B6-6, B1-5, and A3-3. The poor bearing capacity is distributed in units A2-1, A2-2, B2-3, B2-2, B2-3, B1-3, B2-5, B3-6, B2-7, and B3-7. The areas with poor bearing capacity are mainly concentrated in units A1-1, B1-1, B3-3, and A3-1. Comprehensive field investigation, the Meishan City southwest, the larger density of geological disasters in the north-central region, the east and parts of north-central human activity is relatively strong, the bearing capacity of the geological environment by the relevant standards, laws, regulations, and policies related to being seen as a poor or poor condition, eastern garden. empress area under the condition of mining governance the poor bearing capacity of geological environment. Based on the indicators system selected in this study, the geo-environmental carrying capacity of Meishan City can be accurately described by each natural unit calculated.
By comparing and analyzing the geo-environmental carrying capacity of each geomorphic unit in Meishan City using three weight calculation results and combining field investigation with relevant local laws and policies, it was found that the evaluation results of the subjective weight calculation cannot accurately reflect the geo-environmental carrying capacity of each evaluation unit in Meishan City. While the evaluation results of the objective weight calculation accurately describe the geo-environmental carrying capacity of each evaluation unit in Meishan City, there are inconsistencies in some regions due to relevant experience errors. Combining the subjective and objective weight calculations, the evaluation results can accurately reflect the geo-environmental carrying capacity for each evaluation unit in Meishan City.
Figure 2,
Figure 3 and
Figure 4 support the conclusion that the objective weight is more reasonable, but the evaluation results can be refined by incorporating expert weight information. The intuitionistic fuzzy TOPSIS method with combined weight can objectively and accurately reflect the level of geo-environmental carrying capacity. This method can serve as a supplement to the evaluation method of regional geological environment bearing capacity, providing a reference for evaluating the same regional geo-environmental carrying capacity.
4.2. Evaluation and Analysis of Geo-Environmental Carrying Capacity in Meishan City
After a comprehensive analysis of the evaluation results under the above three weights, the evaluation results of the Meishan geo-environmental carrying capacity determined by the combined weights were taken as the benchmark, and the six counties (district) administrative units in the study area were taken as the basic spatial units to comprehensively determine their geo-environmental carrying capacity grades (
Table 10 and
Figure 4).
After obtaining the distribution data of the geological environment bearing capacity of each geomorphic unit in Meishan City, the scattered geomorphic units are integrated, and the area and percentage of geological environment bearing capacity zones are obtained for statistics, as shown in
Table 11.
(1) Regions with Higher Evaluation Scores: The areas with high geological carrying capacity are located in the central and eastern regions, including the central plain of the Dongpo region and the platform region. Specifically, Pengshan District’s central flat dam, platform, and west hilly area; Pingba area in the middle and north of Qingshen County; Renshou County’s middle and shallow hills in the west; Danlian County’s central and southeast mesa; Hongya County Qingyi River Valley (Pingba); Liujiang Town Pingba; and Yuping Pingba Zone are included. These regions have alluvial (accumulation) plains (flat dams), accumulation platforms, and other landforms with relatively flat topography and a low density of geological hazards. They are an outcrop area of clastic rocks, and there is no karst phenomenon on the surface. Most of these areas are agricultural, with medium-scale urbanization of cities and counties (districts) and strong human engineering activities. Economic construction is more developed in these areas.
(2) Regions with Higher Evaluation Scores: The areas with high geological carrying capacity are located in the central and central north, primarily in the western part of Longquan Mountain and in the hilly eastern region of Dongpo Region. Specifically, Pengshan District’s eastern hilly area; Qingshen County’s east and southwest low mountains and hilly areas; northwest Renshou County’s low hills and hills; and Danlian County’s southeast edge are hilly areas with moderate topography and a low density of geological hazards. These regions are outcropping areas of clastic rocks without karst phenomena on the surface. They are mostly agricultural and ecological areas and play a crucial role in promoting environmental protection, ecological coordination, and undertaking corresponding human engineering activities. These regions should be moderately developed to protect cultivated land and green land.
(3) Regions with Medium Evaluation Scores: The geological environment’s carrying capacity is in the southwest and southeast corners, involving the southeast hills of Renshou County, the southern hilly area of Danlian County, the high school mountain area in the southwest of Hongya County, hills on the north side of the Qingyi River, and hills on the south side of Dongyue Town. The regional distribution of geological environmental carrying capacity is extensive and continuous, and it is also the edge zone of other bearing capacity grades. The land use type is complex, and the problems in the geological environment are relatively prominent, resulting in poor overall stability. Therefore, it is necessary to restrain the adverse effects of social and economic activities, rationally grasp the exploitation of groundwater, control the pollution sources, enhance the adjustment ability of the environment in this region, and strengthen the protection function of carrying capacity in areas with higher carrying capacity.
(4) Regions with Low Evaluation Scores: The regions with poor geological environment bearing capacity are limited to the west of the Zhonggang Mountain-Wawu Mountain and the southeast corner of the region, involving the west of the Dongpo region low mountain belt, central and western Hongya County; Zhongshan and low mountain belt. These regions have undulating terrain, a high density of geological hazards, and are mostly clastic rock outcropping areas, agricultural areas, or forest areas. Some of them are also tourist or mining areas. Human engineering activities are strong, and the density of geological hazards in the southeast corner, which is an agricultural or mining area, is high. However, it is necessary to strengthen the monitoring and management of the areas with a high incidence of geological disasters, limit the ecological areas, and rationally adjust land use planning.
(5) Regions with Lower evaluation results: The poor geo-environmental carrying capacity is located in Hongya County’s southwest corner, in the Wawushan Town Gaoli Village and Gaomiao Town Qiushu Village areas, which are characterized by large terrain fluctuations, a complex mountain environment, obvious soil erosion, and strong human engineering activities. Taken as a whole, the geological environment’s bearing capacity is poor, and although the distribution area is relatively small, the parts carry the Meishan City urbanization infrastructure engineering activities, such as diversity of land use types with significantly low stability, shallow soil vulnerable to disturbance, pollution damage, and high population density, resulting in a fragile natural ecological environment. However, the poor geological environment and carrying capacity of Pengshan District are mainly located at the edge of the Minjiang River. The geological structure of this region is relatively loose, the soil environment is lacking, and it is increasingly influenced by economic activities. In areas with low evaluation scores, it is necessary to strictly control the manner and intensity of land and resource development, strengthen monitoring and prevention, delineate ecological red lines, and promote ecological and environmental governance.
5. Conclusions
In the context of constructing an ecological civilization and promoting sustainable urban development, this study utilized the characteristics of geo-environmental carrying capacity, intuitionistic fuzzy set theory, and entropy TOPSIS method. Through field geological survey, data collection, and indoor graphic processing, the study identified eight evaluation indicators related to geo-environmental carrying capacity. The weight of each indicator datum was analyzed using intuitionistic fuzzy entropy analysis. A complete set of regional geo-environmental carrying capacity analysis framework was established, and Meishan City in southwest China was chosen as a case study. The study concluded that:
(1) The information obtained by converting the intuitionistic fuzzy numbers into the original evaluation indicators can effectively solve the contradiction of overlapping information. (2) By integrating the field survey with the method of this study, the study area was divided into 33 natural units, enabling a more detailed assessment of the carrying capacity of the geological environment. (3) Natural units with high carrying capacity account for 17.27% of the total and are located in the central and eastern parts of the study area. The proportion of natural units with relatively high carrying capacity is 14.07%, located in the central and northern central part of the study area. Natural units with medium carrying capacity account for 31.70% and are mainly located in the west and southeast. Additionally, the high and low carrying capacity shows a significant pattern of spatial differences.
In summary, to improve the carrying capacity of the geo-environment, several aspects can be addressed. Firstly, geo-environmental monitoring and assessment should be strengthened, requiring more geo-environmental monitoring stations and better monitoring equipment. Secondly, stricter environmental protection regulations should be formulated to protect the geo-environment and ecosystems. This may include restrictions on pollutant emissions and mining activities, among others. Thirdly, support and encouragement should be given for scientific and technological innovation to improve the accuracy and reliability of geo-environmental carrying capacity assessment. Finally, coordination and cooperation among government departments should be strengthened to achieve better policy formulation and implementation.
This study not only provides techniques and methods for regional geo-environmental carrying capacity evaluation but also provides a scientific basis for regional land use development and social and economic development for geological environment safety. Additionally, the coordination between geo-environmental carrying capacity and sustainable urban development, as well as the interaction mechanism between geo-environment and energy consumption, require further discussion.


