Article

Predictive Choropleth Maps Using ARIMA Time Series Forecasting for Crime Rates in Visegrád Group Countries

Doctoral School of Regional and Economic Sciences, Szechenyi Istvan Egyetem, Egyetem Ter, 9026 Gyor, Hungary
*
Author to whom correspondence should be addressed.
Sustainability 2023, 15(10), 8088; https://doi.org/10.3390/su15108088
Submission received: 12 March 2023 / Revised: 3 May 2023 / Accepted: 12 May 2023 / Published: 16 May 2023
(This article belongs to the Special Issue Urban Safety and Security Assessment)

Abstract

:
Geographical mapping has revolutionized data analysis with the help of analytical tools in the fields of social and economic studies, whereby representing statistical research variables of interest as geographic characteristics presents visual insights. This study employed the QGIS mapping tool to create predicted choropleth maps of Visegrád Group countries based on crime rate. The forecast of the crime rate was generated by time series analysis using the ARIMA (autoregressive integrated moving averages) model in SPSS. The literature suggests that many variables influence crime rates, including unemployment. There is always a need for the integration of widespread data insights into unified analyses and/or platforms. For that reason, we have taken the unemployment rate as a predictor series to predict the future rates of crime in a comparative setting. This study can be extended to several other predictors, broadening the scope of the findings. Predictive data-based choropleth maps contribute to informed decision making and proactive resource allocation in public safety and security administration, including police patrol operations. This study addresses how effectively we can utilize raw crime rate statistics in time series forecasting. Moreover, a visual assessment of safety and security situations using ARIMA models in SPSS based on predictor time-series data was performed, resulting in predictive crime mapping.

1. Introduction

The fact that the world is now a global village that is extensively interconnected can be credited to digitalization, which has been a major instigator of transformations in many areas of life. Smart data analytics and informatics (artificial intelligence in specialty applications) are primary tools supporting digitalization and are taught in academia and discussed in research across multiple fields of study. Countries have evolved, incorporating digital innovation and tools in industries, healthcare, public governance, entertainment, education, travel, logistics, agriculture, banking, safety, and security, and are passionate about being smart in business as well as in public administration. Urban safety and security are pressing societal problems. Nowadays, we can see the integration of many data-driven insights into planning, forecasting, and managing urban safety and security. For instance, the authors of [1,2] point out several aspects involved in solving urban safety problems, e.g., social, technological, administrative, urban, and societal.
We have a keen interest in the integration of data analysis and smart analytics into public safety administration. Such findings can be deployed to enhance the presentation, promotional analysis, planning, forecasting, and management of urban safety and security problems [3]. As such, a vital exercise would be focusing on the geographical distribution of crime intensity in particular countries using crime statistics. Moreover, this can be extended into predictive crime analysis and mapping, taking social statistics (where unemployment is in the analysis scope of this study) into account as an influencing factor in geographical safety and security assessment. Unemployment arises from social disorganization in the community. This is elaborated on in later sections to justify the broader scope of the subject; here, we are focusing on the urban nexus of crime in the community and unemployment [4,5]. Many studies indicate the importance of crime rates in security decision making and planning. There is always a need for the integration of widespread data insights into unified analyses and/or platforms for administrative assessments. Furthermore, the quest to apply such data analysis and modelling techniques to planning will help with future visualizations.
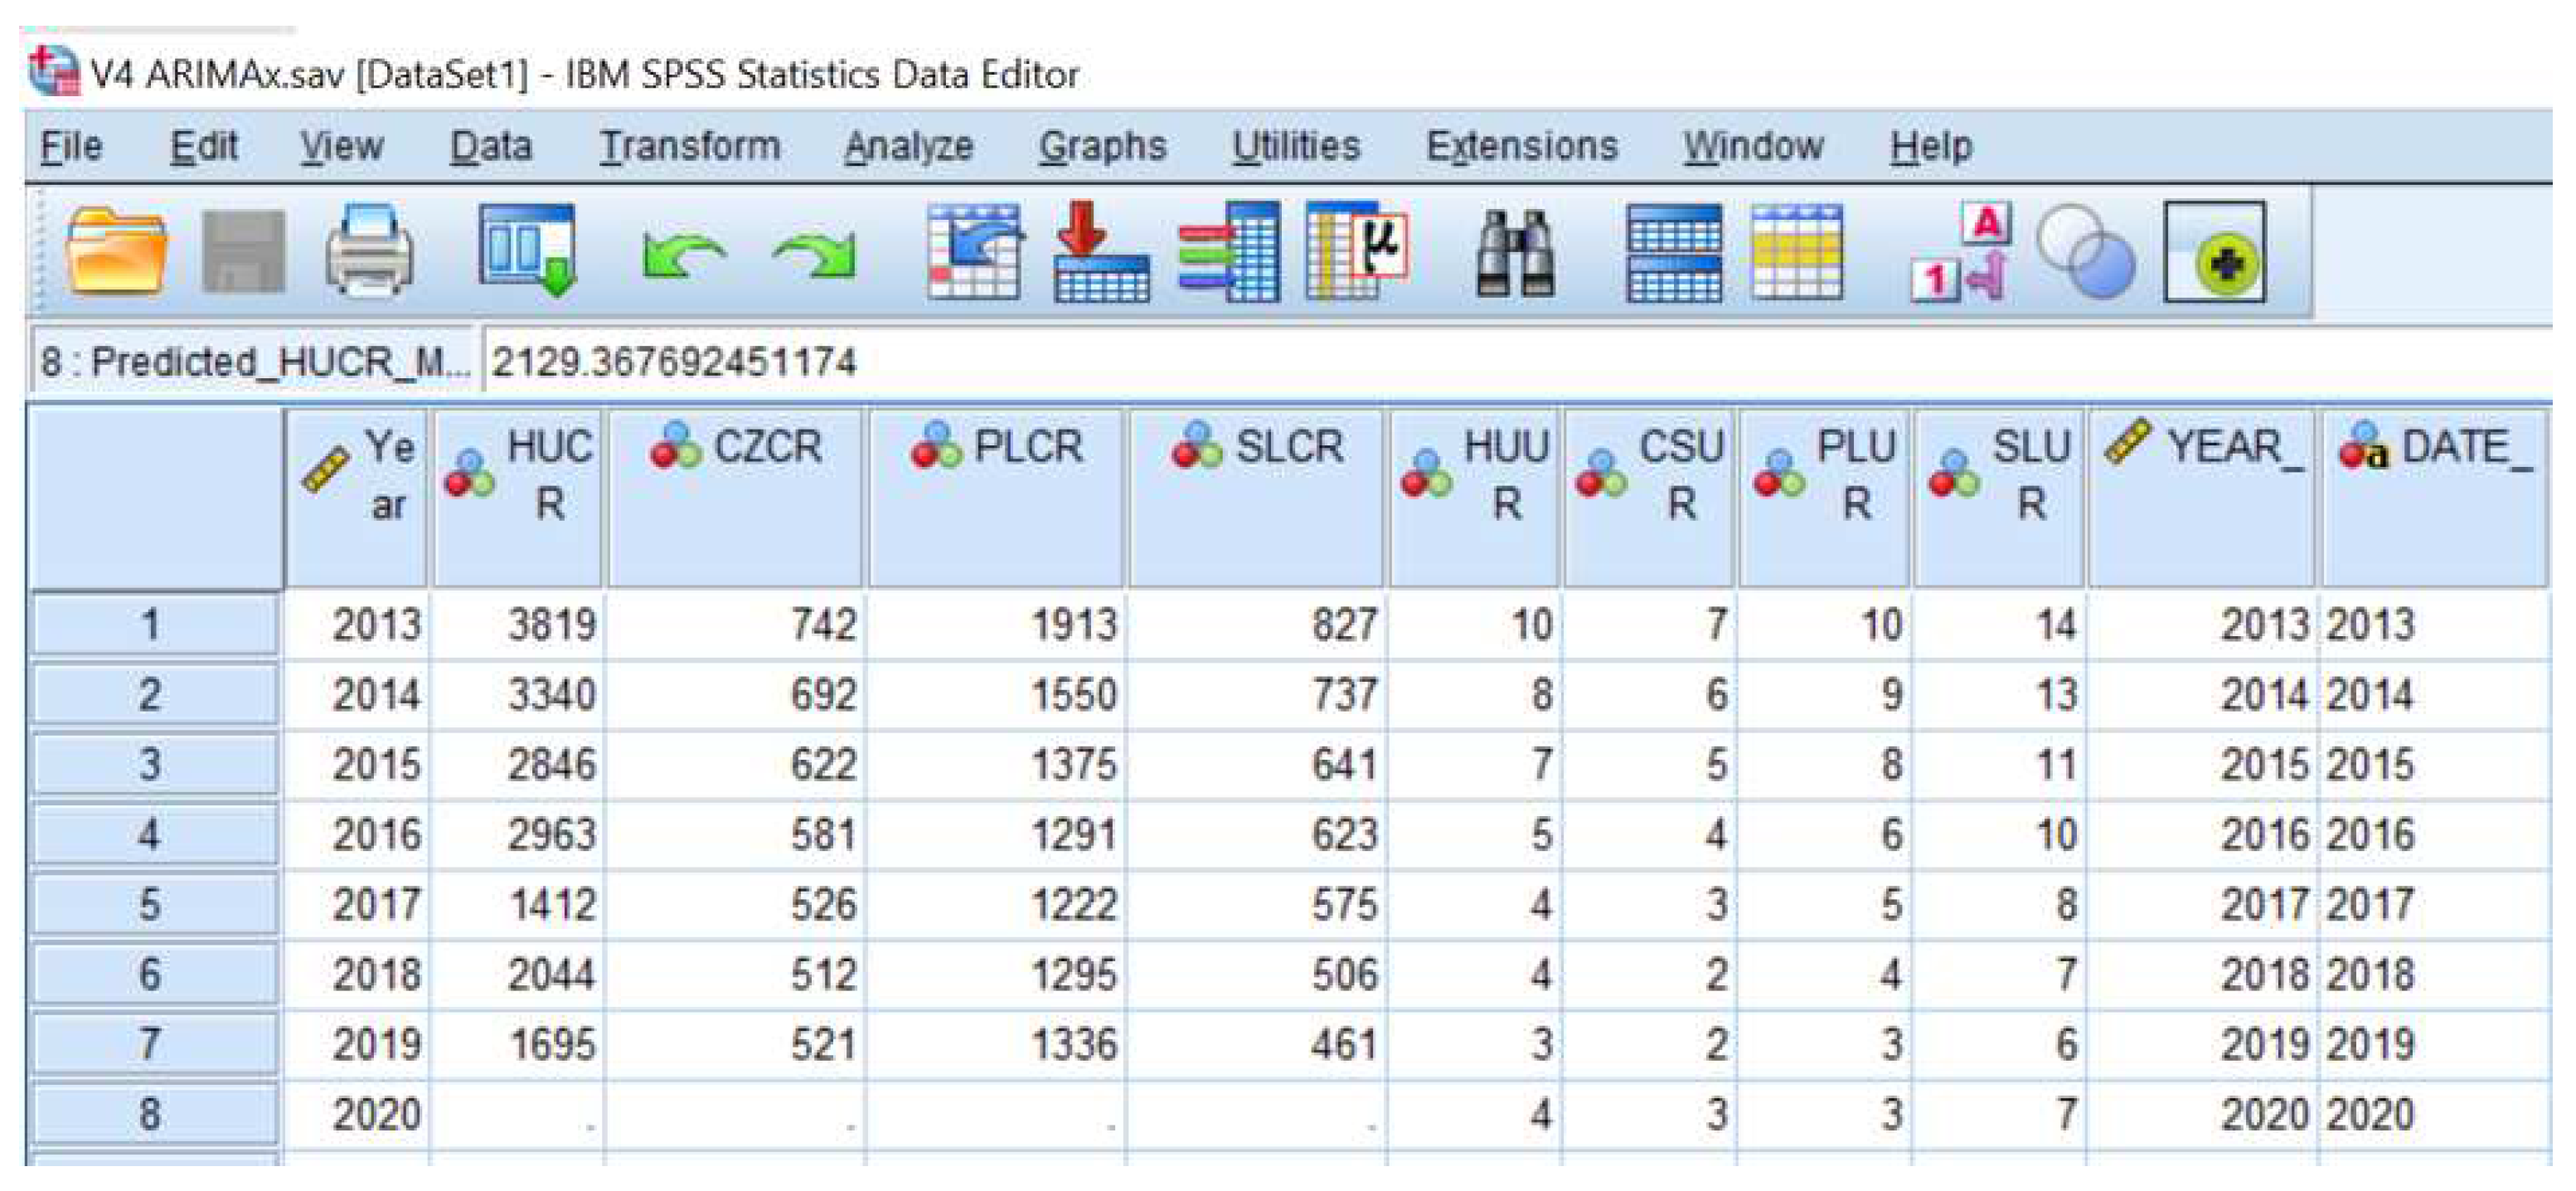
The results of this study would not only be easy to apply to planning, but would help make future predictions and geo-characteristic models based on selected variables using QGIS. This study addresses how effectively we can utilize crime rates and time-series forecasting using autoregressive integrated moving average (ARIMA) models in SPSS based on a predictor time series, which in this study is the unemployment rate.
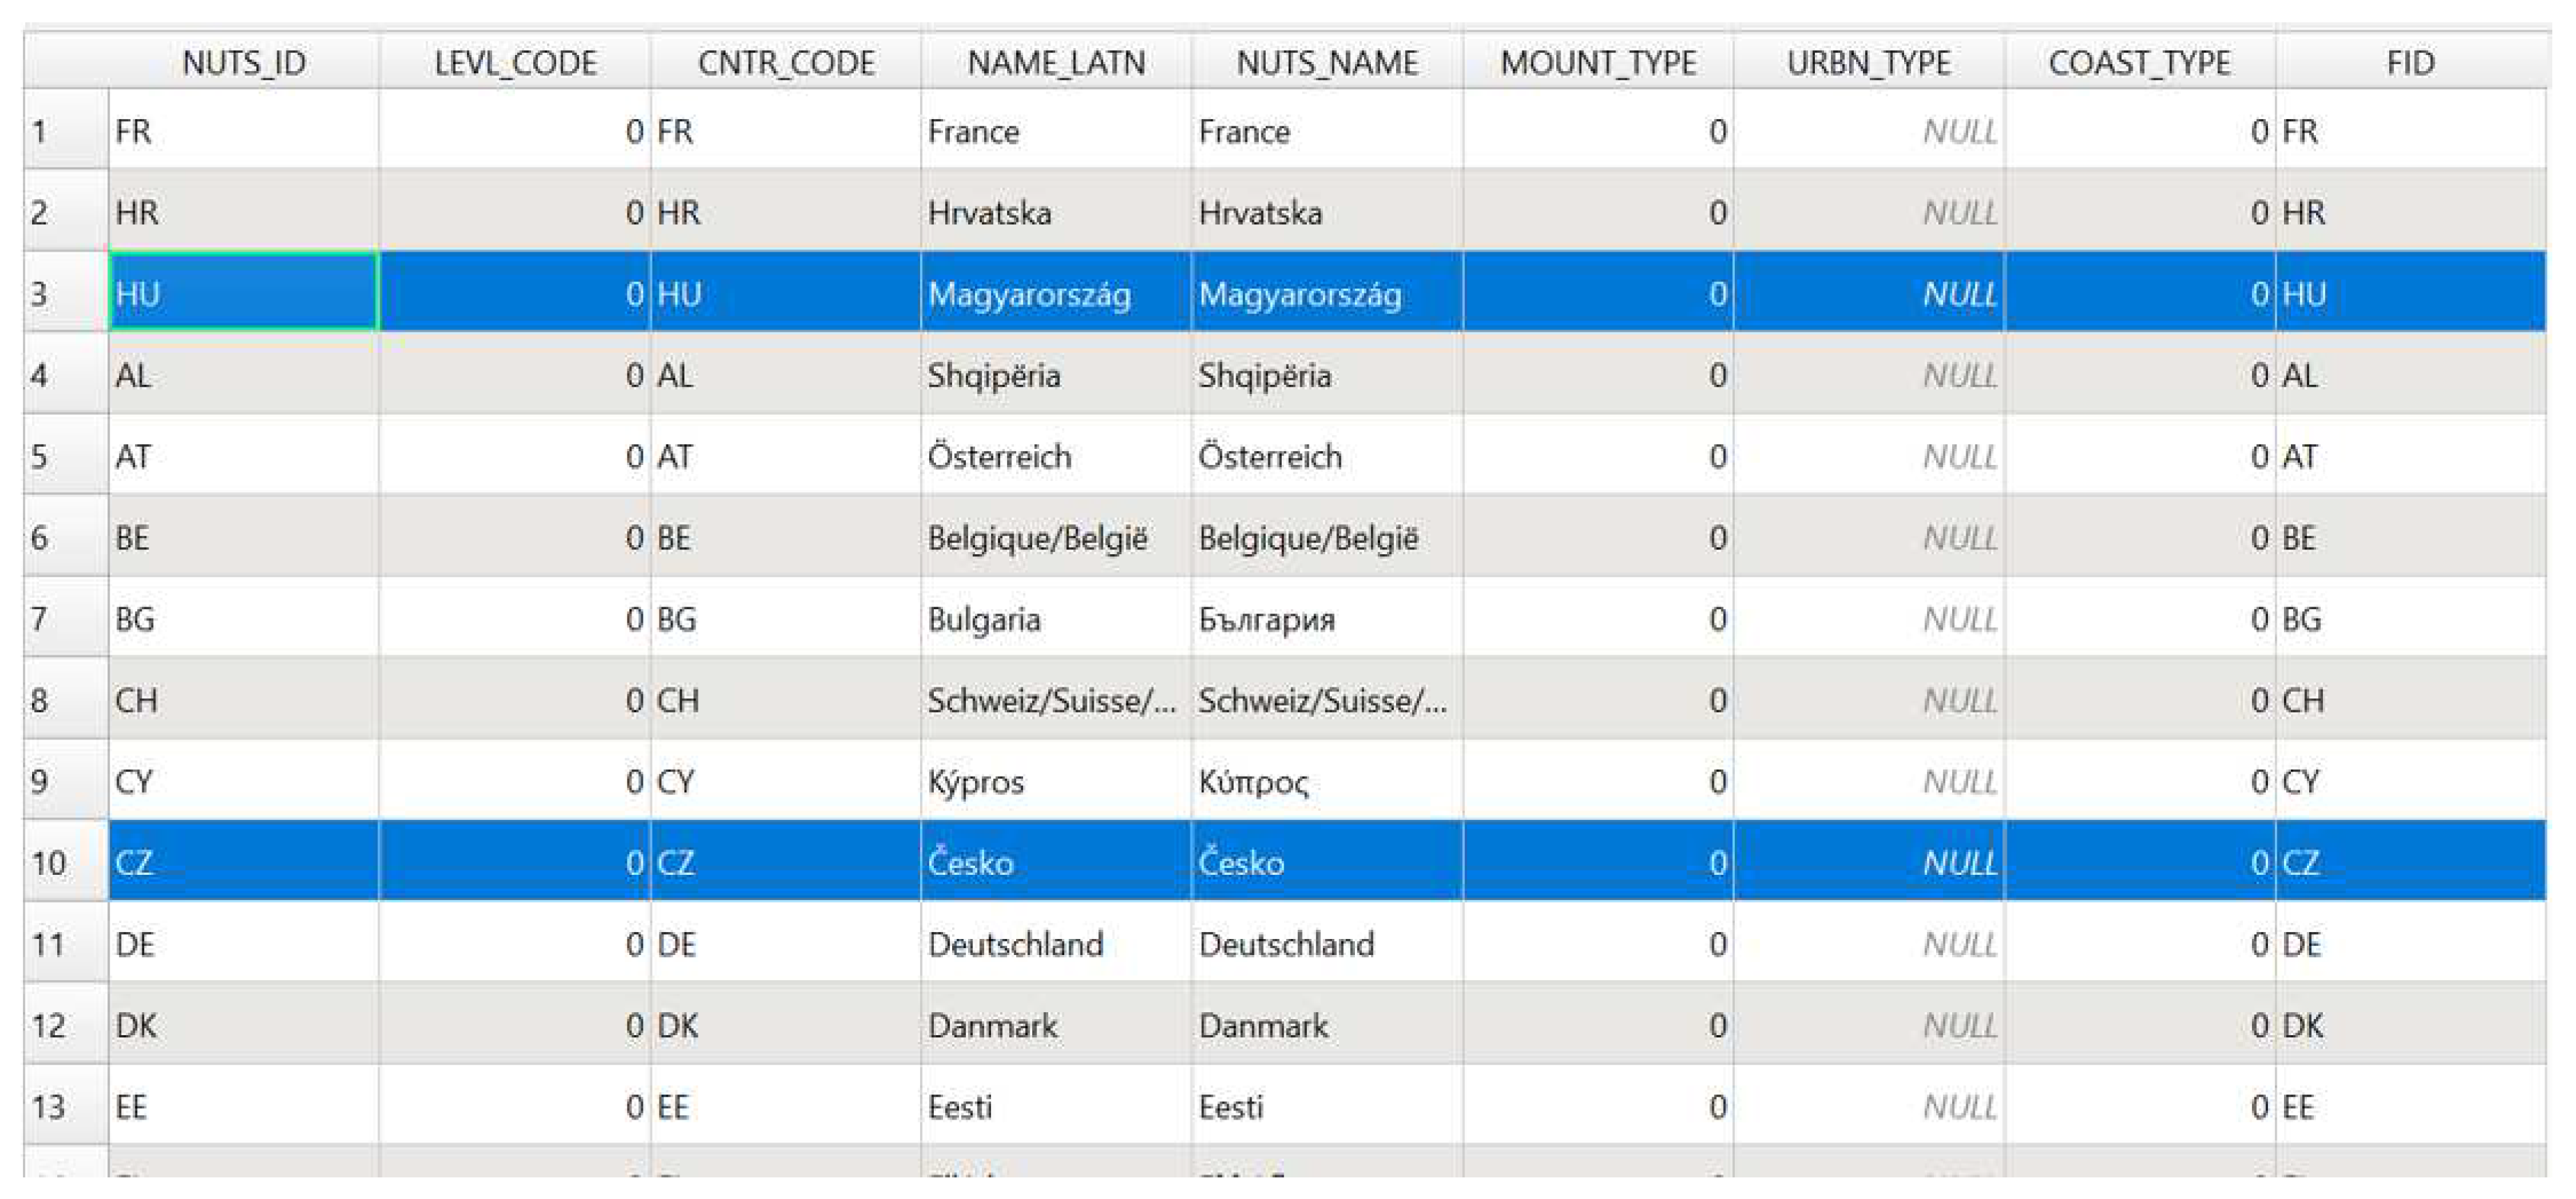
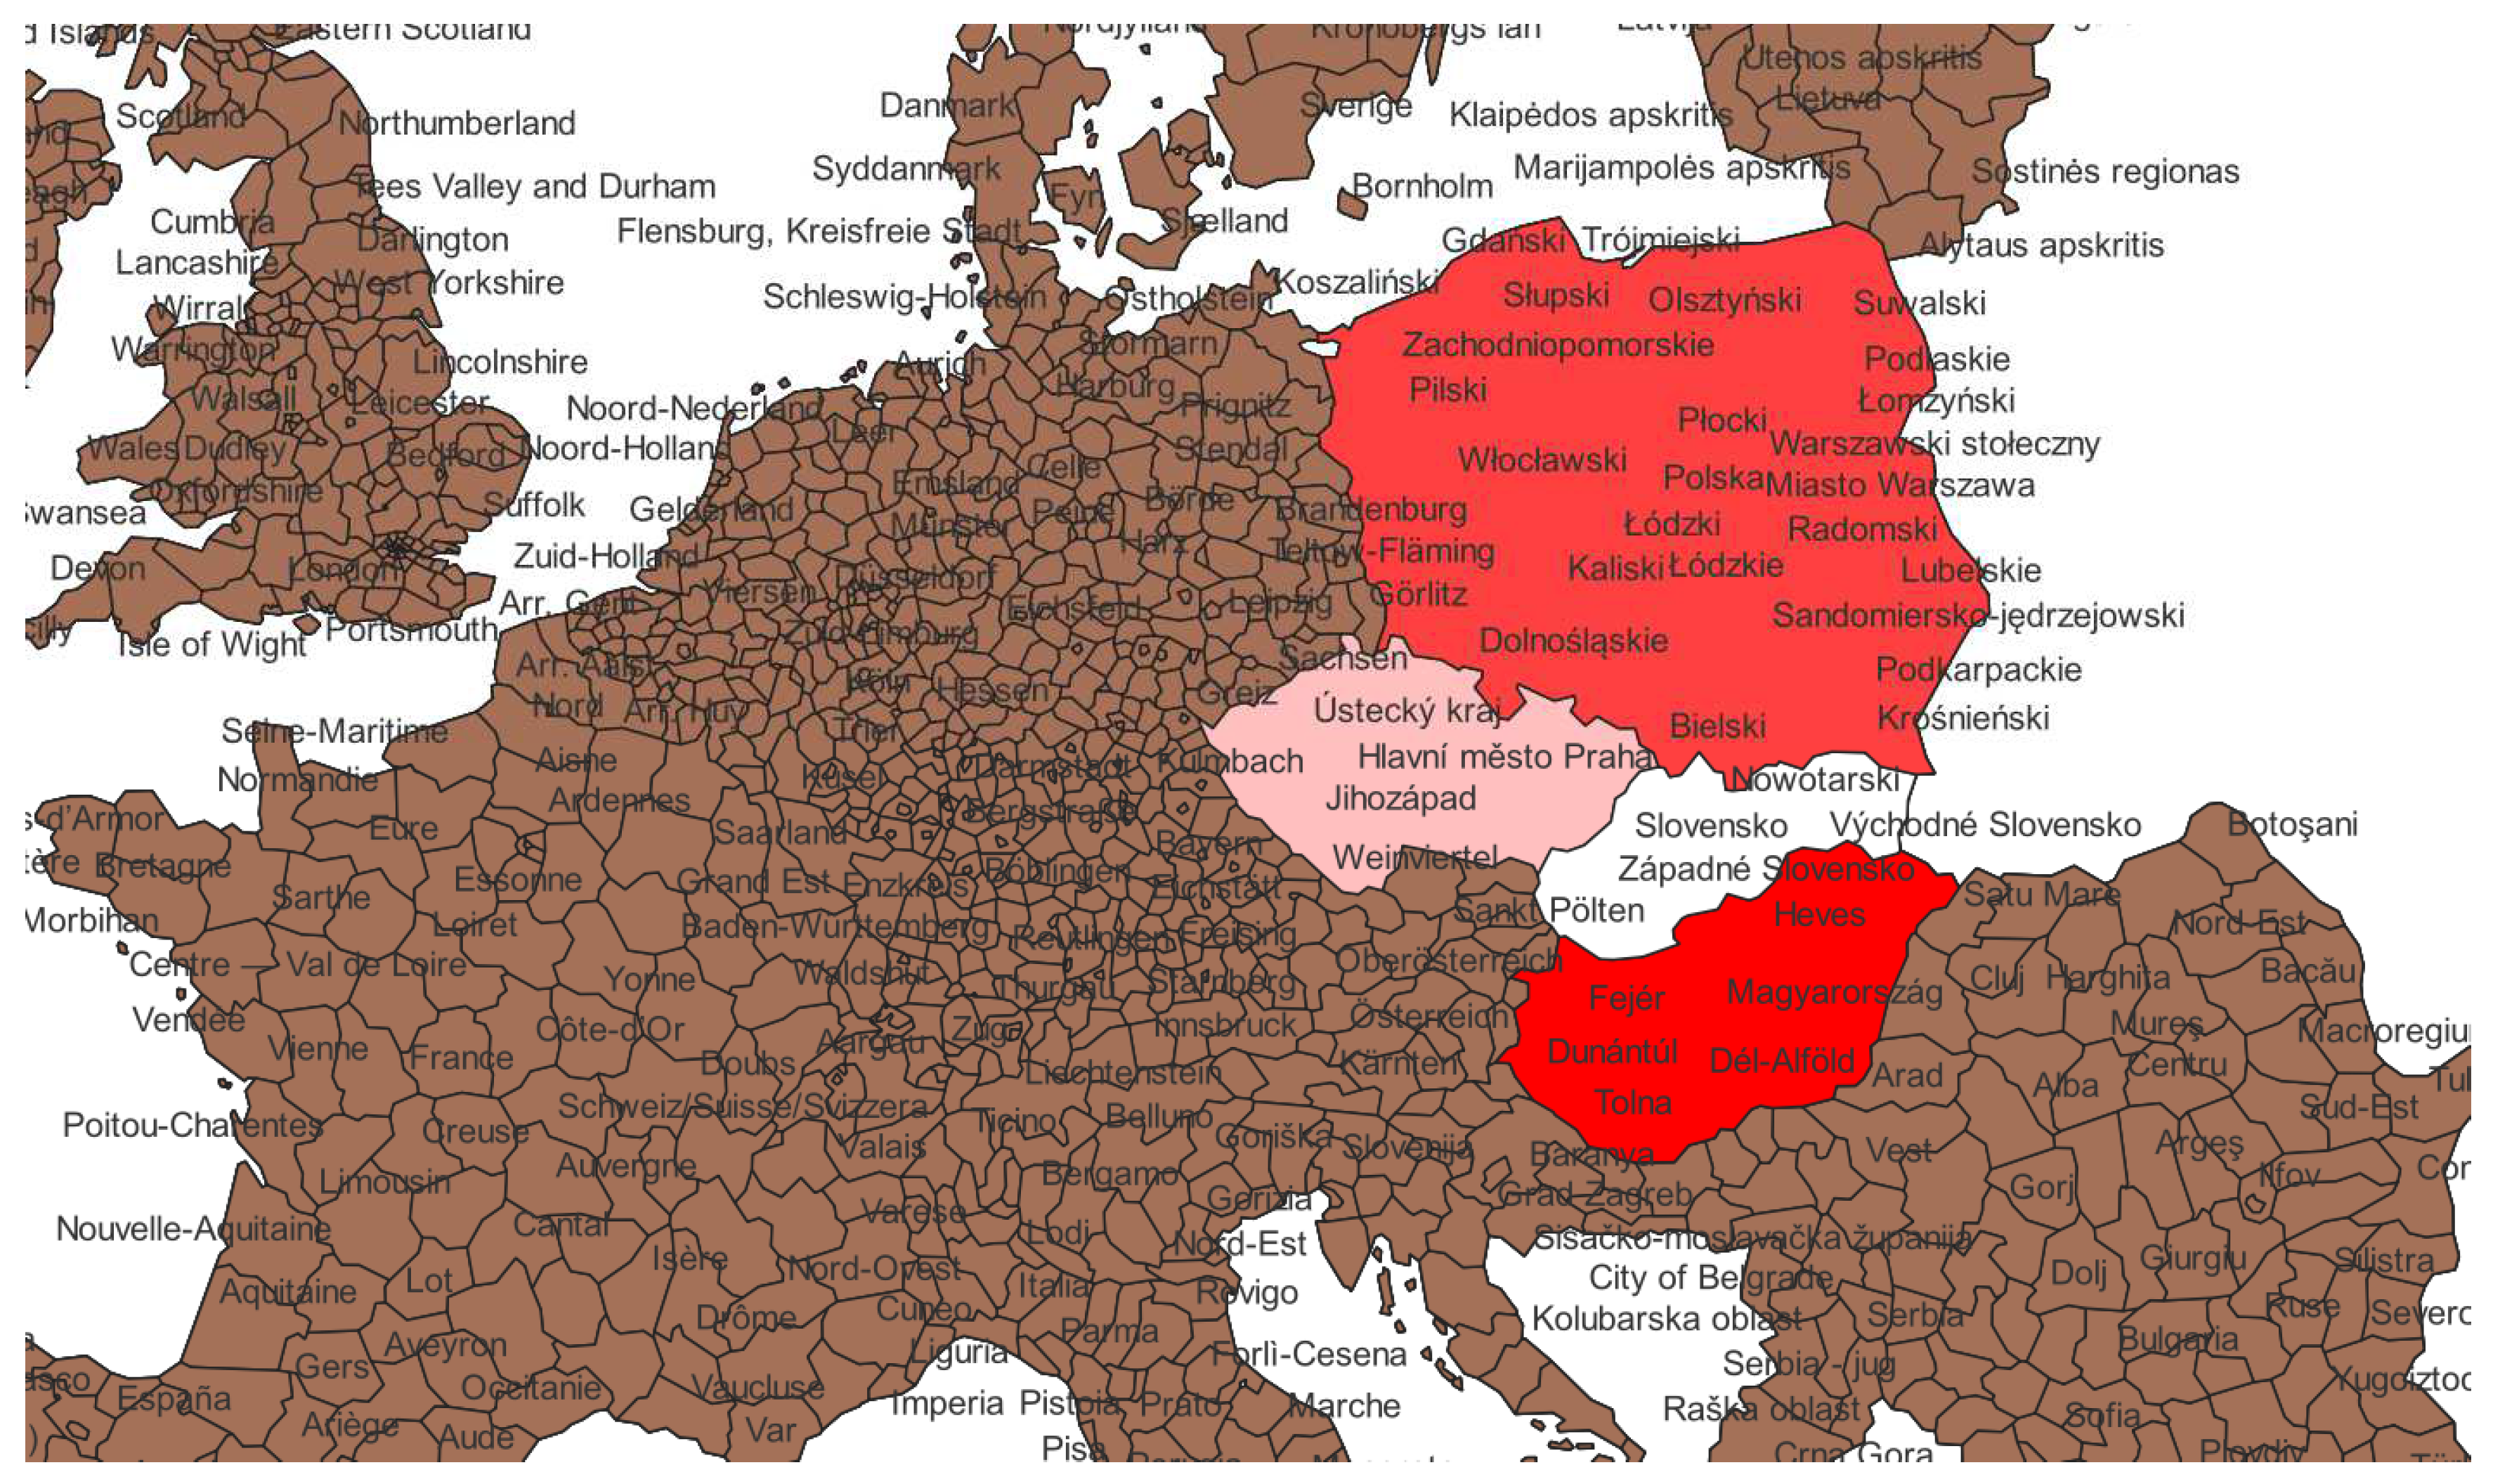
As part of the literature review, we review predictive analyses regarding crime data statistics and methods. This study contributes towards filling the gap in the geographical and data heat map representation of predicted crime rates in V4 countries. The tools to be used are QGIS, taking advantage of secondary data from official police portals, crime statistical resources, and World Bank indicators regarding unemployment. We have found a strong relationship between the crime rate and the unemployment rate in the V4 countries Hungary, Czech Republic, Slovakia, and Poland.
ARIMA models are specialized regression models with two parts: AR (autoregressive) and MA (moving averages); independent variables (unemployment rate) or terms are used as lags to the dependent time series (crime rate). Autocorrelations within the time series based on the past values of the dependent series as a transfer function of the independent series are used to predict future values. However, SPSS needs the predictor values in the period of the forecast for the predicted variable. The authors of [6] discussed a specialized crime mapping program based on GIS spatial mapping. “Spatial statistics in itself is an emerging field” (p. 53), combining a visual and creative analysis with spatial data exploration.

1.1. Brief Methodological Review of the Literature

This study is a part of the research investigating complex problems such as the identification of hotspots via isolation based on the predicted values in a certain area (county, city, country, or region). For example, the authors of [7] have identified some computational methods for crime hotspot identification. The main algorithms used in the literature are time-series prediction methods—SPSS, R, and other modelling software. Another method is K-means clustering, which provides clusters within a range of values to segregate high- and low-risk areas based on the crime rate (or, for instance, to predict sales, consumer demand, and high/low sales areas). That is a helpful method when many areas of analysis are under observation.
Visualization also plays an important role. We have adopted QGIS software for the professional mapping of crime in the four countries being analysed, i.e., the Czech Republic, Hungary, Poland, and Slovakia in 2020. We have taken the data for yearly crime rates from cited sources for 2013–2019. The unemployment rates are for 2013–2020 (SPSS needs the predictor variable values to predict the dependent variable at the prediction phase of the time series, i.e., 2020 crime rates). This can help not only with security administration in a particular area; with more in-depth data, more insights could be obtained to improve law and order in a particular area [7]. It is worth mentioning the limitations of statistical objectivity in terms of crime categorization in a certain region. The willingness of the public to report crimes leads to the further categorization of crime statistics into reported, recorded, cleared, and prosecuted and convicted crimes. The police and community dynamics play a vital role in all steps of criminal procedures and prosecution. Moreover, there are subjective factors when dealing with crimes that include public perception, police effectiveness, fear among the public, law and order, public awareness, and more [8].
The authors of [9] applied ARIMA models along with other contemporary time series prediction and/or forecasting methods in case-based scenarios for security applications, indicating the need for such forecasting in the security administration to deliver the best public services with limited resources. For that, we need efficient and needful resource allocation where there is a need. As the authors of [10] also mention, such insights are very beneficial for police and military units. The authors of [11] analysed the differences between multi- and univariate ARIMA models, indicating the wide usage of such forecasting models and how these functions work. The authors of [12] extended the use of time series forecasting in advanced algorithms of machine learning as ARIMA and seasonal ARIMA into traffic forecasting, combining the models to discuss seasonality.
The authors of [13] discussed the constraints when carrying out studies where crime statistics are involved. The phrase “reported crime” or “crimes known to the police” is used instead of overall crime in police statistics as a good basis for a crime index (sometimes along with statistics on the whole process of penalization, depending on the nature of the study). Methodological considerations are of concern in this regard, which have been supported by many contemporary data analysis methods [14] in recent studies, but still with some limitations—for instance, when conventional crime indexes per 100,000 population normal values for crimes ((total recorded/pop) × 100,000) are constructed. However, we have to question the significance of scaling and the use of such conventions in less populated urban areas [6,15]. There are also many studies that emphasize time series analysis by data computing methods, which can be practiced on various secondary data sources such as crime and public safety surveys [16]. The authors of [17] explain some geospatial insights using open-access data visualization tools. The authors of [18] discussed the importance of underlying crime rate analysis since increased figures in a city hinder economic activity and immigration. The crime rate also has emotional implications for locals and newcomers. The authors of [6,19,20] also highlight such implications from crime, emphasizing the promotion of analysis and the need for the standardization of both data and survey-based indicators of crime indexes to cater to the interests of stakeholders in public safety and security. Furthermore, it is important to compare the seasonality and non-seasonality-based forecasting methods ARIMA and GPF-ARIMA (Geographic probability method: a new geographic/spatial time series method introduced by [21] as the most suitable forecasting method with the lowest scaling error) [9]. However, more sophisticated data and spatial probability models using kernel density functions are needed, which could be a novel extension to the findings of this article.
The data-based situational assessment of public safety and security using forecasting models leads to the re-organization and modernization of old-fashioned administrative systems and platforms. In this era of visual communication, it is not practical for the general public (as informed users of information) or the decision makers (advanced users of information) to dig into large data sheets to identify areas of concern [22,23,24]. Instead, data models should use socioeconomic factors (unemployment rate) and stack them onto the raw data (crime and population statistics). However, we have identified challenges and limitations in public data integration. The cleansing of the data and the standardization of the units of analysis need special attention prior to data input into the forecasting and mapping tools.
This study concerns future innovations in urban safety and security administration and monitoring systems. It concludes by creating a system for the development and diffusion of new technology in ongoing project operations and processes. The authors of [23,25] emphasized advancement-driven monitoring, control, and strategic resource allocation planning based on scenario change analysis [26]. This study proposes that such findings be added to industrial and governmental system modifications and rollouts as part of a security policy for crime prevention, thereby aiding problem solving in regions of concern [1,8,27,28]. In any country, these safety and security reforms and data insights are important, as is addressing other socioeconomic problems. However, the nature of the other variables may vary considering regional, cultural, legal, political, and institutional mores and capabilities [29,30].
In addition, the technological advancement and upgrading of pre-existing public safety and security structures are useful. Statements of support from UN organizations and agencies for these initiatives can be translated into urban security advancements, unified crime, and analysis. As the authors of [31,32] discussed, fighting crime is important to ensure public safety.
The focus of this study is on the data aspect of predictive public safety and security assessment using a predictive time series analysis and choropleth mapping. The research objectives are summarized as follows, in line with the research questions.

1.2. Research Objectives

(1) To review contemporary data forecasting models to collate predictive insights from the segregated crime rate data using the unemployment rate as a socioeconomic factor.
(2) To propose ARIMA-based crime forecasting models and geographical mapping integration to achieve urban administrative forecasting, decision support, and proactive assessment in terms of public safety and security.

1.3. Research Questions

(1) What are the most practical contemporary data forecasting models for collating predictive insights from the segregated crime rate data, using dependency on the unemployment rate as a socioeconomic factor?
(2) How can we practically use publicly available raw data statistics for decision support and monitoring? Moreover, this study addresses public data limitations and emphasizes the need for practical integration into urban safety and security monitoring platforms.

2. Materials and Methods

2.1. Purpose of Simulation

This study proposes that a critical foresight tool be used for emergency and resource management. This analysis helps extract predictive crime patterns, aiding in decision making for crime control and in resource management for urban safety and security. It can be suitable in time series of any sort, predicted based on past values and future values of predictors as a transfer function, as discussed in the problem statement.

2.2. Necessary Inputs

  • Crime rate data (Table 1);
  • Unemployment rate data (Table 2);
  • Shape files for EU NUTS 0-1 for V4 countries [18,33];
  • Excel files for SPSS in percentages for the unemployment rate, and recalculated per 100,000 of population crime rates [28,34,35].
Based on the transfer function established for the independent series (unemployment rate), we can obtain a corresponding predicted value for the dependent series for each estimated model. Figure 1 shows the list of variables and the data table for all the V4 (Visegrád Group) countries, hereinafter called V4, i.e., PL: Poland, HU: Hungary, SL: Slovakia, and CZ: Czech Republic). The CR abbreviation is used for crime rates. UR is the abbreviation for the unemployment rate.
In the second step (Figure 2), we set up dates for the time series data from 2013 to 2019, and the yearly data variable is declared against each entry.
Here, Visegrád group countries are analysed to predict the crime rates in 2020 based on past crime rates and unemployment rates. Below, we present the correlation and regression analyses for the crime rate and unemployment rate datasets to present evidence for the relationship between variables in Table 3 and Table 4.
Collinearity statistics are presented for the correlation analysis in Table 3. We merged the tables for four separate linear correlations (Pearson’s correlation), in which each country’s crime rate is correlated with the unemployment rate. Therefore, in a single model for each country, we deal with only one independent variable. That eliminates multicollinearity as VIF = 1 for each model in the analysis. However, for ease of representation, we merged the four models into one table (Table 3, Table 4, Table 5, Table 6, Table 7 and Table 8, including ARIMA modelling).

2.3. Definition and Rationale of the Simulation Tools

2.3.1. IBM SPSS V26

IBM SPSS V26 is best for in-program time series modelling, as the user interface directs easy specifications for the parameters required in the basic modelling of ARIMA and other time series models. We can easily import Excel datasets into the program, change the variable specifications, and save the output in graphs, tables, and figures.

2.3.2. QGIS Desktop 3.22.3

QGIS Desktop 3.22.3 is open-source and easy to use, with basic functions and a basic user interface. Many tutorials and source files are available due to the open-source design of the shape files. Easy import and linking functions allow one to input the data into maps, generating heat or choropleth maps for data visualization. Layers can be segregated into NUTS 0, NUTS 1, NUTS 2, and NUTS 3 levels as per the levelling of organization of geographical boundaries. (Regions, countries, counties, and cities, respectively).

3. Results

The ARIMA/Expert Modeler option is used to specify a custom ARIMA model in SPSS. This involves explicitly specifying autoregressive and moving average orders and the degree of differencing. One can include independent (predictor) variables and define transfer functions for any or all of them. One can also specify the automatic detection of outliers or an explicit set of outliers. Estimation and forecast periods are important in analyses. For a given dependent variable, the true estimation period is the period remaining after eliminating any contiguous missing values of the variable occurring at the beginning or end of the specified estimation period.
ARIMA models are run on errors in the autocorrelations as in ACF/PACF residual graphs. Lags in the regressor time series are used to adjust errors in autocorrelations [11]. We used ARIMA (0,1,0), with a difference of 1 in the autocorrelation of the dependent time series and a lag of 1 for the independent time series using square root transformation, as specified in SPSS.
Ŷt − ϕ1Yt − 1 = μ − θ1et − 1 + β (Xt − ϕ1Xt − 1)
Thus, the AR part of the model (and also the differencing transformation, if any) is applied to the X variable in exactly the same way as it is applied to the Y variable before X is multiplied by the regression coefficient. This effectively means that the ARIMA model is fitted to the errors of the regression for Y on X (i.e., the series “Y minus beta X”). We adopted a (0, 1, 0) model due to the predicted values based on predictor time series values based on the transfer function in the ARIMA (0,1,0) model; also, with the series being nonstationary, it is recommended to not define P and Q terms. In addition, we have not discussed seasonality due to the short time series samples and yearly data. So, the equation would be as below, where μ is the slope of the transfer function:
Ŷt = μ + Yt − 1 + β (Xt − (Xt − 1))),
with dependent Y and independent X time series.
Based on the transfer function declared for the independent series (unemployment rate), we obtained a corresponding predicted value for the dependent series for each estimated model. Table 3 shows the list of variables and the data table for all the V4 (Visegrád Group) countries.
In the second step, we set up the dates for the time series data from 2013 to 2019 and a yearly data variable against each entry in the dataset in SPSS. Crime rate is the dependent variable, and the unemployment rate is an independent variable. Visegrád group countries were analysed to predict the values of crime rates in 2020 based on past crime rates and unemployment rates.
Then we selected the “Analyse” option in the SPSS toolbar to generate the specific time series model. Analyse > Forecasting > Create Traditional Model > Expert Modeler > ARIMA (0,1,0). We obtained the predicted values for each set of variables for all four countries one by one and saved them in the data table. We repeated these steps for all four countries using the respective CR (crime rates) and UR (unemployment rate) values.
We obtained separate forecasting models for all four countries, as seen in Table 6 and Table 7. For each model, forecasts started after the last available value in the range of the requested estimation period and ended at the last period for which values for all the predictors were available or the end date of the requested forecast period, whichever was earlier. In the ARIMA model, we had R-squared values that were different from the linear regression due to the specified transfer function (Equations (1) and (2)) in the forecasting model. We obtained forecast values as shown below.
Predicted values are the model-predicted values. One can save model predictions, confidence intervals, and residuals as new variables in the active dataset. Each dependent series gives rise to its own set of new variables, and each new variable contains values for both the estimation and forecast periods. New cases are added if the forecast period extends beyond the length of the dependent variable series. One can choose to save new variables by selecting the associated save tick box for each. By default, no new variables are saved (Figure 3).
  • Hungary, HU; R-squared value, 0.22; the predicted crime rate for the year 2020: 2129;
  • The Czech Republic, CZ; R-squared value: 0.374; the predicted crime rate for the year 2020: 498;
  • Slovakia, SL; R-squared: 0.020; the predicted crime rate for the year 2020: 420;
  • Poland, PL; R-squared: 0.934; the predicted crime rate for the year 2020: 1410.
The authors of [36] emphasized the role of crime prediction using ARIMA in determining seasonality based on monthly or weekly data from the past as part of their prescriptive analyses. There is greater accuracy with better computational tools, algorithms, and learning. It depends on how in-depth the data are [37]. The authors of [38] adopted survival analyses based on spatiotemporal (continuous time model) crime data. Based on this prediction, the model has been used to deploy forces to patrol areas, efficiently reducing the incident response time. However, survival analyses are aided by high-end programming support.
The authors of [39] presented ARIMA-based modelling as a quantitative technique to predict types of crimes as well as incident time and location. The data provided by local police departments could be more detailed to help with analyses. The authors of [40] stated that time series analysis is the best tool for analysing quantitative data predictions over time, employing the autoregressive integrated moving average (ARIMA) [41]. It has been used for several forecasting tasks in production, economics, and marketing. In this study, it is emphasized as a critical foresight tool to be used in emergency and resource management. The authors of [33,37,42] employed data mining and exponential smoothing ARIMA to extract different usage patterns and improve forecasts, thereby aiding decision making in crime control. ARIMA [43,44] with the model specifications given above ensures accuracy based on the moving average-based model after processing for categorical attributes [45].
For professional use, one needs map shape file packages with the exact territories. In the EU, we use the NUTS system to compare and draw territorial boundaries (Figure 4, Figure 5 and Figure 6).

4. Discussion

Safety and security are generally defined as being free from risks and hazards about which a community might feel fear. The administrative challenge is to address such factors and facilitate redress while understanding the social criminological reasons behind crime. For instance, the deprivation of a certain social class and inequity in the justice system make some people feel powerless [46,47]. These conditions generate bias and disruptive forces such as unemployment. As the authors of [48,49] elaborate, the spread of bad behaviour in neighbourhoods can lead to a chain of criminal activities, as stated by “the broken window theory.” This article, however, discusses how such social factors relate to crime rates. Moreover, the data generate insights that can help us address societal problems—for instance, algorithm-based dashboards and visualizations of data.
Perception is central to the discussion of cultural narratives, understanding of the self, mental states, etc. In this research context, perception is what a community feels and understands regarding practical measures in terms of technology and policy making by stakeholders to improve safety and security. Public policy determines an intervention in response to a social need, and innovation helps with the development of responsive measures using social and technological tools. Predictive data-based analyses and visualizations aid in addressing complex social problems [50,51].
Keeping the scope of this research article in mind, we attempted to include a diverse set of concepts directly or indirectly related to crime statistics or the broader field of criminology. Social dilemmas of such a scale present challenges and limitations as well as opportunities in research; it is important to break problems down into smaller possible chunks to reduce the complexity [52]. This article fills a research gap in terms of predictive analysis and the conceptual alignment of crime rate statistics with social reasons. We applied this problem-solving approach to highlight the importance of crime data in technological advancement and the upgrading of existing public security structures, administration, informed decision making, and understanding crime data analytics. As the authors of [53] argue, data platforms and systems play a role in the holistic framework of public safety and security.
The limitations of this study include a lack of information systems that make use of abundant data with composite characteristic variables; for that, complex analytics is crucial. The cognitive, cultural, behavioural, and regional attributes of community and crime face representational challenges in terms of dark data (the unprocessed and nonuniform abundance of data). Open-access, comprehensive geospatial criminal data and access are rare.
This study should motivate researchers in the subject domain to incorporate more data analyses in case-based studies rather than simple descriptive statistics. This practice makes the research more innovative, insightful, interpretable, and wide-ranging for audiences and stakeholders. An extension of the research might be assessing the contribution of data-based insights and considering their integration into smart security and governance. Data depth is a challenge, as more detailed time series data can produce more insights and smoother results for predicted periods (for instance, monthly and weekly records and rates). Depending on the type of data (e.g., sales, customer visits), one could even acquire daily data. However, for macroeconomic indicators, as in this study, yearly values are most used and publicly available, and we opted for the economic indicator of unemployment as a predictor of the crime rate. Of course, there were many factors that could have been used as crime predictors, and we look forward to including those factors in future studies. For instance, we plan to include some of the survey variables in criminal analyses as part of understanding community perceptions of public safety in V4 countries.

5. Conclusions

Crime is a reason for social conflict and unrest; it mainly constitutes nonconformity of behaviour in a certain society and causing harm to others. Criminology is a discipline in the social sciences that characterizes crimes and facilitates the formulation of a framework to see patterns in crimes. It includes the study of criminal characteristics and behaviours, the nature of the crime, and categories. The most contemporary objectivist approach in criminology is to identify the criminal patterns, considering unforeseeable patterns to anticipate these events and identify seasonality and hotspots [6,54]. The complexity of dealing with the enormous amount of information delivered each day has made it imperative to apply information mining strategies. The ARIMA model is one such technique to identify patterns in crime rates by depending on past values.
This article elaborates on the utility of crime data analysis, indicating the predictive capability of raw statistical analysis and social variables associated with urban safety and security. This article makes use of crime rates and unemployment rates and demonstrates a relationship between social, demographic, and criminal data records using a model in SPSS. The model shows promising results in relation to crime rates and unemployment, as mentioned in Section 3, using correlation and regression analysis. The predicted values retrieved from the ARIMA model are then loaded into QGIS along with the shape files of the Visegrád group countries. Further processing of data for geographic mapping is performed in QGIS based on the predictive values from the SPSS model. The results show predictive visualization in terms of choropleth maps. We recommend an extension of this study in the future. For instance, yearly, monthly, and daily regular patterns can be distinguished and forecasted depending on the depth and details of the data and an in-depth understanding of the model. Additionally, some predictors, such as the unemployment rate, inequality in education, the number of police officers per 100,000 people, and others are related to crime, safety, and security.
Moreover, this study contributes to geographical situational and forecasting assessments for public safety and security. Visuals based on statistics deliver information in a more comprehensible way to the public as well as to law enforcement agencies. However, maintaining data integrity and transparency are some associated challenges when reporting data based on facts. This study elaborates on data forecasting and choropleth mapping using EU regional datasets from official resources as secondary data sources. Furthermore, we have identified challenges and limitations in public data integration, whereby data cleansing standardization into the units of analysis needs special attention prior to the data being inputted into the forecasting and mapping tools. These challenges might be more complex for multidimensional data and platform integration practices. We recommend extensions to this study in the abovementioned cases because the upgrading of pre-existing public safety and security structures is essential due to rapid technological advancements. Moreover, we must ensure the use of technologically enhanced surveillance practices (TESPs) in maintaining law and order.
This study encourages innovation in urban safety and security administration and monitoring systems. We emphasize advancement-driven monitoring, control, and strategic resource allocation planning based on scenario change analysis. We propose that the findings be taken into account in regional government system modifications when formulating security policies for crime prevention. Such practices could aid problem solving in regions of concern. These safety and security reforms and data insights can address a wide variety of socioeconomic problems and their interactions at the domestic and regional levels of administration. However, the magnitude and nature of the variables may vary due to regional, cultural, legal, political, and institutional preferences, as well as policies and capabilities.

Author Contributions

Conceptualization, U.G., P.T. and F.D.; methodology, P.T.; software, U.G.; validation, U.G., P.T. and F.D.; formal analysis, U.G.; investigation, U.G. and P.T.; resources, U.G., P.T. and F.D.; data curation, U.G., P.T. and F.D.; writing—original draft preparation, U.G.; writing—review and editing, U.G., P.T. and F.D.; visualization, U.G. and P.T.; supervision, P.T. and F.D.; project administration, F.D.; funding acquisition, F.D. All authors have read and agreed to the published version of the manuscript.

Funding

This research was funded by Széchenyi István University, 9026 Győr, Egyetem Square 1, under Publication Grant Application Reference 044PTP2023 as part of the university publication support program regarding the coverage of APC. Furthermore, university affiliation and publication platforms shall support the indexing of this article in bibliographic profiles and records.

Institutional Review Board Statement

Not applicable.

Informed Consent Statement

Not applicable.

Data Availability Statement

Data are contained within the article as indicated in the analyses (refer to the sources mentioned for the tables and figures, where relevant). Furthermore, data available in a publicly accessible repository that does not issue DOIs are also used, as publicly available datasets and statistical records were analysed in this study. These data can be found in the references.

Acknowledgments

Support from SZEEDSM Doctoral School’s management, faculty, and advisors.

Conflicts of Interest

The authors declare no conflict of interest.

References

  1. Tulumello, S. The multiscalar nature of urban security and public safety: Crime prevention from local policy to policing in Lisbon (Portugal) and Memphis (the United States). Urban Aff. Rev. 2018, 54, 1134–1169. [Google Scholar] [CrossRef]
  2. Dupont, B.; Wood, J. Urban security, from nodes to networks: On the value of connecting disciplines. Can. J. Law Soc. Rev. Can. Droit Soc. 2007, 22, 95–112. [Google Scholar] [CrossRef]
  3. Kounadi, O.; Ristea, A.; Araujo, A.; Leitner, M. A systematic review on spatial crime forecasting. Crime Sci. 2020, 9, 7. [Google Scholar] [CrossRef] [PubMed]
  4. Altindag, D.T. Crime and unemployment: Evidence from Europe. Int. Rev. Law Econ. 2012, 32, 145–157. [Google Scholar] [CrossRef]
  5. Hipp, J.R. Assessing crime as a problem: The relationship between residents’ perception of crime and official crime rates over 25 years. Crime Delinq. 2013, 59, 616–648. [Google Scholar] [CrossRef]
  6. Levine, N. Crime Mapping and the Crimestat Program. Geogr. Anal. 2006, 38, 41–56. [Google Scholar] [CrossRef]
  7. Kóczy, L.T.; Kovács, G.; Földesi, P.; Nagy, S.; Tüű-Szabó, B.; Fogarasi, G. Crime “Hot-Spots” Identification and Analysis in Hungary by Computational Intelligence. Acta Polytech. Hung. 2019, 16, 137–155. [Google Scholar] [CrossRef]
  8. Ghani, U.; Toth, P.; Fekete, D. Incorporating Survey Perceptions of Public Safety and Security Variables in Crime Rate Analyses for the Visegrád Group (V4) Countries of Central Europe. Societies 2022, 12, 156. [Google Scholar] [CrossRef]
  9. Gorr, W.; Olligschlaeger, A.; Thompson, Y. Short-term forecasting of crime. Int. J. Forecast. 2003, 19, 579–594. [Google Scholar] [CrossRef]
  10. Seif, J.B. Microcomputer based interactive analysis of univariate and multivariate ARIMA models. In Proceedings of the 17th Conference on Winter Simulation, San Francisco, CA, USA, 11–13 December 1985; pp. 143–149. [Google Scholar]
  11. Bowman, C. Traffic Forecasting: A Hybrid Approach Using Simulation and Machine Learning. Available online: https://www.informs-sim.org/wsc19papers/282.pdf (accessed on 2 March 2022).
  12. Kury, H. Postawy punitywne i ich znaczenie [Punitive attitudes and their meaning. In Mit Represyjnos’ci Albo o Znaczeniu Prewencji Kryminalnej; Czapska, J., Kury, H., Eds.; Zakamycze: Krakow, Poland, 2002. [Google Scholar]
  13. Šelih, A.; Završnik, A.; Gorkič, P.; Kanduč, Z. Crime and Transition in Central and Eastern Europe; Springer: New York, NY, USA, 2012. [Google Scholar]
  14. Soh, Y.W.; Koo, C.H.; Huang, Y.F.; Fung, K.F. Application of artificial intelligence models for the prediction of standardized precipitation evapotranspiration index (SPEI) at Langat River Basin, Malaysia. Comput. Electron. Agric. 2018, 144, 164–173. [Google Scholar] [CrossRef]
  15. Oag.ca.gov. Available online: https://oag.ca.gov/sites/all/files/agweb/pdfs/cjsc/stats/computational_formulas.pdf (accessed on 3 May 2023).
  16. Vijayarani, S.; Suganya, E.; Navya, C. Crime Analysis and Prediction Using Enhanced Arima Model. Journal Homepage. 2021. Available online: www.ijrpr.com (accessed on 2 March 2022).
  17. Fuqua School of Business. ARIMA Models with Regressors. Available online: https://people.duke.edu/~rnau/arimreg.htm (accessed on 2 March 2022).
  18. Background—NUTS—Nomenclature of Territorial Units for Statistics—Eurostat. Available online: https://ec.europa.eu/eurostat/web/nuts/background (accessed on 2 March 2022).
  19. Map Generator—GISCO—Eurostat. Available online: https://ec.europa.eu/eurostat/web/gisco/gisco-activities/map-generator (accessed on 2 March 2022).
  20. Huddleston, S.H.; Porter, J.H.; Brown, D.E. Improving forecasts for noisy geographic time series. J. Bus. Res. 2015, 68, 1810–1818. [Google Scholar] [CrossRef]
  21. Klepinger, D.H.; Weis, J.G. Projecting crime rates: An age, period, and cohort model using ARIMA techniques. J. Quant. Criminol. 1985, 1, 387–416. [Google Scholar] [CrossRef]
  22. Slootweg, R.; Vanclay, F.; Schooten, M. ‘Function evaluation as a framework for the integration of social and environmental impact assessment’. Impact Assess. Proj. Apprais. 2001, 19, 19–28. [Google Scholar] [CrossRef]
  23. Evans, M.C.; Cvitanovic, C. An introduction to achieving policy impact for early career researchers. Palgrave Commun. 2018, 4, 88. [Google Scholar] [CrossRef]
  24. Little, R.G. ‘Holistic strategy for urban security’. J. Infrastruct. Syst. 2004, 10, 52–59. [Google Scholar] [CrossRef]
  25. Edler, J.; Kuhlmann, S.; Smits, R. New Governance for Innovation. Gov. Int. J. Policy Adm. 2003. [Google Scholar]
  26. Kennedy, L.W.; Caplan, J.M.; Piza, E. Risk Clusters, Hotspots, and Spatial Intelligence: Risk Terrain Modeling as an Algorithm for Police Resource Allocation Strategies. J. Quant. Criminol. 2011, 27, 339–362. [Google Scholar] [CrossRef]
  27. Nam, T.; Pardo, T.A. Smart city as urban innovation: Focusing on management, policy, and context. In Proceedings of the 5th International Conference on Theory and Practice of Electronic Governance, Tallinn, Estonia, 26–28 December 2011; pp. 185–194. [Google Scholar]
  28. Ahmad, A.; Ahmad, T.; Ahmad, M.; Kumar, C.; Alenezi, F.; Nour, M. A complex network-based approach for security and governance in the smart green city. Expert Syst. Appl. 2020, 214, 119094. [Google Scholar] [CrossRef]
  29. Baumgartner, F.R.; Jones, B.D.; Wilkerson, J. Comparative studies of policy dynamics. Comp. Political Stud. 2011, 44, 947–972. [Google Scholar] [CrossRef]
  30. Ghani, U.; Toth, P.; David, F. A Comparative Review on Public Safety And Security Indicator(s) Gaps in Smart Cities’ Indexes. In Proceedings of the 12th IEEE International Conference on Cognitive Infocommunications (CogInfoCom), Online, 23–25 September 2021; pp. 621–630, ISBN 978-1-6654-2494-3. [Google Scholar]
  31. Misra, M. Planning Sustainable Cities: Global Report on Human Settlements 2009. Int. J. Environ. Stud. 2011, 68, 579–584. [Google Scholar] [CrossRef]
  32. Tumalavičius, V.; Veikša, I.; Načisčionis, J.; Zahars, V.; Draskovic, V. Issues of the state and society security (Part I): Ensuring public security in the fight against crime. J. Secur. Sustain. Issues 2017, 6, 401–418. [Google Scholar] [CrossRef] [PubMed]
  33. NUTS—GISCO—Eurostat. Available online: https://ec.europa.eu/eurostat/web/gisco/geodata/reference-data/administrative-units-statistical-units/nuts (accessed on 2 March 2022).
  34. ILOSTAT. ILOSTAT Data Tools to Find and Download Labour Statistics. Available online: https://ilostat.ilo.org/data/ (accessed on 15 March 2023).
  35. Unemployment, Total (% of Total Labor Force) (Modeled ILO Estimate). Worldbank.org. Available online: https://data.worldbank.org/indicator/SL.UEM.TOTL.ZS (accessed on 15 March 2023).
  36. Cowell, B. Crime Mapping & Analysis News (Issue 4, Fall 2015). National Policing Institute, 18-Nov-2015. Available online: https://www.policinginstitute.org/publication/crime-mapping-analysis-news-issue-4-fall-2015/ (accessed on 2 March 2023).
  37. Mukhopadhyay, U.; Skjellum, A.; Hambolu, O.; Oakley, J.; Yu, L.; Brooks, R. A brief survey of cryptocurrency systems. In Proceedings of the 2016 14th Annual Conference on Privacy, Security and Trust (PST), Auckland, New Zealand, 12–14 December 2016; IEEE: Piscataway, NJ, USA, 2016; pp. 745–752. [Google Scholar]
  38. Li, Z.; Zhang, T.; Yuan, Z.; Wu, Z.; Du, Z. Spatio-temporal pattern analysis and prediction for urban crime. In Proceedings of the 2018 Sixth International Conference on Advanced Cloud and Big Data (CBD), Lanzhou, China, 12–15 August 2018; IEEE: Piscataway, NJ, USA, 2018. [Google Scholar]
  39. Chen, P.; Yuan, H.; Shu, X. Forecasting crime using the ARIMA model. In Proceedings of the 2008 Fifth International Conference on Fuzzy Systems and Knowledge Discovery, Jinan, China, 18–20 October 2008; IEEE: Piscataway, NJ, USA, 2008. [Google Scholar]
  40. Box, G.E.; Jenkins, G.M.; Reinsel, G.C.; Ljung, G.M. Time Series Analysis: Forecasting and Control; John Wiley & Sons: Hoboken, NJ, USA, 2015. [Google Scholar]
  41. Islam, K.; Raza, A. Forecasting Crime Using ARIMA Model. 2020. Available online: http://arxiv.org/abs/2003.08006 (accessed on 15 March 2023).
  42. Mukhopadhyay, A.; Zhang, C.; Vorobeychik, Y.; Tambe, M.; Pence, K.; Speer, P. Optimal allocation of police patrol resources using a continuous-time crime model. In Lecture Notes in Computer Science; Springer International Publishing: Cham, Switzerland, 2016; pp. 139–158. [Google Scholar]
  43. Seasonal ARIMA Models. From PennState: Statistics Online Courses Website. Available online: https://online.stat.psu.edu/stat510/lesson/4/4.1 (accessed on 10 March 2022).
  44. Data Science Team. How to Create an ARIMA Model for Time Series Forecasting in Python. 28 December 2019. Available online: https://datascience.eu/computer-programming/how-to-create-an-arima-model-for-time-series-forecasting-in-python/ (accessed on 10 March 2022).
  45. Huddleston, S.H.; Brown, D.E. Using discrete event simulation to evaluate time series forecasting methods for security applications. In Proceedings of the 2013 Winter Simulations Conference (WSC), Washington, DC, USA, 8–11 December 2013; IEEE: Piscataway, NJ, USA, 2013. [Google Scholar]
  46. Rudra, N.; Haggard, S. Globalization, Democracy, and Effective Welfare Spending in the Developing World. Comp. Politi- Stud. 2005, 38, 1015–1049. [Google Scholar] [CrossRef]
  47. For a Detailed Account of This Movement and Its Impact, See Eric Cummins, The Rise and Fall of California’s Radical Prison Movement; Stanford University Press: Stanford, CA, USA, 1994.
  48. Wacquant, L.J.D. Prisons of Poverty. 2009, p. 217. Available online: https://books.google.com/books/about/Prisons_of_Poverty.html?id=Bja4pNc2Ra8C (accessed on 12 November 2022).
  49. Gault, M.; Silver, E. Spuriousness or mediation? Broken windows according to Sampson and Raudenbush (1999). J. Crim. Justice 2008, 36, 240–243. [Google Scholar] [CrossRef]
  50. Kourtit, K.; Nijkamp, P.; Steenbruggen, J. The significance of digital data systems for smart city policy. Socio-Econ. Plan. Sci. 2017, 58, 13–21. [Google Scholar] [CrossRef]
  51. Devroe, E. Local political leadership and the governance of urban security in Belgium and the Netherlands. Eur. J. Criminol. 2013, 10, 314–325. [Google Scholar] [CrossRef]
  52. Popper, K. All Life Is Problem Solving; Routledge: London, UK, 1999. [Google Scholar]
  53. Mittal, M.; Goyal, L.M.; Sethi, J.K.; Hemanth, D.J. Monitoring the Impact of Economic Crisis on Crime in India Using Machine Learning. Comput. Econ. 2019, 53, 1467–1485. [Google Scholar] [CrossRef]
  54. GruszczyŃska, B. Crime in Central and Eastern European Countries in the Enlarged Europe. Eur. J. Crim. Policy Res. 2004, 10, 123–136. [Google Scholar] [CrossRef]
Figure 1. Variable view in SPSS time series forecasting ARIMA model variables; crime rate as the dependent variable and unemployment rate as an independent variable for V4 countries (Hungary (HU), the Czech Republic (CZ), Poland (PL), and Slovakia (SL)).
Sustainability 15 08088 g001
Figure 2. Data table view in SPSS time series forecasting ARIMA model variables; crime rates as the dependent variable and unemployment rate as an independent variable.
Sustainability 15 08088 g002
Figure 3. ARIMA prediction model forecast value of crime rate in 2020 for V4 countries highlighted in SPSS data table (ARIMA forecast generated for 2020).
Sustainability 15 08088 g003
Figure 4. QGIS data table: NUTS 0 data file loaded in QGIS for mapping predicted values of crime rates in 2020. Indicated selection of V4 countries from NUTS geographical dataset.
Sustainability 15 08088 g004
Figure 5. QGIS data table output: NUTS 0 data file loaded in QGIS for mapping predicted values of crime rates in 2020.
Sustainability 15 08088 g005
Figure 6. QGIS data table output visualization for 2020 crime rates in V4 countries.
Sustainability 15 08088 g006
Table 1. Crime rate data [18].
Crime Rate2013201420152016201720182019
Czech Republic741.6205691.901621.739581.3086525.7948512.2142520.9396
Hungary3819.1233340.352845.82962.8931411.9282044.1791695.278
Poland1912.9761549.791375.491291.281221.5991294.8081335.951
Slovak Republic826.7089737.047641.248622.7814575.1915506.1347460.622
Table 2. Unemployment rate data [34,35].
Unemployment Rate201320142015201620172018201920202021
Hungary10.187.736.815.114.163.713.424.254.05
Slovak Republic14.2213.1811.489.678.136.545.756.696.83
Czechia6.956.115.053.952.892.242.012.552.81
Poland10.338.997.56.164.893.853.283.163.36
Table 3. Correlation analysis.
Correlation Analysis
HUURCSURPLURSLUR
HUCRPearson Correlation0.906 **0.922 **0.915 **0.903 **
Sig. (2-tailed)0.0050.0030.0040.005
N7777
CZCRPearson Correlation0.986 **0.987 **0.983 **0.968 **
Sig. (2-tailed)0000
N7777
PLCRPearson Correlation0.909 **0.830 *0.830 *0.782 *
Sig. (2-tailed)0.0050.0210.0210.038
N7777
SLCRPearson Correlation0.970 **0.978 **0.987 **0.980 **
Sig. (2-tailed)0000
N7777
** Correlation is significant at the 0.01 level (two-tailed). * Correlation is significant at the 0.05 level (two-tailed).
Table 4. Collinearity analysis.
Coefficients a
ModelCollinearity Statistics
ToleranceVIF
1HUUR1.0001.000
a. Dependent Variable: HUCR
Coefficients a
ModelCollinearity Statistics
ToleranceVIF
1CSUR1.0001.000
a. Dependent Variable: CZCR
Coefficients a
ModelCollinearity Statistics
ToleranceVIF
1SLUR1.0001.000
a. Dependent Variable: SLCR
Coefficients a
ModelCollinearity Statistics
ToleranceVIF
1PLUR1.0001.000
a. Dependent variable: PLCR.
Table 5. Regression analysis.
Model Summary
ModelRR-SquaredAdjusted R-SquaredStd. Error of the Estimate
10.906 a0.8210.785412.774
a. Predictors: (Constant), HUUR, Dependent HUCR, β = 0.906
20.987 a0.9740.96915.904
a. Predictors: (Constant), CSUR, Dependent CZCR, β = 0.987
30.980 a0.960.95128.037
a. Predictors: (Constant), SLUR, Dependent SLR, β = 0.98
40.830 a0.6890.627145.488
a. Predictors: (Constant), PLUR, Dependent PLCR, β = 0.830.
Table 6. Arima prediction model for Hungary, the Czech Republic, Poland, and Slovakia.
ModelNumber of PredictorsModel Fit Statistics
Stationary R-Squared
HUCR-Model_110.022
CZCR-Model_110.374
PLCR-Model_110.934
SLCR-Model_110.020
Table 7. Arima prediction model for Hungary, the Czech Republic, Poland, and Slovakia: forecast count.
Forecast
Model2020
HUCR-Model_1Forecast2129
UCL5976
LCL646
CZCR-Model_1Forecast498
UCL559
LCL444
PLCR-Model_1Forecast1410
UCL1524
LCL1303
SLCR-Model_1Forecast420
UCL475
LCL371
Table 8. Arima prediction model forecast value of crime rate in 2020 for the V4 countries highlighted in the SPSS data table (ARIMA forecast generated for 2020).
SerialCountryPredicted Crime Rate in 2020
1Hungary2129
2Czech Republic498
3Poland1410
4Slovakia420
Disclaimer/Publisher’s Note: The statements, opinions and data contained in all publications are solely those of the individual author(s) and contributor(s) and not of MDPI and/or the editor(s). MDPI and/or the editor(s) disclaim responsibility for any injury to people or property resulting from any ideas, methods, instructions or products referred to in the content.

