Article

A Seismic Fragility Assessment Method for Urban Function Spatial Units: A Case Study of Xuzhou City

1
Faculty of Architecture, Civil and Transportation Engineering, Beijing University of Technology, Beijing 100124, China
2
Institute of Earthquake Resistance and Disaster Reduction, Beijing University of Technology, Beijing 100124, China
3
Beijing Center for Urban and Engineering Safety and Disaster Reduction, Beijing University of Technology, Beijing 100124, China
*
Authors to whom correspondence should be addressed.
Sustainability 2023, 15(10), 8022; https://doi.org/10.3390/su15108022
Submission received: 15 April 2023 / Revised: 6 May 2023 / Accepted: 9 May 2023 / Published: 15 May 2023

Abstract

:
Cities that experience earthquake disasters face a lot of uncertainties and unsustainability resulting from the fragility of their infrastructure, which should be considered in engineering. This study proposes a seismic fragility assessment framework for urban functional spatial units in order to improve the traditional structural fragility assessment criteria that are currently applied in urban planning. First, appropriate spatial units are classified for the study area, the functional categories of the study area are determined using urban Point of Interest (POI) data, and the functional proportion of the spatial units is calculated. Secondly, considering the classification of different seismic fortification levels represented by different construction ages, and considering the possible building forms and HAZUS’s classification system of building structures in order to establish the correlation between building functions and building structures, the methods of a field survey and a questionnaire survey are adopted to match the functions with the most likely building structures. After this, based on the assumption of the lognormal distribution of ground motion intensity, a mixed method is adopted to calculate the mean value μ ¯ for the fragility of functional space units. The Monte Carlo method is then used to discretize the data and statistically obtain the standard deviation β ¯ for the fragility of functional space units, and the fragility curve is then fitted. A district in Xuzhou City, China, was used as a case study to verify this assessment framework. The results showed that: (1) the fragility of functional space units was greatly affected by the proportion of defense standards in different periods in the unit, which reflected the average level of fragility within the unit. (2) The unit loss index of units built after 2001 with a proportion of less than 50% is basically above the average loss level of the study area. (3) The simulated damage ratio of the assessment results under the three levels, namely frequent earthquake, fortified earthquake and rare earthquake, is consistent with the previously experienced earthquake damage. The paper concludes that it is helpful to design and utilize seismic fragility predicting formulas and technologies at the functional spatial unit level for urban planning, which is meaningful for the formulation of planning strategies, reducing risks to infrastructure and delivering sustainable development.

1. Introduction

UNISDR has reported that, in the past 20 years, although the incidence of climate-related disasters has dominated the world, earthquakes, which are a geophysical hazard, pose the greatest threat to human life. Between 1998 and 2017, more than 740,000 people lost their lives due to earthquakes, which affected over 125 million people within this period [1]. The most recent earthquake disaster occurred in Turkey and Syria, with a magnitude of 7.8 killing over 50,000 people in Turkey and over 8000 in Syria. Cumulatively, at least 15.73 million people and 4 million buildings were affected by this earthquake, which caused billions of dollars in losses across sectors such as agriculture, infrastructure, commerce and industry in both countries.
Today, the development of cities is being continuously improved through the construction of all kinds of infrastructure. Consequently, their earthquake resistance and sustainability is rising. However, because of the unpredictability and suddenness of earthquake disasters, as well as the huge energy release into the city and its infrastructure, an earthquake is anticipated to represent huge potential risks to fragile city infrastructure systems. Due to the above, engineering measures are required to facilitate the resilience of infrastructure to earthquakes. As part of this effort, fragility curves were developed in as early as the 1970s to characterize the probability of damage to engineering structures caused by seismic hazards [2]. Seismic fragility refers to the probability of various damage states occurring in structures under different earthquake intensities. It is a model that quantitatively describes the probable seismic performance of engineering structures, and is expressed as the failure probability of engineering structures as a function of earthquake intensity. Fragility analysis is also an important part of Performance-Based Seismic Engineering Evaluations (PBEE) and performance-based seismic design proposed by the Pacific Earthquake Engineering Research Center (PEER) [3]. In addition, the Global Earthquake Model Foundation (GEMF) has developed a global fragility model based on survey statistics [4] in order to explore the seismic fragility of buildings in various countries and regions at a broader scale.
A fragility curve is considered an important model for pre-earthquake risk assessments and post-earthquake rapid assessments in the field of engineering [5,6] because it describes the relationship between the earthquake intensity and structural damage at a macro level. However, in the field of urban planning, this macro level analysis is still a micro scale focusing on engineering nanomaterials, which is difficult to apply to the study of earthquake damage and loss at the city scale. It is also unable to directly support pre-earthquake planning interventions and emergency preparedness arrangements. As an attempt to remedy this, group building damage assessment methods have been developed in response to this problem to reflect multi-scale earthquake impacts at the city level [7]. However, this approach is a bottom-up framework that has its own set of shortcomings.
Consequently, based on the above, a question emerges regarding whether the impact of earthquake disasters can be judged based on the needs of urban planning in the first place. Planning research perspectives conclude that analysis needs are generally higher than the scale of a single building or a group of buildings; therefore, we think in response to the earthquake disaster occurring in the urban space, there is need for an urban space unit as an object of fragility evaluation to calculate the space vector expression of fragility, and the physical loss probability under different magnitudes of earthquake. The urban fragility curve model [8], based on the multi-level loss possibility, can further define the priority of disaster risk reduction, the disaster prevention performance, emergency response activities and targets as well as the anticipated response and recovery needs of each urban function. This reduces the possibility of inadequate strategy formulation [9], but necessitates the availability of accurate data on anticipated disaster losses based on the occupancy and the resilience of structure clusters.
Considering the above requirements and problems, this paper proposes a fragility assessment method based on an urban functional space unit, which is used to break through the barrier between urban fragility and engineering fragility. It should be a top-down scheme different from the traditional structural fragility curve. Different from previous fragility curve models, we selected objects similar to urban planning research units as the objects of fragility curves. For example, Wiebe et al. selected parcel as the unit, which is similar to zoning units [10]. Generally speaking, it is impossible to directly determine the type of building structure in each functional space unit during planning, which requires a lot of time, but it is feasible to determine the function of each unit. Therefore, the fragility of a functional space unit is derived by studying the relationship between the earthquake intensity of the unit and the probability of functional damage. To achieve this goal, it is necessary to build on the possible relationships between the functional categories of the unit and the engineering structure, although the practical problem is that it is impossible to make a one-to-one correlation between the used functions and the structure they adopt. This study will solve this problem based on a simplified assumption to achieve a fragility curve for urban spatial units. It examines Xuzhou City as a case to verify the method.

2. Literature Review

At present, the prediction of earthquakes is still a challenging problem. Therefore, analysis of the fragility of entities to urban disaster has become an important tool in disaster prevention and mitigation. In as early as the 1970s, scholars developed the process of empirical fragility analysis based on earthquake damage investigation, using the assumption that the specified building structure type under a given damage index has the same damage probability under the corresponding ground motion intensity; thus, Destructive Probability Matrices (DPM) [11] were developed. The establishment of DPM depends on the investigation and collection of damage data pertaining to various structures under different ground motion intensities. Different from DPM, which is based on seismic damage statistics, a seismic damage index assessment method based on the structural “fragility index” has been widely used since the 1980s [11,12] to reflect the relationship between ground motion intensity and structural seismic response. The earthquake damage index is an indirect method that incorporates expert experience to assess the fragility of a target building by weighting the relative importance of factors affecting structural fragility, such as site, plane elevation and non-structural construction. In the 1990s, a fragility function based on the continuous expression of Parameter-Less Scale of Intensity (PSI) was developed, which is different from the discontinuous expression of DPM [13,14]. Its fragility curve is a function of Ground Peak Acceleration (PGA), various earthquake intensities (MSK, MMI, etc.) or effective peak acceleration, which follows the normal distribution and lognormal distribution of the fragility function. Today, the fragility function more often adopts the spectral acceleration corresponding to the age of the structure [15,16] and spectral displacement to better characterize the relationship between structural failure and ground motion input, which is more convenient for the construction of fragility curves.
In order to make up for the defects of the empirical method in terms of its large sample dispersion, limited application scope and less consideration of the law of structure itself, the fragility function is calculated and deduced using the simulation method. It can also be used to construct fragility models [17]. Both empirical fragility analysis and analytical computational fragility analysis have their own disadvantages, and it seems reasonable to combine them [18].
Fragility analysis is not only widely used in earthquake disaster analysis, but it is extended to the fragility analysis of different disaster-bearing bodies under the influence of various disasters. For example, Chen et al. studied the fragility of buildings affected by landslides [19]. Based on research and DInSAR data, Dario et al. developed an empirical fragility curve for the damage to urban buildings as a result of land subsidence [20]. Similarly, Saraswati established a fragility function of local houses to flooding based on actual inundation depth data [21].
Although the research on the fragility of single structures is quite mature, the traditional methods face unimaginable workloads when faced with the assessment of seismic fragility within the urban spatial scale, where millions of structures with varying designs will have to be accommodated as applicable to studies on the group fragility [22] of structures within a confined geographical area. Recently, research on regional seismic damage assessment has become a key contemporary theme. Considerations of regional units, estimations of seismic losses [23], the post-disaster identification of severely affected areas [24] and the undertaking of regional seismic resilience assessments (RSReA) [25] have generated additional debates. For urban managers and planners, it is necessary to consider macro-governance at the city scale, the restoration and transformation sequence of vulnerable buildings and the formulation of planning objectives to address the unique resilience needs of each unit or unit type [26]. Unfortunately, there have been only a few studies in this field. Sandoli et al. developed a construction method of urban fragility curves based on building structural fragility parameters, respectively considering regional fragility with PGA and Mercalli-Cancani-Sieberg (MCS) as ground motion parameters, combined with different building proportions in the region. The fragility curves of 12 districts in the city of Rocca di Mezzo, Italy, were drawn [8]. This method provides a relatively simple model by which to convert the structural fragility at the scale of individual buildings into city-scale fragility. Similarly, Wiebe et al. studied the community-scale fragility of a district in Seaside, Oregon, in the context of tsunami disasters. They also adopted the idea of transforming individual unit’s fragility into the fragility of spatial units, and considered the fragility of tsunami-induced flood depth as the disaster intensity parameter using the parcel level as the selected research unit. In addition, Ruggieri et al. developed an analytical-mechanical based methodology to estimate the overall seismic fragility of town compartments [27]. This is consistent with the research object of urban planning, which is more conducive to the application of fragility reduction in planning [10].

3. Methodology and Data
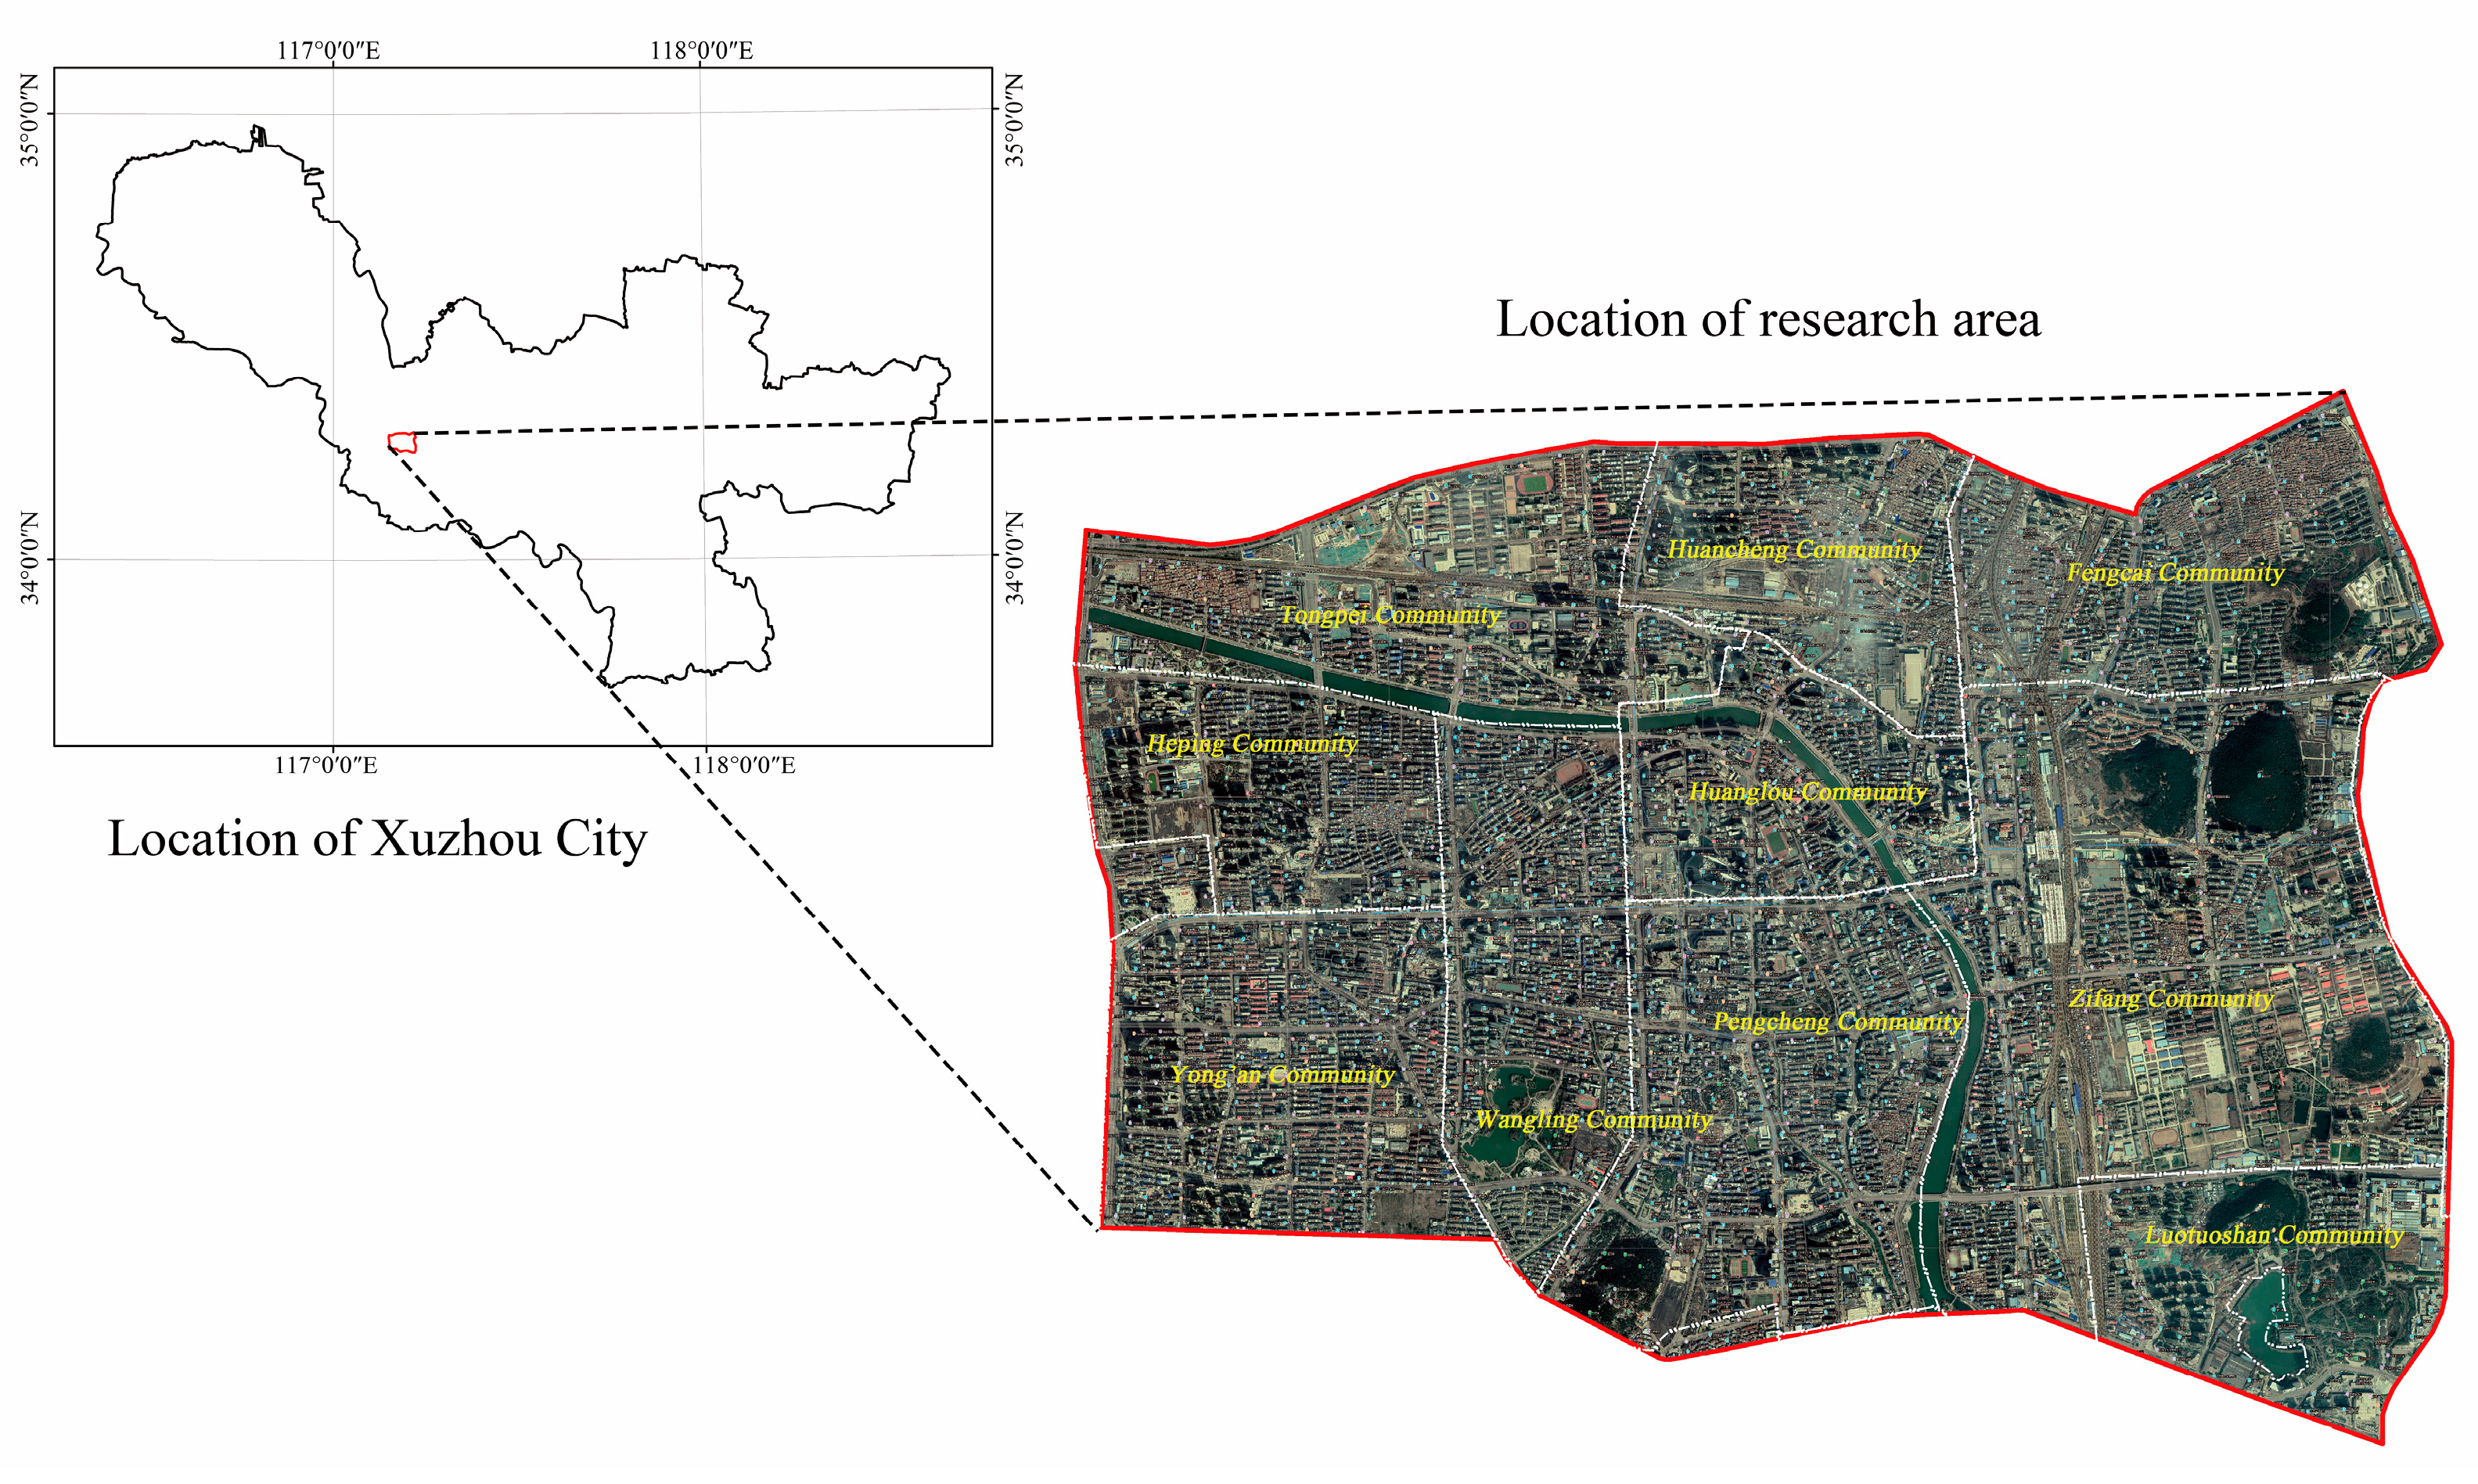
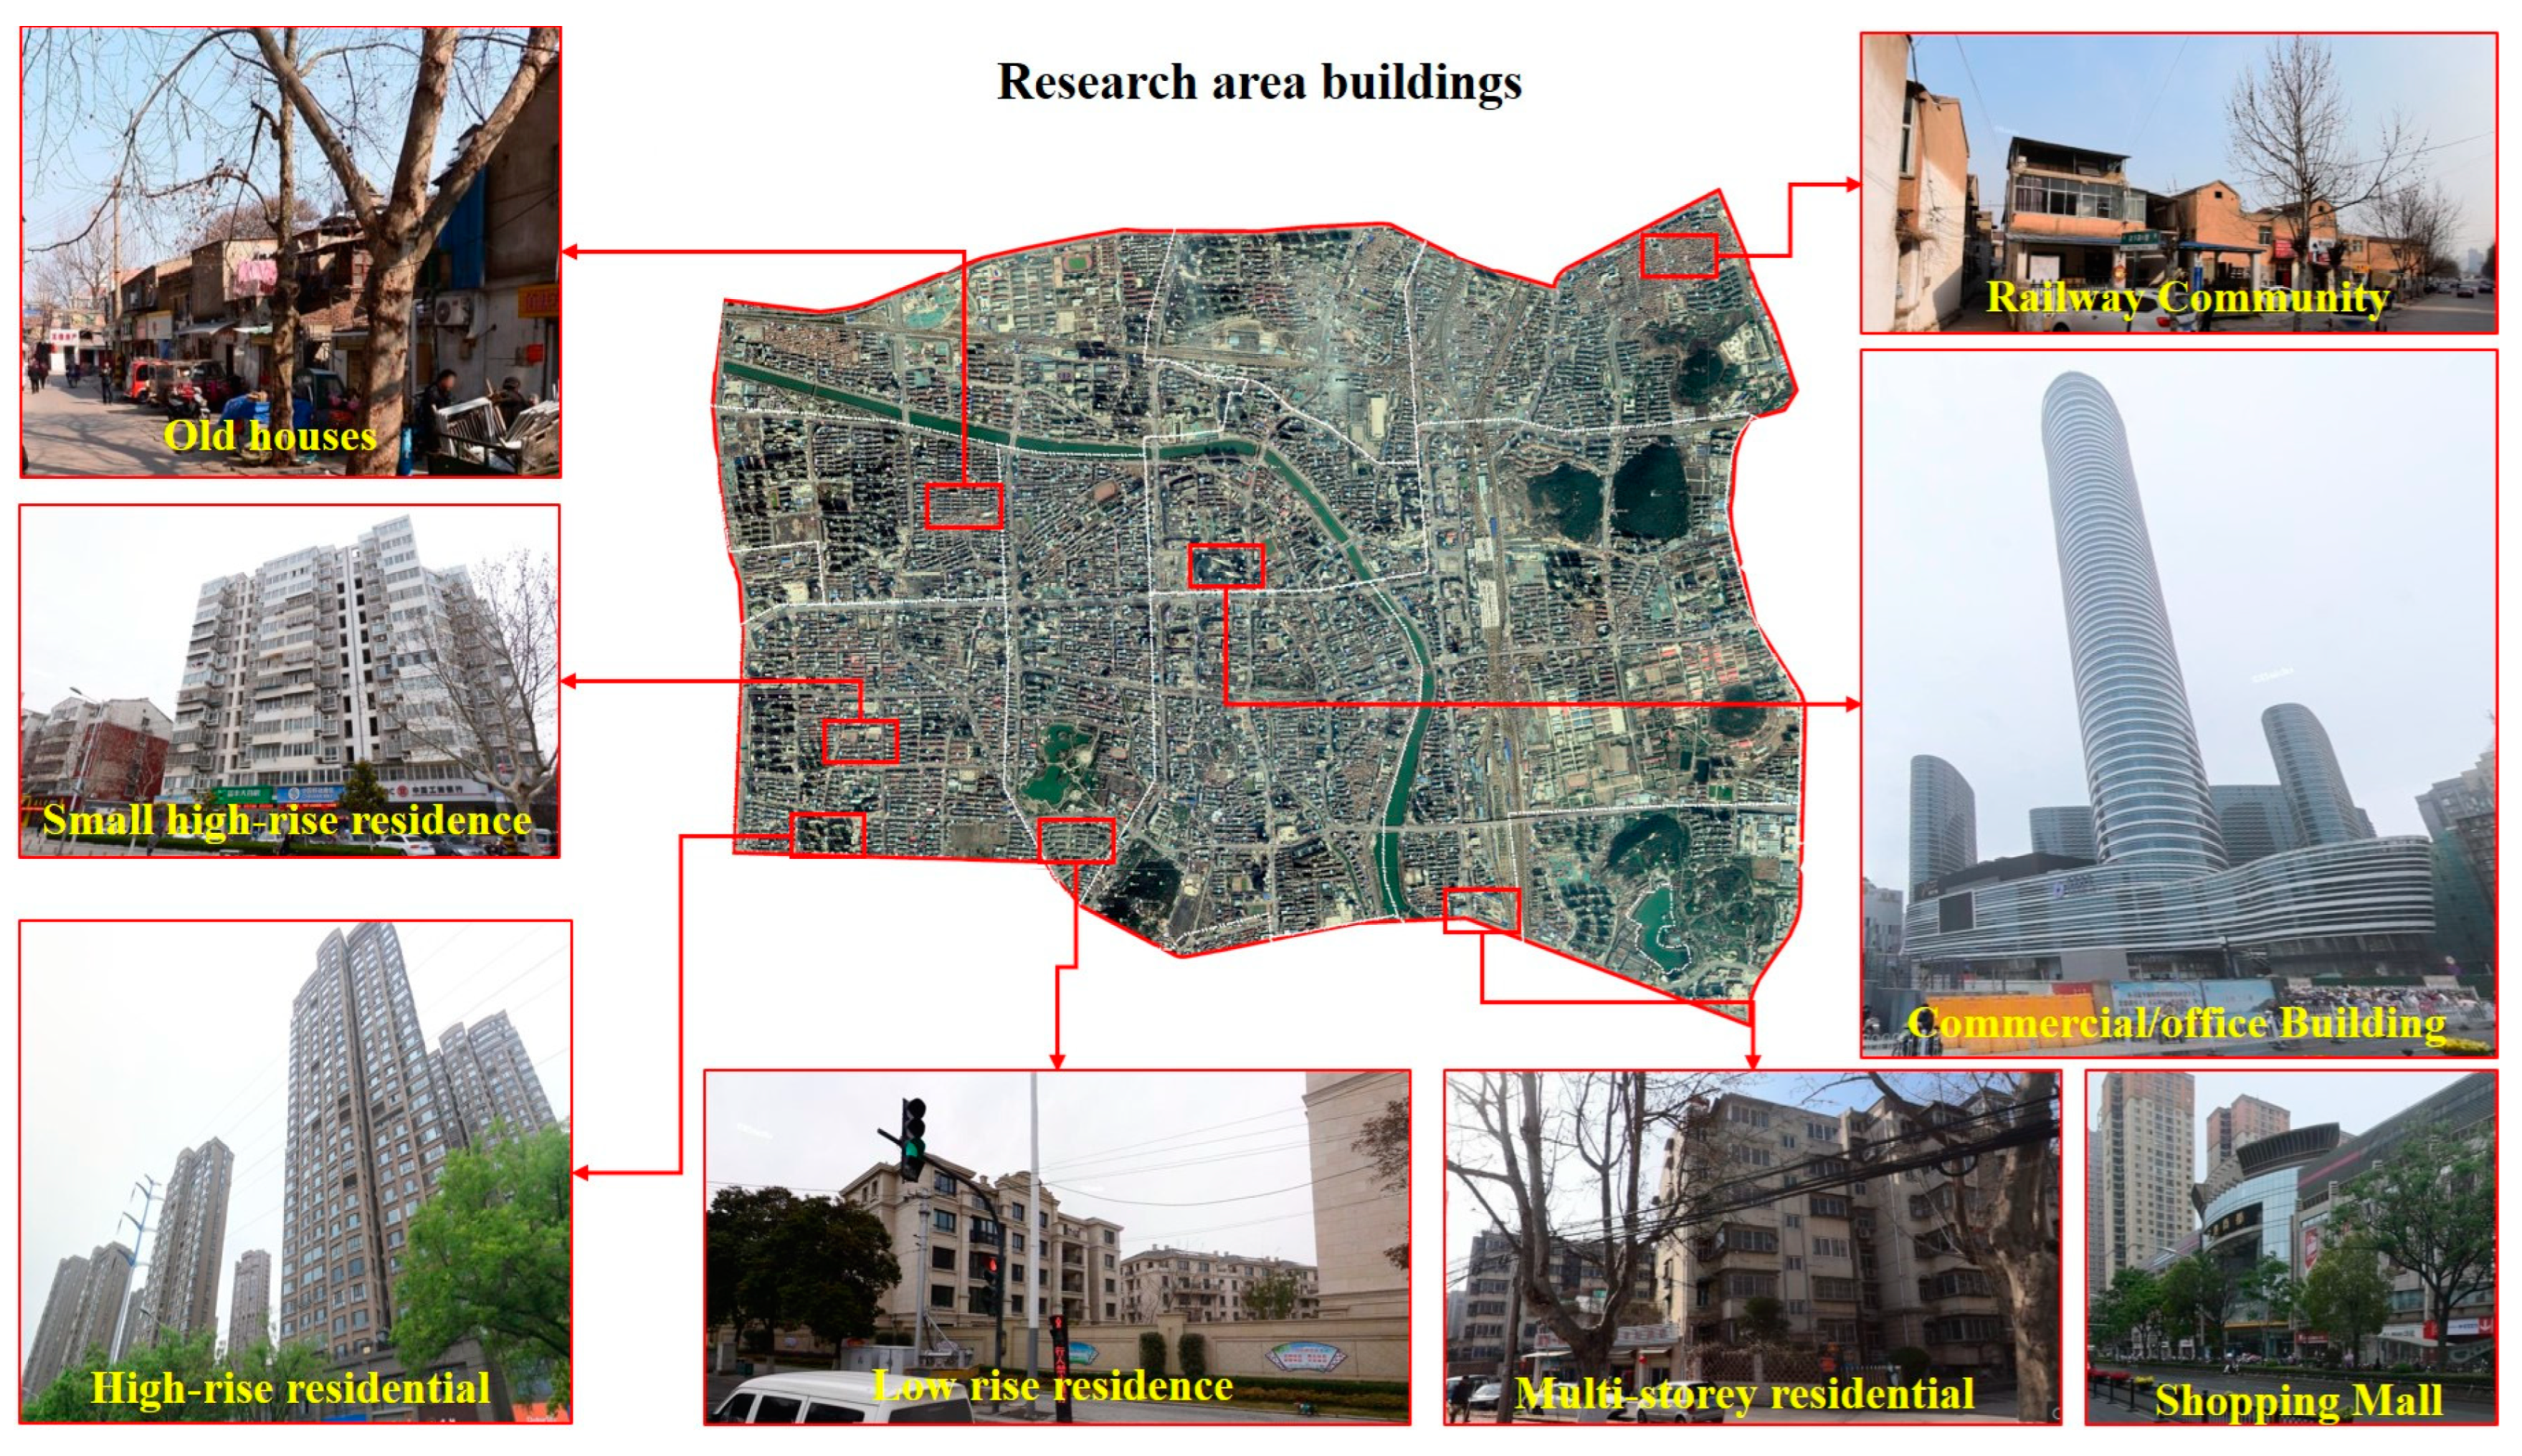
3.1. Study Area

The city of Xuzhou, located in East China’s Jiangsu Province, was chosen for this study. The terrain of Xuzhou city is mainly plain, located in the region of 0.1 g peak acceleration of ground motion, and the intensity of urban earthquake protection is 7 degrees. The specific research area is located in the downtown area of Xuzhou, covering an area of 2.65 km2 (Figure 1). A total of eleven subdistricts are involved, including four complete subdistricts: Wangling subdistrict, Pengcheng Subdistrict, Huanglou subdistrict and Zifang subdistrict; some of the other subdistricts are within the study scope. Xuzhou is an ancient city with a history spanning approximately 2600 years. Due to its convenient geographical location, Xuzhou has a long history with the construction of its urban railway system, often referred to as a city riding on the railway. Although the city has undergone a lot of changes in the recent past, there are still a large number of old buildings from the 20th Century in the city. These face great risks from earthquake. Consequently, as early as 2007, Xuzhou City compiled an earthquake disaster prevention plan.

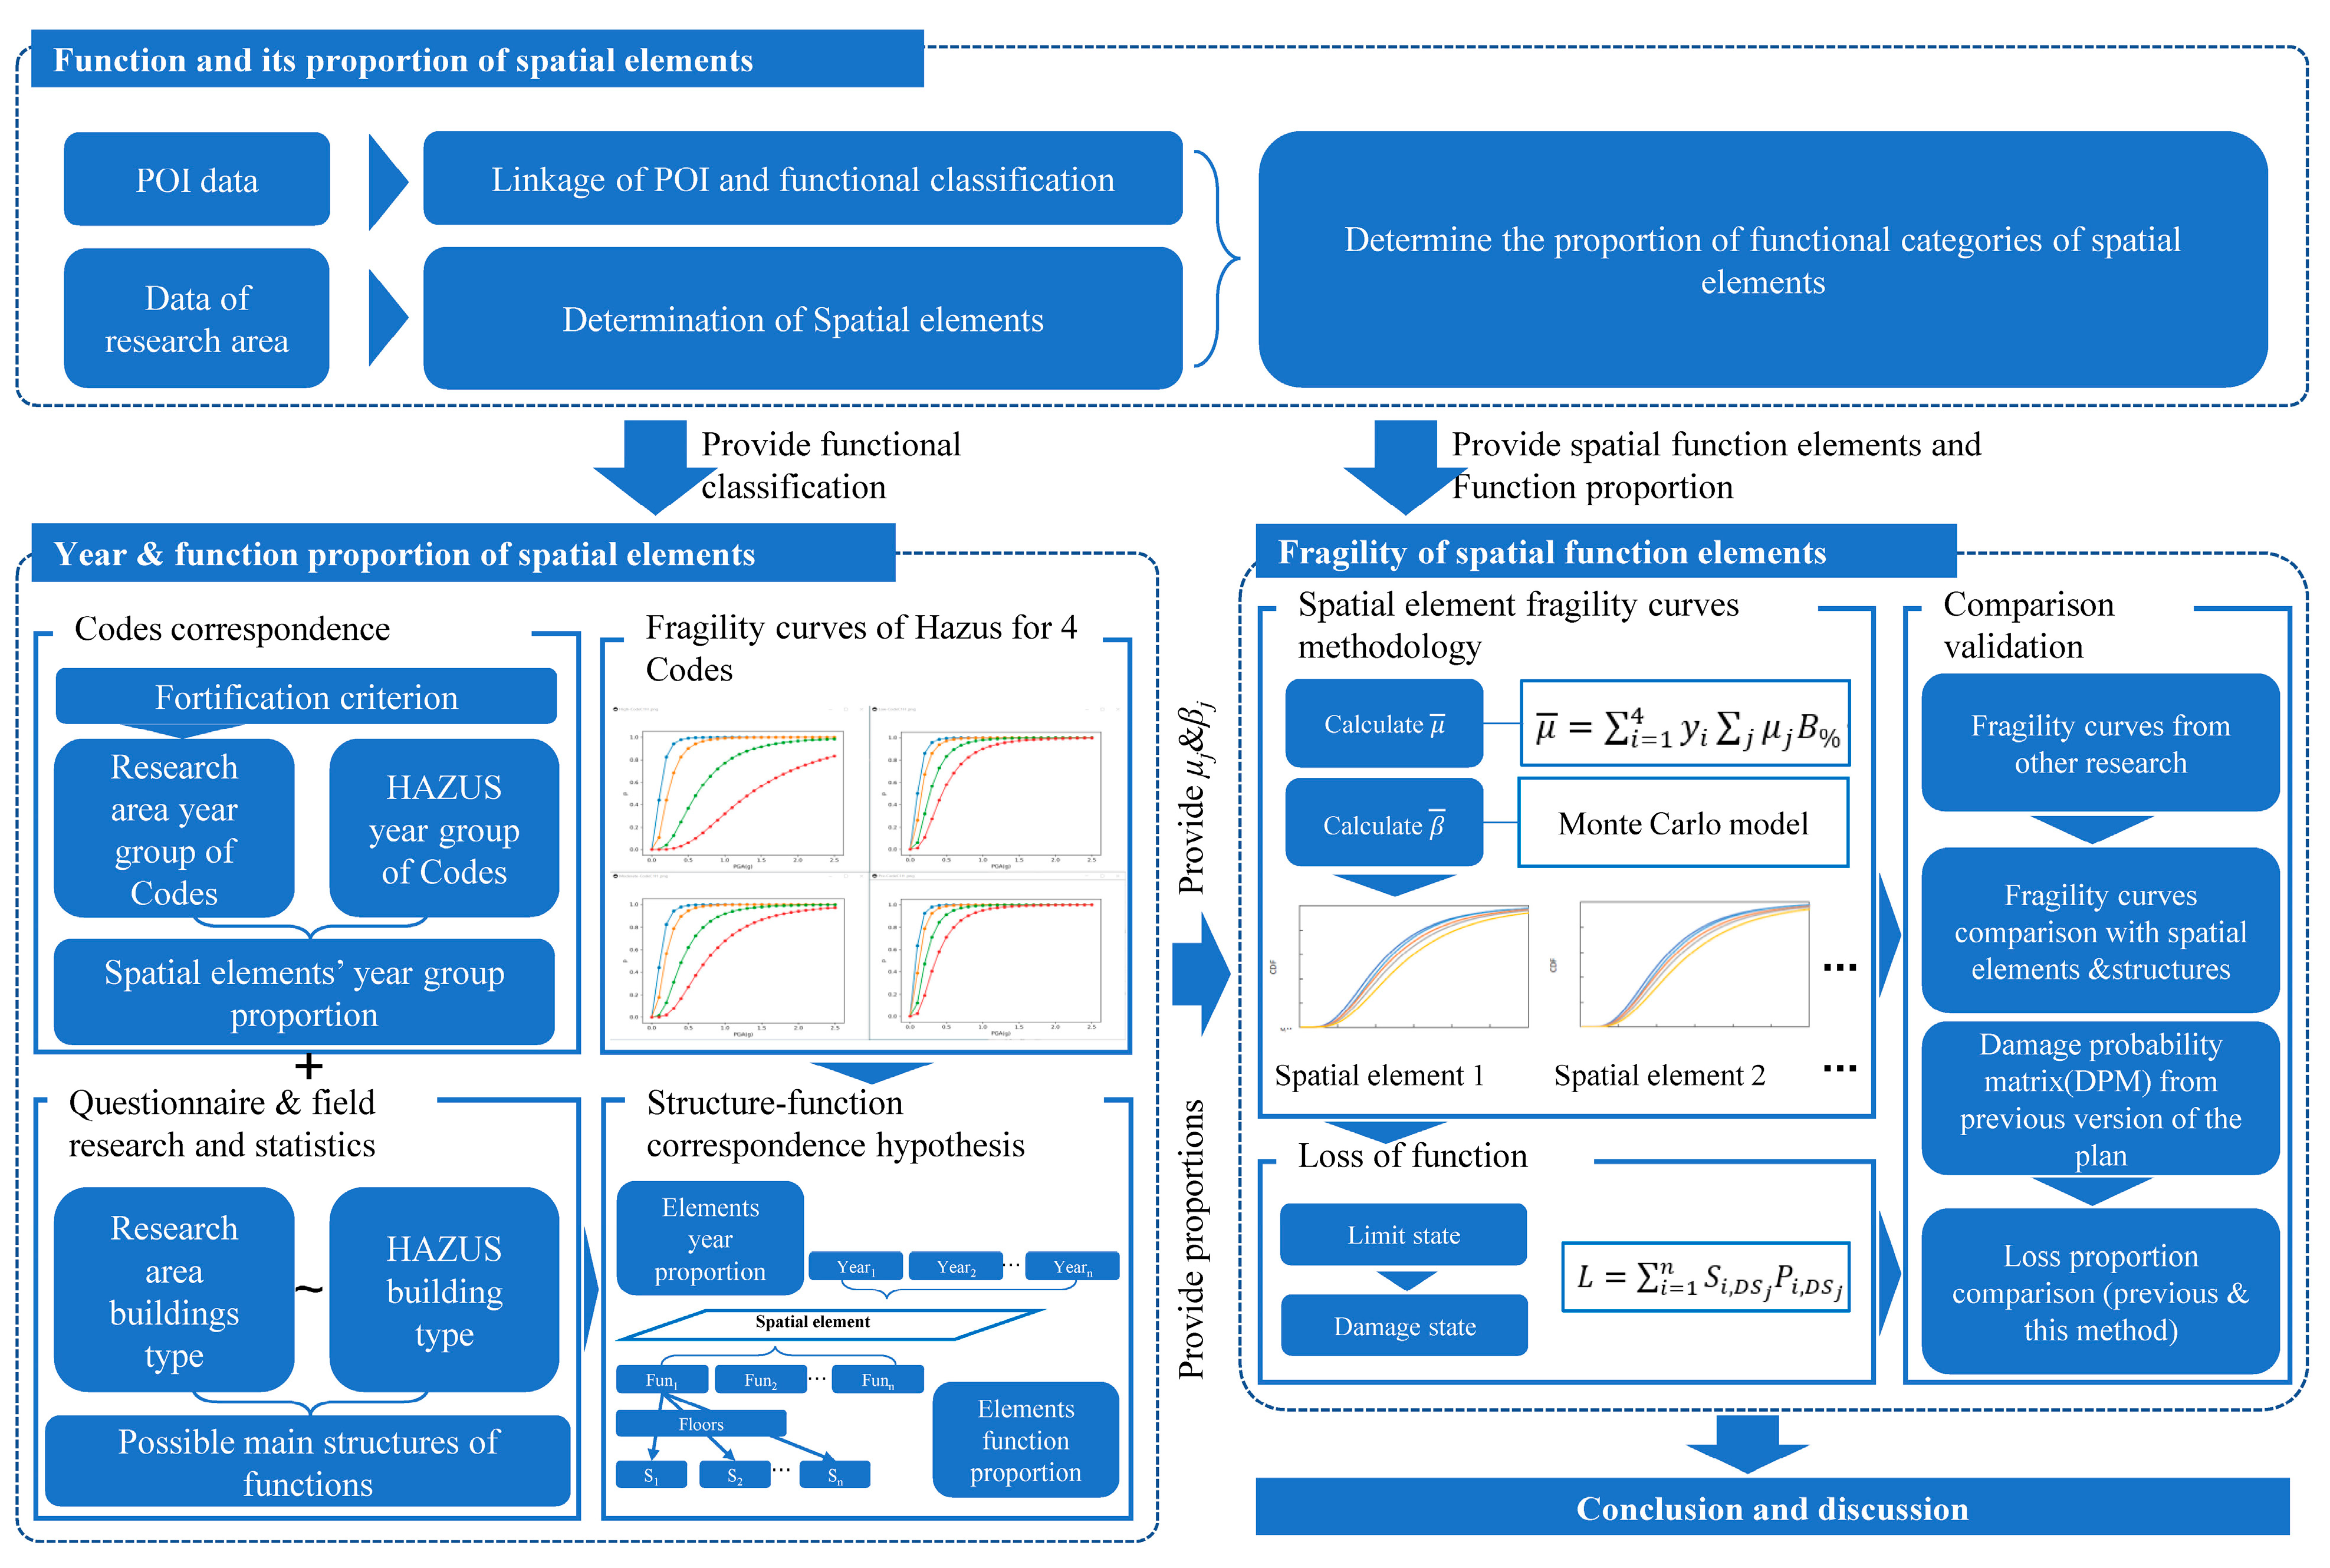
3.2. Framework and Methodology

In order to obtain the fragility curve of urban spatial units, we propose the method shown in Figure 2. The method is divided into three steps, among which the first step aims to determine the functional classification of urban spatial units, the second step provides the functional classification based on urban planning and the third step provides the functional proportion within each spatial unit.
Step 1: Determine the functional classification of spatial units.
Urban spatial units may have these functions, but the proportion of these functions in the units differs. In this step, Equation (1) is adopted to determine the functional proportion of the units, which is usually quantified using POI data [28].
D i j = k = 1 n N k × W k l = 1 m N l × W l × 100 %
where, Dij is the proportion of class j function in the ith spatial unit, k is the class k POI belonging to class j function in the spatial unit, Nk is the number of class k POI belonging to class j function in a spatial unit and Wk is the weight of class k POI belonging to class j function in the spatial unit. m is the total number of all POI in the spatial unit, l is the class l POI in the spatial unit, Nl is the number of POI with function type l in a spatial unit, Wl is the weight of class l POI in the spatial unit and the weight of each function is equal in this study.
Step 2: Fortification, structure and function of the corresponding.
The purpose of the second step is to connect the fortification, function and structural fragility. Considering that there is no one-to-one correspondence between a building structure and its actual use function, the assumption that one function corresponds to one type of structure will be adopted to simplify the process. This process relies on a complete structure of the classification system (Table 1). Because China has no such classification system, this study will use HAZUS in its structure classification, based on the expert inquiring method and China’s building mapping criteria. Accordingly, the structure of the fragility curve parameters will be directly used (Table 2).
F = f i f 1 , f 2 , f n
μ f i , β f i = g μ s t j , g ( β s t j )
where, F is a set of spatial units, fi is the urban functions in this unit. When we talk about an urban spatial unit, it usually includes many functions. According to expert inquiry g(⋅), we can obtain fragility parameters μ f i and β f i of urban function fi in a unit, μ s t j and β s t j are the fragility parameters of the structures of buildings from HAZUS.
This improves on the existing studies on the convergence of Chinese and American standards [29], and determines the mapping relationship between different construction periods and HAZUS under the intensity of fortification in the study area (Table 3).
In addition, the HAZUS structural fragility curve adopts seismic risk indexes, such as spectral acceleration, spectral displacement and peak acceleration. Considering that seismic disaster prevention planning in China is generally based on PGA, the fragility curve parameters expressed by PGA in HAZUS will be selected for ground motion, which also presents a new problem. The PGA fragility curve parameters presented by HAZUS are based on the Large Western United States (M = 7.0) earthquake, and the settings need to be adjusted to meet the actual situation when used in different regions. In this study, these parameters are directly used. At the same time, in order to consider the fragility at the planning level, we select the average number of building floors of spatial units as the basis for the selection of fragility parameters. Therefore, when we focus on one building, we can use Equation (4):
P D s d s P G A = Φ ln P G A μ s t j β s t j
where, Φ[⋅] is the standard normal cumulative distribution function, P[DSdsPGA] indicates the transcendental probability that the project is in a DS failure state under the given earthquake intensity.
Now it is in a spatial unit, we use Equation (5):
P D s d s P G A = Φ ln P G A μ ¯ β ¯
where, the fragility parameter μ ¯ is the median value of fragility in each unit, β ¯ is the standard deviation of fragility in logarithmic normal distribution in each unit.
Step 3: Fragility of spatial units.
After identifying the fragility parameters corresponding to the functions, the mixed fragility calculation method developed by Sandoli et al. is used to calculate the mean value of the spatial unit fragility model. In this study, we improve it to incorporate year indicators. The HAZUS fragility parameter has previously been transformed into the fragility of the spatial unit [8].
μ ¯ = j = 1 4 y j j μ f i B %
where, yj is the proportion of units built according to the construction standards of different ages, corresponding to the four classifications in Table 3. μfi is the median value of the structural fragility of the main structure type corresponding to the function fj in the spatial unit and B% is the proportion of corresponding functions in the spatial unit. β ¯ cannot be directly combined, so we consider using both μ f i and β f i in a unit, discretizing the fragility parameters according to the lognormal distribution and recalculate all generated samples. Through this, we will obtain β ¯ of the spatial unit.

3.3. Data

The data needed for the research are shown in Table 4. The relevant boundary data, such as the boundary of the research area, were provided by the Resource and Environmental Science and Data Center of China (https://www.resdc.cn/Default.aspx, accessed on 9 December 2022). POI data were acquired from Scott maps API, article 19,291 of the original data. According to the urban land classification and planning construction land standard (GB50137-2011), the POI screening and classification, three levels of “land use-facility-object” were formed with a total of five categories, fifteen middle classes and forty-three small classes. At the same time, 1432 invalid toponymy data were deleted, and the remaining 17,809 data were used for model calculation, representing the input of urban functions. The spatial units within the research scope were divided within themselves. Since there is no clear scale reference in the study of spatial fragility, 97 spatial units were divided by considering the roads above the secondary arterial roads in the research area as the dividing line, among which no POI data was obtained from units 33#, 34#, 47#, 59# and 77#. Units 75# and 76# are railway yard and track land, so there were 90 spatial units that met the calculation requirements (Figure 3). The structural fragility parameters were derived from HAZUS and corresponded to the structure of the study area through Step 2. We focused on the connection between the building construction of Xuzhou and HAZUS. There was no doubt that this process would greatly affect the results of the study, which will be discussed in detail in the following sections.

4. Results

4.1. Corresponding Function and Building Structure

4.1.1. Correspondence of the Functional Structure of Spatial Units

As a key part of this study, it is necessary to correspond the buildings in the functional spatial units of the study area with the structural fragility of HAZUS species. It is undeniable that building structures have different responses to earthquakes, but different fortification levels have a more significant impact on buildings. Therefore, firstly, combined with historical satellite images, field research and the literature, we demarcate the seismic status of buildings in the study area. Since the Tangshan earthquake in 1978, China’s seismic design standards for buildings have undergone three versions of changes. Therefore, we use chronological groups to represent the level of seismic fortification of buildings (see Figure 4 for their spatial distribution).
The research area was built in the 1950s and 1960s, so it has a large area of railway dormitories and other single-story buildings, such as the early Baiyunshan railway dormitory and the third-line railway dormitory. These buildings are of the type without seismic design. In the city, there are also some buildings from 1989 to 2001. These are generally four-story brick and concrete structure houses, representative of the Yellow River New village group of buildings that manifest poor earthquake resistance. According to the chronological grouping, we need to further adopt the fragility parameters of HAZUS according to the functions of urban spatial units, which requires the corresponding functions to the possible HAZUS structure types. Figure 5 shows proportions of the HAZUS Code we use in weak areas.
The Delphi method [30] was used to select 13 experts in the fields of urban and rural planning, architecture, structural design, earthquake resistance and disaster prevention and mitigation to participate in two rounds of research. A total of 11 responses were received, with a questionnaire recovery rate of 84.6%. Due to the high degree of specialization of the fragility problems involved, there were eight experts in structural earthquake resistance and disaster prevention and mitigation, accounting for 72.7%. In addition, all the experts had at least an intermediate level of industry experience, and 45.5% of the experts had senior titles or above. For the answers to the final questionnaire, only experts needed to fill in “0” or “1” according to their experience to construct the association between HAZUS structural types and functional spatial units. Figure 6 shows the types of buildings in the research area.
IBM SPSS STATISTICS 25 software was used to test the reliability of the results. After preliminary analysis, the Alpha coefficient of the responses of the 11 experts was 0.957, and the ICC correlation coefficient was 0.411, indicating that the respondents had good consistency in their responses to the questionnaire and that the scores of different questions had a certain degree of difference. It reflects the general understanding that different structures adapt to different functions. The most likely structure types in each function were selected, and the corresponding results are shown in Table 5 below. Fun-Level 1~3 are tags of functional classifications. It does not mean one building or buildings with one type, but these classifications will be used in Equation (1).

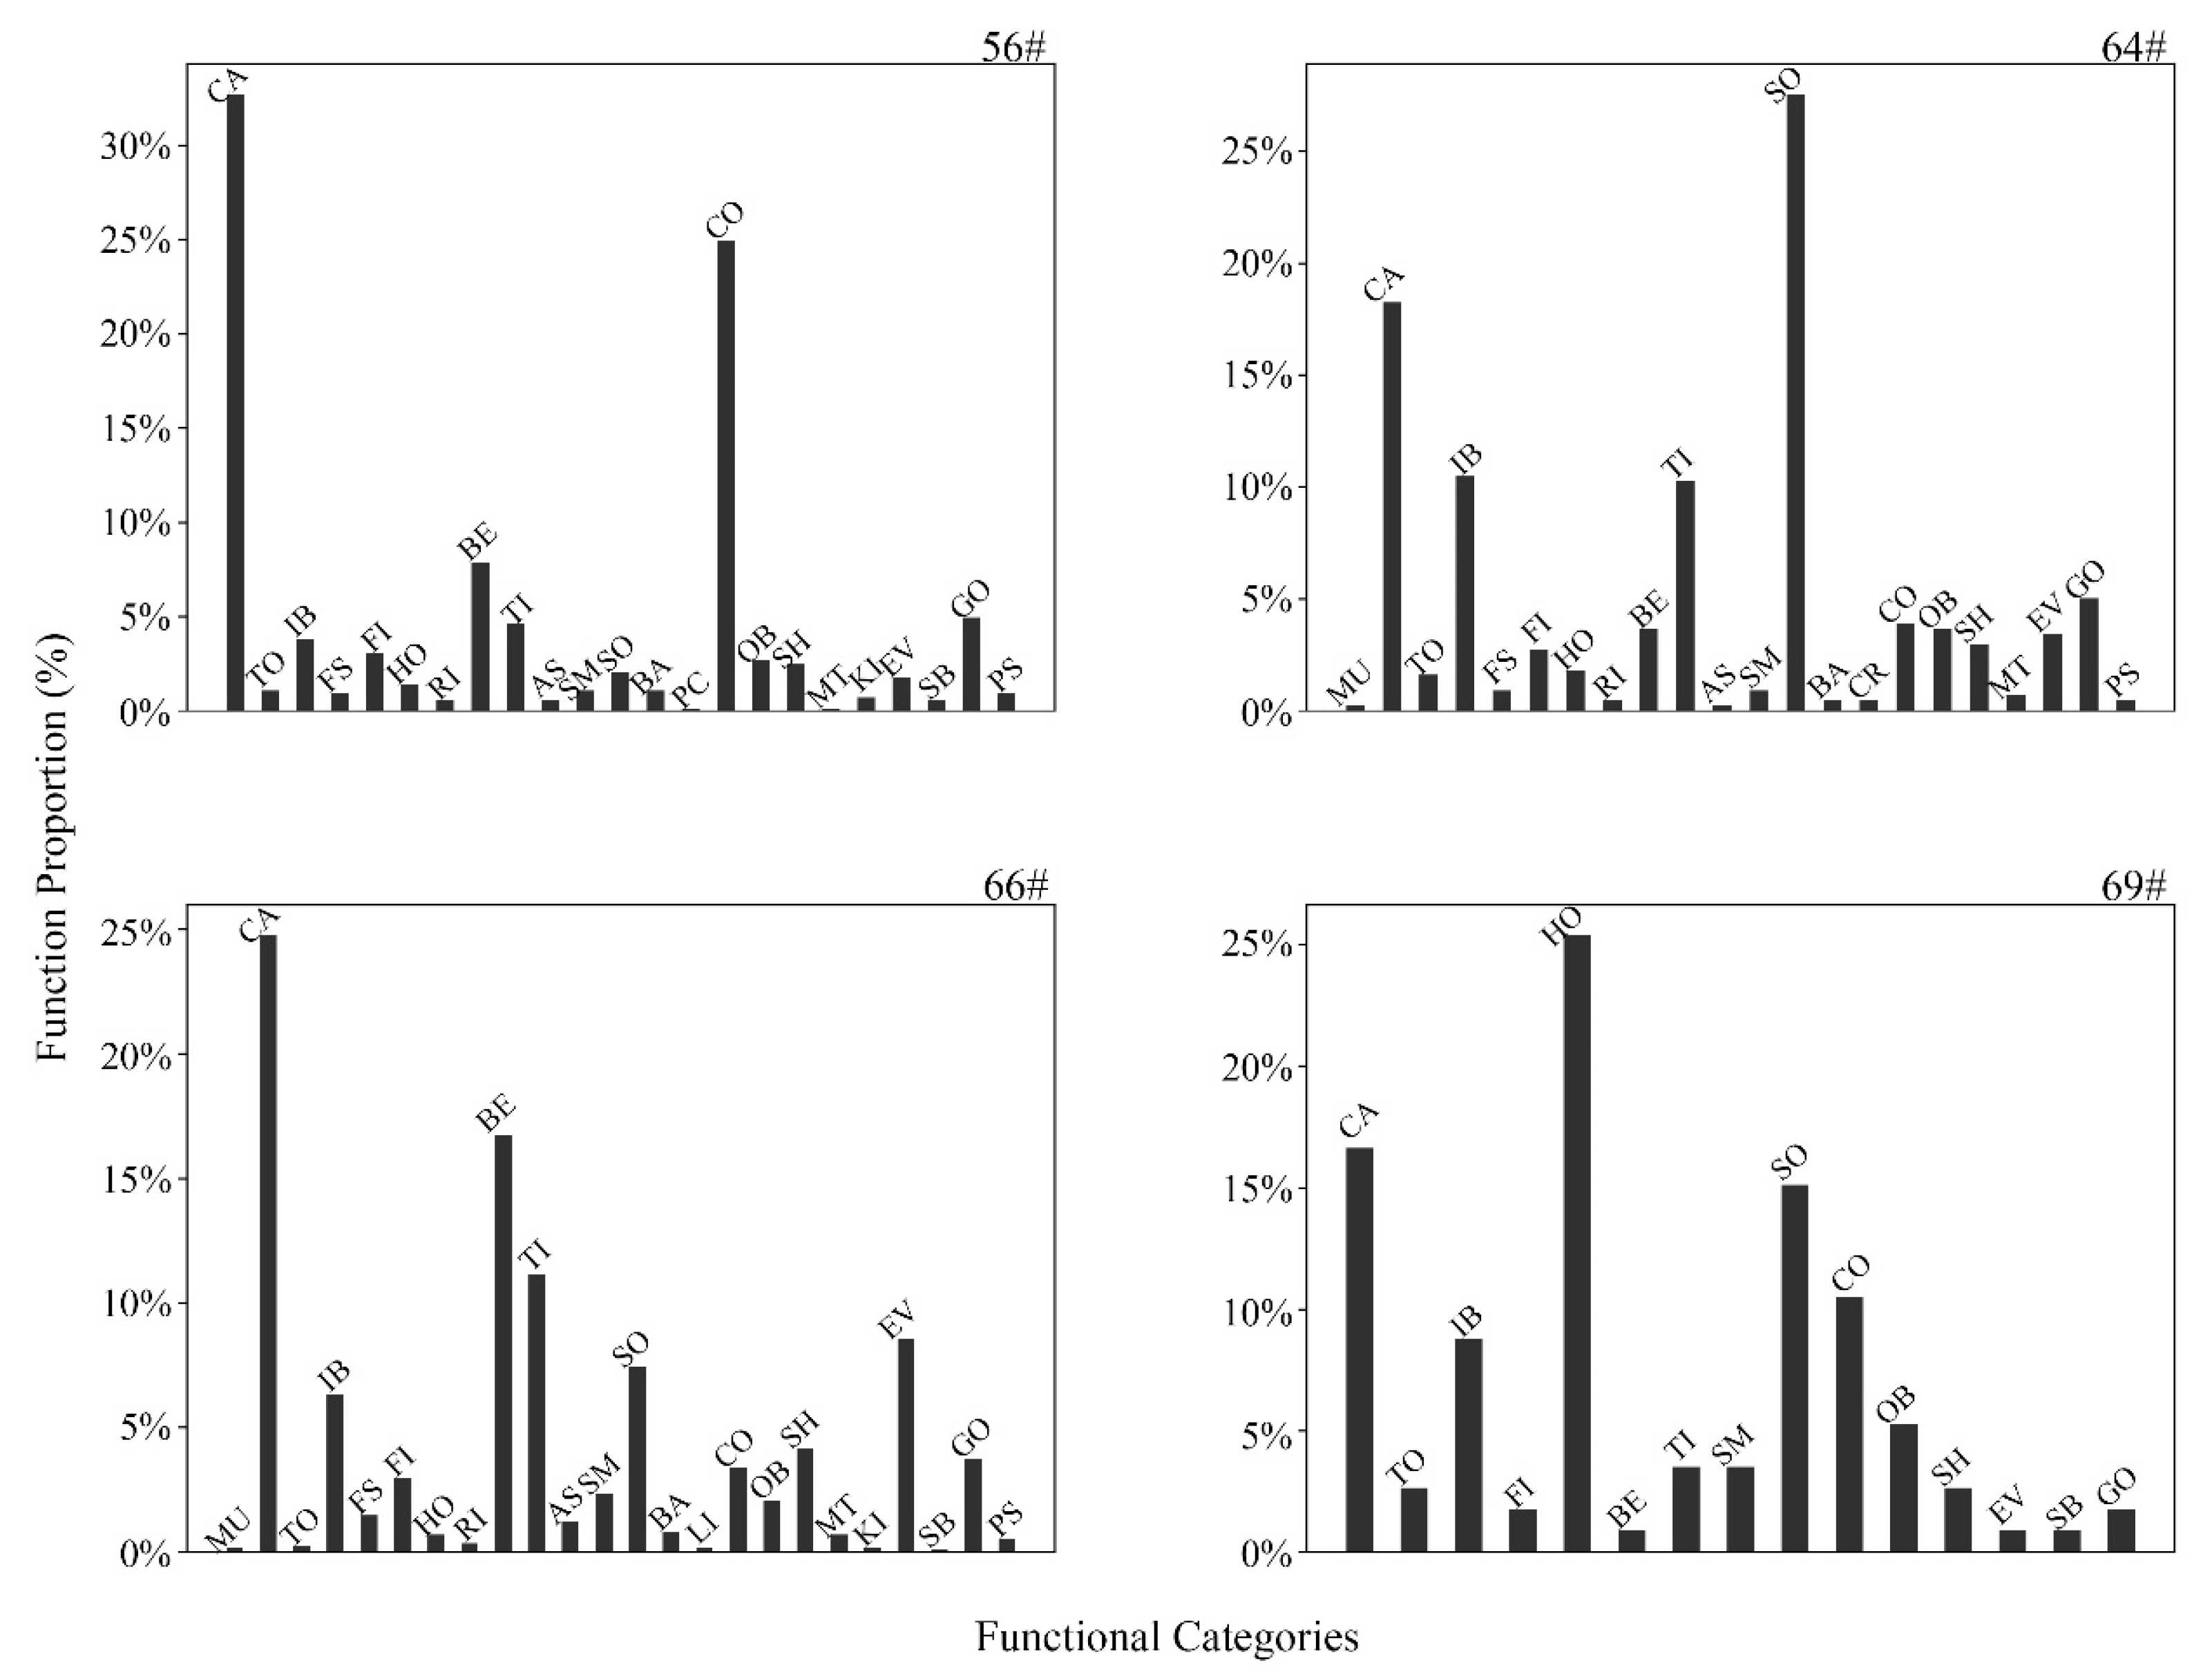
4.1.2. Unit Functional Proportion

The study first needed to calculate the functional proportion of spatial units by using the POI data in Step 1. Firstly, the POI number of each spatial unit was summarized based on the spatial analysis module of the ArcGIS platform, and the POI point category and number of each spatial unit were obtained through the PivotTable function of the Microsoft Excel software. The calculation results show that among the 90 spatial units that meet the calculation requirements, there are 36 kinds of POI in unit No. 60, including education, scientific research, housing, culture and other aspects (Figure 7).
Equation (1) was used to calculate the functional proportions of the 90 spatial units. Units 8# and 16# are units with relatively single functions. For example, 68.96% of unit 8# and 54.29% of unit 16# are residential communities. In contrast, some areas in the city have very complex functions (Figure 8). For example, Unit 69# is located near the railway station, which is mixed-use land with both commercial and residential areas. Hotel functions (HO) account for 25.38%, catering (CA) for 16.63%, residential (CO) for 10.50%, supplemented by office (OB), shopping (SM) and business (IB). Unit 66# is mainly occupied by commercial functions. There are a large number of catering (CA, 24.76%) and various entertainment and leisure functions (29.76%), such as beauty (BE), entertainment (EV), etc., which is the commercial core area of the study area. Only correspond to the main possible structures for three categories of functions, namely public service (A), commercial service (B) and residential (R). Table 5 shows the relationship between urban functions and HAZUS fragilities. Figure 8 shows functional proportion of four spatial units out of ninety.

4.2. Corresponding Function and Building Structure

Based on the proportion of functional categories in the functional space of the study area and the mapping relationship between building functions and the structural fragility of HAZUS, Equation (6) and 1000 Monte Carlo simulations were used to calculate the fragility parameters μ and β of each spatial unit under the four limit states of slight damage (S), moderate damage (M), severe damage (E) and complete destruction (C), respectively (Table 6 and Supplementary Materials). The calculation process was implemented using Python 3.6. According to Equation (5), the fragility curve of the spatial unit is drawn. Figure 9 and Figure 10 show the curves of units 56# and 97#.
In Figure 9, four-color solid lines respectively represent the fragility curves of functional spatial unit 56#, which represent the exceedances probability of different levels of damage to spatial units under a certain ground motion intensity (PGA). Although buildings within spatial units are very diverse, the fragility curves of functional spatial units reflect the average level within the units. Due to the compounding of construction time and function, the fragility of spatial units tends to be average.
Comparing the spatial unit fragility curve with the representative structural fragility given by Chinese scholars, the data used are shown in Table 7, and all the structures are fortified at 7 degrees. Among them, compared with the fragility of unit 56#, Yin [31] determined the seismic damage matrix for steel structures and RC structures in 1996 based on the experience of earthquake damage investigation. Within the strength parameter range of PGA0~0.4 g, the strength greatly changes under the same exceedance probability. However, in the study by Xie [32], except for the collapse of the ultimate state, the variation range of the other three states is within one or two strength ranges. The fragility curve parameters given by Yang [33] are similar to unit 56#, which is related to the relatively new construction situation of the unit. Zhang [34] compared the two versions of Chinese building seismic codes and provided the seismic damage exceedance probability matrix of masonry structures. For the 2001 version of codes, the fragility of unit 56# was generally lower than that of code 01.
Unit 97# in Figure 10 has a large proportion of old buildings, and it is the unit where the oldest railway dormitory in the study area (Baiyunshan dormitory area) is located. Compared to unit 56#, unit 97# has a significantly increased probability of exceedance at both severe and complete damage levels. The Baiyunshan Railway dormitory was built in the 20th Century (in the 1950s and 1960s), and the buildings were not designed to withstand earthquakes, which was similar to the situation in the Tangshan earthquake. The situation of these buildings today, considering the tearing and wearing of components over the years, is even worse. Consequently, it is reasonable that the empirical matrix given by Yin is higher. In comparison, the fragility curves of functional spatial units can generally reflect the prevailing assumptions and are higher on average than the related studies in China. There are many reasons for the error. In addition to the differences in calculation methods, the small sample of the empirical earthquake damage matrix also affects the fitting results, but the fragility results of the functional spatial units have significance at the planning level.

4.3. Assessment of Functional Loss

Based on the fragility curve of the functional spatial unit of the city, the earthquake loss of the city can be further estimated, which generally includes human casualties, economic and environmental losses, etc. In the study of structural fragility, the five categories (or classes) of damage states under the influence of the earthquake (DS) were: (i) intact, (ii) slightly damaged, (iii) moderate damage, (iv) severely damaged and (v) destroyed; while the function spatial unit scale considers (i) no effect, (ii) mild effects, (iii) moderate effects, (iv) severe influence and (v) completely destroyed as the key impact scales, causing the two to be the same. The transcendental probability PDSi(x) of a functional spatial unit under one kind of influence is expressed as:
P D S i x = 1 L S i i = 1 L S i 1 L S i i = 2,3 , 4 L S 4 ( i = 5 )
Cimellaro et al. [36] determined the loss function of the building, which was expressed as the product of the damage proportion and the probability of the different failure states of the structure. In the context of functional spatial units, we define the loss function (L) as the product of the proportion of functional damage (S) and the probability (Pi,j) of spatial unit i under different influence states DSj. In addition, the damage ratio of spatial units in different states is based on the research by Dong et al. regarding post-earthquake recoverability [37]; the probability of obeying the triangular distribution is given (Table 8).
L = i = 1 n S i , D S j P i , D S j ( j = 1,2 , 5 )
Therefore, the loss of different types of functional space will be convenient for proposing strategies at the planning level. Through 500 Monte Carlo simulations, we calculated the loss ratio of spatial units at multiple levels. Figure 11 shows the multi-level loss curves of the construction ratio below 50% (Figure 11a) and 50–90% (Figure 11b) after 2001.
The above data show that with the increase in ground motion intensity, the potential losses in the study area gradually increase. For the units with a construction ratio of less than 50% in 2001, there is an above average loss level in the study area, which should be the first units to be given attention by various mitigation planning strategies. Although unit 97# seems to have suffered the most serious loss, its function only includes a residential area, while units 87#, 88# and 45# are mixed-use units, and the variance of loss ratio is larger, resulting in the loss ratio of these three units being higher than that of unit 97#. For units with a construction force after 2011 of 50–90%, potential losses are closer to the average loss level of the research area. For example, the construction proportion of units 30#, 85# and 92# before 2001 is around 20%, and the loss is above the loss levels of the research area. More units cross the average loss level between 0.2 g and 0.4 g. This locality/location may need to take measures in the near future to reduce the damage and improve the seismic resilience level of structures.
Considering Huanglou subdistrict, Wangling subdistrict and Pengcheng subdistrict as the reference samples (or cases), the first version of the earthquake prevention plan of Xuzhou in 2007 was compared with the developed average value of the loss of functional spatial units [38]. In the past, the earthquake damage assessment method was based on the experience of on-site sampled respondents and observations examined during earthquake damage assessments. The sampling proportion was 5% in the first class work area in GB50413-2007 [39], and the corresponding earthquake damage matrix was given. According to Table 8, 500 Monte Carlo simulations were also conducted with the damage state probability of the earthquake damage matrix. The average value of loss in three fortified states was obtained.
Table 9 shows the difference between the functional spatial units involved in this study and the earthquake damage assessment in 2007. Among them, the calculation results of the average value of the functional space units of the three streets are generally larger at the level of rare earthquakes, with a difference between 1.5 and 2.0 times. Under the level of frequent earthquakes, the proportion of earthquake damage in Huanglou subdistrict and Pengcheng subdistrict is basically the same, while the average unit loss in Wangling subdistrict is less than the actual evaluation result. Under earthquake protection, the loss ratio of Wangling subdistrict is basically the same, while the average loss ratios of Huanglou subdistrict and Pengcheng subdistrict are slightly higher than the actual evaluation result. The differences in Table 9 are acceptable, especially at large spatial scales, due to the different prediction methods and the nature of earthquake damage, the uncertainty of the actual earthquake and other factors as well as the likely errors caused by the sampling techniques of both the survey and the empirical prediction of the study area. Of course, the comparison of loss in Table 9 still needs to be verified further with the actual loss from a specific event.

5. Conclusions and Recommendations

5.1. Conclusions

In this study, a fragility assessment method for urban functional spatial units was proposed. Based on the proportion of urban functions determined by POI data, and based on the mapping of China and HAZUS fortification standards and the mapping of main structure types, it achieved the goal of earthquake damage and loss prediction for urban functional spatial units. The study obtained the following conclusions:
(1)
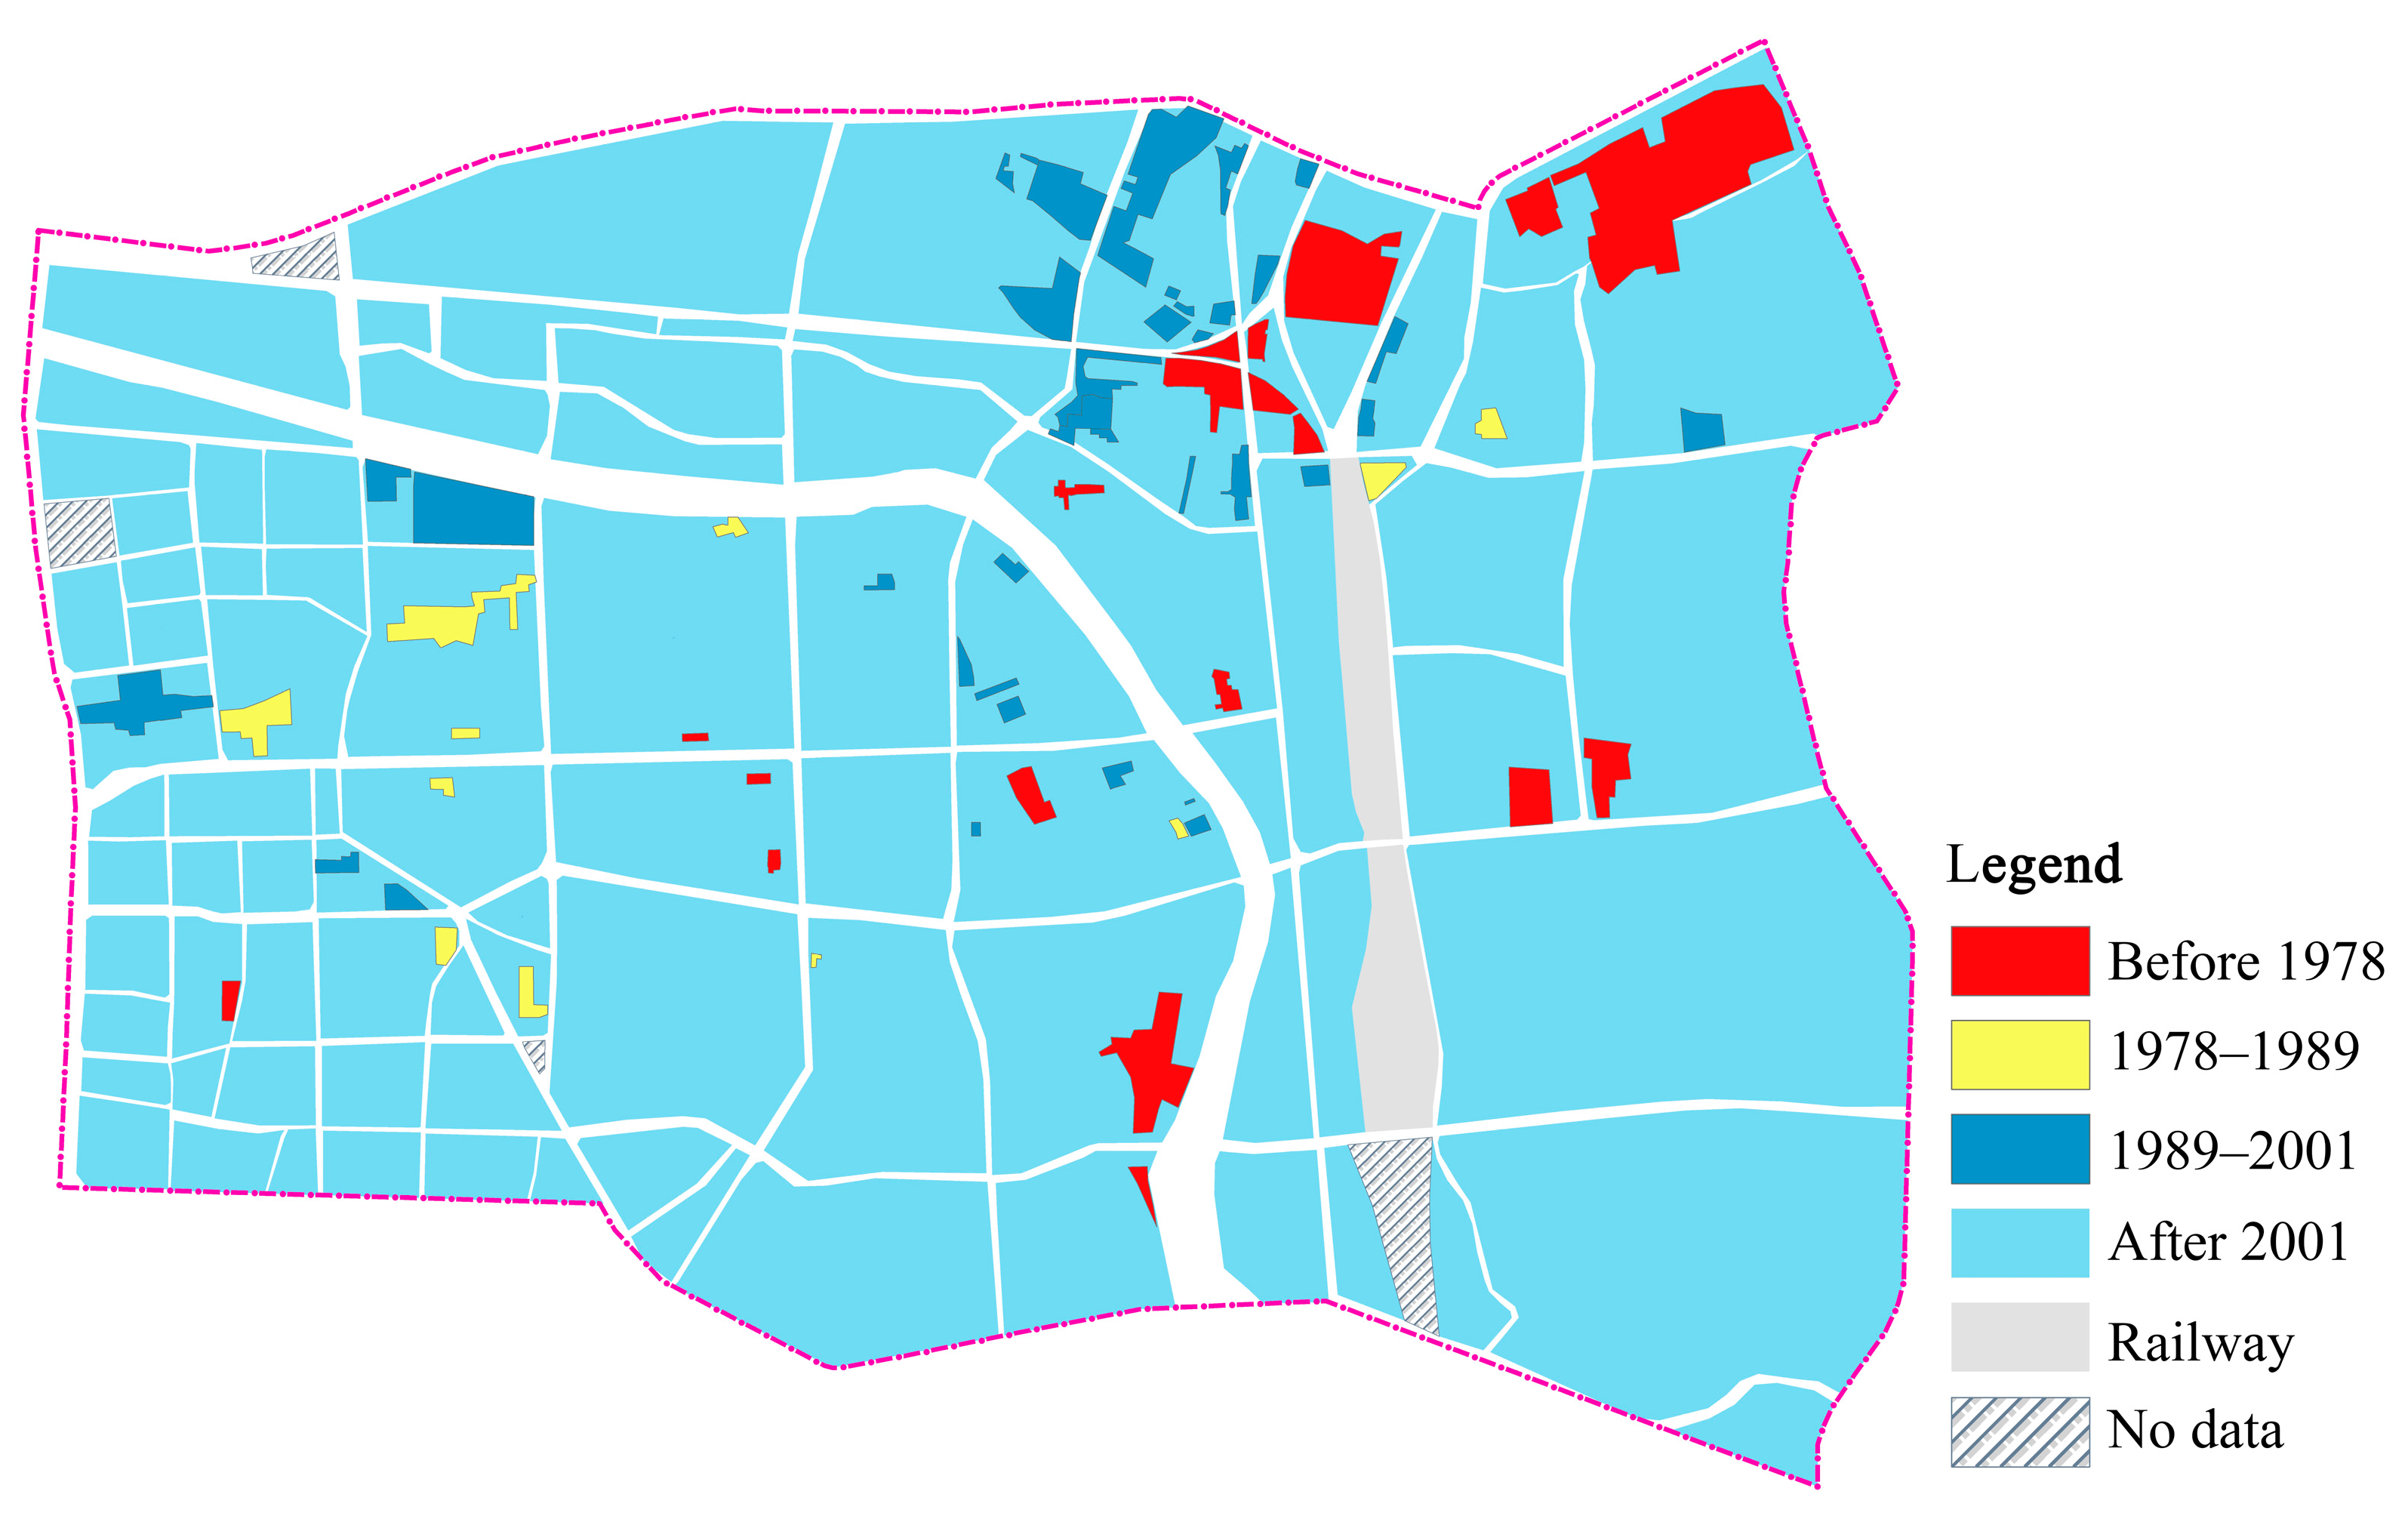
The fragility parameters of urban functional spatial units depend on the different construction standards and functional proportions adopted by the spatial units. Its fragility reflects an averaged macroscopic expression based on structural fragility. Research shows that, by using different spaces, the construction age ratio and function ratio of the units are feasible. Spatial unit fragility provides convenience for urban planning to judge loss at the spatial level without going back to individual buildings.
(2)
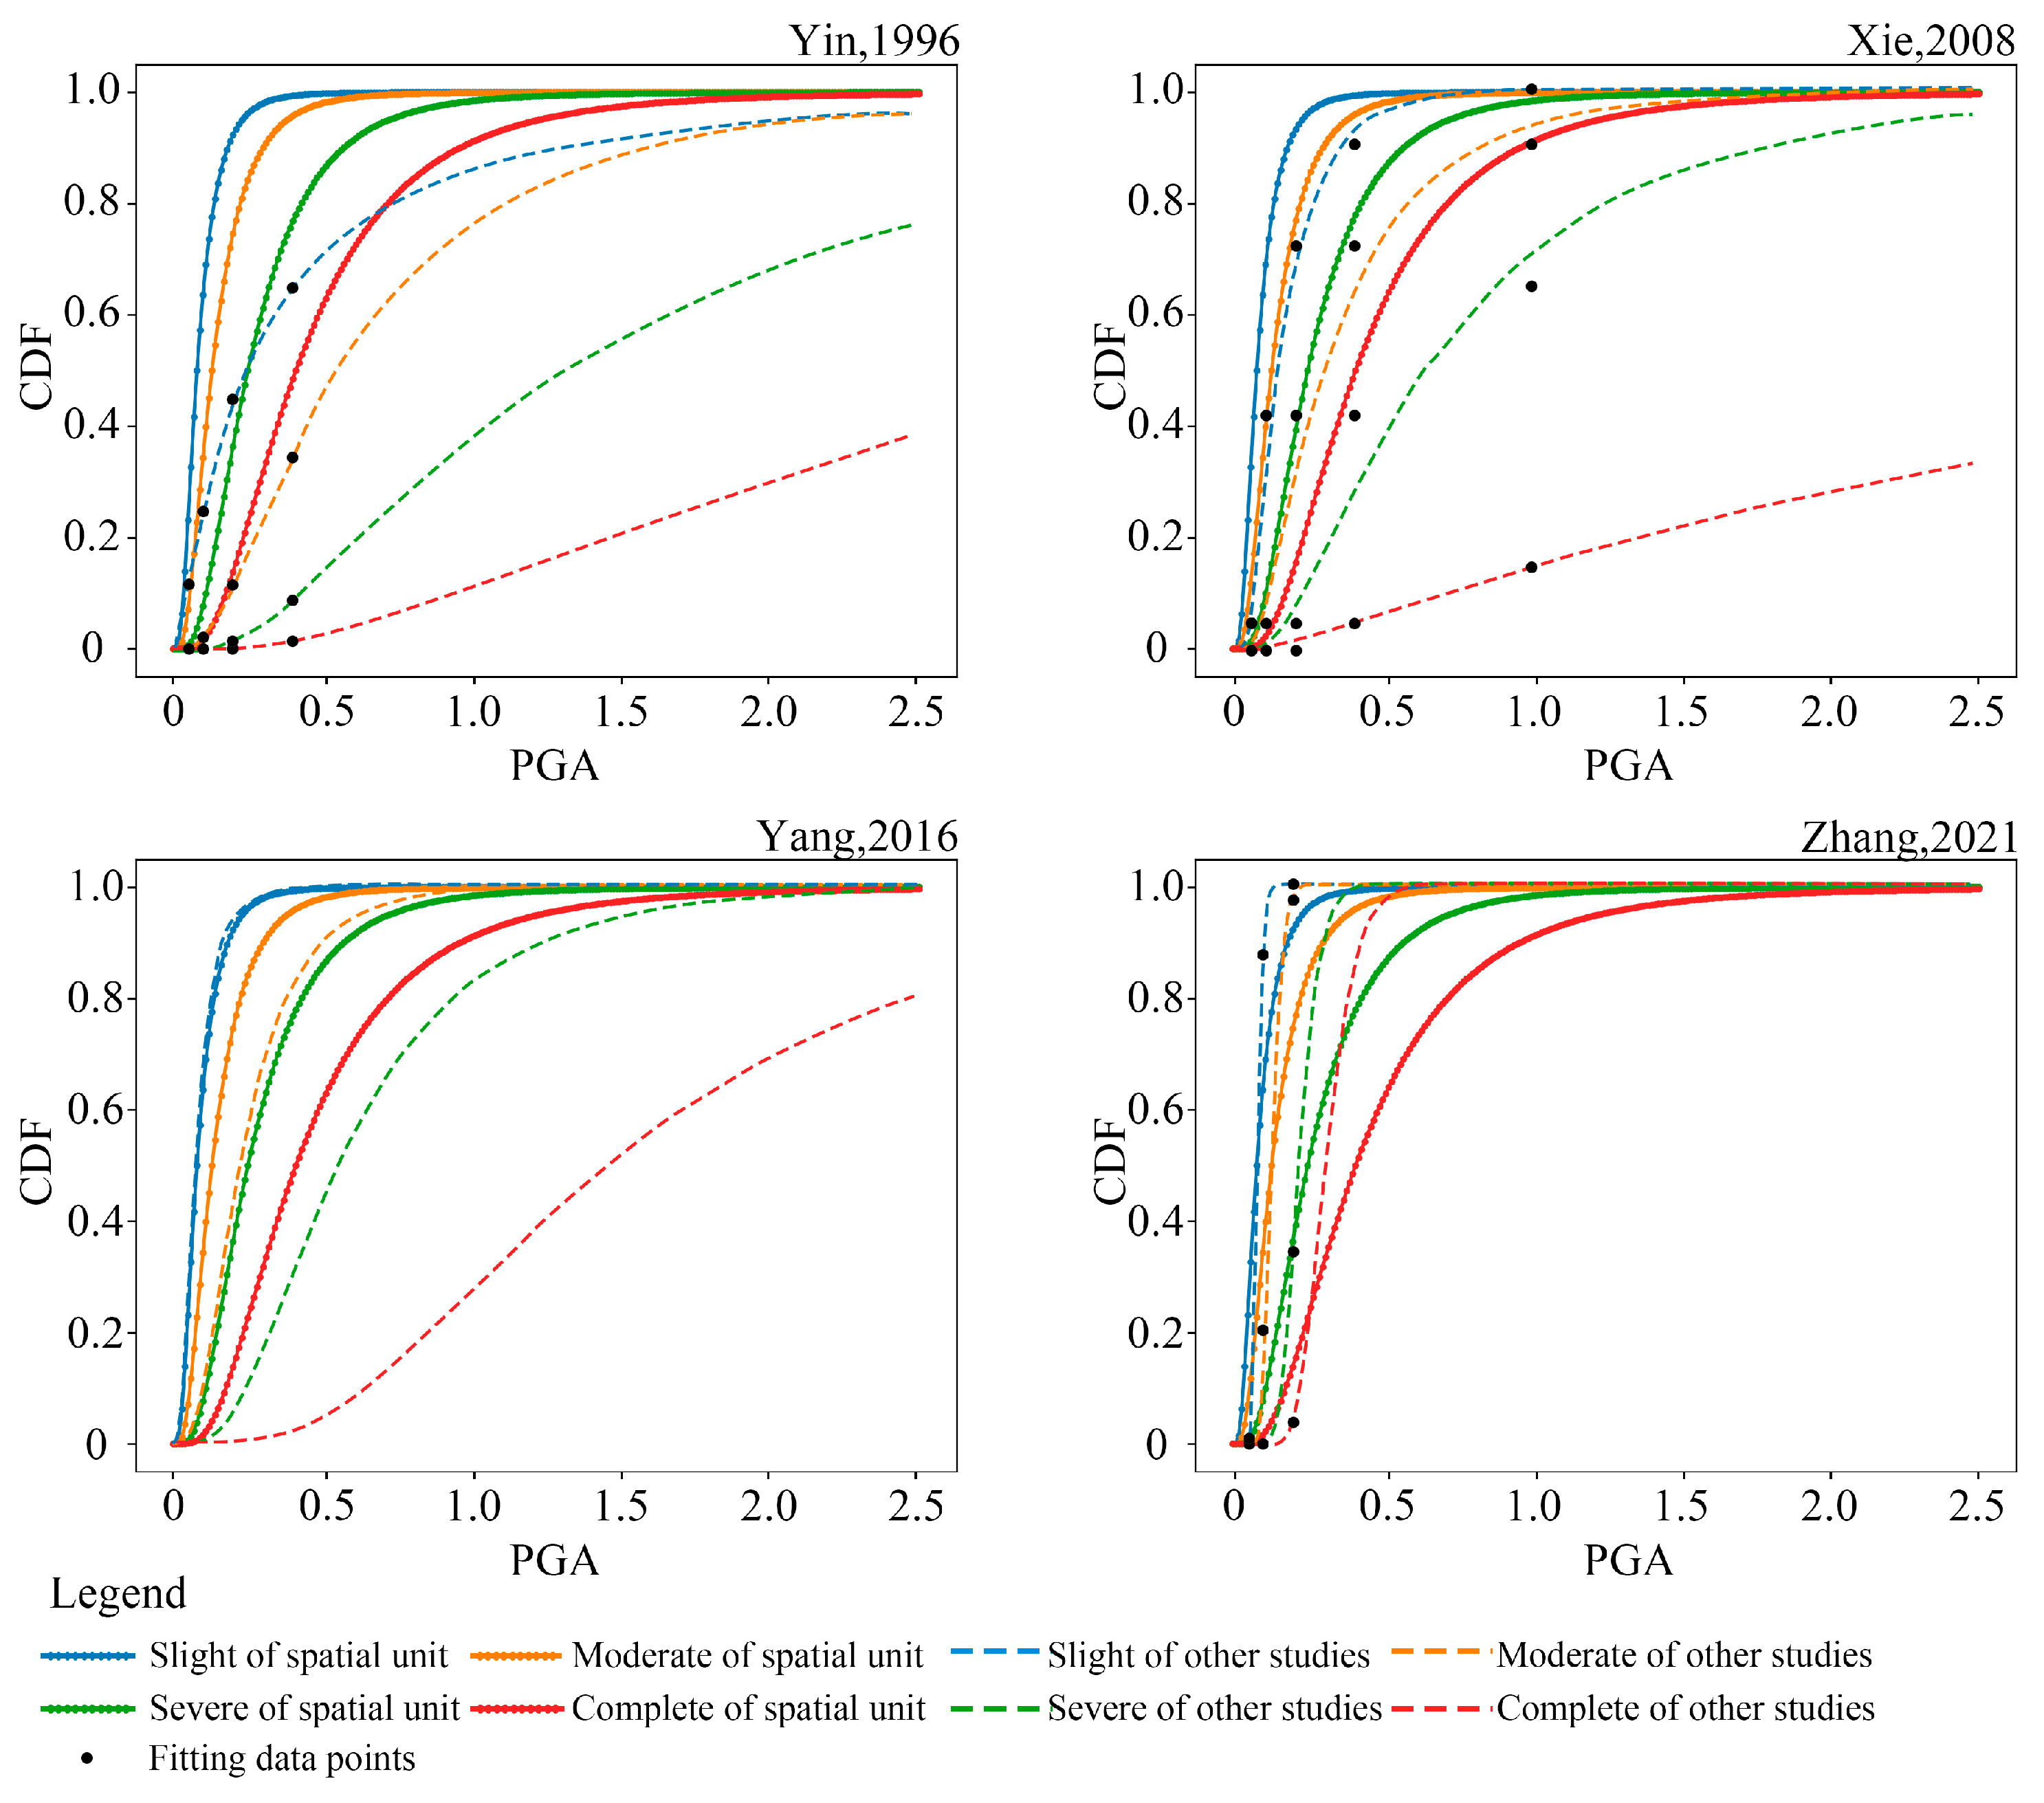
Regarding function spatial units in the study area after fragility assessments, fragility curves of existing structures were compared with China; the results showed that, compared with the empirical method, the fragility of spatial units was higher than the experience. As a result, most of limit states changed within 1~2 intensity. In addition, it had generally high fragility in the standard 2001. It shows that the fragility of spatial units is within the range of existing research results.
(3)
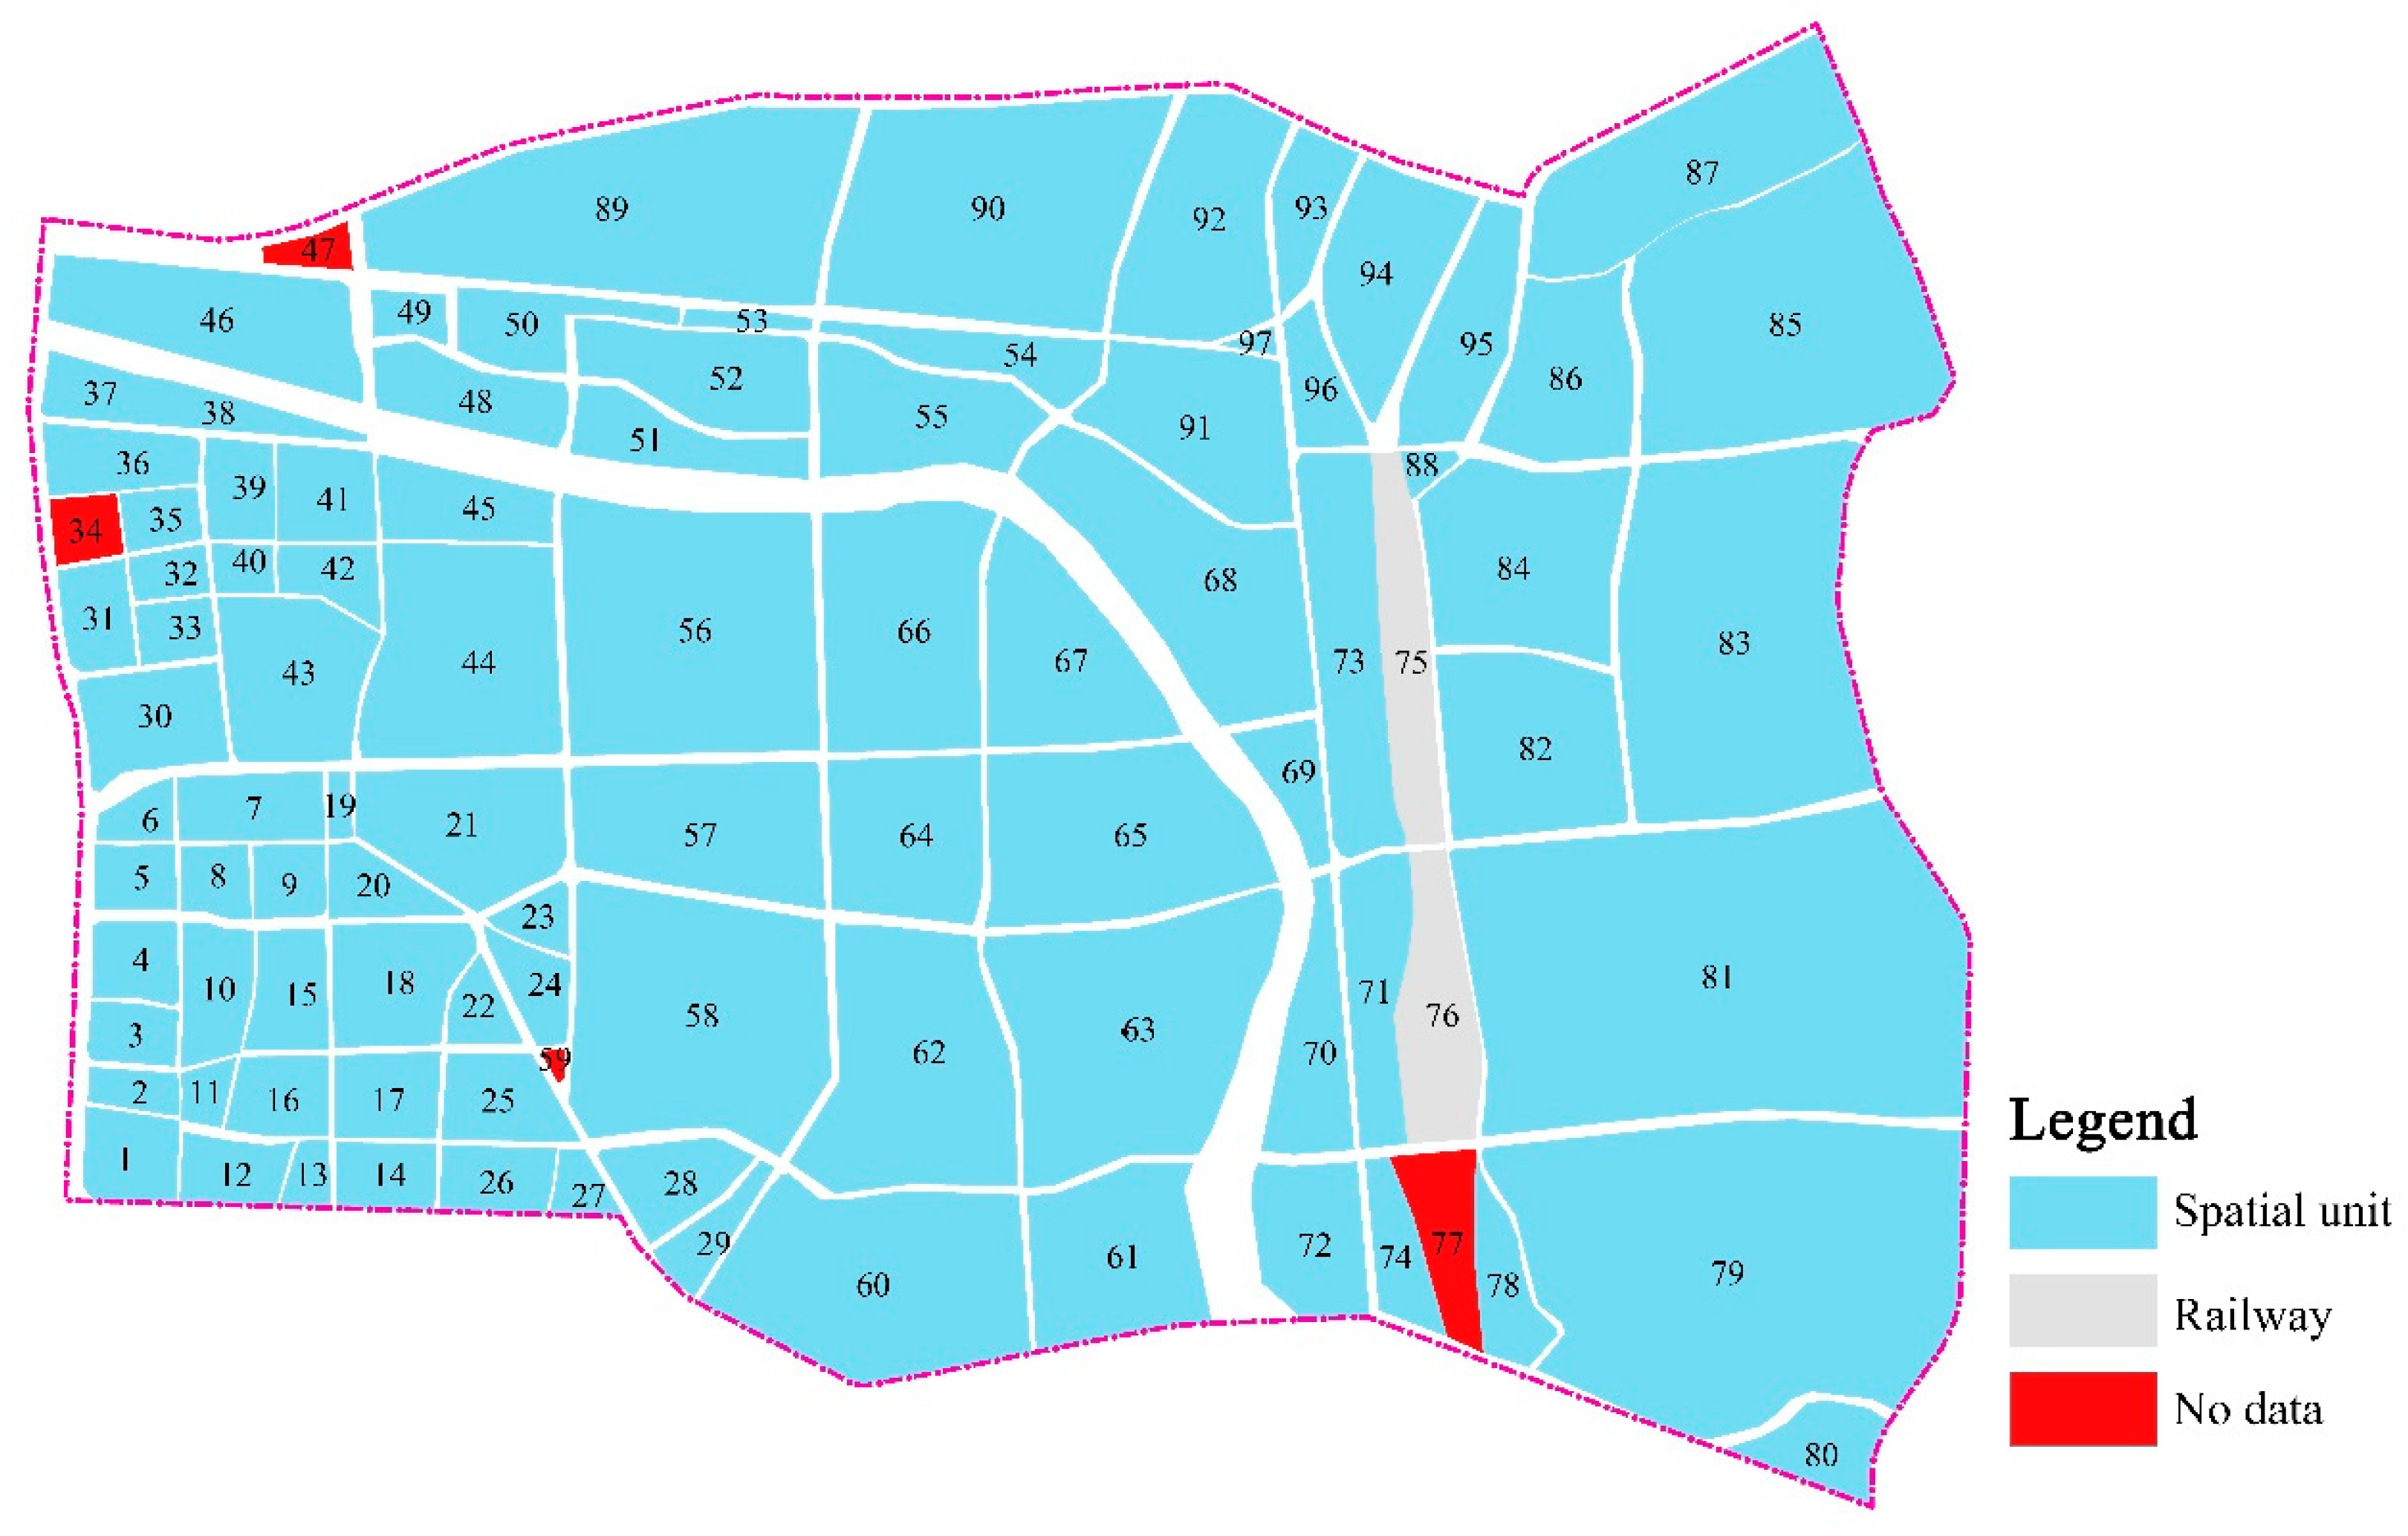
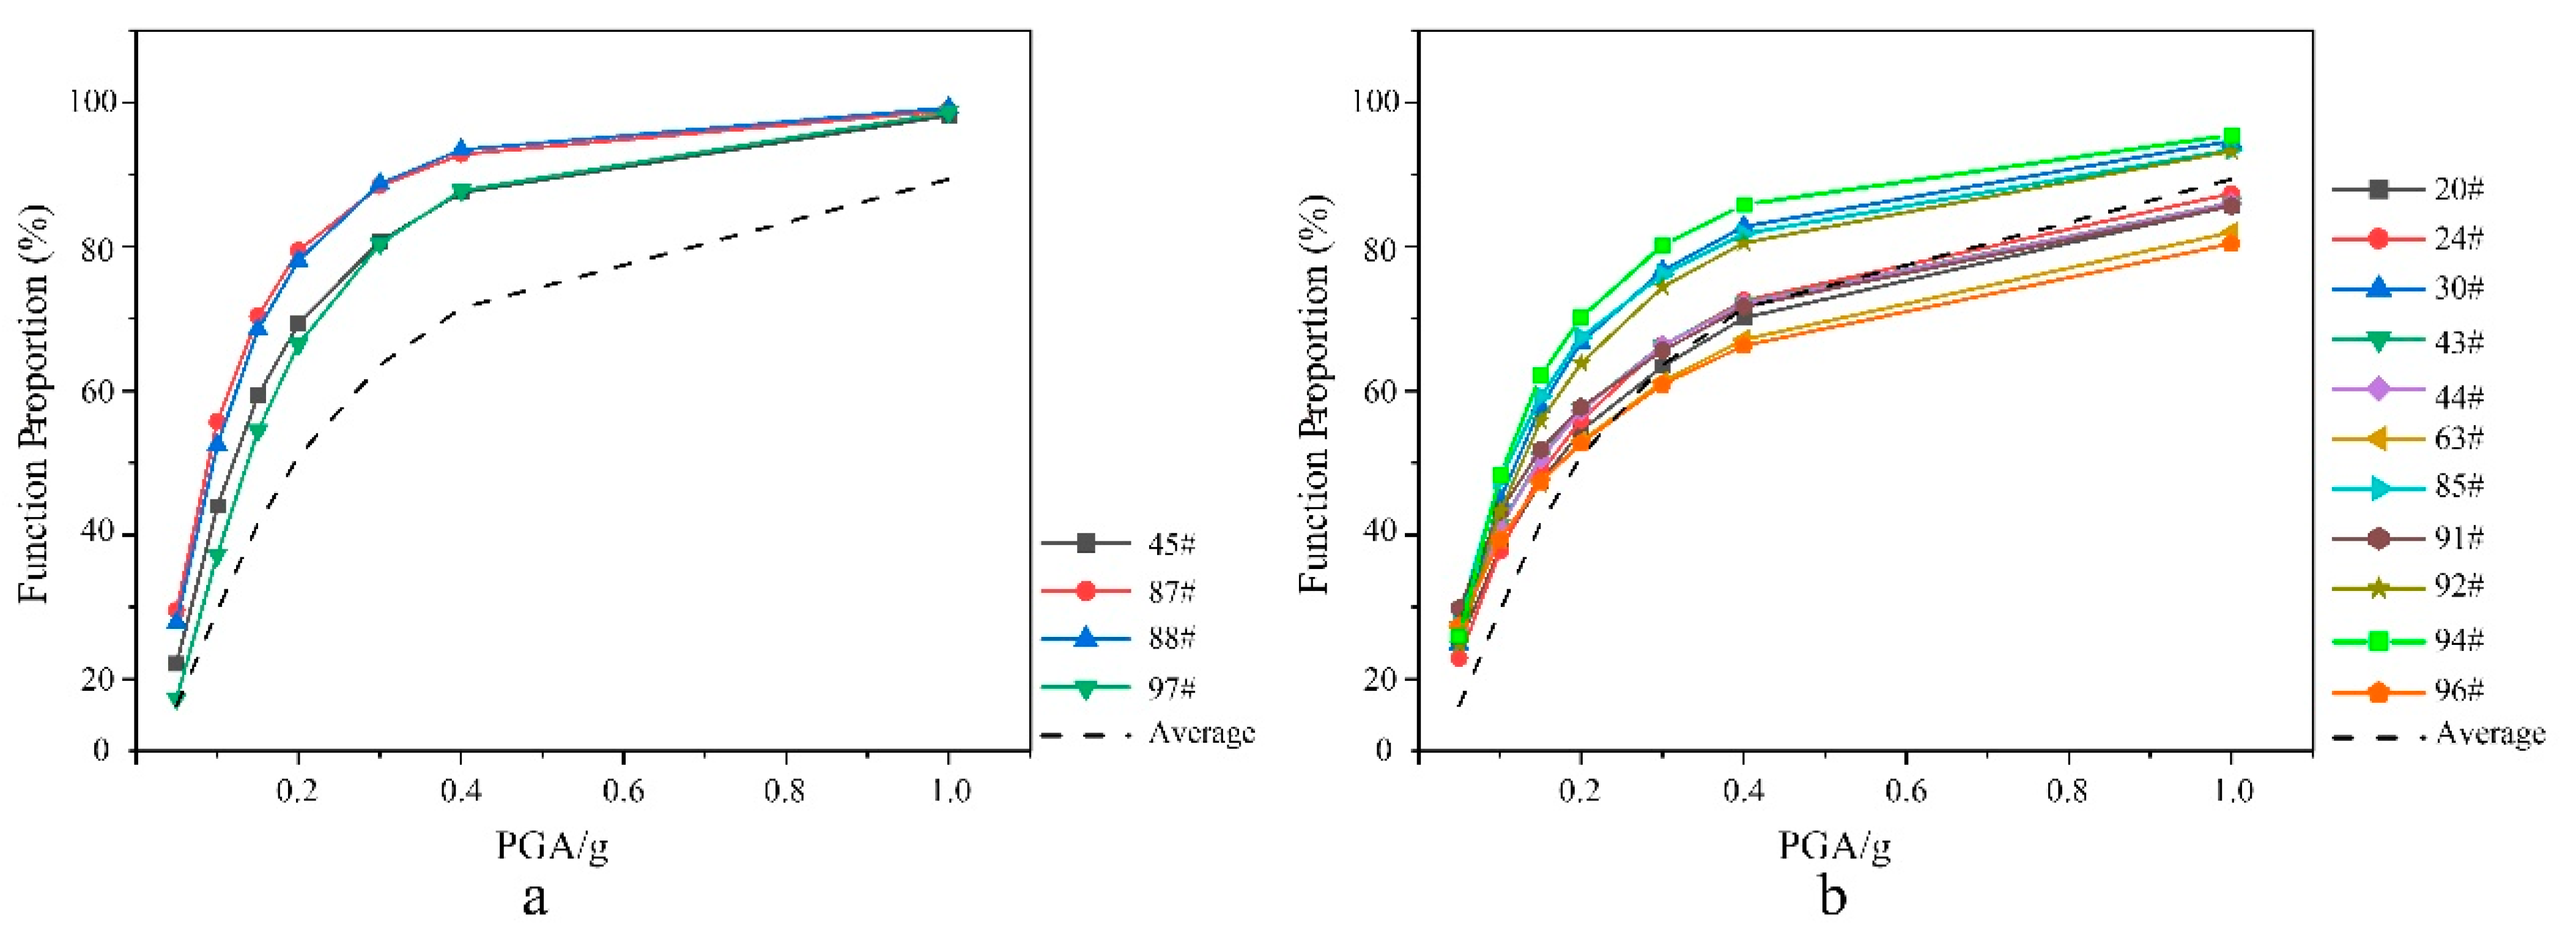
The Monte Carlo method was used to calculate the loss proportion of 90 functional spatial units in the study area. It was found that the loss proportion calculated by the historical experience method and spatial units in three complete communities in the study area were basically the same. There was a 1.5–2.0 times difference in the average value of functional spatial unit losses at the rare earthquake level. Under earthquake protection, the loss ratio of Wangling subdistrict was basically the same, while the average loss ratios of Huanglou subdistrict and Pengcheng subdistrict were slightly higher than the actual evaluation results. Under the earthquake level, the earthquake damage ratios of Huanglou subdistrict and Pengcheng subdistrict were largely similar, while the average unit loss of Wangling subdistrict was less than the actual evaluation result.
Although there are differences, considering the uncertainty of earthquake damage prediction and the diversity of assessment methods and models, the error is acceptable. At present, spatial planning is constantly changing, and it is necessary to propose a fragility assessment method that reflects the impact of disaster events on a larger scale. The key to this method is to take the macroscopic space function parameters and the architectural or experience-based observations of onlookers into account. These can conveniently and dependably provide frameworks for determining various types of functional losses at a larger spatial scale. It will also support the development of planning resilience targets and strategies for spatial units.

5.2. Recommendations

This research proposes a seismic fragility assessment framework for urban functional spatial units. According to the corresponding relationship between function and structure type in spatial units, urban functional classifications were linked with HAZUS structure fragility parameters. With a modified hybrid method, this study used the year of construction and the average number of building floors in a unit as indicators considered to obtain the combined unit’s fragility parameters. At last, fragility curves of units were given and they could show the average level of loss in every unit.
When we obtain the fragility of urban spatial units, we can learn more about the anticipated losses arising from future earthquakes because of seismic influence from a macroscopic perspective. This perspective leads to a top-down approach that can be used to cluster, mitigate and reduce the vulnerability of structures and their users across city neighborhoods when formulating plans. Although spatial units can be used in planning, different divisions might influence fragility. Generally, we can use a parcel, community or any units mapped by specific needs, and the fragility of the unit shows an average level. When we consider the implementation and delivery of planning strategies, using community as a unit is appropriate. In addition, communities are usually used in disaster prevention zone mapping during planning, and it is convenient to implement some measures for community units in terms of their management. Moreover, having standardized functional unit fragility measuring criteria will make it easy, cost effective and widely applicable for agglomerations that have millions of buildings that cannot all be regularly assessed at once in census-type urban risk research.
Of course, some limitations exist. Firstly, different functions in a unit have different occupancies; although Equation (1) uses the same weight for the difference, weights of functional occupancy need to be considered in the future. Secondly, urban spatial unit fragility is calculated by structure fragility parameters, and it is also necessary to develop fragility models suitable for the specific study area. At the same time, there is also a need to further clarify the interface with planning.
In the future, we will conduct more research and improve this model for determining and measuring the fragility of urban functional units. For example, based on the urban fragility curve, risks in spatial units that exceed a certain threshold level can be identified using an average baseline, a certain engineering fortification level or some other higher baselines. Urban fragility assessments can also make it possible to improve urban resilience assessments, and actual spatial resilience as an important aspect of sustainable urbanism.

Supplementary Materials

The following supporting information can be downloaded at: https://www.mdpi.com/article/10.3390/su15108022/s1. Table S1. Fragility parameters for function of spatial element.

Author Contributions

Conceptualization, Z.F. and D.M.; methodology, Z.F. and Y.R.; software, J.W.; validation, Z.F.; formal analysis, W.W.; investigation, X.G.; resources, Y.R.; data curation, Z.F.; writing—original draft preparation, Z.F. and X.G.; writing—review and editing, Z.F.; visualization, Z.F. and Y.R.; supervision, D.M. and J.O.O.; project administration, W.W. and J.Z. All authors have read and agreed to the published version of the manuscript.

Funding

This research was funded by National Natural Science Foundation of China (No. 52278472), and the Beijing Municipal Natural Science Foundation (No. 8232004).

Institutional Review Board Statement

Not applicable.

Informed Consent Statement

Informed consent was obtained from all subjects involved in the study.

Data Availability Statement

Not applicable.

Acknowledgments

The authors thank the anonymous reviewers and academic editors’ valuable advice. All authors agree to acknowledge their contribution.

Conflicts of Interest

The authors declare no conflict of interest.

References

  1. Wallemacq, P.; UNISDR; CRED. Economic Losses, Poverty and Disasters 1998–2017; UNISDR: Geneva, Switzerland; CRED: Brussels, Belgium, 2018. [Google Scholar]
  2. Silva, V.; Akkar, S.; Baker, J.; Bazzurro, P.; Castro, J.M.; Crowley, H.; Dolsek, M.; Galasso, C.; Lagomarsino, S.; Monteiro, R. Current challenges and future trends in analytical fragility and vulnerability modeling. Earthq. Spectra 2019, 35, 1927–1952. [Google Scholar] [CrossRef]
  3. Moehle, J.; Deierlein, G.G. A framework methodology for performance-based earthquake engineering. In Proceedings of the 13th World Conference on Earthquake Engineering, Vancouver, BC, Canada, 1–6 August 2004. [Google Scholar]
  4. Martins, L.; Silva, V. Development of a fragility and vulnerability model for global seismic risk analyses. Bull. Earthq. Eng. 2021, 19, 6719–6745. [Google Scholar] [CrossRef]
  5. Biglari, M.; Formisano, A.J. Damage Probability Matrices and Empirical Fragility Curves From Damage Data on Masonry Buildings After Sarpol-e-zahab and Bam Earthquakes of Iran. Front. Built Environ. 2020, 6, 2. [Google Scholar] [CrossRef]
  6. D’Ayala, D.F.; Paganoni, S. Assessment and analysis of damage in L’Aquila historic city centre after 6th April 2009. Bull. Earthq. Eng. 2011, 9, 81–104. [Google Scholar] [CrossRef]
  7. Barbat, A.H.; Pujades, L.G.; Lantada, N.J. Seismic damage evaluation in urban areas using the capacity spectrum method: Application to Barcelona. Soil Dyn. Earthq. Eng. 2008, 28, 851–865. [Google Scholar] [CrossRef]
  8. Sandoli, A.; Calderoni, B.; Lignola, G.P.; Prota, A. Seismic vulnerability assessment of minor Italian urban centres: Development of urban fragility curves. Bull. Earthq. Eng. 2022, 20, 5017–5046. [Google Scholar] [CrossRef]
  9. Vicente, R.; Parodi, S.; Lagomarsino, S.; Varum, H.; Silva, J. Seismic vulnerability and risk assessment: Case study of the historic city centre of Coimbra, Portugal. Bull. Earthq. Eng. 2011, 9, 1067–1096. [Google Scholar] [CrossRef]
  10. Wiebe, D.M.; Cox, D.T. Application of fragility curves to estimate building damage and economic loss at a community scale: A case study of Seaside, Oregon. Nat. Hazards 2014, 71, 2043–2061. [Google Scholar] [CrossRef]
  11. Whitman, R.V. Damage Probability Matrices for Prototype Buildings; Seismic Design Decision Analysis, Report No. 8; Structures Publication: Washington, DC, USA, 1973. [Google Scholar]
  12. Faccioli, E.; Pessina, V.; Calvi, G.; Borzi, B. A study on damage scenarios for residential buildings in Catania city. J. Seismol. 1999, 3, 327–343. [Google Scholar] [CrossRef]
  13. Orsini, G. A model for buildings’ vulnerability assessment using the parameterless scale of seismic intensity (PSI). Earthq. Spectra 1999, 15, 463–483. [Google Scholar] [CrossRef]
  14. Spence, R.; Coburn, A.; Pomonis, A.; Sakai, S. Correlation of ground motion with building damage: The definition of a new damage-based seismic intensity scale. In Proceedings of the Tenth World Conference on Earthquake Engineering, Madrid, Spain, 19–24 July 1992; pp. 551–556. [Google Scholar]
  15. Brazee, R.J. Reevaluation of Modified Mercalli Intensity Scale for earthquakes using distance as determinant. Bull. Seismol. Soc. Am. 1979, 69, 911–924. [Google Scholar] [CrossRef]
  16. Rota, M.; Penna, A.; Strobbia, C. Typological fragility curves from Italian earthquake damage data. In Proceedings of the 1st European Conference on Earthquake Engineering and Seismology, Geneva, Switzerland, 3–8 September 2006. [Google Scholar]
  17. Fotopoulou, S.; Karafagka, S.; Pitilakis, K. Vulnerability assessment of low-code reinforced concrete frame buildings subjected to liquefaction-induced differential displacements. Soil Dyn. Earthq. Eng. 2018, 110, 173–184. [Google Scholar] [CrossRef]
  18. Zuccaro, G.; Perelli, F.L.; De Gregorio, D.; Cacace, F. Empirical vulnerability curves for Italian mansory buildings: Evolution of vulnerability model from the DPM to curves as a function of accelertion. Bull. Earthq. Eng. 2021, 19, 3077–3097. [Google Scholar] [CrossRef]
  19. Cheng, H.; Chen, Z.; Huang, Y. Quantitative physical model of vulnerability of buildings to urban flow slides in construction solid waste landfills: A case study of the 2015 Shenzhen flow slide. Nat. Hazards 2022, 112, 1567–1587. [Google Scholar] [CrossRef]
  20. Peduto, D.; Nicodemo, G.; Maccabiani, J.; Ferlisi, S. Multi-scale analysis of settlement-induced building damage using damage surveys and DInSAR data: A case study in The Netherlands. Eng. Geol. 2017, 218, 117–133. [Google Scholar] [CrossRef]
  21. Thapa, S.; Shrestha, A.; Lamichhane, S.; Adhikari, R.; Gautam, D. Catchment-scale flood hazard mapping and flood vulnerability analysis of residential buildings: The case of Khando River in eastern Nepal. J. Hydrol. Reg. Stud. 2020, 30, 100704. [Google Scholar] [CrossRef]
  22. Del Gaudio, C.; Ricci, P.; Verderame, G.; Manfredi, G. Development and urban-scale application of a simplified method for seismic fragility assessment of RC buildings. Eng. Struct. 2015, 91, 40–57. [Google Scholar] [CrossRef]
  23. Karimzadeh, S.; Askan, A.; Erberik, M.A.; Yakut, A. Seismic damage assessment based on regional synthetic ground motion dataset: A case study for Erzincan, Turkey. Nat. Hazards 2018, 92, 1371–1397. [Google Scholar] [CrossRef]
  24. Yuan, X.; Zhong, J.; Zhu, Y.; Chen, G.; Dagli, C. Post-earthquake regional structural damage evaluation based on artificial neural networks considering variant structural properties. Structures 2023, 52, 971–982. [Google Scholar] [CrossRef]
  25. Du, A.; Wang, X.; Xie, Y.; Dong, Y. Regional seismic risk and resilience assessment: Methodological development, applicability, and future research needs—An earthquake engineering perspective. Reliab. Eng. Syst. Saf. 2023, 233, 109104. [Google Scholar] [CrossRef]
  26. Biglari, M.; Formisano, A. Urban seismic scenario-based risk analysis using empirical fragility curves for Kerend-e-gharb after Mw 7.3, 2017 Iran earthquake. Bull. Earthq. Eng. 2022, 20, 6487–6503. [Google Scholar] [CrossRef]
  27. Ruggieri, S.; Calò, M.; Cardellicchio, A.; Uva, G. Analytical-mechanical based framework for seismic overall fragility analysis of existing RC buildings in town compartments. Bull. Earthq. Eng. 2022, 20, 8179–8216. [Google Scholar] [CrossRef]
  28. Li, Y.; Liu, C.; Li, Y. Identification of Urban Functional Areas and Their Mixing Degree Using Point of Interest Analyses. Land 2022, 11, 996. [Google Scholar] [CrossRef]
  29. Lin, S.B.; Xie, L.L.; Gong, M.S.; Li, M. Methodology for estimating seismic capacity of city building. J. Nat. Disasters 2011, 20, 31–37. [Google Scholar]
  30. Okoli, C.; Pawlowski, S.D. The Delphi method as a research tool: An example, design considerations and applications. Inf. Manag. 2004, 42, 15–29. [Google Scholar] [CrossRef]
  31. Yin, Z. Classification of Structure Vulnerability and Evaluation of Earthquake Damage From Future Earthquakes. Earthq. Res. China 1996, 12, 49–55. [Google Scholar]
  32. Xie, L.; Ma, Y.; Zhai, C. Performance-Based Seismic Design and Design Ground Motion; China Science Publishing & Media Ltd.: Beijing, China, 2009. [Google Scholar]
  33. Yang, W. Study on the Seismic Fragility of RC Frame Structures; Xi’an University of Architecture & Technology: Xi’an, China, 2016. [Google Scholar]
  34. Lingxin, Z.; Hao, C.; Baijie, Z.; Junkai, S.; Ning, L. Comparison of vulnerability of hybrid masonry-concrete structures designed according to different seismic design code. Earthq. Eng. Eng. Dyn. 2021, 1–8. [Google Scholar] [CrossRef]
  35. GB50011-2001; Code for Seismic Design of Buildings (English Version). China Architecture & Building Press: Beijing, China, 2001.
  36. Cimellaro, G.P.; Reinhorn, A.M.; Bruneau, M.J.E. Framework for analytical quantification of disaster resilience. Eng. Struct. 2010, 32, 3639–3649. [Google Scholar] [CrossRef]
  37. Dong, Y.; Frangopol, D.M. Performance-based seismic assessment of conventional and base-isolated steel buildings including environmental impact and resilience. Earthq. Eng. Struct. Dyn. 2016, 45, 739–756. [Google Scholar] [CrossRef]
  38. Jiang, K. Some Studies on Seismic Damage for Urban Building; Beijing University of Technology: Beijing, China, 2008. [Google Scholar]
  39. GB 50413-2007; Standard for Urban Planning on Earthquake Resistance and Hazardous Prevention, MHURD. China Architecture & Building Press: Beijing, China, 2007; pp. 14–15.
Figure 1. Location of study area.
Sustainability 15 08022 g001
Figure 2. Framework of this paper.
Sustainability 15 08022 g002
Figure 3. Division of spatial units.
Sustainability 15 08022 g003
Figure 4. Chronological distribution of units.
Sustainability 15 08022 g004
Figure 5. HAZUS Code proportion of units with weak areas.
Sustainability 15 08022 g005
Figure 6. Buildings in the study area.
Sustainability 15 08022 g006
Figure 7. Quantity statistics of POI categories of spatial units.
Sustainability 15 08022 g007
Figure 8. Functional proportion of spatial units (descriptions of abbreviations can be found in Table 5).
Sustainability 15 08022 g008
Figure 9. Fragility comparison between spatial unit 56# and other structures [31,32,33,34].
Sustainability 15 08022 g009
Figure 10. Fragility comparison between spatial unit 97# and other structures [31,32,33,34].
Sustainability 15 08022 g010
Figure 11. Functional spatial unit loss ratio ((a). Construction ratio below 50% after 2001, and (b). Construction ratio 50–90% after 2001).
Sustainability 15 08022 g011
Table 1. International building structure classification system.
CountriesTaxonomyDescription
USAATC-1378 structures, 40 of buildings.
USAHAZUS36 structures, 3 height ranges.
EUEMS-9815 types, including 7 of masonry, 6 of RC
EURISK-UE7cities, 23 types.
Table 2. Seismic fortification of buildings in China and corresponding periods.
GroupDescription
–1978Before the Tangshan earthquake, the buildings were basically in the non-fortification stage
1978~1989The buildings are fortified in accordance with the Code1978
1989–2001The buildings are fortified in accordance with the Code 1989
2001–The buildings are fortified in accordance with the Code 2001
Table 3. Connection with HAZUS under Xuzhou fortification scenario.
Fortification Intensity2001–1989–20011978–1989–1978
VIIHigh-CodeModerate-CodeLow-CodePre-Code
Table 4. Data source.
DataDescriptionSource
Boundary dataIncludes the boundary of the research area, communities, etc.
Spatial unitsAn unit for assessing fragility.Draw by author
POIIncludes 19,291 POI of the research area with name, type, address, latitude and longitude.Gaode Map API
μ i and β i Thirty-six structures types, four seismic design levels (high-code, moderate-code, low-code, pre-code)HAZUS
Table 5. The corresponding relationship between function and structure type in spatial units.
Fun-Level 1Fun-Level 2Fun-Level 3HAZUS Fragility
Public service(A)SportsFitness sites (FS)PC1
Sports buildings (SB)S1
ToiletPublic Toilet (TO)RM2
Education and ResearchPrimary and Secondary (PS)C1
Training institution (TI)S5
Research institution (RI)C2
Art museum (AM)C1
University (UN)C1
Cultural facilityExhibition hall (EH)S4
Museum (MU)C1
Library (LI)C1
Training (TR)C1
Palace of Culture (PC)S1
Cultural relics and historic sitesCultural relics and historic sites (CR)W1
AdministrationGovernment (GO)C1
Social organization (SO)S4
Commercial service(B)Commercial serviceBeauty (BE)C3
Convenience store (CS)C3
Shopping mall (SM)PC2
Entertainment venues (EV)S1
Bazaar (BA)PC1
Movie theater (MT)S1
Service hall (SH)C3
Hotel (HO)C2
Catering (CA)S1
Business facilityIncorporated business (IB)C1
Office building (OB)C1
Finance and insurance (FI)C1
Retail provisionAutomobile service (AS)C2
Residential(R)Residential supportKindergarten (KI)C1
CommunityCommunity (CO)C1
Table 6. Fragility parameters for the function of spatial units (partial).
IDμ(S)μ(M)μ(E)μ(C)β(S)β(M)β(E)β(C)
10.090.190.531.180.630.620.640.66
20.090.190.521.180.640.640.610.67
30.080.150.40.870.640.660.660.65
40.080.150.410.910.650.640.650.63
780.110.230.631.490.640.640.630.64
790.110.230.631.420.650.640.640.63
800.10.20.551.260.650.650.650.64
960.090.180.511.111.331.631.81.96
970.080.130.250.410.640.650.640.66
Table 7. Seismic damage matrix/fragility parameters involved in comparison.
SourceApplicability of StructureDescription
Yin, 1996 [31]Steel, RCEmpirical method
Xie, 2008 [32]GeneralApplicable to new buildings
Yang, 2016 [33]RCIDA
Zhang, 2021 [34]MasonryIDA, Code for seismic design of buildings (GB50011-2001) [35]
Table 8. Triangular distribution of spatial unit damage ratio.
Damage State (DSj)Proportion (S)
No impact (j = 1)(0, 0.05, 0.1)
Mild impact (j = 2)(0.1, 0.2, 0.3)
Moderate impact (j = 3)(0.3, 0.5, 0.7)
Extremely impact (j = 4)(0.7, 0.8, 0.9)
Completely impact (j = 5)(0.9, 0.95, 1.0)
Table 9. Comparison of loss proportion of streets in the study area.
ComunitySpatial UnitsFrequent EarthquakeFortification EarthquakesRare Earthquake
Huanglou66~68#0.15510.30800.5406
Jiang [38]0.15310.18820.2819
Wangling28#/29#, 56~58#0.12720.24160.4624
Jiang [38]0.18400.22490.3220
Pengcheng61~64#0.16880.29230.4972
Jiang [38]0.17620.21580.3140
Disclaimer/Publisher’s Note: The statements, opinions and data contained in all publications are solely those of the individual author(s) and contributor(s) and not of MDPI and/or the editor(s). MDPI and/or the editor(s) disclaim responsibility for any injury to people or property resulting from any ideas, methods, instructions or products referred to in the content.

