Article

Evaluating Impacts of Opencast Stone Mining on Vegetation Primary Production and Transpiration over Rajmahal Hills

by
Avinash Kumar Ranjan
1,
Bikash Ranjan Parida
2,
Jadunandan Dash
3 and
Amit Kumar Gorai
1,*
1
Department of Mining Engineering, National Institute of Technology, Rourkela 769008, India
2
Department of Geoinformatics, School of Natural Resource Management, Central University of Jharkhand, Ranchi 835222, India
3
School of Geography and Environmental Science, University of Southampton, Highfield, Southampton SO17 1BJ, UK
*
Author to whom correspondence should be addressed.
Sustainability 2023, 15(10), 8005; https://doi.org/10.3390/su15108005
Submission received: 6 April 2023 / Revised: 4 May 2023 / Accepted: 11 May 2023 / Published: 14 May 2023

Abstract

:
Opencast mining has significantly triggered vegetation degradation in many ecologically sensitive regions across the globe. The detailed spatio-temporal information on mining-induced vegetation degradation and associated primary production loss are crucial inputs to authorities and policymakers to frame and implement sustainable development programs in the mining regions to conserve vegetation ecology. Thus, the present study aimed to decipher the mining-induced vegetation cover and subsequent productivity losses over the Rajmahal Hills in Jharkhand (India). The Gross Primary Productivity (GPP), Net Primary Productivity (NPP), and Vegetation Transpiration (VT) datasets were used for analyzing the mines-induced losses in vegetation cover and associated productivity. The key findings indicated a loss of vegetation cover by ~340 km2 and an expansion of the mining area by ~54 km2 over the Rajmahal Hills during 1990–2020. The change detection analysis at the decadal period revealed that ~3.06 km2, 8.10 km2, and 22.29 km2 of vegetation cover were lost only due to the mining activity during 2000–2010, 2010–2020, and 2000–2020, respectively. The replacement of vegetation cover by mining area has caused GPP loss of 0.01 tonnes carbon (tC) per day, 0.04 tC/day, and 0.09 tC/day; NPP loss of ~1.25 tC, 2.77 tC, and 7.27 tC; VT loss of 5200 mm/day, 13,630 mm/day, and 30,190 mm/day during 2000–2010, 2010–2020, and 2000–2020, respectively. Hence, the present study revealed that the mining-induced vegetation losses have caused an alteration of carbon sequestration, carbon stock, and VT over the Rajmahal Hills.

1. Introduction

Mining activity is one of the main drivers of deforestation, biodiversity loss, forest degradation, land degradation, land use–land cover (LULC) change, air and water pollution, etc., worldwide [1,2,3]. The excavation of mining pits results in significant loss of vegetation in the surrounding areas, reducing biodiversity and ecosystem functions [4]. Several studies across the globe, such as Australia [5], Brazil [6], China [3], India [7], Malaysia [8], South Africa [2], Indonesia [9], Ghana [10], Peru [11], Russia [12], and United States [13], revealed remarkable vegetation or forest cover loss due to mining activities. The Amazon Forest is also a well-known global hotspot for mining-induced deforestation and vegetation degradation. Sonter et al. [14] reported ~11,670 km2 of deforestation in the Brazilian Amazon due to mining activity during 2005–2015. Caballero Espejo et al. [11], Paiva et al. [15], Siqueira-Gay et al. [6], and Siqueira-Gay and Sánchez [1] have also reported and highlighted the mining-induced forest and biodiversity loss in the Amazonian forest. Likewise, various mining projects in the eastern and central Indian states (e.g., Jharkhand, Odisha, Chattisgarh, Andhra Pradesh, Madhya Pradesh, etc.) are linked to landslides and other environmental impacts (e.g., vegetation degradation, biodiversity loss, groundwater scarcity) [16,17,18,19]. Similarly, many other ecologically sensitive regions across the globe are under the threat of large-scale opencast mining activity, which may further damage a vast amount of ecological wealth and associated services [20,21,22]. The impact of opencast mining on vegetation is particularly severe in tropical regions, where the high biodiversity and endemism of the forests can be irreversibly affected [23,24,25]. These studies reported LULC alteration vis-à-vis forest cover losses associated with different kinds of opencast mining activities (e.g., coal, stone, metal) across India [26,27].
Clearing vegetation cover due to mining activity has several direct or indirect consequences on the terrestrial ecosystem (e.g., soil erosion and degradation, biodiversity loss, water cycle disruption, greenhouse gas emissions, and albedo effect) [28,29,30]. Most importantly, the mining-induced vegetation cover loss significantly causes vegetation productivity (e.g., carbon fixation from the atmosphere and carbon stocks) and transpiration losses, which both are critical components of ecosystem functioning [28,31]. The loss and alteration of vegetation productivity and transpiration due to vegetation cover loss can significantly trigger global warming and climate change at a local, regional, and global scale [30,31]. Decreasing trends in Gross Primary Productivity (GPP), Net Primary Productivity (NPP), and increasing trends in Vegetation Transpiration (VT) can have several undesirable effects on ecosystem functioning. So, it is crucial to continuously monitor and assess the mining-induced vegetation cover and associated ecological losses. Such studies shall help to understand the nature of the mining process and how mining operations can be designed to have the least possible impact on society and the environment. Furthermore, such studies in the mining regions can provide insight into managing best and conserving land and ecological resources for mitigating the associated negative changes.
In this context, remote sensing satellite datasets have been widely used for analyzing and accounting for mining and anthropogenic activity-induced deforestation and subsequent losses in vegetation productivity across the globe. For instance, Malaviya et al. [32], Mishra et al. [25], Ranjan et al. [24], etc., in India; Sonter et al. [33], Basommi et al. [34], Mi et al. [35], etc., have utilized satellite remote sensing datasets for assessing vegetation cover loss due to different kinds of opencast mining activities (e.g., coal, stone, metal) across different regions of the world. Similarly, many studies were conducted to evaluate the effects of mining-induced vegetation loss on carbon sequestration and carbon stock. Huang et al. [28] used different satellite products and analyzed the coal mining-induced carbon stock loss in Datong mining area in China. The study found that mining activities have drastically reduced biomass and diminished vegetation’s ability to fix atmospheric CO2. Liao et al. [36] used the Carnegie–Ames–Stanford Approach (CASA) model along with different satellite products and climatological parameters to assess the NPP (i.e., an indicator of carbon stock) over mining regions in China. The study found a decrease in NPP owing to mining-induced vegetation loss and an increase in NPP due to vegetation recovery in mining sites. Moreover, several studies across the globe have investigated the impact of mining on vegetation productivity using satellite data [31,37,38]. Overall, the above-mentioned studies indicated that mining operations have significantly affected plant productivity in ecologically sensitive locations across the world.
The loss of vegetation transpiration linked to mining-induced vegetation cover reduction has received little attention globally. The loss of vegetation production caused by opencast mining activities is rarely studied, especially in the Indian mining regions. Most of the previous studies in Indian mining regions were limited to assessing mining-induced vegetation loss, land cover alteration, and vegetation health assessment [25,39,40,41,42]. These studies demonstrated a large-scale vegetation cover loss caused by mining operations for the last few decades over a few major mining-dominated states (i.e., Jharkhand, Odisha, and Chhattisgarh) [7,24,25]. The mining and anthropogenic activity-induced deforestation in India could be one of the major sources of CO2 and other greenhouse gas emissions. Moreover, air pollution induced by mining has several local and global implications based on the type of material extracted and the extraction method [39,43]. In fact, this damage from air pollution has repercussions not only on biodiversity but also on the health of living beings and the local micro-economy. It can have consequences on the local and regional climate by altering temperature and precipitation patterns. Other than the environmental impacts and social risks, mining also plays a vital role in the economic development of several countries by providing employment opportunities, generating revenue, and supplying raw materials for various industries such as construction, manufacturing, and energy production. The mining sector in India and the world generates significant employment opportunities, particularly in remote and underdeveloped regions. In 2020, ~1.2 million people directly and ~8.5 million indirectly were employed in the mining sector in India [44].
The ecologically fragile Rajmahal Hills in the Jharkhand state of India have also experienced remarkable vegetation cover loss due to large-scale stone quarrying and other human interferences in the recent few decades (2000–2020) [27]. Therefore, the present study aimed to evaluate the losses of vegetation cover along with primary production and transpiration over the Rajmahal Hills due to large-scale stone mining operations. The present study can assist in identifying changes in plant communities and land use patterns induced by mining activities, enabling informed decision-making and policy design to mitigate those consequences by encouraging sustainable land use practices for protecting ecosystems and biodiversity. Thus, the main objectives of the present study were (a) to analyze vegetation cover loss due to mining activity over the Rajmahal Hills during 1990–2020 using the Landsat series satellite dataset and (b) to evaluate vegetation productivity and transpiration losses using multi-sensor satellite datasets caused due to mining-induced vegetation cover loss. The study’s outcomes can help policymakers to develop strategies and measures to safeguard ecosystems, preserve natural resources, and promote sustainability in the mining sector at multiple levels, including government, industry, and civil society. By incorporating the study’s findings into policies, regulations, and guidelines, decision-makers can promote sustainable mining practices that are directly or indirectly aligned with the United Nations (UN) Sustainable Development Goals (SDGs) of Goal 15 (Life on Land), Goal 13 (Climate Action), and Goal 12 (Responsible Consumption and Production). It shall further help in guiding towards sustainable mining practices that promote ecosystem preservation, responsible natural resource management, and sustainability for the well-being of current and future generations.

2. Materials and Methods

2.1. Description of the Study Area

The study area was selected as the Rajmahal Hills, situated in the eastern portion of India (the easternmost part of the Chotanagpur Plateau) (Figure 1). Rajmahal Hills is prolonged across the four districts (i.e., Sahibganj, Pakur, Godda, and Dumka) of the Jharkhand state. Rajmahal Hills was formed due to volcanic eruption in the Mesozoic era of the Jurassic period, ~0.1 billion years ago. The Rajmahal Hills series is extended over ~2600 km2, predominately enclosed with vegetation (~2000–2200 km2 area). The major vegetation types of Rajmahal Hills belong to the deciduous broadleaf forest (DBF) followed by savannas (SV), natural vegetation (NV), woody savannas (WSV), and mixed forest (MF) [27,40]. In the study regions, broadly three seasons—winter: October to February; monsoon: June to September; and summer: March to May—are recognized as having a significant impact on the vegetation growth cycle [40]. Typically, the summertime and wintertime air temperatures range from 10 to 20 °C, respectively. Over 75% of the rainfall occurred during the monsoon season, with an average annual rainfall of 1500 to 1700 mm [40].
The large extent of vegetation coverage has various socio-ecological importance for the regions, including local climate governance. However, vegetation coverage over the Rajmahal Hills has been remarkably disturbed in recent decades due to large-scale stone quarrying/mining activities and other human interventions (timber cutting, settlement encroachments, construction works, etc.) [27]. Rajmahal Hills is highly enriched in mineral resources, such as coal reserves, kaolin, bentonite, and plant fossils of the Jurassic period [45]. The abundant availability of mineral resources seriously threatened the vegetation cover and land use dynamics due to mining activities over the Rajmahal Hills.

2.2. Data Used

In this study, multi-sensor satellite/gridded products were used to achieve the different objectives of the present study (Table 1). The satellite/gridded datasets (e.g., Landsat, gross primary productivity, net primary productivity, and vegetation transpiration) were pooled and processed in Google Earth Engine (GEE) cloud platform. The specification and details of the individual datasets are mentioned in further sub-sections.

2.2.1. Landsat-Series Satellite Data

Surface reflectance datasets of Landsat-series satellite with 30 m spatial resolution were used for decadal LULC classification (e.g., 1990, 2000, 2010, and 2020) and vegetation cover loss analysis during the study periods. Based on the data availability, the LULC study was conducted from 1990–2020. Due to the unavailability of data and different spatial resolution, data before 1990 was not taken for the study. Landsat-5 Thematic Mapper (TM) was used for the years 1990, 2000, and 2010, whereas Landsat-8 Operational Land Imager (OLI) sensor was used for 2020. Landsat-7 Enhanced Thematic Mapper Plus (ETM+) was not considered due to poor data quality (i.e., scanline errors). Multi-date images (all available scenes) with 0% cloud cover were only taken to make a single composite image (using median operation) for particular study years to reduce the spectral inconsistencies due to seasonal impacts or other factors. The number of cloud-free scenes available for each year was: 5 scenes (5 January 1990, 21 January 1990, 6 February 1990, 11 April 1990, 23 December 1990) for 1990, 4 scenes (17 January 2000, 21 March 2000, 2 December 2000, 18 December 2000) for 2000, 2 scenes (2 April 2010, 14 December 2010) for 2010, and 4 scenes (24 January 2020, 23 November 2020, 4 December 2020, 25 December 2020) for 2020. The satellite scenes were corrected for atmospheric effects using Landsat Ecosystem Disturbance Adaptive Processing System (LEDAPS) algorithms (Masek et al., 2006) for Landsat-5 and Land Surface Reflectance Code (LaSRC) algorithms (Vermote et al., 2016) for Landsat-8. Dark Object Subtraction (DOS) was also performed using QGIS software (version 3.14) to remove the effects of atmospheric scattering and absorption from satellite imagery (black spots caused due to shadow).

2.2.2. Gross Primary Productivity (GPP) and Vegetation Transpiration (VT) Data

The Penman-Monteith-Leuning version 2 (PML-V2) model is a water–carbon coupled diagnostic biophysical model [46,47]. PML_V2 products offer evapotranspiration (ET), its three components (i.e., vegetation transpiration (hereafter, VT), soil evaporation, and an interception from vegetation canopy), and gross primary productivity (GPP) data at 500 m and 8-day resolution. The key benefits of the PML_V2 products are that it estimates the transpiration and GPP via canopy conductance [47,48]. On the other hand, it separates evapotranspiration (ET) into three components (i.e., transpiration from vegetation, direct evaporation from the soil, and vaporization of intercepted rainfall from vegetation) [46]. The PML_V2-based products have exhibited more robust competency with the flux site observations globally than the MODIS-based GPP [46,47]. Nevertheless, PML_V2 products are similar to or noticeably better than major state-of-the-art ET and GPP products widely used by water and ecology science communities [47]. The details on PML_V2-based GPP and VT datasets can be found in Zhang et al. [47].
Gross primary production (GPP) is an essential component of carbon balance and indicates the total carbon intake (carbon sequestration) through photosynthesis per unit of time and per unit of area. It is crucial to analyze variations in long-term estimates of the CO2, including the atmosphere fluxes, to determine the global or regional carbon balance, especially in forest ecosystems, which are the primary sinks of atmospheric carbon in the biosphere. To better understand ecosystem carbon dynamics, agricultural productivity, and climate change, accurate GPP estimations are decisive [49,50,51]. Thus, the present study intended to deploy the annual GPP product to analyze the impacts of mining activity on the rate of atmospheric carbon dioxide uptake by the vegetation during photosynthesis.
VT is a vital process in the water cycle and is responsible for most of the water vapor present in the atmosphere. VT is a process in which water is mainly evaporated through the stomata of plant leaves and released into the atmosphere. This process is called evaporative cooling, which helps to regulate the foliage’s temperature and the surrounding air. Hence, the VT has a significant role in the local and global water vapor budget. Thus, the present study used a PML_V2-based VT dataset for analyzing the losses in VT caused by the mines-induced vegetation cover loss in the study area during 2001–2021.

2.2.3. Net Primary Productivity (NPP) Datasets

The Terra Moderate Resolution Imaging Spectroradiometer (MODIS)-based NPP product (MOD17A3HGF) was used for analyzing vegetation production affected due to mining operations. The MOD17A3HGF (version 6.1) products provide gap-filled annual NPP at 500 m spatial resolution. The MOD17A3HGF is derived from the sum of all 8-day net photosynthesis (PSN) products (MOD17A2H). The gap-filled MOD17A3HGF is an upgraded version of MOD17 that has removed the low-quality inputs from the 8-day Leaf Area Index and Fraction of Photosynthetically Active Radiation (LAI/FPAR) based on the Quality Control (QC) label for each pixel. The details on MODIS NPP can be found in Running and Zhao [52].
NPP is the initial tangible stage in transferring atmospheric carbon to the biosphere. NPP is vegetation’s net carbon gain (stock), equivalent to the difference between photosynthetic gains and plant respiration (losses). Additionally, it is the key process in carbon cycling and the main direct product for human society from the vegetation ecosystem. As an essential indicator of ecosystem functioning, NPP change has been widely used to reflect the environmental problems caused by anthropogenic activities, such as mining, urbanization, deforestation, etc. [53,54]. Thus, the present study used annual NPP datasets to approximate the loss of vegetation carbon stock (i.e., indirect CO2 emission) due to mining activity over the Rajmahal Hills from 2001 to 2021.

2.3. Methods

The workflow of the present includes satellite/gridded data acquisition, data pre-processing, image classification, geographic information system (GIS) operations, and result analysis). The flowchart is shown in Figure 2. The present study is mainly divided into two parts:
(a)
The first part of the study focuses on assessing vegetation cover loss due to the expansion of mining areas during the study periods (e.g., 1990–2000, 2000–2010, 2010–2020, and 1990–2020) using multi-temporal Landsat series satellite datasets;
(b)
The second part of the study focuses on accounting for vegetation GPP, NPP, and VT losses due to mines-induced vegetation cover loss by using MODIS and PML_V2 satellite-based products.
The details of a few key steps of the present study are discussed in further sub-sections.

2.3.1. Land Use–Land Cover (LULC) Classification and Change Detection Analysis

In the present study, the land use–land cover (LULC) dynamic was assessed based on the classification of multi-temporal Landsat imageries using the Random Forest (RF) classification method. RF is a powerful and robust machine-learning method widely used for classifying LULC from remote-sensing satellite datasets. RF yields higher classification accuracy than some well-known classifiers, such as support vector machine (SVM), k-nearest neighbors (kNN), and maximum likelihood classification (MLC), among others [55,56,57,58]. The random forest algorithm is the non-parametric supervised classification algorithm that uses sets of decision trees to obtain the utmost classification accuracy. It studies the training sets of each class and forms a classified raster for identical reflectance as output by averaging multiple deep decision trees.
As the present study focused on vegetation loss due to mining activity, the LULC was broadly classified into four classes, namely mining, vegetation, water body, and others. The mining class includes coal and stone mining, while vegetation comprises forests, shrublands, and grasslands. The water body encompasses ponds, river streams, and dams. Whereas, Other class embraces bare land, sands, and fallow land. The training (150 points) and validation (50 points) samples for each class were collected based on the false color composite (FCC) of satellite data and the Google Earth experience. The RF classification on the Landsat dataset was performed using Sentinel Processing Application (SNAP) software (version 8.0), developed by European Space Agency (ESA). After performing the LULC classification, the accuracy assessment was done using the confusion matrix wherein the overall accuracy, user’s accuracy, producer’s accuracy, and kappa coefficient were estimated.
Furthermore, the land cover dynamics were evaluated using the cross-tabulation change detection approach between two study years (e.g., 1990–2000, 2000–2010, 2010–2020, and 1990–2020). The LULC transformation between different LULC classes (conversion of one class into another) was also estimated by preparing the LULC change matrix. A change matrix makes it possible to identify the primary sorts of changes or directions among the LULC classes in the study region. Later, the annual rate of change in LULC class was estimated using Equation (1), as suggested by Puyravaud et al. [59].
r = 1 t 2 t 1 × ln A 2 A 1
where r = the rate of change for each class per year, A2 and A1 = the class areas at the end and the beginning, respectively, for the period being evaluated, and t is the number of years spanning that period.

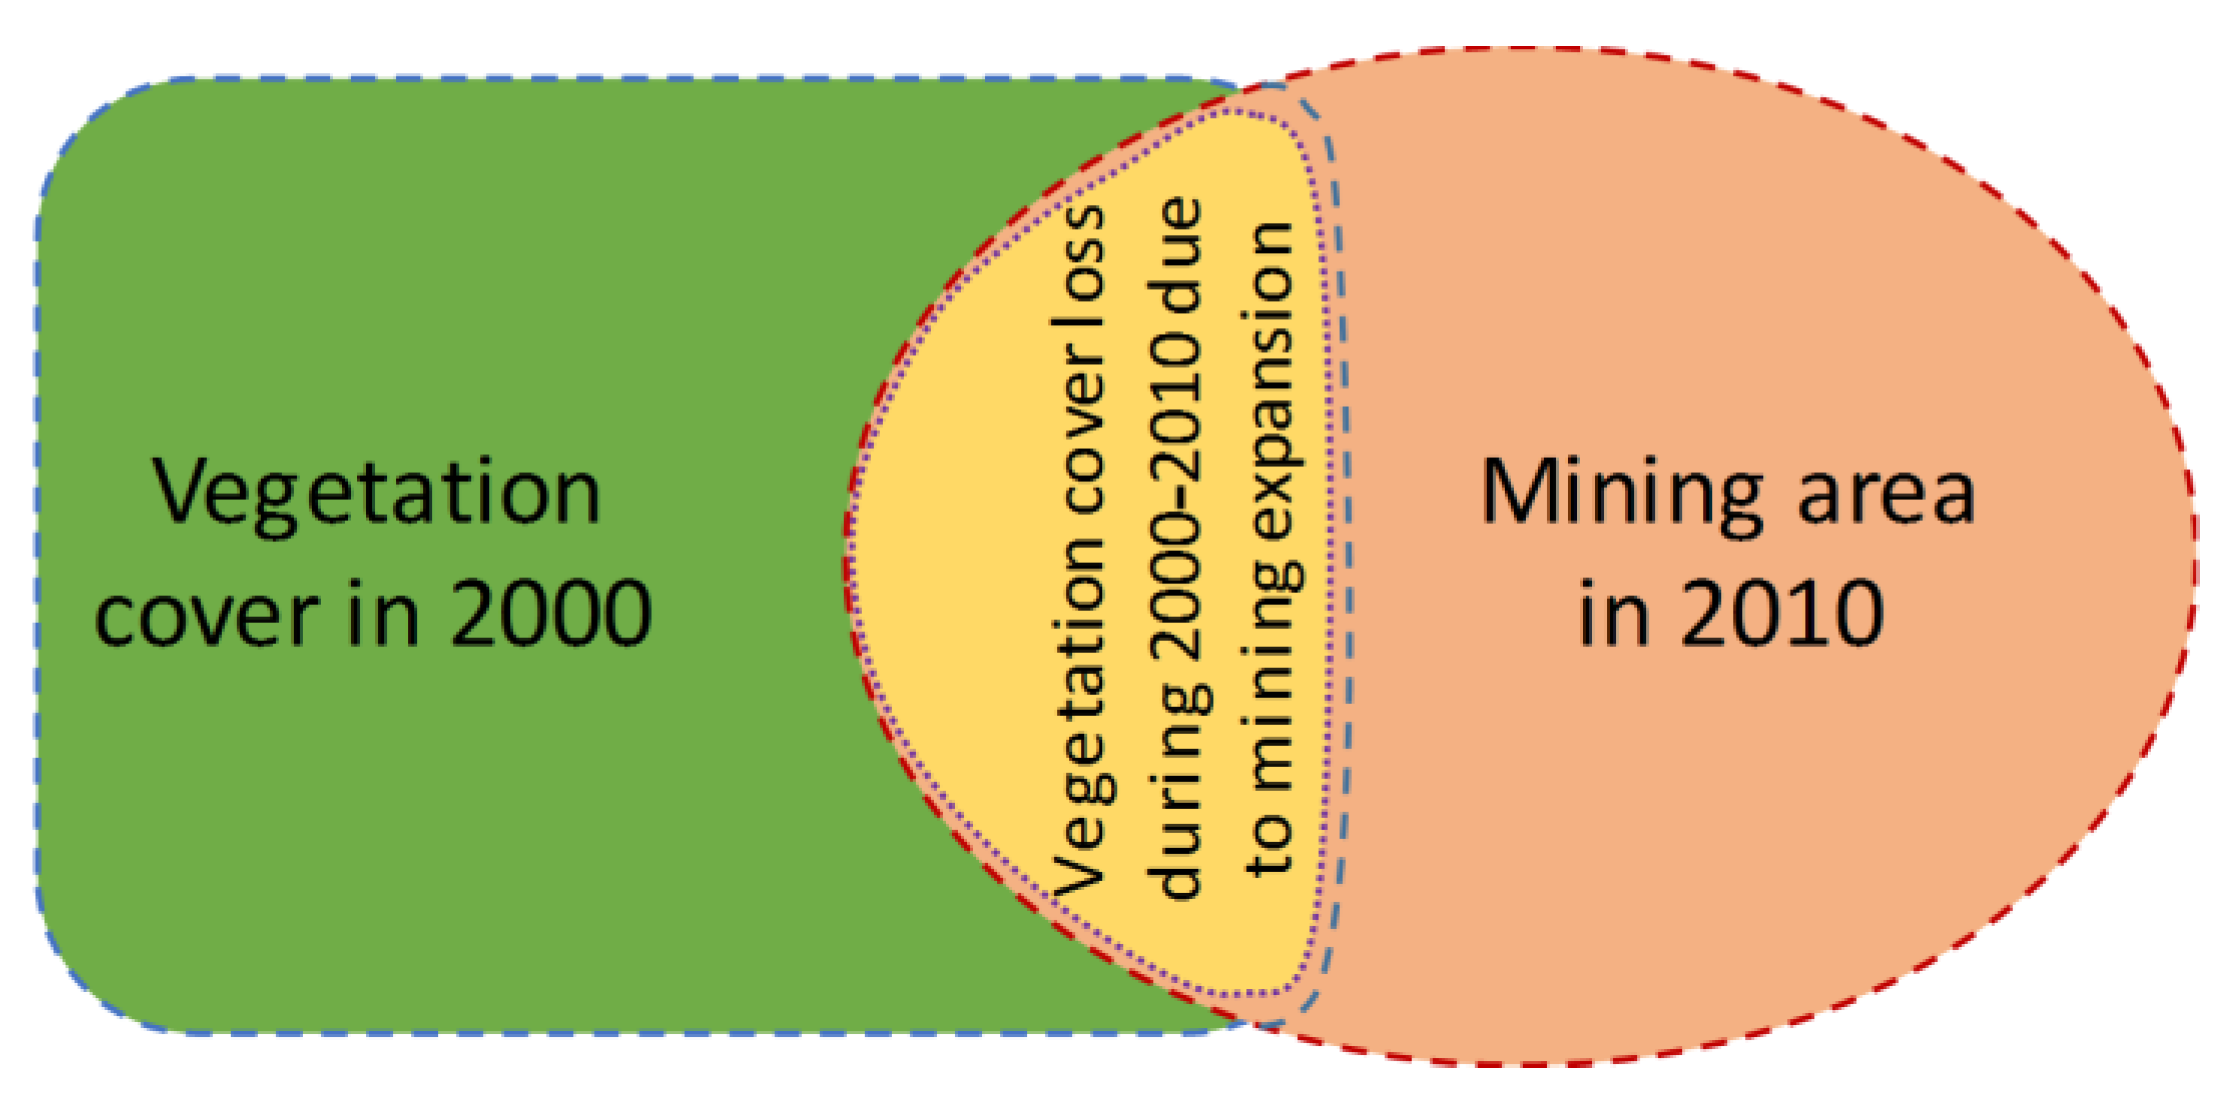
2.3.2. Loss of GPP, NPP, and Transpiration Due to Mining-Induced Vegetation Cover Loss

The intersection GIS operation was performed between mining and vegetation classes during two study years/periods to estimate the mining-induced vegetation cover loss (Figure A1). The mining and vegetation patches were converted into vector data format from the raster before performing the intersection operation. Finally, the overall NPP, GPP, and VT loss over mines-induced vegetation loss patches were then estimated using Equation (2).
L X = X t X t 1
where LX = loss of GPP, NPP, VT between two study years/periods; Xt = total GPP/NPP/VT of polygons where the vegetation converted into mining area at time t (later period); and Xt−1 = total GPP/NPP/VT of polygons where the vegetation converted into mining area at time t − 1 (earlier period). In the present study, the value of Xt was taken as 0, as we assumed that there is no more GPP, NPP, and VT due to vegetation cover loss (i.e., clean out) caused by mining expansion in the later period.

2.3.3. GPP, NPP, and VT Trend Analysis

Theil-Sen’s slope analysis was performed to depict the long-term (2001–2020) annual GPP, NPP, and VT trends over the mining patches across Rajmahal Hills. Theil-slope Sen’s is a non-parametric method that determines the linear trend by estimating the median slope between all data points [60,61]. The Theil-Sen’s slope method is effective because it produces correct confidence intervals for data with skewed behavior and heteroscedasticity and is insensitive to outliers [62]. Thus, Theil-slope Sen’s analysis has been utilized more frequently to comprehend long-term trends in a variety of investigations pertaining to climatology, ecology, and hydrology [18,63]. The ‘spatialEco’ Package in R was used for trend analysis of vegetation productivity indicators [64]. The “spatialEco” Package can handle autocorrelation and seasonality effects in the data, accounting for more significant uncertainty in trend estimations for a time series of atmospheric parameters.
β = M e d i a n X j X i j i , j > i
where β is the tendency of the vegetation productivity indicators sequence, xi, xj are the sequences of vegetation productivity indicators, i, and j is the year of the vegetation productivity indicators. When β > 0, the time series shows an upward (increasing) trend; when β < 0, the time series shows a downward (decreasing) trend.
The unitary linear regression approach was also used to analyze the long-term annual trends of GPP, NPP, and VT according to the Ordinary Least Squares (OLS) over different mining locations in Rajmahal Hills. The slope of trends was estimated using Equation (4).
θ s l o p e = n × i = 1 n i × P i i = 1 n i 1 n P i n × i = 1 n i 2 ( i = 1 n i ) 2
where θslope = the increasing or decreasing rate of NPP/GPP/VT; n = the total number of observations (21), i = the year order from 1 to 21 in the study period; and Pi = NPP/GPP/VT in the ith year. When θslope > 0, then the trend increases; When θslope < 0, then the trend decreases.

3. Results

3.1. Land Use–Land Cover (LULC) Classification and Accuracy Assessment

The spatiotemporal distribution of different LULC features, namely Vegetation, Mining, Water body, and Others, is presented in Figure 3a–d for the study years 1990, 2000, 2010, and 2020, respectively. Before analyzing and assessing the LULC transformation, it was essential to evaluate the accuracy of classified LULC maps. The confusion matrix table (Table 2) revealed that the LULC maps were classified with considerable classification accuracy, wherein the overall classification accuracy was observed as ~94%, 95%, 93.50%, and 95.50% for the years 1990, 2000, 2010, and 2020, respectively. The kappa coefficient for these years was found to be 0.92, 0.93, 0.91, and 0.94, respectively. Besides, the user’s accuracy of mining and vegetation class was found considerable for further use (84–90% for mining and 94–96% for vegetation). The details of the accuracy assessment using the confusion matrix are provided in Table 2.
The LULC maps of the Rajmahal Hills during 1990–2020 showed that vegetation coverage significantly decreased (Figure 3). On the other hand, a significant increment in the mining area was noted (zoomed regions in Figure 3). Especially from 2010–2020, a drastic rise in the mining areas was seen, which caused a loss in vegetation cover over the Rajmahal Hills. The top northern, eastern, western, and lower regions of the Rajmahal Hills were found to have notable stone and coal mining clusters (Figure 3, Zoomed regions). Before 2000, the stone mining patches were less, while they remarkably increased in the last two decades (from 2010), as shown in Figure 3 (Z1, Z2, Z4, Z5).

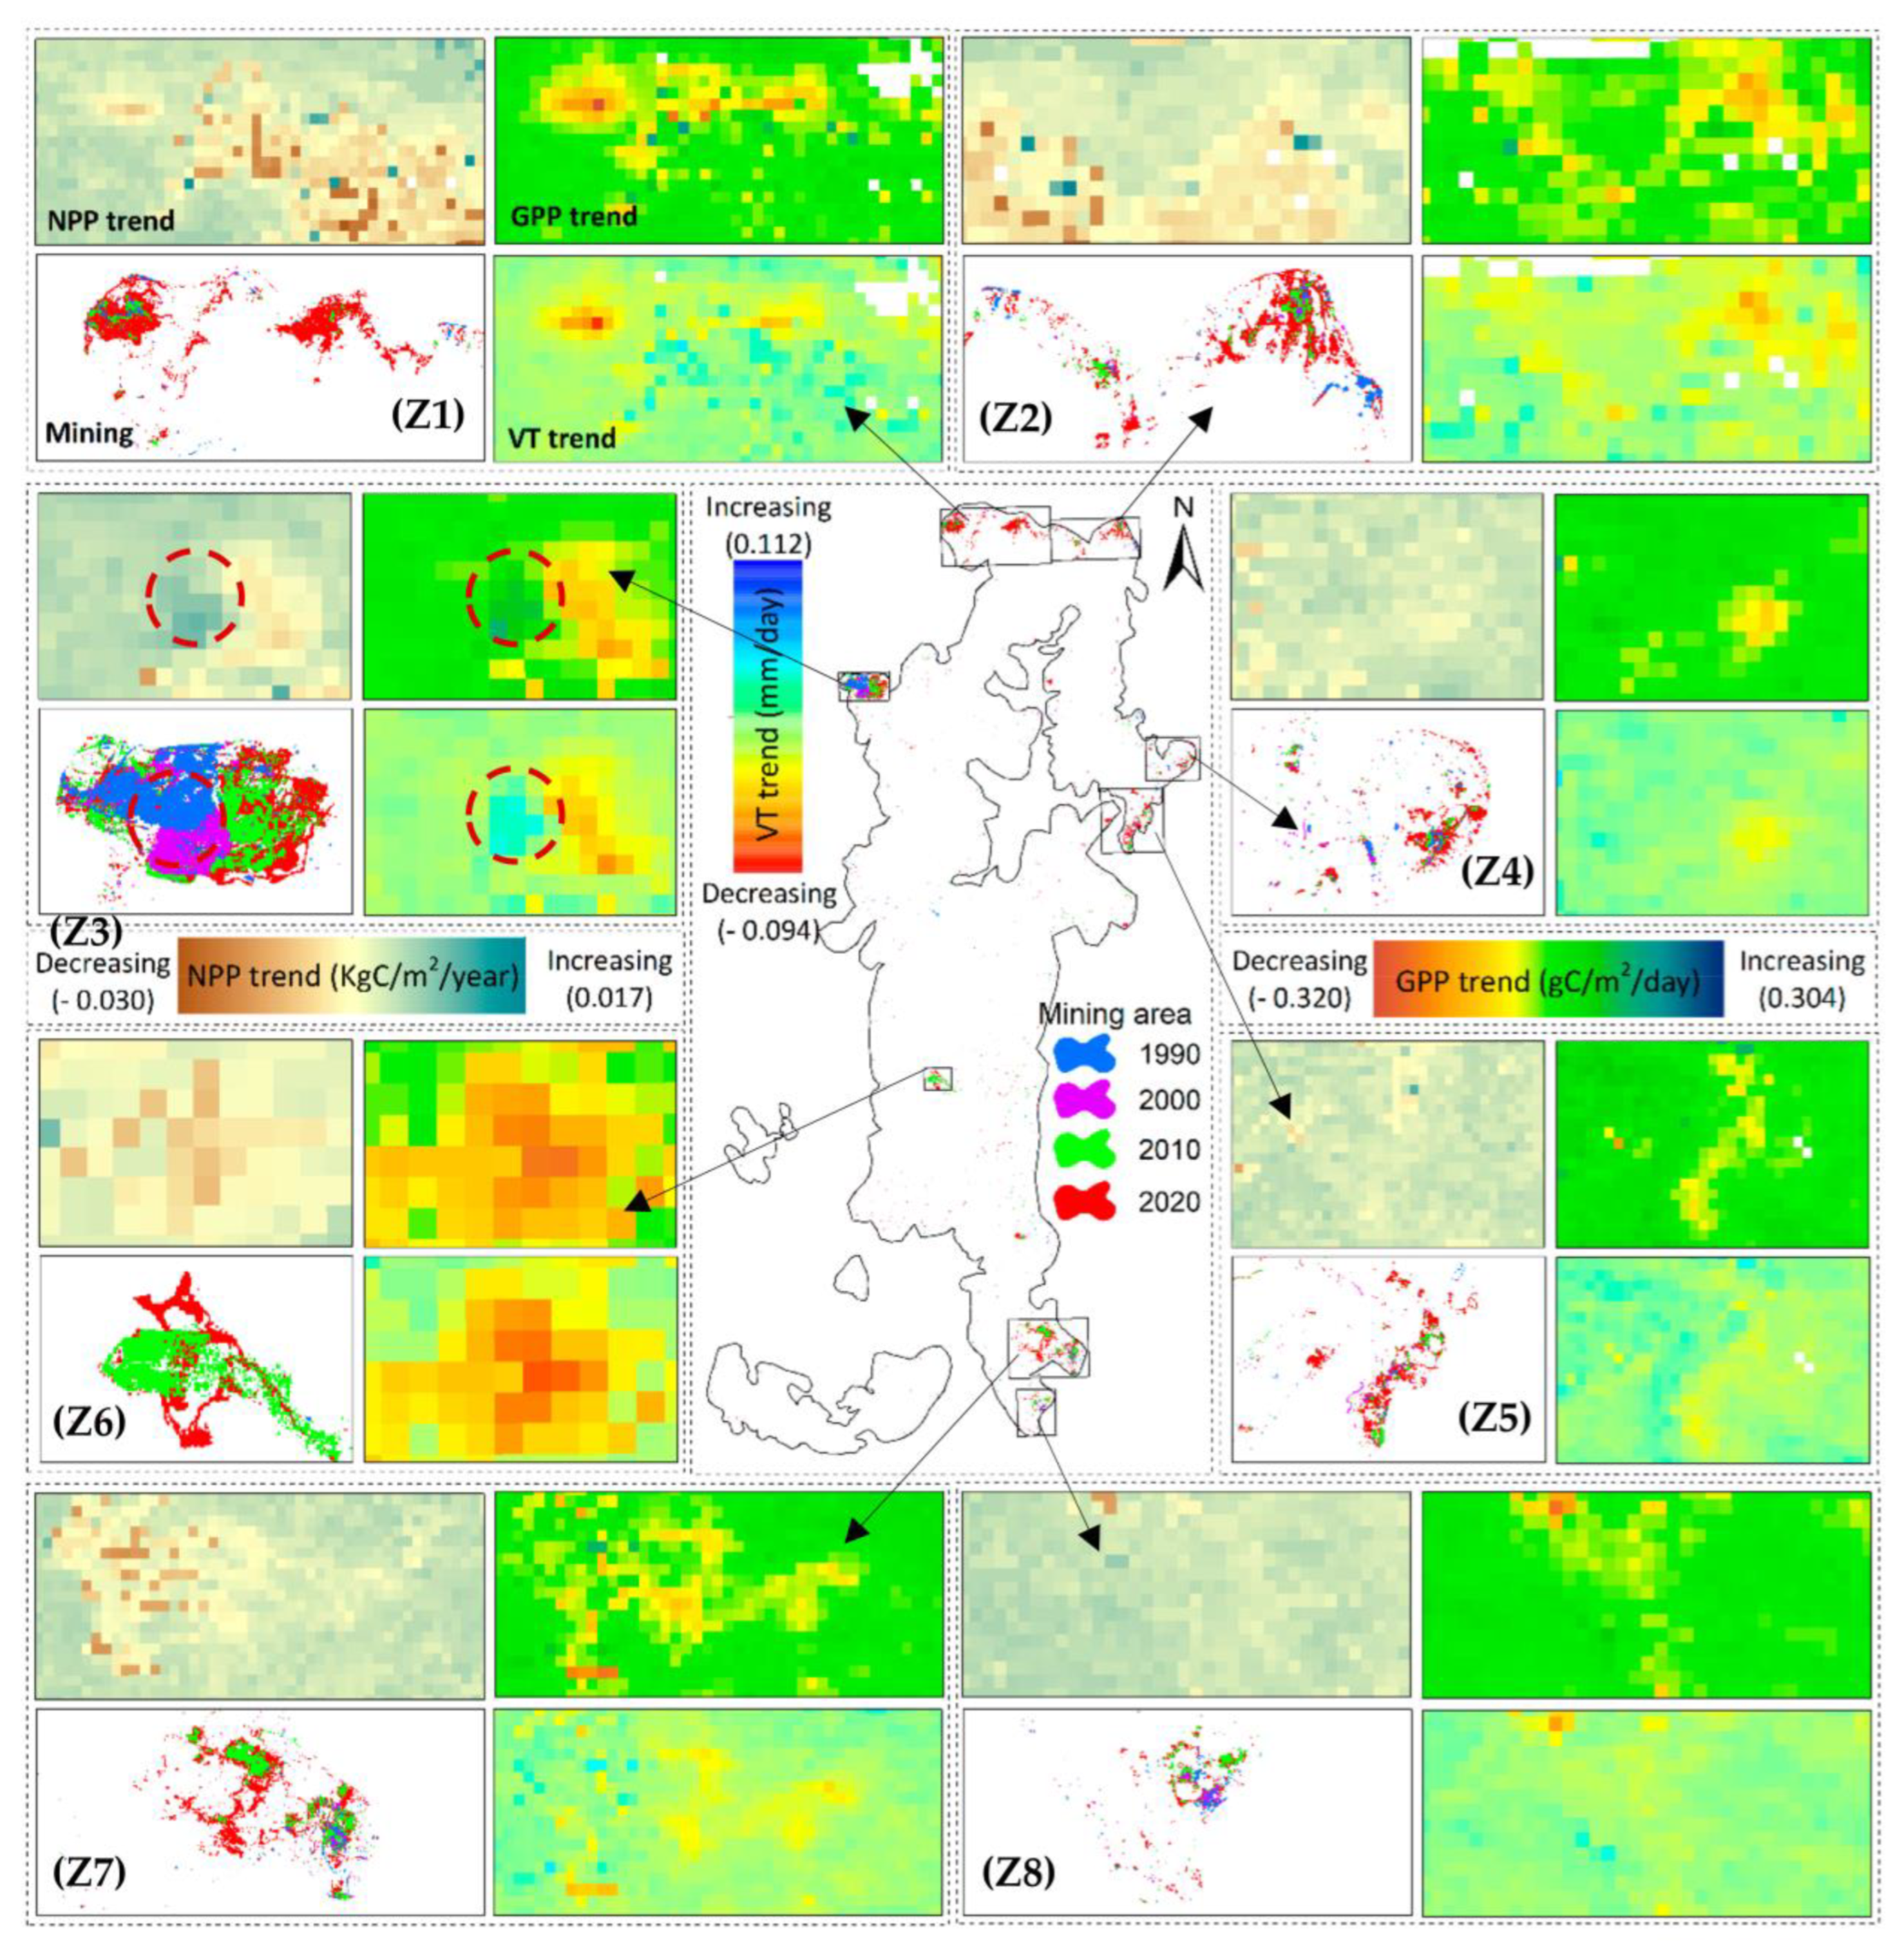
3.2. Landscape Transformation, Vegetation Cover Loss, and Mining Area Expansion over the Rajmahal Hills

The detailed LULC statistics, such as area coverage, % area of each class out of the total area, area change, and the annual rate of change) of different classes are provided in Table 3. The LULC statistics indicated a significant loss in vegetation cover and a remarkable increment in the mining coverage during 1990–2020. Vegetation coverage over the Rajmahal Hills decreased to ~54% (2020) from 64% (1990), while mining extent increased up to ~2% (2020) from 0.3% (1990) of the total area. In total, ~340 km2 of vegetation area was lost at the rate of −0.005% per year from 1990–2020. On the other hand, mining expanded to ~54 km2 with an annual expansion rate of 0.056%. Stone mining has been predominantly practiced in and around the Rajmahal Hills (Z1, Z2, Z4, Z5, Z7, and Z8 in Figure 4), along with a few coal mines (Z3 and Z6 in Figure 4).
The spatiotemporal mining expansion over the Rajmahal Hills is presented in Figure 4. It was observed that the stone mining areas significantly increased in 2020, which could be attributed to large-scale stone quarrying in the last decade (after 2010), as demarcated in several zones in Figure 4 (Z1, Z2, Z4, Z5, Z7, and Z8). A few recent field photographs of stone mining areas (Z4 and Z4) can be seen in Figure 5. The utmost increment in the mining area was estimated during 2010–2020, where nearly 41 km2 of the mining area was expanded over the Rajmahal Hills with an annual growth rate of 0.1%. The remarkable rise in the mining patches was mainly seen in Figure 4, especially between 2010 and 2020. Before the 2000s, only the Rajmahal coal mines (Z3; Figure 4) were observed with significant mining patches during 1990 and 2000. The remaining mining clusters, including Pachhwara Central Coal Mines, Kathaldih (Z6; Figure 4), seem functional after the 2000s. A few small mining patches were also seen over a few stone mining regions (Z2, Z4, Z5, Z8; Figure 4), which were possibly functional before the 2000s with lesser production. Thus, it can be assumed that the mining activity has been dramatically accelerated in the last two decades and has caused a significant loss of vegetation cover over the Rajmahal Hills. Rest vegetation cover loss over the Rajmahal Hills, which was not caused by mining activity, is supposed to be caused due to other human interferences such as settlement encroachments, logging, construction works, road networks, etc.). A study by Ranjan and Gorai [44] also reported same kind of reasons (e.g., mining activity, settlement encroachments, etc.) behind the vegetation cover loss over the Rajmahal Hills, India.
The spatial extent of the waterbody was not dynamic during the study years and varied between 10–12 km2. The waterbody patches in some years increased mainly due to waterlogging in the mine areas (Z3 and Z6 in Figure 3), specifically in 2020. Overall ~1 km2 increment in the waterbody was estimated during the study period (1990–2020) at an annual rate of 0.003%. On the other hand, the Others class also remarkably increased (~284 km2) over the span of 1990–2020 with an annual rate of 0.006%. The increment in the Others class could be due to the conversion of vegetation cover into bare land, settlement, and construction sites. The detailed LULC change statistics are discussed in the further paragraph.
The detailed inter-class transformation of LULC features during three periods (i.e., 1990–2000, 2000–2010, 2010–2020, and 1990–2020) is provided in Table 4. Most of the vegetation area was converted into Others or Mining classes. Overall ~22 km2 of vegetation cover was destroyed (lost) in the last 30 years (1990–2020) and converted into a mining area. During 1990–2000, ~2 km2 of vegetation area was converted into mining, whereas ~3 km2 and 8 km2 of vegetation area were transformed into mining area during 2000–2010 and 2010–2020, respectively, due to stone and coal mining activity over the Rajmahal Hills (Table 4). Only very few areas were observed where the mining area was converted into vegetation owing to the mine’s reclamation activity or afforestation. Only 0.8 km2, 1.12 km2, and 0.47 km2 of mining areas were found to be converted into vegetation from mining during 1990–2000, 2000–2010, and 2010–2020, respectively. Thus, it can be inferred that a significant area of vegetation has been lost due to opencast mining activity, whilst a very small area was ecologically recovered through mine reclamation. It can be noted that the sum of the changing area of any particular feature/class during 1990–2000, 2000–2010, and 2010–2020 will not equal to change area during 1990–2020. For example, Table 4 exhibits that vegetation to mining conversion is 1.64 km2, 3.06 km2, and 8.10 km2 during 1990–2000, 2000–2010, and 2010–2020, respectively, which is not equal to the change area (22.29 km2) during 1990–2020. This is because, during long-term (1990–2020) change detection, the inter-class changes during intermediate study periods are not considered, which is reflected in decadal change detection.
Apart from converting vegetation to the mining class, remarkable areas of vegetation were converted into the Others class. Approximately 450 km2 of vegetation area was converted into the Others class in the last three decades (1990–2020) over the Rajmahal Hills. While ~219, 256, and 271 km2 of vegetation cover were converted into the Others class (i.e., bare land, settlement, and construction) during 1990–2000, 2000–2010, and 2010–2020, respectively. So, it can be presumed that the conversion of vegetation cover into the Others class could have been influenced by the rise in unsustainable anthropogenic practices (e.g., deforestation, settlement encroachment, transportation, construction, etc.) over the Rajmahal Hills. The conversion of the waterbody into a mining area and vice-versa was also observed. The waterlogging in mining pits was identified as waterbodies in some years. In contrast, the disappearance of waterlogging from the mining pit in the subsequent years was identified as a mining class. During 2000–2010 and 2010–2020, some mining areas were converted into waterbody (~2.36 and 1.24 km2, respectively) because of waterlogging. Overall, it can be inferred that a significant area of vegetation was lost in the last three decades across the Rajmahal Hills due to mostly unsustainable anthropogenic activities (e.g., mining, deforestation, settlement encroachment, transportation construction, etc.).

3.3. Losses in GPP, NPP, and VT Due to Mining-Induced Vegetation Cover Loss

The losses in vegetation carbon sequestration (i.e., GPP), carbon stock (i.e., NPP), and transpiration (VT) due to mining-induced vegetation cover loss over Rajmahal Hills are evaluated from 2000/2001 to 2020 and presented in Table 5. It was noted that a significant amount of GPP, NPP, and VT was lost during the study periods (e.g., 2000–2010, 2010–2020, and 2000–2020) due to mining-induced vegetation cover loss (Table 5). During 2000–2010, ~3.06 km2 of vegetation area was lost due to the mining activity, which caused GPP loss (total or spatial sum) of 0.01 tC/day, NPP loss of ~1.25 tC, and VT loss of 5200 mm/day (Table 5). These statistics significantly increased in the next decade (2010–2020), wherein GPP loss of 0.04 tC/day, NPP loss of ~2.77 tC, and VT loss of 13,630 mm/day were estimated due to loss of 8.10 km2 vegetation cover due to mining. Notably, ~22.29 km2 of vegetation cover was lost during 2000–2020, which has caused a vast GPP loss of 0.09 tC/m2/day, NPP loss of ~7.27 tC, and VT loss of 30,190 mm/day. Though the rate of vegetation productivity loss was relatively less in the last decades (w.r.t. total vegetation cover loss), the total loss of vegetation productivity was relatively high (Table 5). Hence, it can be concluded that the mining-induced vegetation cover loss has caused a significant loss in the rate of carbon sequestration, carbon stock, and vegetation transpiration across the Rajmahal Hills.

3.4. Effects of Vegetation Regrowth in Mining Regions on Vegetation Productivity and Transpiration

Apart from the vegetation cover loss, a few patches of vegetation regrowth were also seen in the mining clusters, which further helped to increase vegetation productivity and transpiration over the Rajmahal Hills. The increment in vegetation productivity and transpiration due to vegetation regrowth in mining clusters is provided in Table 6. During 1990–2000, ~0.83 km2 vegetation regrowth was observed in the mining clusters, which further established the total (spatial sum) carbon sequestration (GPP) rate of 2.84 KgC/day, carbon stock of 0.30 tC (NPP), and VT rate of 1000 mm/day. These statistics significantly increased during 2000–2010, wherein 1.12 km2 of vegetation regrowth was observed. It contributed to 3.67 KgC/day GPP, 0.37 tC NPP, and 1340 mm/day VT. However, in the recent decade (2010–2020), the vegetation regrowth statistics were worrying (~0.47 km2), because of loss of vegetation covers was higher (~8 km2). Nevertheless, 0.47 km2 vegetation regrowth in the mining clusters contributed to 1.41 KgC/day GPP, 0.22 tC NPP, and 530 mm/day.

3.5. Trends of Vegetation GPP, NPP, and VT over the Rajmahal Hills

The spatial distribution of the long-term (2001–2021) trend of GPP, NPP, and VT over Rajmahal Hills is shown in Figure 6, along with the histogram. Overall, increasing GPP and VT trend over the Rajmahal Hills. Approximately 86% of areas in Rajmahal Hills were found under the increasing VT trend (up to 0.112 mm/day), whereas ~46% of areas were found under the increasing GPP trend (up to 0.304 gC/m2/day). Still, >50% of areas over the Rajmahal Hills were found under the decreasing GPP trend. The overall physiographic development of vegetation cover, including leaf area index (LAI) and canopy density, could have influenced increasing GPP and VT trends. On the other hand, comparatively larger areas were observed under the decreasing NPP trend was observed over the Rajmahal Hills, wherein very few areas were observed under the increasing NPP trend. About 93% of the area of the Rajmahal Hills was found under decreasing NPP trend (up to 0.03 KgC/m2/day) during 2001–2021, while only 7% area of the Rajmahal Hills was found under an increasing NPP trend (up to 0.017 KgC/m2/day).
The decreasing GPP and NPP trend statistics indicate that both sequestration capacity and carbon stock of Rajmahal Hills were falling, which is a critical issue. The decreasing vegetation NPP trend over the Rajmahal Hills seems to have resulted from the gradual loss of vegetation cover primarily caused by anthropogenic activities (e.g., mining, settlement encroachments, transportation networks, etc.). The higher respiration fluxes of vegetation triggered by environmental, soil, and climatic factors could have also affected the vegetation GPP and trends over Rajmahal Hills. The aspects of higher respiration fluxes of vegetation, climate change (rising temperatures and changing precipitation patterns), etc., impacts on decreasing NPP trend over Rajmahal Hills need to be well understood. It’s important to note that these factors may act in combination or independently. Therefore, it’s essential to understand the specific context and conduct further research to determine the cause of decreasing NPP.
It is distinguishable from Figure 7 that the decreasing GPP, NPP, and VT trends were mainly associated with the mining-induced vegetation cover loss regions over the Rajmahal Hills. All the mining sites (zoomed regions in Figure 6) are noted with persistent decreasing trends of all three variables, which indicates that the gradual vegetation cover loss due to stone and coal mining activity has triggered a significant loss in vegetation productivity and transpiration. Apart from the decreasing trend, increasing GPP, NPP, and VT trend pixels were also observed over the vegetation recovery sites in mining areas (highlighted in Z3 using a maroon color dotted circle). The oldest mining patches (in 1990) over the Rajmahal coal mines (Z3) were observed to have some vegetation recovery due to the mine’s reclamation activity in subsequent years. Undoubtedly, vegetation recovery over reclaimed mining sites has increased GPP, NPP, and VT trends, as highlighted in Z3 using a maroon color circle in Figure 6. Apart from the mining regions, some vegetation patches showed decreasing GPP, NPP, and VT trend pixels across the Rajmahal Hills. However, these patches were not affected by the mining operations, which could be affected by other factors such as anthropogenic (e.g., logging, deforestation, settlement encroachments), natural (forest fires, droughts, etc.), or environmental (e.g., meteorological, soil, topography). Especially, the contributions of climatic, environmental, and other anthropogenic factors behind the large area under the decreasing trend needs to be investigated in future studies.
The linear trend of vegetation productivity and transpiration in two mining sites over time and space is also shown in Figure 8. These sites comprise both vegetation degradation as well as vegetation regrowth site. The results exhibited both gradual decreasing and increasing trends of vegetation GPP, NPP, and VT over a vegetation degradation site and vegetation regrowth site, respectively, in the mining locations. Eventually, it can be conferred that increasing mining activity has negatively impacted vegetation productivity and transpiration over the Rajmahal Hills. In contrast, vegetation regrowth due to the mine’s reclamation activity has offered increasing trends in vegetation productivity and transpiration.

4. Discussion

Opencast mining has been increasing over the years across the globe that requires careful consideration and management. Large-scale mining has been reported in different mining-dominated countries (e.g., Australia, Brazil, China, Ghana, India, Indonesia, Peru, Russia, South Africa, United States, etc.). Consequently, their impacts have been observed in the form of deforestation, losses of vegetation type, changes in LULC, hydrology, and productivity, among others [1,2,3,5,9,10,12,13,25]. The mining deeds also increase pressure on land use and competing demands for natural resources, leading to additional stress on ecosystems and land cover. This can be especially problematic in areas where mining is the dominant economic activity and alternative land uses are limited. So, mining companies and regulatory bodies need to undertake responsible practices and prioritize and ensure restoration efforts to minimize these negative environmental impacts. Effective land-use planning and stakeholder engagement can also help ensure that mining activities are conducted sustainably and socially responsibly, minimizing adverse effects on vegetation and land cover. Still, the importance of vegetation and LULC studies in mining areas cannot be overstated, as the mining activity provides a crucial foundation for balancing economic development with environmental protection, ultimately ensuring a sustainable future for our planet.
The harsh conditions of vegetation caused due to mining activities are one of serious concern in many ecologically sensitive regions of Indian states, especially Jharkhand, Odisha, Chhattisgarh, etc. [7,25]. The present study also found a significant alteration in land use pattern and a remarkable vegetation loss over the Rajmahal Hills in the last three decades (1990–2020) due to extensive stone quarrying. Furthermore, the vegetation restoration over the mining regions across the Rajmahal Hills was observed to be significantly less and perturbing. In line with the above findings, Ranjan et al. [18] and Ranjan and Gorai [27] have also reported the mining-induced harsh conditions of the vegetation ecosystem in Rajmahal Hills. Biodiversity and many unique medicinal and rare species plants are endangered due to destructive and unsustainable mining practices in Rajmahal Hills [65]. The extended spatial coverage of vegetation over Rajmahal Hills (>2000 km2 area) significantly influences the local climate, biodiversity, and ecological settings. So, the destruction and loss of vegetation over Rajmahal Hills due to huge stone quarrying and human interferences may significantly alter the local climate (rainfall, temperature) pattern and associated ecological services. Thereby, the protection of vegetation ecological condition along with sustainable mining practices over Rajmahal Hills is needed to preserve and restore the environmental conditions.
On the other hand, mineral exploration and mining activities are expected to rise globally to fulfill the ever-increasing industrial and human requirements [66]. However, it is not easy to choose between the environment and industry when both play crucial roles in the development and survival of human society. The increasing demand for non-metallic, metallic, and fuel minerals has driven the mining sector’s drastic rise in recent decades. According to the Indian Ministry of Mines [44], the mining sector in India is expected to grow at a Compound Annual Growth Rate (CAGR) of 6.5% from 2020–2025. These demands will further lead to significant environmental degradation, including the loss of vegetation, irreversible biodiversity loss, loss of gas and energy exchange between atmosphere and biosphere, loss of ecological services, and habitat destruction. In this context, many past studies have reported a significant loss in vegetation carbon sequestration and sink linked to mining-induced vegetation cover loss [28,29,31]. The present study also exhibited a significant loss in the carbon and vegetation transpiration associated with mining-induced vegetation cover loss. As a result, it can significantly elevate atmospheric CO2 and other greenhouse gases [29,67], which may further cause a climatic or atmospheric imbalance with many negative consequences (e.g., temperature rise, rainfall pattern alteration, air pollution, etc.). The VT losses can also significantly affect the water cycle and alter precipitation patterns.
The potential impacts of mining on vegetation productivity, transpiration, and other services are enormous. Hence, better planning of mining operations is of utmost importance for implementing effective rehabilitation efforts to restore vegetation and the overall ecosystem functions. This can be achieved by implementing proper regulations, monitoring, and mitigation measures. However, the status of mines reclamation or ecological restoration in closed mines across the globe is disappointing [68,69]. In a study, Ranjan et al. [18] also reported that the restoration of ecological conditions in eastern Indian mining regions was inferior. Only a few of the mines were observed with notable vegetation regrowth in abandoned mines. Hence, strict and adequate mines closure plans need to be formulated and implemented in abandoned mines across the globe to restore vegetation cover and post-mining land use over the mining area. Mine reclamation is a critical process with significant environmental, economic, and social benefits for local communities and the broader society. In this regard, the Indian government has initiated several policies and regulations to ensure sustainable mining practices, including the Mines and Minerals (Development and Regulation) Act, 1957; Forest Conservation Act, 1980; Environmental Impact Assessment (EIA) Notification, 2006; Mineral Conservation and Development Rules, 2017; and National Mineral Policy, 2019 [70]. Overall, these rules and regulations aim to ensure that mining activities in India are carried out sustainably; that mine reclamation is an integral part of the mining process.
However, several global challenges remain to achieve successful mines restoration, rehabilitation, or ecological restoration. One of the main challenges is the lack of a clear legal framework and regulations that require mining companies to restore the areas they have impacted. This lack of regulation has resulted in many mining companies avoiding the costs and responsibilities of restoring the land they have exploited. Illegal mining activity and overlooking of mines closure plans are also major concerns in the context of successful mines reclamation. With the right policies, regulations, and technologies, achieving successful mines restoration and creating a more sustainable and resilient future for our planet is possible. Several emerging technologies could make mines restoration more cost-effective and efficient. These include the usage of drones and satellite data to monitor restoration progress and bioremediation techniques to ensure the progress and restoration of the mine in terms of ecology, soil, water quality, etc.

5. Conclusions

Vegetation destruction and land use alteration due to mining activity and lack of mines restoration are critical global issues requiring a concerted effort from governments, industry, and civil society to address the challenges. The present study utilized the benefits of various satellite/gridded remote sensing datasets and exhibited the mining-induced land cover alteration, vegetation destruction, and vegetation regrowth due to mining practices. The satellite-based approaches have shown to be the most cost-effective, efficient, and reliable data source for continuous, detailed, and robust monitoring of mining operations (e.g., LULC change, vegetation dynamics, mines reclamation monitoring, and vegetation regrowth analysis). The study further accounted for the losses in the vegetation carbon sink, sequestration, and transpiration due to vegetation loss in the mining regions. Based on the comprehensive study, the following remarks are drawn:
i.
Development in the remote sensing-based satellite/gridded datasets assisted in making the latest contribution in monitoring and addressing the mining-induced environmental issues (land cover dynamics, vegetation loss, vegetation productivity loss) at the local scale;
ii.
Mining activity, especially stone quarrying, has negatively affected the land use pattern and significant vegetation clearance in the Rajmahal Hills during the last decades (2010–2020);
iii.
The mining-induced vegetation destruction in the Rajmahal Hills was responsible for the remarkable loss in carbon and transpiration, which have negative impacts on the local environment;
iv.
Due to the lack of proper mine reclamation practices, vegetation regrowth over the mining clusters across the Rajmahal Hills was found to be worrying. Only Rajmahal coal mines in the Godda district have shown remarkable vegetation regrowth;
v.
The vegetation regrowth over the Rajmahal coal mines in Godda district owing to mine reclamation activity has positively assisted in restoring the ecological condition, which improves vegetation productivity and transpiration;
vi.
Though vegetation regrowth due to mine reclamation may help to substitute the losses of vegetation cover and associated productivity up to some extent, the biodiversity loss due to mining activity is still irreversible, which could greatly threaten to maintain the ecological equilibrium;
vii.
The outcomes of the present study shall be helpful to the policy and decision-makers, stakeholders, mining authorities, and regulatory bodies for policy and sustainable mining plan-making. So that the mine’s reclamation actions can be properly implemented and executed to ensure the restoration of the abandoned mines. It can directly and indirectly impact the ecosystem functioning in the Rajmahal Hills.

Author Contributions

Conceptualization, A.K.R., B.R.P., J.D. and A.K.G.; methodology, A.K.R., J.D. and A.K.G.; software, A.K.R.; validation, A.K.R.; formal analysis, A.K.R., B.R.P., J.D. and A.K.G.; data curation, A.K.R.; writing—original draft preparation, A.K.R.; writing—review and editing, B.R.P., J.D. and A.K.G.; visualization, A.K.R., B.R.P., J.D. and A.K.G.; supervision, J.D. and A.K.G. All authors have read and agreed to the published version of the manuscript.

Funding

This research received no external funding.

Institutional Review Board Statement

Not applicable.

Informed Consent Statement

Not applicable.

Data Availability Statement

Not applicable.

Acknowledgments

Authors sincerely acknowledge the UGGS earth explorer for providing Landsat series satellite datasets, respectively. The Google Earth Engine cloud platform is acknowledged for providing cloud-based computing facilities. The utilization of PML_v2-based GPP and vegetation transpiration; MODIS-based NPP data is sincerely acknowledged. The authors sincerely thank anonymous reviewers for their constructive comments. Thanks to Amarjeet for help during field visits.

Conflicts of Interest

The authors declare no conflict of interest.

Appendix A

Figure A1. A schematic representation of mining-induced vegetation cover loss during two study years/periods over a particular location. Years are taken for illustration only.
Sustainability 15 08005 g0a1

References

  1. Siqueira-Gay, J.; Sánchez, L.E. The Outbreak of Illegal Gold Mining in the Brazilian Amazon Boosts Deforestation. Reg. Environ. Chang. 2021, 21, 28. [Google Scholar] [CrossRef]
  2. Xulu, S.; Phungula, P.T.; Mbatha, N.; Moyo, I. Multi-Year Mapping of Disturbance and Reclamation Patterns over Tronox’s Hillendale Mine, South Africa with DBEST and Google Earth Engine. Land 2021, 10, 760. [Google Scholar] [CrossRef]
  3. Yu, H.; Zahidi, I. Spatial and Temporal Variation of Vegetation Cover in the Main Mining Area of Qibaoshan Town, China: Potential Impacts from Mining Damage, Solid Waste Discharge and Land Reclamation. Sci. Total Environ. 2023, 859, 160392. [Google Scholar] [CrossRef] [PubMed]
  4. Giljum, S.; Maus, V.; Kuschnig, N.; Luckeneder, S.; Tost, M.; Sonter, L.J.; Bebbington, A.J. A Pantropical Assessment of Deforestation Caused by Industrial Mining. Proc. Natl. Acad. Sci. USA 2022, 119, e2118273119. [Google Scholar] [CrossRef]
  5. Vasuki, Y.; Yu, L.; Holden, E.-J.; Kovesi, P.; Wedge, D.; Grigg, A.H. The Spatial-Temporal Patterns of Land Cover Changes Due to Mining Activities in the Darling Range, Western Australia: A Visual Analytics Approach. Ore Geol. Rev. 2019, 108, 23–32. [Google Scholar] [CrossRef]
  6. Siqueira-Gay, J.; Sonter, L.J.; Sánchez, L.E. Exploring Potential Impacts of Mining on Forest Loss and Fragmentation within a Biodiverse Region of Brazil’s Northeastern Amazon. Resour. Policy 2020, 67, 101662. [Google Scholar] [CrossRef]
  7. Ranjan, R. Assessing the Impact of Mining on Deforestation in India. Resour. Policy 2019, 60, 23–35. [Google Scholar] [CrossRef]
  8. Ang, M.L.E.; Arts, D.; Crawford, D.; Labatos, B.V., Jr.; Ngo, K.D.; Owen, J.R.; Gibbins, C.; Lechner, A.M. Socio-Environmental Land Cover Time-Series Analysis of Mining Landscapes Using Google Earth Engine and Web-Based Mapping. Remote Sens. Appl. Soc. Environ. 2021, 21, 100458. [Google Scholar] [CrossRef]
  9. Kurniawan, R.; Saputra, A.M.W.; Wijayanto, A.W.; Caesarendra, W. Eco-Environment Vulnerability Assessment Using Remote Sensing Approach in East Kalimantan, Indonesia. Remote Sens. Appl. Soc. Environ. 2022, 27, 100791. [Google Scholar] [CrossRef]
  10. Barenblitt, A.; Payton, A.; Lagomasino, D.; Fatoyinbo, L.; Asare, K.; Aidoo, K.; Pigott, H.; Som, C.K.; Smeets, L.; Seidu, O.; et al. The Large Footprint of Small-Scale Artisanal Gold Mining in Ghana. Sci. Total Environ. 2021, 781, 146644. [Google Scholar] [CrossRef]
  11. Caballero Espejo, J.; Messinger, M.; Román-Dañobeytia, F.; Ascorra, C.; Fernandez, L.; Silman, M. Deforestation and Forest Degradation Due to Gold Mining in the Peruvian Amazon: A 34-Year Perspective. Remote Sens. 2018, 10, 1903. [Google Scholar] [CrossRef]
  12. Khatancharoen, C.; Tsuyuki, S.; Bryanin, S.V.; Sugiura, K.; Seino, T.; Lisovsky, V.V.; Borisova, I.G.; Wada, N. Long-Time Interval Satellite Image Analysis on Forest-Cover Changes and Disturbances around Protected Area, Zeya State Nature Reserve, in the Russian Far East. Remote Sens. 2021, 13, 1285. [Google Scholar] [CrossRef]
  13. Hu, T.; Toman, E.M.; Chen, G.; Shao, G.; Zhou, Y.; Li, Y.; Zhao, K.; Feng, Y. Mapping Fine-Scale Human Disturbances in a Working Landscape with Landsat Time Series on Google Earth Engine. ISPRS J. Photogramm. Remote Sens. 2021, 176, 250–261. [Google Scholar] [CrossRef]
  14. Sonter, L.J.; Herrera, D.; Barrett, D.J.; Galford, G.L.; Moran, C.J.; Soares-Filho, B.S. Mining Drives Extensive Deforestation in the Brazilian Amazon. Nat. Commun. 2017, 8, 1013. [Google Scholar] [CrossRef]
  15. Paiva, P.F.P.R.; de Lourdes Pinheiro Ruivo, M.; da Silva Júnior, O.M.; de Nazaré Martins Maciel, M.; Braga, T.G.M.; de Andrade, M.M.N.; dos Santos Junior, P.C.; da Rocha, E.S.; de Freitas, T.P.M.; da Silva Leite, T.V.; et al. Deforestation in Protect Areas in the Amazon: A Threat to Biodiversity. Biodivers. Conserv. 2020, 29, 19–38. [Google Scholar] [CrossRef]
  16. Joshi, P.K.; Kumar, M.; Midha, N.; Yanand, V.; Wal, A.P. Assessing Areas Deforested by Coal Mining Activities through Satellite Remote Sensing Images and Gis in Parts of Korba, Chattisgarh. J. Ind. Soc. Remote Sens. 2006, 34, 415–421. [Google Scholar] [CrossRef]
  17. Karanam, V.K.R.; Motagh, M.; Jain, K. Land Subsidence in Jharia Coalfields, Jharkhand, India—Detection, Estimation And Analysis Using Persistent Scatterer Interferometry. In Proceedings of the 22nd EGU General Assembly, Online, 4–8 May 2020. [Google Scholar]
  18. Ranjan, A.K.; Parida, B.R.; Dash, J.; Gorai, A.K. Quantifying the Impacts of Opencast Mining on Vegetation Dynamics over Eastern India Using the Long-Term Landsat-Series Satellite Dataset. Ecol. Inform. 2022, 71, 101812. [Google Scholar] [CrossRef]
  19. Shinde, V.T.; Tiwari, K.N.; Singh, M.; Uniyal, B. Impact of Abandoned Opencast Mines on Hydrological Processes of the Olidih Watershed in Jharia Coalfield, India. Environ. Process. 2017, 4, 697–710. [Google Scholar] [CrossRef]
  20. Milbourne, P.; Mason, K. Environmental Injustice and Post-Colonial Environmentalism: Opencast Coal Mining, Landscape and Place. Environ. Plan A 2017, 49, 29–46. [Google Scholar] [CrossRef]
  21. Chatterjee, R.S.; Lakhera, R.C.; Dadhwal, V.K. InSAR Coherence and Phase Information for Mapping Environmental Indicators of Opencast Coal Mining: A Case Study in Jharia Coalfield, Jharkhand, India. Can. J. Remote Sens. 2010, 36, 361–373. [Google Scholar] [CrossRef]
  22. Trigg, A.B.; Richard Dubourg, W. Valuing the Environmental Impacts of Opencast Coal Mining in the UK. Energy Policy 1993, 21, 1110–1122. [Google Scholar] [CrossRef]
  23. Kinda, H.; Thiombiano, N. The Effects of Extractive Industries Rent on Deforestation in Developing Countries. Resour. Policy 2021, 73, 102203. [Google Scholar] [CrossRef]
  24. Ranjan, A.K.; Sahoo, D.; Gorai, A.K. Quantitative Assessment of Landscape Transformation Due to Coal Mining Activity Using Earth Observation Satellite Data in Jharsuguda Coal Mining Region, Odisha, India. Environ. Dev. Sustain. 2021, 23, 4484–4499. [Google Scholar] [CrossRef]
  25. Mishra, M.; Santos, C.A.G.; do Nascimento, T.V.M.; Dash, M.K.; da Silva, R.M.; Kar, D.; Acharyya, T. Mining Impacts on Forest Cover Change in a Tropical Forest Using Remote Sensing and Spatial Information from 2001–2019: A Case Study of Odisha (India). J. Environ. Manag. 2022, 302, 114067. [Google Scholar] [CrossRef] [PubMed]
  26. Ghose, M.K. Opencast Coal Mining in India: Analyzing and Addressing the Air Environmental Impacts. Environ. Qual. Manag. 2007, 16, 71–87. [Google Scholar] [CrossRef]
  27. Ranjan, A.K.; Gorai, A.K. Characterization of Vegetation Dynamics Using MODIS Satellite Products over Stone-Mining Dominated Rajmahal Hills in Jharkhand, India. Remote Sens. Appl. Soc. Environ. 2022, 27, 100802. [Google Scholar] [CrossRef]
  28. Huang, Y.; Tian, F.; Wang, Y.; Wang, M.; Hu, Z. Effect of Coal Mining on Vegetation Disturbance and Associated Carbon Loss. Environ. Earth Sci. 2015, 73, 2329–2342. [Google Scholar] [CrossRef]
  29. Pearson, T.R.H.; Brown, S.; Murray, L.; Sidman, G. Greenhouse Gas Emissions from Tropical Forest Degradation: An Underestimated Source. Carbon Balance Manag. 2017, 12, 3. [Google Scholar] [CrossRef]
  30. Ivanova, S.; Vesnina, A.; Fotina, N.; Prosekov, A. An Overview of Carbon Footprint of Coal Mining to Curtail Greenhouse Gas Emissions. Sustainability 2022, 14, 15135. [Google Scholar] [CrossRef]
  31. Tian, H.; Liu, S.; Zhu, W.; Zhang, J.; Zheng, Y.; Shi, J.; Bi, R. Deciphering the Drivers of Net Primary Productivity of Vegetation in Mining Areas. Remote Sens. 2022, 14, 4177. [Google Scholar] [CrossRef]
  32. Malaviya, S.; Munsi, M.; Oinam, G.; Joshi, P.K. Landscape Approach for Quantifying Land Use Land Cover Change (1972–2006) and Habitat Diversity in a Mining Area in Central India (Bokaro, Jharkhand). Environ. Monit Assess 2010, 170, 215–229. [Google Scholar] [CrossRef]
  33. Sonter, L.J.; Moran, C.J.; Barrett, D.J.; Soares-Filho, B.S. Processes of Land Use Change in Mining Regions. J. Clean. Prod. 2014, 84, 494–501. [Google Scholar] [CrossRef]
  34. Basommi, L.P.; Guan, Q.; Cheng, D.; Singh, S.K. Dynamics of Land Use Change in a Mining Area: A Case Study of Nadowli District, Ghana. J. Mt. Sci. 2016, 13, 633–642. [Google Scholar] [CrossRef]
  35. Mi, J.; Yang, Y.; Zhang, S.; An, S.; Hou, H.; Hua, Y.; Chen, F. Tracking the Land Use/Land Cover Change in an Area with Underground Mining and Reforestation via Continuous Landsat Classification. Remote Sens. 2019, 11, 1719. [Google Scholar] [CrossRef]
  36. Liao, Q.; Liu, X.; Xiao, M. Ecological Restoration and Carbon Sequestration Regulation of Mining Areas—A Case Study of Huangshi City. IJERPH 2022, 19, 4175. [Google Scholar] [CrossRef]
  37. Sperow, M. Carbon Sequestration Potential in Reclaimed Mine Sites in Seven East-Central States. J. Environ. Qual. 2006, 35, 1428–1438. [Google Scholar] [CrossRef]
  38. Chen, G.; Huang, Y.; Chen, J.; Wang, Y. Spatiotemporal Variation of Vegetation Net Primary Productivity and Its Responses to Climate Change in the Huainan Coal Mining Area. J. Indian Soc. Remote Sens. 2019, 47, 1905–1916. [Google Scholar] [CrossRef]
  39. Ranjan, A.K.; Dash, J.; Xiao, J.; Gorai, A.K. Vegetation Activity Enhanced in India during the COVID-19 Lockdowns: Evidence from Satellite Data. Geocarto Int. 2022, 37, 12618–12637. [Google Scholar] [CrossRef]
  40. Ranjan, A.K.; Gorai, A.K. Evaluating Phenological Trends of Different Vegetation Types in Response to Climate Change over the Rajmahal Hills in India during 2001–2019. Remote Sens. Lett. 2022, 13, 898–911. [Google Scholar] [CrossRef]
  41. Ranjan, A.K.; Anand, A.; Vallisree, S.; Singh, R.K. LU/LC Change Detection and Forest Degradation Analysis in Dalma Wildlife Sanctuary Using 3S Technology: A Case Study in Jamshedpur-India. AIMS Geosci. 2016, 2, 273–285. [Google Scholar] [CrossRef]
  42. Kayet, N.; Pathak, K.; Chakrabarty, A.; Singh, C.P.; Chowdary, V.M.; Kumar, S.; Sahoo, S. Forest Health Assessment for Geo-Environmental Planning and Management in Hilltop Mining Areas Using Hyperion and Landsat Data. Ecol. Indic. 2019, 106, 105471. [Google Scholar] [CrossRef]
  43. Pandey, B.; Agrawal, M.; Singh, S. Assessment of Air Pollution around Coal Mining Area: Emphasizing on Spatial Distributions, Seasonal Variations and Heavy Metals, Using Cluster and Principal Component Analysis. Atmos. Pollut. Res. 2014, 5, 79–86. [Google Scholar] [CrossRef]
  44. Press Information Bureau. Ministry of Mines; 2023. Available online: https://www.pib.gov.in/allrelease.aspx (accessed on 7 April 2023).
  45. Gupta, K. Notes on Some Jurassic Plants from the Rajmahak Hills, Bihar, India. Palaeobotanist 1954, 3. [Google Scholar] [CrossRef]
  46. Zhang, Y.; Peña-Arancibia, J.L.; McVicar, T.R.; Chiew, F.H.S.; Vaze, J.; Liu, C.; Lu, X.; Zheng, H.; Wang, Y.; Liu, Y.Y.; et al. Multi-Decadal Trends in Global Terrestrial Evapotranspiration and Its Components. Sci. Rep. 2016, 6, 19124. [Google Scholar] [CrossRef]
  47. Zhang, Y.; Kong, D.; Gan, R.; Chiew, F.H.S.; McVicar, T.R.; Zhang, Q.; Yang, Y. Coupled Estimation of 500 m and 8-Day Resolution Global Evapotranspiration and Gross Primary Production in 2002–2017. Remote Sens. Environ. 2019, 222, 165–182. [Google Scholar] [CrossRef]
  48. Gan, R.; Zhang, Y.; Shi, H.; Yang, Y.; Eamus, D.; Cheng, L.; Chiew, F.H.S.; Yu, Q. Use of Satellite Leaf Area Index Estimating Evapotranspiration and Gross Assimilation for Australian Ecosystems: Coupled Estimates of ET and GPP. Ecohydrology 2018, 11, e1974. [Google Scholar] [CrossRef]
  49. Dong, J.; Li, L.; Li, Y.; Yu, Q. Inter-Comparisons of Mean, Trend and Interannual Variability of Global Terrestrial Gross Primary Production Retrieved from Remote Sensing Approach. Sci. Total Environ. 2022, 822, 153343. [Google Scholar] [CrossRef]
  50. Beer, C.; Reichstein, M.; Tomelleri, E.; Ciais, P.; Jung, M.; Carvalhais, N.; Rödenbeck, C.; Arain, M.A.; Baldocchi, D.; Bonan, G.B.; et al. Terrestrial Gross Carbon Dioxide Uptake: Global Distribution and Covariation with Climate. Science 2010, 329, 834–838. [Google Scholar] [CrossRef]
  51. Heimann, M.; Reichstein, M. Terrestrial Ecosystem Carbon Dynamics and Climate Feedbacks. Nature 2008, 451, 289–292. [Google Scholar] [CrossRef]
  52. Running, S.; Zhao, M. MOD17A3HGF MODIS/Terra Net Primary Production Gap-Filled Yearly L4 Global 500 m SIN Grid V006 2019. Available online: https://lpdaac.usgs.gov/products/mod17a3hgfv006/ (accessed on 10 May 2023).
  53. Imhoff, M.L.; Bounoua, L.; DeFries, R.; Lawrence, W.T.; Stutzer, D.; Tucker, C.J.; Ricketts, T. The Consequences of Urban Land Transformation on Net Primary Productivity in the United States. Remote Sens. Environ. 2004, 89, 434–443. [Google Scholar] [CrossRef]
  54. Imhoff, M.L.; Bounoua, L.; Ricketts, T.; Loucks, C.; Harriss, R.; Lawrence, W.T. Global Patterns in Human Consumption of Net Primary Production. Nature 2004, 429, 870–873. [Google Scholar] [CrossRef]
  55. Abdi, A.M. Land Cover and Land Use Classification Performance of Machine Learning Algorithms in a Boreal Landscape Using Sentinel-2 Data. GIScience Remote Sens. 2020, 57, 1650447. [Google Scholar] [CrossRef]
  56. Maxwell, A.E.; Warner, T.A.; Fang, F. Implementation of Machine-Learning Classification in Remote Sensing: An Applied Review. Int. J. Remote Sens. 2018, 39, 2784–2817. [Google Scholar] [CrossRef]
  57. Bar, S.; Parida, B.R.; Pandey, A.C. Landsat-8 and Sentinel-2 Based Forest Fire Burn Area Mapping Using Machine Learning Algorithms on GEE Cloud Platform over Uttarakhand, Western Himalaya. Remote Sens. Appl. Soc. Environ. 2020, 18, 100324. [Google Scholar] [CrossRef]
  58. Mahdianpari, M.; Salehi, B.; Mohammadimanesh, F.; Motagh, M. Random Forest Wetland Classification Using ALOS-2 L-Band, RADARSAT-2 C-Band, and TerraSAR-X Imagery. ISPRS J. Photogramm. Remote Sens. 2017, 130, 13–31. [Google Scholar] [CrossRef]
  59. Puyravaud, J.-P. Standardizing the Calculation of the Annual Rate of Deforestation. For. Ecol. Manag. 2003, 177, 593–596. [Google Scholar] [CrossRef]
  60. Theil, H. A Rank Invariant Method of Linear and Polynomial Regression Analysis, i, Ii, Iii. Proc. K. Ned. Akad. Wet. Ser. A Math. Sci. 1950, 53, 386–392, 521–525, 1397–1412. [Google Scholar]
  61. Sen, P.K. Estimates of the Regression Coefficient Based on Kendall’s Tau. J. Am. Stat. Assoc. 1968, 63, 1379–1389. [Google Scholar] [CrossRef]
  62. Wilcox, R.R. Fundamentals of Modern Statistical Methods: Substantially Improving Power and Accuracy, 2nd ed.; Springer: New York, NY, USA, 2010; ISBN 978-1-4419-5525-8. [Google Scholar]
  63. Parida, B.R.; Pandey, A.C.; Patel, N.R. Greening and Browning Trends of Vegetation in India and Their Responses to Climatic and Non-Climatic Drivers. Climate 2020, 8, 92. [Google Scholar] [CrossRef]
  64. Evans, J.S.; Murphy, M.A. SpatialEco. r Package Version 1.3-6. R Package Version. 2021, Volume 1. Available online: https://github.com/jeffreyevans/spatialEco (accessed on 10 May 2023).
  65. Sharma, B.D. Occurrence of a Leafy Jungermanniales in the Mesozoic of the Rajmahal Hills, India. JPS 2017, 66, 81–83. [Google Scholar] [CrossRef]
  66. Betancur-Corredor, B.; Loaiza-Usuga, J.C.; Denich, M.; Borgemeister, C. Gold Mining as a Potential Driver of Development in Colombia: Challenges and Opportunities. J. Clean. Prod. 2018, 199, 538–553. [Google Scholar] [CrossRef]
  67. Bar, S.; Parida, B.R.; Pandey, A.C.; Kumar, N. Pixel-Based Long-Term (2001–2020) Estimations of Forest Fire Emissions over the Himalaya. Remote Sens. 2022, 14, 5302. [Google Scholar] [CrossRef]
  68. Faizuldayeva, Z. A Comparative Study of Regulatory Approaches to Mine Closure with a Special Emphasis on the Current Situation in the Former Soviet Union. In Mine Closure 2016: Proceedings of the 11th International Conference on Mine Closure; Australian Centre for Geomechanics: Perth, Australia, 2016; pp. 355–367. [Google Scholar]
  69. Everingham, J.-A.; Svobodova, K.; Lèbre, É.; Owen, J.R.; Worden, S. Comparative Capacity of Global Mining Regions to Transition to a Post-Mining Future. Extr. Ind. Soc. 2022, 11, 101136. [Google Scholar] [CrossRef]
  70. Minsitry of Mines, Govt. of India. Available online: https://mines.gov.in/ (accessed on 1 January 2023).
Figure 1. Location map of the study area Rajmahal Hills in Jharkhand, India. The false color composite (FCC) is derived using near-infrared, red, and green bands of Landsat-8 satellite data. The region of interest is highlighted using blue color inside FCC.
Sustainability 15 08005 g001
Figure 2. Workflow of the present study.
Sustainability 15 08005 g002
Figure 3. Spatial distribution of LULC features over the Rajmahal Hills for the years (a) 1990, (b) 2000, (c) 2010, (d) 2020. The zoomed regions show the selected mining zones.
Sustainability 15 08005 g003
Figure 4. Spatial expansion of mining class over the Rajmahal Hills over the years 1990, 2000, 2010, and 2020. Zones Z1 to Z8 are the zoomed mining locations. Z1: Mundli stone mining region, Z2: stone mining region, Z3: Rajmahal coal mines, Z4: Chalpahar stone mining region, Z5: Borna stone mining region, Z6: Pachhwara coal mining region, Z7: Labapara stone mining region, and Z8: Gosainpahari stone mining region.
Sustainability 15 08005 g004
Figure 5. Field photographs of a few stone mining regions over Rajmahal Hills. Photographs were taken during 21–22 April 2023.
Sustainability 15 08005 g005
Figure 6. Spatial pattern of long-term (2001–2021) (a) GPP, (b) NPP, and (c) VT trend over the Rajmahal Hills. (df) are the GPP, NPP, and VT histograms, respectively.
Sustainability 15 08005 g006
Figure 7. Long-term (2001–2021) GPP, NPP, and VT trend over respective mining clusters (zoomed regions) in Rajmahal Hills. A total of eight mining zones (zoomed region) are highlighted in Figure 4. All zones have four images showing mining extent, NPP, GPP, and VT, respectively, as shown for Z1.
Sustainability 15 08005 g007
Figure 8. Long-term (2001–2021) yearly (a) GPP, (b) NPP, and (c) VT trends over a vegetation degradation site, and (df) are the GPP, NPP, and VT trends over a vegetation regrowth site in a particular mining location in Rajmahal Hills.
Sustainability 15 08005 g008
Table 1. Details of multi-source and multi-sensor satellite data used in the analysis.
DatasetSatellite/Model
(Resolutions)
Data Acquisition (Year)Purpose
Surface reflectanceLandsat 5-TM, Landsat 8-OLI
(30 m, 16 days)
Median image of 1990, 2000, 2010, 2020LULC change
NPPMODIS Terra
MOD17A3HGF
(500 m, Yearly)
Yearly data from 2001 to 2020NPP dynamics
GPPPML_V2
(500 m, Daily)
Yearly mean from 2000 to 2020GPP dynamics
VTPML_V2
(500 m, Daily)
Yearly mean from 2000 to 2020VT dynamics
Table 2. Confusion matrix of classified LULC maps at 10 years interval. User’s accuracy, producer’s accuracy, and overall accuracy are in percentage (%).
Year—1990
LULC ClassesWaterbodyMiningVegetationOthersTotalUser’s Accuracy
Waterbody490015098
Mining043165086
Vegetation004825096
Others020485096
Total49454957200
Producers accuracy10095.5697.9584.21
Overall accuracy94
Year—2000
LULC classesWaterbodyMiningVegetationOthersTotalUser’s accuracy
Waterbody490015098
Mining044155088
Vegetation004735094
Others0005050100
Total49444859200
Producers accuracy10010097.9284.75
Overall accuracy95
Year—2010
LULC classesWaterbodyMiningVegetationOthersTotalUser’s accuracy
Waterbody480115096
Mining042175084
Vegetation004735094
Others0005050100
Total48424961200
Producers accuracy1001009681.96
Overall accuracy93.50
Year—2020
LULC classesWaterbodyMiningVegetationOthersTotalUser’s accuracy
Waterbody5000050100
Mining045055090
Vegetation004825096
Others002485096
Total50455055200
Producers accuracy1001009687.27
Overall accuracy95.50
Table 3. LULC statistics of different classes during 1990–2020. The percentage changes are kept inside the brackets.
ClassesArea in km2
(The % area of each class out of the total area)
Area change in km2
(The rate of change in %)
19902000201020201990–20002000–20102010–20201990–2020
Vegetation2218.332159.462033.321878.86−58.863−126.147−154.453−339.463
(64.20)(62.50)(58.85)(54.38)(−0.003)(−0.006)(−0.008)(−0.005)
Mining10.0613.4723.5664.153.408310.089940.597254.0954
(0.29)(0.39)(0.68)(1.86)(0.029)(0.056)(0.1)(0.056)
Water11.6112.619.6512.801.0089−2.96823.151.1907
(0.34)(0.37)(0.28)(0.37)(0.008)(−0.027)(0.028)(0.003)
Others1215.251269.701388.721499.4254.446119.025110.705284.176
(35.17)(36.75)(40.19)(43.40)(0.004)(0.009)(0.008)(0.006)
Table 4. LULC change matrix for the study periods 1990–2000, 2000–2010, 2010–2020, and 1990–2020. The unit of the area is in km2. Diagonal areas are unchanged areas. The blue color text represents mining-related changes.
Years2000
LULC ClassesVegetationMiningWaterbodyOthersTotal
1990Vegetation1996.811.640.65219.222218.3
Mining0.835.40.433.3910.05
Waterbody0.460.4810.290.3811.61
Others161.375.951.241046.691215.30
Total2159.4713.4712.611269.68
20002010
Vegetation1899.423.060.88256.12159.50
Mining1.125.272.364.7213.47
Waterbody1.890.434.895.4112.62
Others130.8914.81.511122.51269.70
Total2033.3223.569.641388.73
20102020
Vegetation1752.428.101.29271.52033.3
Mining0.4716.701.245.1523.56
Waterbody0.562.955.101.0409.65
Others125.4236.405.171221.731388.70
Total1878.8764.1512.81499.42
19902020
Vegetation1744.3722.291.24450.432218.30
Mining1.364.680.743.2910.07
Waterbody0.680.788.691.4511.60
Others132.4636.412.121044.261215.30
Total1878.8764.1612.791499.43
Table 5. Total vegetation productivity and transpiration losses caused due to mines-induced vegetation loss during 2000–2020.
Periods2000–20102010–20202000–2020
Mines-induced vegetation loss (km2)3.068.1022.29
GPP (tC/day)0.010.040.09
NPP (tC)1.252.777.27
VT (mm/day)520013,63030,190
Table 6. Total increment in vegetation productivity and transpiration due to vegetation regrowth in mining areas during the study periods.
Periods1990–2000 (D1)2000–2010 (D2)2010–2020 (D3)
Vegetation regrowth in the mining area (km2)0.831.120.47
GPP (KgC/day)2.843.671.41
NPP (tC)0.300.370.22
VT (mm/day)10001340530
Disclaimer/Publisher’s Note: The statements, opinions and data contained in all publications are solely those of the individual author(s) and contributor(s) and not of MDPI and/or the editor(s). MDPI and/or the editor(s) disclaim responsibility for any injury to people or property resulting from any ideas, methods, instructions or products referred to in the content.

