Article

Sustainable Operations: A Systematic Operational Performance Evaluation Framework for Public–Private Partnership Transportation Infrastructure Projects

1
SILC Business School, Shanghai University, Shanghai 201800, China
2
Myers-Lawson School of Construction, Virginia Polytechnic Institute and State University, 1345 Perry St, Blacksburg, VA 24061, USA
3
Shanghai Highway and Bridge Group Co., Ltd., Shanghai 200433, China
*
Author to whom correspondence should be addressed.
Sustainability 2023, 15(10), 7951; https://doi.org/10.3390/su15107951
Submission received: 28 February 2023 / Revised: 3 May 2023 / Accepted: 10 May 2023 / Published: 12 May 2023

Abstract

:
With the application of public–private partnership (PPP) model in urban transportation infrastructure projects, various participants have put forward multi-dimensional demands to the operation and maintenance of infrastructures. This study aims to establish a systematic operational performance evaluation framework for PPP transportation infrastructure projects. Based on a literature review, the balanced scorecard was improved, and a conceptual model of multidimensional performance assessment was constructed. The structure of the qualitative performance assessment system was quantified and analyzed by combining structural equation modeling with questionnaires to obtain causal relationships among the indicators. Subsequently, a system dynamics model was constructed to assess the performance dynamically, and a validation analysis was conducted. It finds that maintaining a low level of operational quality over an extended period can significantly reduce stakeholder satisfaction, consequently exacerbating the decline in project performance. In contrast, an improvement in the level of informatization is found to positively contribute to enhancing operational quality and facilitating the long-term sustainability of project operations. It innovatively integrates four dimensions of financial, multi-stakeholder satisfaction, operation and maintenance quality, and sustainability performance to enrich the theoretical system of PPP transportation infrastructure performance assessment. At the same time, it analyzes the influence mechanism among the indicators and its long-term dynamic performance, which provides an effective decision-making tool for operational performance management.

1. Introduction

The public–private partnership (PPP) model allows private financing to procure public facilities, obtain concession authority, and provide public services, which is a long-term benefit-sharing and risk-sharing partnership established by the government and private companies to provide public products and services [1]. Benefiting from the shared responsibility between the government and private companies and the stable macroeconomic environment [2], the PPP model has become China’s fastest-growing project investment model in urban infrastructure. According to the statistics of the China Public Private Partnerships Center project database [3], more than 1000 transportation infrastructure PPP projects were in the construction stage at the end of 2022. This indicates that, shortly, more and more urban infrastructure PPP projects, including roads, bridges, tunnels, etc., will start operation. The operational phase is typically long, and the project operation is dominated by operation and maintenance (O&M) enterprises, while the government and the public become the supervisor and regulators of operation services. The enterprises’ O&M decisions directly determine the realization of the facility’s multi-stakeholders’ performance goals. So, how to evaluate the operational performance is an important topic to investigate.
Project performance is the key information needed for project operation evaluation. Traditional financial indicators usually attract attention when performing performance evaluations, but in a sense, finance is a backward indicator that reflects the results of management measures that have been taken [4]. In urban infrastructure projects, multi-dimensional performance evaluation indicators are more widely used. In 1988, Glendinning proposed the concept of Value for Money (VFM), which evaluates the value of public projects from three aspects: economy, efficiency, and effectiveness [5]. The research on the influencing factors for the VFM of public projects also began [6,7]. However, the research on the influencing factors of the VFM effect pays more attention to the performance evaluation before the establishment of the project and lacks the consideration of the influencing factors in the project operational stage. The balanced scorecard (BSC) method is an organizational performance evaluation system, which can reflect performance comprehensively from four dimensions of finance, customers, internal business processes, and innovation and learning. In the past two decades, most of the performance evaluation models used in the construction field have been derived from the BSC [8,9]. Although BSC is widely used in the field of project performance management, it also has certain limitations for different research contexts. Firstly, some of its measurement indicators are too narrow, for example, the BSC only includes customers and shareholders, while ignoring alliance partners, users, and regulators from the perspective of multiple stakeholders [10]. Secondly, changes in one performance indicator may affect other indicators [11], but there is no empirical evidence on how to construct causal relationships between indicators [12]. Thirdly, the BSC is static and cannot be used to determine future state changes based on experience, and it is difficult to explore the relationship between future conditions and states, which is not suitable for long-term dynamic research [13].
In the context of PPP, the entire life cycle of transportation infrastructure needs to meet the performance goals of multiple stakeholders [14] and the sustainability requirements of economic and environmental development [15]. There are concerns about the financial aspects [16], multi-stakeholder satisfaction [17], operation and maintenance quality [18], and sustainability performance [19] of the O&M phase of transportation infrastructure. These aspects migrate the BSC, which is oriented to organizational performance assessment, to project performance assessment and provide directions for the performance assessment research of PPP transportation infrastructure projects. For operation and maintenance companies, their performance evaluation of PPP transportation infrastructure projects should meet the requirements of value co-creation, multi-level evaluation, and dynamic response. However, the traditional O&M performance evaluation system is still static, mainly focusing on facility integrity, safety, and financial status [18]. It only focuses on one or several aspects of performance evaluation and lacks a comprehensive operational performance evaluation system with a multidimensional perspective [20]. Moreover, there are few quantitative explorations about the impact mechanisms of indicators from a multidimensional system perspective [12]. Further, the operation and maintenance phases are characterized by long-term dynamics and require state prediction and assessment to help in performance management [21].
To address the above questions, this paper proposes to accomplish three research objectives. First, to construct a framework for evaluating the performance of PPP transportation infrastructure O&M with systematic and multidimensional indicators, which is partially improved based on the BSC. Second, to explore the influence mechanisms among indicators within the performance assessment system, this step introduces structural equation modeling (SEM) to conduct the study. Finally, the mechanism of performance evolution under a long-term dynamics situation is investigated to balance performance. This step guides the operational performance evaluation by constructing a system dynamics (SD) model. In this research, the qualitative conceptual model and the quantitative simulation model are effectively integrated through a hybrid approach of improved BSC, SEM, and SD simulation models. It can be applied to the decision making of a series of management issues with similar characteristics in engineering projects. This research establishes an operational performance evaluation framework for PPP infrastructure projects, which can (1) establish simulation scenarios according to the characteristics of specific projects, (2) simulate project long-term performance, and (3) guide the decision making in infrastructure operation.
The remainder of this paper is organized as follows. Section 2 provides a review of the existing literature on the research topic. Section 3 describes the research methodology of this paper, which is a hybrid approach with three components of an improved BSC, SEM, and SD model, addressing the three key questions mentioned above. Section 4 improves the balanced scorecard and constructs the performance index evaluation system. Section 5 builds a structural equation model to analyze system structure. Section 6 builds the system dynamics model. The results are discussed in Section 7. Finally, Section 8 summarizes the research conclusions of this paper.

2. Literature Review

This paper proposes a performance assessment system specifically designed for the operation period of PPP transportation infrastructure projects. The system considers the composition of indicators, their relationships, and the dynamic evolution of the performance assessment system, with a focus on addressing the challenges of assessing performance in long-term operations. Drawing on the relevant literature, this review is structured into three main sections: (1) characteristics of PPP transportation infrastructure operation, which examines the distinctive features of the operation period of PPP projects and the strategic goals they entail; (2) assessment of operation performance in PPP transportation infrastructure projects, which provides an overview of the existing research on this topic; and (3) methods for system dynamic performance assessment, which analyzes effective approaches to tackle the unique characteristics of the research problem.

2.1. Characteristics of PPP Transportation Infrastructure Operation

Transportation infrastructure is built to support the movement of people and goods, providing access to vital resources for daily activities and emergencies, which in turn serve economic and social development [22]. The project life cycle contains various phases such as planning, procurement, construction, operation and maintenance, etc. [23]. Among them, the operational phase plays the main role mentioned above, and its reasonable performance evaluation and high-quality operational outputs are considered to contribute the most to the success of the project [24]. The operational phase of a transportation infrastructure project is a long-term process, typically ranging from 10 to 30 years. During this process, the facility operator is required to provide good facility operation and maintenance services, to achieve the financial and efficiency performance targets of the project [25], and to create positive social and economic externalities [26]. In addition, in the long-term operation and maintenance process, the condition of the facility, the surrounding environment and other aspects change dynamically [27]. Therefore, facility performance evaluation for the O&M period is a complex systemic issue. Operational performance evaluation of the PPP model is more complex because it carries out projects through a partnership between private organizations and the government, including financing and concession of transportation infrastructure [1]. This means that the operation and maintenance of the facility is undertaken by the private sector, and the public sector is responsible for monitoring and measuring the services and performance of the private sector [28]. For the facility operator, a systematic framework for the operation of the facility is needed to accomplish the goals of the PPP project.
Existing studies have also explored the key strategic objectives of the operational phase of PPP transportation infrastructure, including financial ability, multi-stakeholder satisfaction, operation and maintenance management, and sustainability, as shown in Table 1. Financial status is the traditional indicator for project evaluation [29]. In the context of transportation infrastructure project evaluation, the three dimensions of solvency, operational capacity, and development capacity can be summarized in the context of accounting metrics [30]. The stakeholder relationship towards the PPP model is more complex because it involves multiple stakeholders such as government and private investors, facility operational managers, and public users. In [17], it was pointed out that the operation and maintenance phase is the most intimate phase among stakeholders. Therefore, research on stakeholder satisfaction has become a direction that mainly focuses on the achievement of performance goals of the public sector, private sector, and users [14]. The maintenance of the quality of facilities and equipment and the optimization of the efficiency of facility operations are the main objectives of facility operations, and studies in this area also try to optimize the operational efficiency from different perspectives [31,32]. In terms of sustainability, the study points out that the construction of transportation infrastructure has an impact on the sustainable development of society because of construction investment, resource consumption, pollutant emissions, and positive externalities after completion [26]. Sustainable development has also become the future direction of the PPP model [19], focusing mainly on economic, environmental, and social sustainability [15].
There is no doubt that the principles mentioned above provide the guidance for the operational performance assessment of PPP projects. However, it does not provide a proven systematic evaluation scheme for the operating enterprise entities, especially the question of how to dynamically weigh different strategic objectives in the actual operation of the project is not answered.

2.2. Assessment of Operation Performance in PPP Transportation Infrastructure

Project performance indicates the direction required to achieve the project’s strategic objectives and is a powerful tool for project management. In the field of transportation infrastructure, some mature performance evaluation framework systems have been developed. For example, Glendinning introduced the concept of Value for Money (VFM) in 1988 and believed that the value of public projects is reflected in three aspects: economy, efficiency, and effectiveness [5]. However, VFM is more concerned with the feasibility decision of establishing a PPP project. For example, Makovšek et al. [33] researched the key factors of VFM evaluation in PPP projects. Hu et al. [34] studied the VFM quantitative evaluation of PPP expressway projects in China to evaluate the funds of PPP transportation infrastructure projects, thereby assisting local governments in financing decision making. Zhao et al. [35] verified the key role of cost and service quality in asset delivery decisions through empirical research. The three aspects of VFM make it difficult to illustrate the strategic objectives required for the operational phase of PPP transportation infrastructure projects. The balanced scorecard (BSC) is another well-established performance assessment framework that was proposed by Kaplan and Norton [36] when they studied the operational performance of well-performing companies. It includes four dimensions: financial, internal business processes, customer, and learning and growth. The BSC systematically covers all dimensions of performance evaluation and is widely used in the project and strategic performance evaluation of construction companies [37,38]. However, the BSC also has certain limitations and some of its indicators are macroscopic and have limitations [10], such as the customer dimension, which is not applicable to the evaluation of projects with multiple stakeholders. Many scholars have enriched and improved the BSC metrics according to the project characteristics. For example, Sirin et al. [39] used improved BSC for performance evaluation and resource allocation; Liu et al. [20] established a performance evaluation model for PPP rail transit projects by combining the BSC and stakeholder theory to improve the performance evaluation index. It is not difficult to find that the evaluation indexes of BSC have some similarity with the strategic objectives of PPP transportation infrastructure during the operation period, which provides a basic framework for PPP project operation performance evaluation. However, in view of the macroscopic nature of BSC indicators, it is necessary to further improve and enrich the BSC indicator system according to the characteristics of PPP projects.
Currently, the exploration of the operational performance evaluation of PPP transportation infrastructure mainly includes financial, operation and maintenance quality, management level, and other dimensions, as shown in Table 2. For example, Rahman et al. [16] conducted a study on the performance evaluation of the PPP railway project operation and maintenance phase from the perspective of cost and benefit, and comprehensively considered the financial status throughout its life cycle, including investment costs, operation and maintenance costs, and fares. The research of Liu et al. [40] on the performance evaluation of the operational phase can be summarized as the concern about the quality, safety, and continuity of project operation. Xu et al. [18] used Industry Foundation Classes (IFCs) to evaluate the performance of the PPP urban rail project during the operation phase, which mainly included indicators such as financial management, information management, and reliability of facilities and equipment. Ming et al. [41] constructed a performance evaluation model for the operation and maintenance phase of PPP transportation infrastructure from the three dimensions of output, effect, and management. Obviously, these evaluation frameworks focus on both financial and O&M quality aspects, ignoring, for example, stakeholder satisfaction and the sustainability of PPP projects. Although some studies mentioned both aspects, they did not provide specific indicators for project performance assessment, as shown by “-” in Table 2.

2.3. Methods for System Dynamic Performance Assessment

It is commonly believed that performance indicators of different dimensions are not independent of each other and may have causal relationships, forming a complex system [11]. System structure analysis has always been a key step in the study of complex systems, especially in the study of qualitative system problems. It is difficult to quantitatively analyze the causal relationship between factors. Samee et al. [44] used the structural equation model (SEM) to determine the causal relationship among the measurement factors of construction equipment management, project performance, and company performance. The SEM is based on the statistical method of the variance covariance matrix, which can establish the structural relationship between fitting multivariate indicators. SEM is accurate and objective in assessing indicator relationships from a static perspective and is therefore also widely used in the study of qualitative problems in the field of engineering management [45,46]. However, there is no study that explores the causal relationship between the several dimensions of PPP project performance evaluation based on a systematic perspective.
In addition, the operation of the project is characterized by long-term dynamics, and project performance needs to be assessed dynamically [21]. The system dynamics (SD) method is an effective tool for evaluating the system’s ability to adapt to changes and test new decisions [47]. The core contribution of the SD model lies in the development of a system that simulates complex interactions, which simulates research issues from a long-term and dynamic perspective. It has been applied to solve a variety of complex dynamic problems in the construction industry, including PPP infrastructure procurement [48] and sustainability performance [49]. Pagoni et al. [50] used the SD model to characterize the causal effects and their long-term performance when evaluating the finance and sustainable strategies of PPP projects. When the causal relationship between system-influencing factors is difficult to quantify, other tools can be used for analysis. For example, Ecem Yildiz et al. [12] used SD modeling based on the BSC framework to study the impact and improvement of internal processes and external conditions on strategic performance during construction. In terms of characterizing qualitative problems, Liu et al. [51], when researching the formation mechanism of construction industry competitiveness, proposed a simulation model combining SEM and SD to describe the complex system structure which is difficult to quantify. However, in the field of PPP transportation infrastructure operation performance management, there is a lack of research on the dynamic evolution of performance assessment systems.
To sum up, the current evaluation of transportation infrastructure projects by operating enterprises mainly focuses on traditional dimensions such as operational quality, operational safety, and finance, ignoring the multi-stakeholder’s participation and social sustainable development characteristics of PPP transportation infrastructure. There is a lack of a systematic and dynamic performance evaluation framework. In terms of the performance evaluation system, there is still room for improvement in the BSC, which can adapt to the evaluation needs of different scenarios. SEM is widely used in qualitative evaluation issues, such as safety evaluation and performance evaluation in engineering management, and can be used to make up for the defects of independent evaluation system indicators. For complex dynamic problems, the top-down designed SD model can describe the internal dynamic structure and feedback mechanism of the system. Different approaches can be integrated to solve practical management problems.

3. Materials and Methods

The proposed model uses a hybrid approach combining a balanced scorecard, structural equation model, and system dynamics model. An improved balanced scorecard can be used to construct a qualitative conceptual model of the performance assessment system; the structural equation model can be used to quantify the relationships of indicators within the conceptual model system; and the system dynamics model can be used for dynamic assessment of performance. The flow of the research framework, which is developed in three parts, is shown in Figure 1.
Part I: The literature review helps to understand the need for operational performance assessment of PPP transportation infrastructure [52]. In this section, “Public–private partnership transportation infrastructure”, “Public–private partnership transportation infrastructure operation and maintenance performance”, and “transportation infrastructure operation and maintenance performance” were used as keywords to search the literature, and 65 studies were searched. By browsing through the abstracts, 45 studies on related topics were selected to extract guiding principles and key aspects for evaluating the performance of PPP transportation infrastructure projects in the operation and maintenance phase. An improved balanced scorecard is built to meet the operational performance evaluation needs, forming the conceptual model of this study. This part is realized in Section 3.
Part II: Although the conceptual model is established, it is mainly based on the existing literature and policy requirements, and it is difficult to verify the rationality of the qualitative model. Structural equation models, especially covariance-based structural equation models, are accurate and objective in assessing indicator relationships from a static perspective and have advantages in testing research hypotheses [53]. Therefore, SEM is introduced to verify the validity of the model. Among the commonly used modeling tools for SEM, M+ is known for its highly flexible latent variable analysis model and unique capability such as exploratory SEM and Bayesian SEM [54], so the M+ tool was used in this study to construct the model. Following the research logic of SEM, a research questionnaire was designed based on the conceptual model to be used to accumulate opinion data from professionals in the O&M field using convenience sampling techniques [55], and then a model was constructed to explore the causal relationships within the system, forming a quantifiable system structural model. This part is realized in Section 4.
Part III: The system dynamics model provides strong support to make up for the deficiencies of SEM static studies and adapts to the dynamic changes in the long-term operational performance of engineering projects [49]. VENSIM software was chosen as the modeling tool for this study because it allows modeling multiple variables that change over time [52]. Following the system dynamics modeling logic, the study combines the results of SEM on the influence relationships among performance system indicators, analyzes the system structure and constructs causal loop diagrams, sets corresponding variables to build system flow diagrams for quantitative analysis, obtains the evolutionary mechanisms of critical influence paths in the system through qualitative and quantitative validation of the model, and thus characterizes project performance in a long-term dynamic context. This will be implemented in Section 5.

4. Construction of an Index System

For infrastructure projects, project operation is a long-term dynamic process. From the point of its evaluation method, performance evaluation should be dynamically monitored, its output and service level should be measured regularly, and remuneration should be linked to actual performance. From the perspective of its evaluation content, the main purpose of financial evaluation is to increase project profits, reduce project costs, and maximize shareholders’ benefits [56].This is because of its capital cooperation relationship, including the government and investor’s capital contribution, the management of the operator, and the provision of services to the public. It is necessary to strike a balance between the different needs of all parties and achieve the co-creation of value. The operation of infrastructure projects must not only measure the effects of their operations and services, but also the quality and safety of the facilities themselves [57]. Moreover, as a large-scale public project, the PPP transportation infrastructure has a significant impact on the economy, society, and the ecological environment. It should focus more on sustainable development dimensions’ evaluation.
Through the above analysis, the selection of the indicators of the PPP transportation infrastructure project operational performance evaluation system must meet the following principles:
(1)
Combination of comprehensive indicators: the evaluation system should consider the demands of all stakeholders to achieve value co-creation.
(2)
Combination of financial and non-financial indicators: the performance evaluation of PPP projects not only needs to consider the financial operation capabilities of the project, but also the internal control management of the project (including the efficiency and effectiveness of public services), its social environmental impact (sustainability), and the satisfaction of all stakeholders.
(3)
Combination of static and dynamic indicators: the selection of indicators should include factors such as the organizational structure that is stable at the beginning of the project and has a long-term impact on project performance, as well as factors such as service quality, which is dynamically updated as the project progresses, affected by the organizational external environment, and affecting project performance dynamically and continuously.
(4)
Combination of commonality and individuality indicators: it is necessary to deepen and refine the current commonality framework of transportation infrastructure performance evaluation and introduce the individual requirements of PPP project performance evaluation.
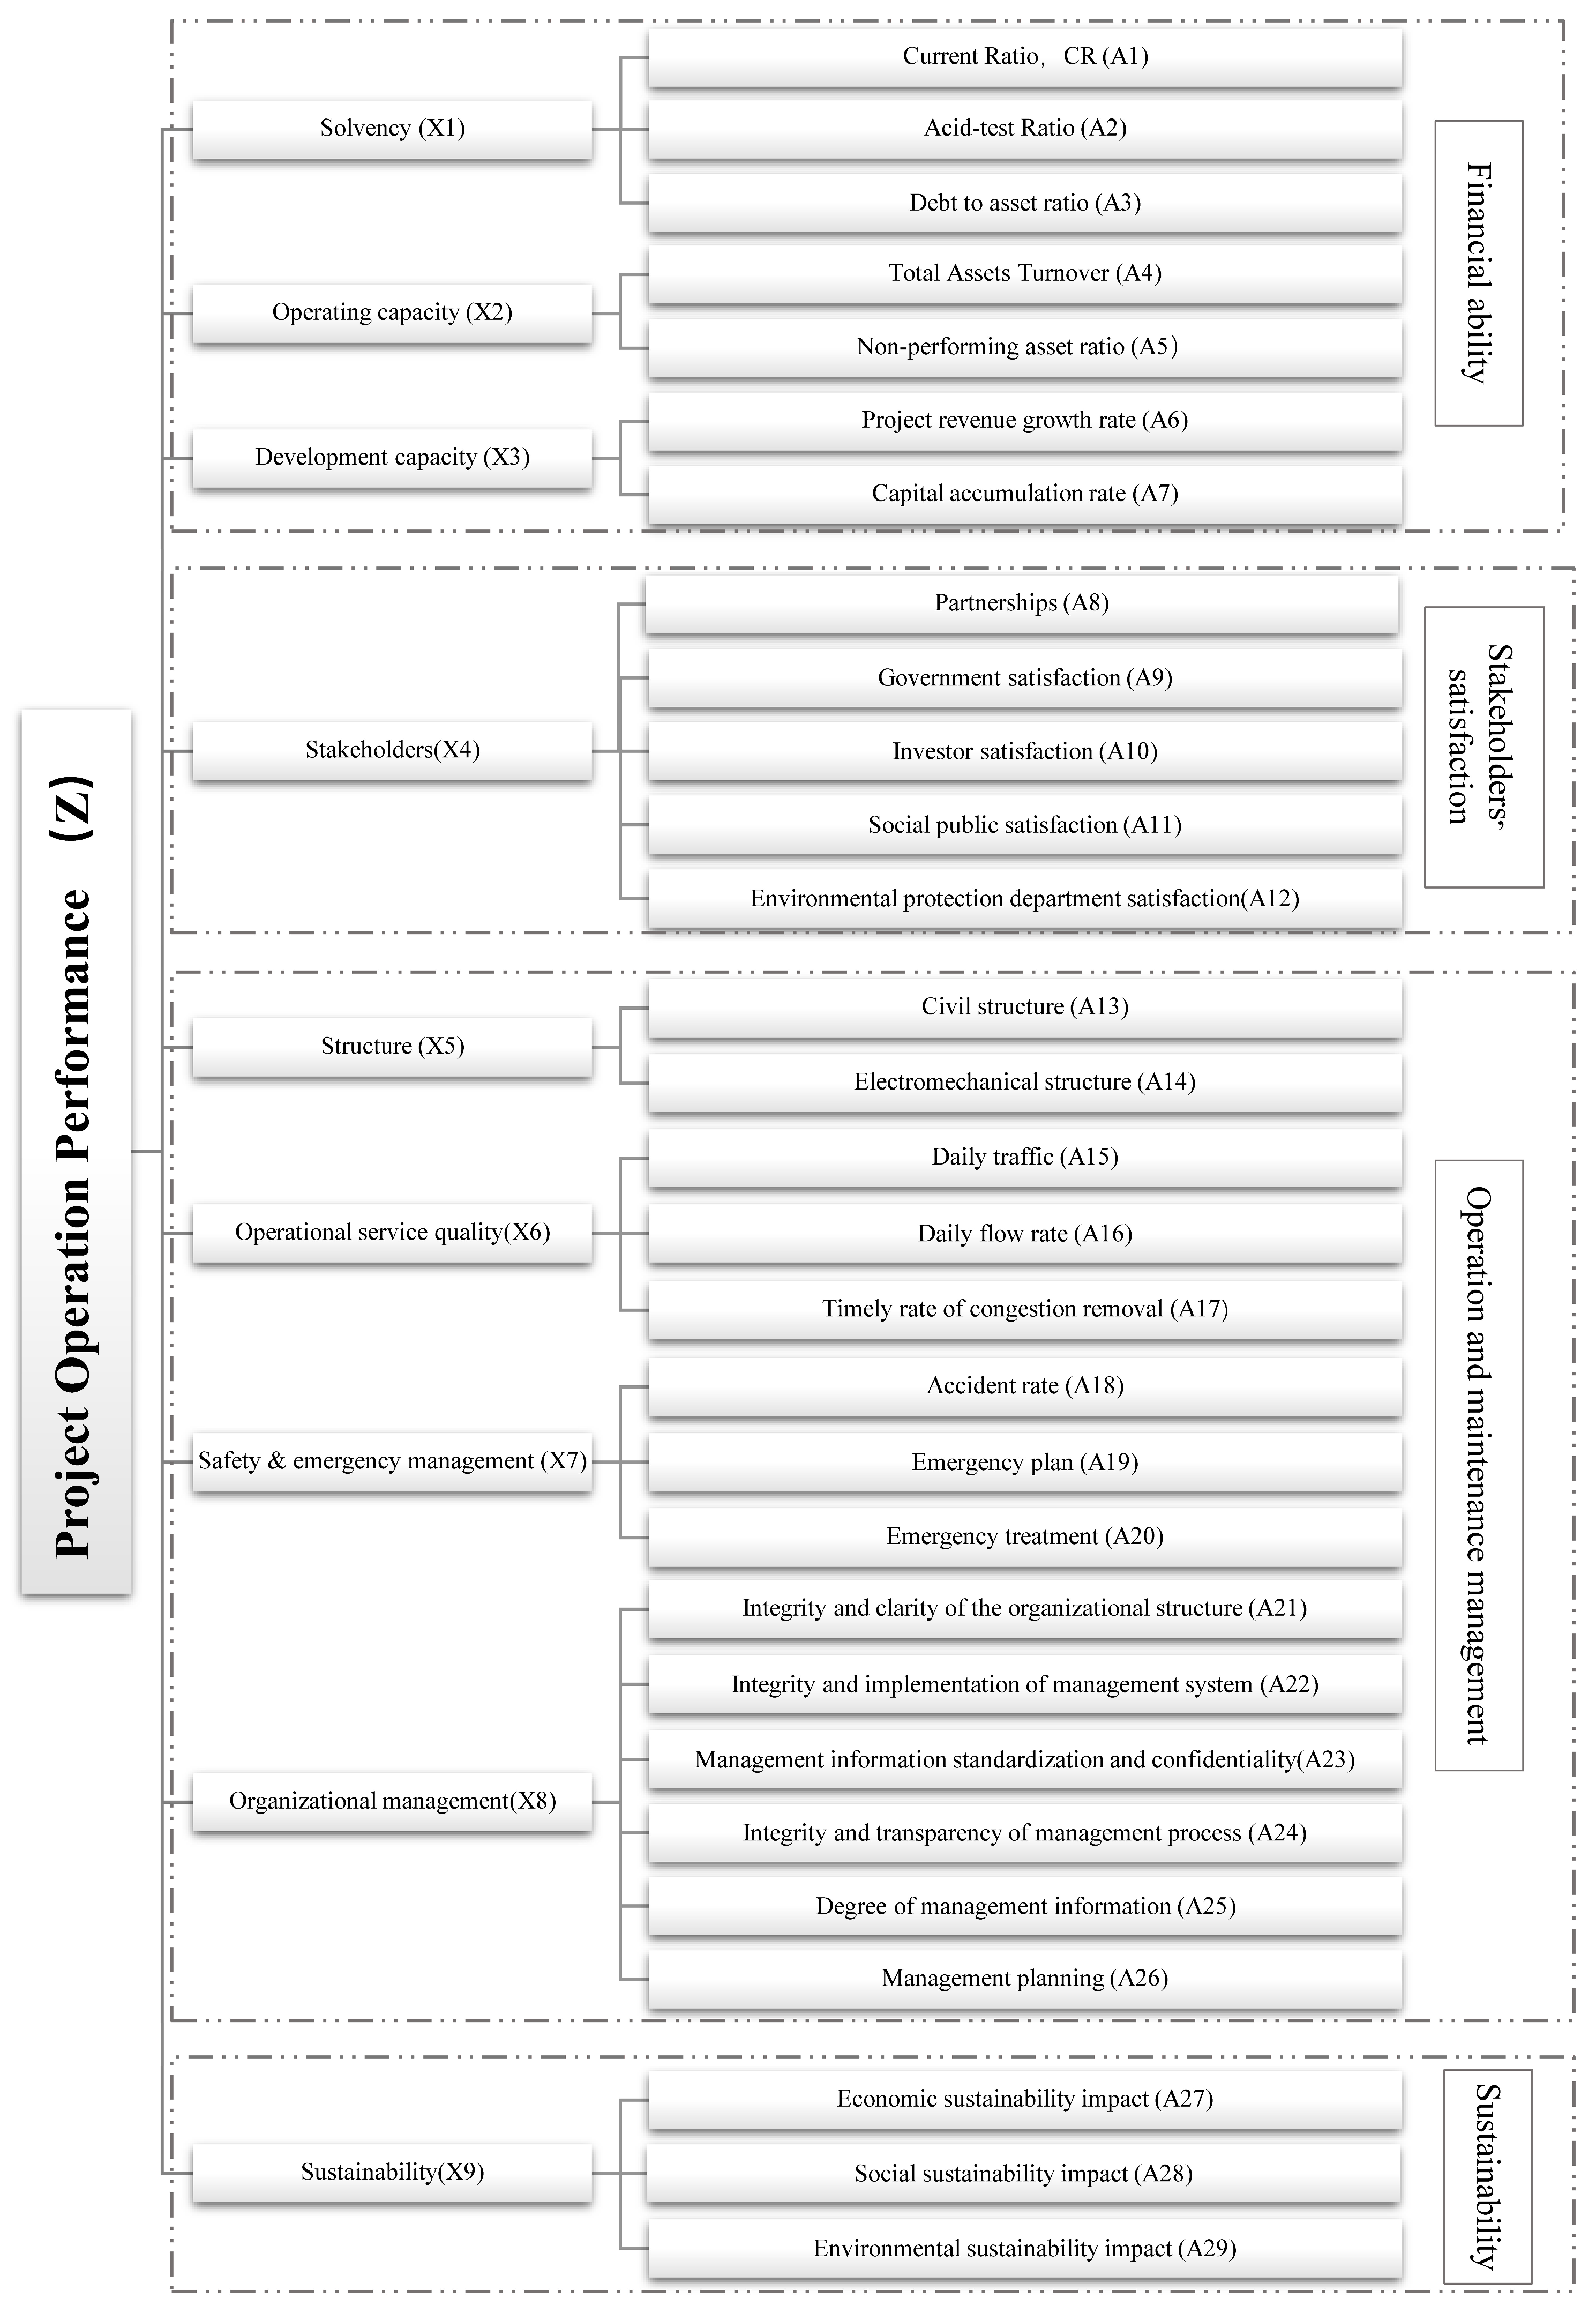
Based on the above analysis, the study improves the BSC. Original financial metrics are preserved. We improve the original “Customer” dimension to the “Stakeholders” dimension to meet the comprehensiveness of the indicators. “Internal Management” is changed to “O&M Management” to evaluate the structural quality and service quality during the operation phase of the infrastructure. “Innovation and growth” mainly measures organizational growth, which pays more attention to employee training and professional talent introduction, weakening its importance in project performance, so this dimension is replaced with “Sustainability”, emphasizing project dynamics and sustainable development capabilities. The improved BSC establishes an operational performance indicator system from four dimensions of finance, stakeholders, O&M management, and sustainability, as shown in Table 3.
(1)
Financial ability
Investors are more concerned about the project’s finances, and the financial performance by accounting is generally measured in terms of debt position, sales level, and inventory level [30]. According to the nature of PPP infrastructures’ operational business, this paper summarizes three aspects: solvency, operational capacity, and development capacity. Solvency reflects the ability to repay debts. It is the key to the survival of the project company and the healthy operation of PPP projects. Common quantitative assessment indexes of debt servicing capacity include the equity liability ratio, debt service coverage ratio, current liabilities cash flow ratio, debt-to-cash ratio, and other indicators [58]. To avoid the crossover and duplication among several indicators, this paper uses short-term solvency, asset liquidity, and debt operating ability. Operating capacity measures the project’s capital turnover and asset utilization level. Common operating capacity indicators include cash return on the investment and project profitability [59], which are grouped into two aspects according to the condition of facility assets: overall asset operating capacity and non-performing assets’ operating status. Development capability reflects the potential for sustainable development or expansion, including net present value and future financial losses [60], which are categorized as project revenue growth level and project capital accumulation ability according to the development status of the project.
(2)
Multi-stakeholders’ satisfaction
In the operation phase, the main stakeholders are the government, investors, operators, and the public [61]. Under the PPP model, the government assumes the roles of collaborator and supervisor, and government satisfaction reflects the operational effectiveness of the project from the perspective of social order. Investors in the project are no longer limited to government entities and may include private organizations such as companies or individuals, and investor satisfaction reflects the operational effectiveness of the project from the perspective of investment returns. The public represents the users of the transportation infrastructure, and public satisfaction evaluates the operational effectiveness of the project from the perspective of service quality. Due to the characteristics of multi-stakeholders, partnership is also crucial in the assessment of operational performance. In addition, infrastructure projects can have environmental impacts, and the review or penalty opinions of environmental monitoring agencies should also be included in the scope of performance assessment.
(3)
Operation and maintenance management
During the operation phase, the operator should assume not only the traditional organizational and management responsibilities but also the full-cycle continuous responsibility of project deliverables. This includes infrastructure structure inspection and maintenance, operational service quality, safety and emergency management response level, organizational management level, etc. Among them, infrastructure structure includes civil structures and the electromechanical system [25]. The civil structure level evaluates the quality of specific substructures such as road surfaces and road signs, while electromechanical system evaluation describes the functional level of the power supply system, ventilation system, communication system, lighting system, and other subsystems. The operation service quality includes traffic flow levels, road traffic quality, blockage removal ability, etc. [62]. Traffic flow level characterizes the traffic volume, traffic flow rate, and other road traffic flow performance; road traffic quality represents the traffic speed, smoothness rate, and other road traffic quality performance; and blockage removal ability represents the congestion rate, congestion elimination timely rate, and other congestion disposal performance. Safety and emergency management evaluation is mainly from traffic safety level, completeness of emergency plans, and the timeliness of emergency response [63]. Traffic safety level describes the accident rate, accident severity, and other accident performance; completeness of emergency plans describes the response capability of emergency plans; and the timeliness of emergency response describes the ability to deal with emergencies. The evaluation of organizational management dimensions includes indicators such as the integrity and clarity of the organizational structure [65], integer and implementation of the management system [64], the management information standardization and confidentiality [66], and so on.
(4)
Sustainability
This dimension mainly considers the future development capabilities of the PPP project and reflects the project’s impact on improving economic, social, and ecological benefits.
Based on the above analysis, the PPP transportation infrastructure operational performance evaluation indexes are designed with 9 secondary indicators (X1–X9) and 29 tertiary indicators (A1–A29) according to the four dimensions of the improved balanced scorecard of finance, multi-stakeholders’ satisfaction, operation and maintenance management, and sustainability. The study hypothesized that the secondary indicators are combined according to the four dimensions of the improved BSC, respectively, which have a significant impact on project performance, and the conceptual model is shown in Figure 2.

5. System Structural Analysis

5.1. Questionaire Design and Distribution

In order to evaluate whether the conceptual model structure is reasonable, this study designed a questionnaire to collect experts’ opinions on the rationality of the indicators. The questionnaire is divided into two parts: background information and an expert score sheet. In the background information part, experience information such as the professional background and the years of participation in the project are counted. In the expert scoring table, 29 evaluation questions were designed on the tertiary indicators using the Likert nine-point scale, and experts were invited to rate the importance of each indicator to performance evaluation.
In the selection of research objects, based on the difference between the PPP model and the traditional model, expert opinions with an in-depth and overall understanding of the needs of the entire life cycle of PPP projects, especially the O&M phase, have research value. Specifically, experts who have an in-depth understanding of the breadth, depth, and fineness of the actual operation and maintenance management of PPP transportation infrastructure projects should be selected, such as senior managers of operation and maintenance enterprises who have accumulated a lot of experience in the PPP project operation and maintenance phase, scholars in the field of PPP transportation infrastructure project operation and maintenance performance evaluation who have a broad understanding of multi-stakeholder demands, investors with extensive experience in transportation infrastructure project operation and maintenance benefit evaluation, and government personnel who have an in-depth understanding of national policy requirements. The convenience sampling technique was used for the study as it helped to select the right respondents based on the study [55]. The sampling program is centered around the transportation infrastructure O&M units in Shanghai, and the questionnaires were distributed based on ongoing PPP transportation infrastructure operational projects. Senior managers, experts, academics, and government personnel with more than 5 years of experience in O&M of transportation infrastructure projects, or who have participated in O&M studies of more than three traditional infrastructure projects in addition to this project, were selected as interviewed experts. These experts have in-depth understanding of both traditional and PPP models. Through on-site distribution and online interviews, 80 questionnaires were distributed and 52 were returned. Excluding invalid answers, 49 valid questionnaires were retained. A total of 59% of the data came from the top managers of operating enterprises. A total of 25% of the data came from researchers who have been engaged in research on the operational performance of transportation infrastructure throughout its life cycle. Data from investors and the government each account for 8%. These respondents have all participated in the operation and maintenance management of a number of traditional models and PPP transport infrastructure projects, accumulated rich experience, and have a relatively in-depth understanding of demands on the operation and maintenance of transport infrastructure under PPP. Considering the limited number of PPP projects in operation, to ensure the quality of the questionnaire, this sample size is also acceptable. The sample size is higher than existing studies [7].

5.2. Reliability Analysis

SPSS is used to test the reliability and validity of the questionnaire. In the questionnaire reliability test, Cronbach’s α reliability test is used to analyze the reliability of the performance indicator dimension system. The value ranges from 0 to 1, and greater than 0.7 is generally considered to be acceptable reliability [67]. In this experiment, the model’s Cronbach’s α value was 0.82, which indicates that the internal consistency of the model is sufficient. The KMO value is used to characterize the validity, where values greater than 0.5 are barely acceptable [68]. In this experiment, after deleting the insignificant indicator A20 “The timeliness of emergency response”, the KMO became 0.582, which is not particularly ideal. The cumulative variance contribution rate was also noticed at 91.23%. Considering the limited sample size, the verification is also acceptable.

5.3. SEM Construction and Operating Results

Structural equation modeling (SEM) is a statistical method based on the variance–covariance matrix, which offers greater model flexibility and robustness, allowing for the examination of structural relationships among multiple variables [53]. One major advantage of SEM is its capability to handle latent variables, which are unobserved variables, and explore the structural relationships among them. Latent variables are represented by observed variables, which directly measure different aspects of the latent variables. SEM employs confirmatory factor analysis (CFA) to study the relationships among factors (i.e., latent variables), but CFA often fails to replicate the factor structure obtained from exploratory factor analysis (EFA). Exploratory structural equation modeling (ESEM) combines the estimation methods of SEM and the functionalities of both EFA and CFA, enabling cross-factor loadings comparison and obtaining better-fitting factor models [69]. The general steps of ESEM include model specification, factor rotation to obtain factor loadings, parameter estimation, and model evaluation and comparison. In this model, the scores of 29 measurement items obtained through questionnaire surveys are used as the values of observed variables to represent the levels of latent variables. Based on the factor analysis results from ESEM, three covariates (F1–F3) are added to adjust the model structure and establish relationships among latent variables. The maximum likelihood method (MLM) is used to estimate parameters that maximize the probability density function for generating observed data [70]. It is particularly suitable for processing non-normally distributed data.
The chi-square degrees of freedom ratio, comparative fit index (CFI), and Tucker–Lewis index (TLI) are used to assess the adequacy of the ESEM model. A chi-square degrees of freedom ratio less than 3 and CFI and TLI values equal to or higher than 0.9 indicate a good fit. In this study, the chi-square degrees of freedom ratio is 1.41, the CFI value is 0.926, and the TLI value is 0.911, indicating that the model fits well. The model results are shown in Figure 3. In the measurement model, the observed variables’ t-tests of each latent variable are significant at the 0.01 level, and the standardized factor loadings are between 0.74 and 0.95 except for A6, which is 0.35 (<0.5) and lower than the acceptable ideal range. In terms of comprehensive reliability, except for the latent variable X3, which has an average variance extracted (AVE) value of 0.37 and a composite reliability (C.R.) value of 0.51, the C.R. of the latent variables is greater than 0.9 and the AVE is greater than 0.7 [71]. The performance of variables X3 and A6 is related to the current small sample size. From the perspective of the composition of financial capabilities, variables X1 and X2 mainly represent the current financial status of the project, and variable X3 represents the future financial status of the project. They describe financial performance from different dimensions, and the performance deviation of both X3 and A6 is relatively acceptable; they have been temporarily retained with the current difficulty in obtaining samples [72]. In the structural model, the t-test results between latent variables are significant at the 0.1 level, and the path coefficients are between 0.1 and 0.7.
The structural equation model starts with the characterization of project performance during the operation phase, stands at the height of the system, and better characterizes the performance of the project by establishing the quantitative relationship between the indicators. Through SEM analysis, the causal relationship between indicators is established. According to the analysis results, the research has established three types of causality. First, according to the conceptual model framework, the tertiary indicators have an impact on the performance of the project through the secondary indicators that they belong to. For example, the current ratio (A1) of the project can be used to characterize the solvency (X1) status of the project and then the performance level of the project (Z). Second, the combination of tertiary indicators forms an auxiliary variable that has an impact on the characterization of project performance. For example, the combination of “investor satisfaction” (A10) and “government satisfaction” (A9) forms auxiliary variable F2, which has a positive effect on project performance. Third, a causal relationship is established between the tertiary indicators. For example, in the “organizational management” (X8) dimension, “degree of management information” (A25) and “integrity and transparency of management process” (A24) are related. Moreover, the impact coefficients between indicators are quantified to characterize the project performance more effectively.

6. System Dynamic Modeling

The PPP transportation infrastructure operational performance evaluation system is a multi-dimensional complex system. How to characterize the long-term dynamic evolution of the complex system and measure the project future performance is crucial for decision makers. Based on the conceptual model, which was constructed by an improved BSC and verified by SEM, a performance evaluation system dynamics simulation model was constructed to verify the effectiveness of the performance evaluation system and assist the performance management decision making.

6.1. Causality Diagram

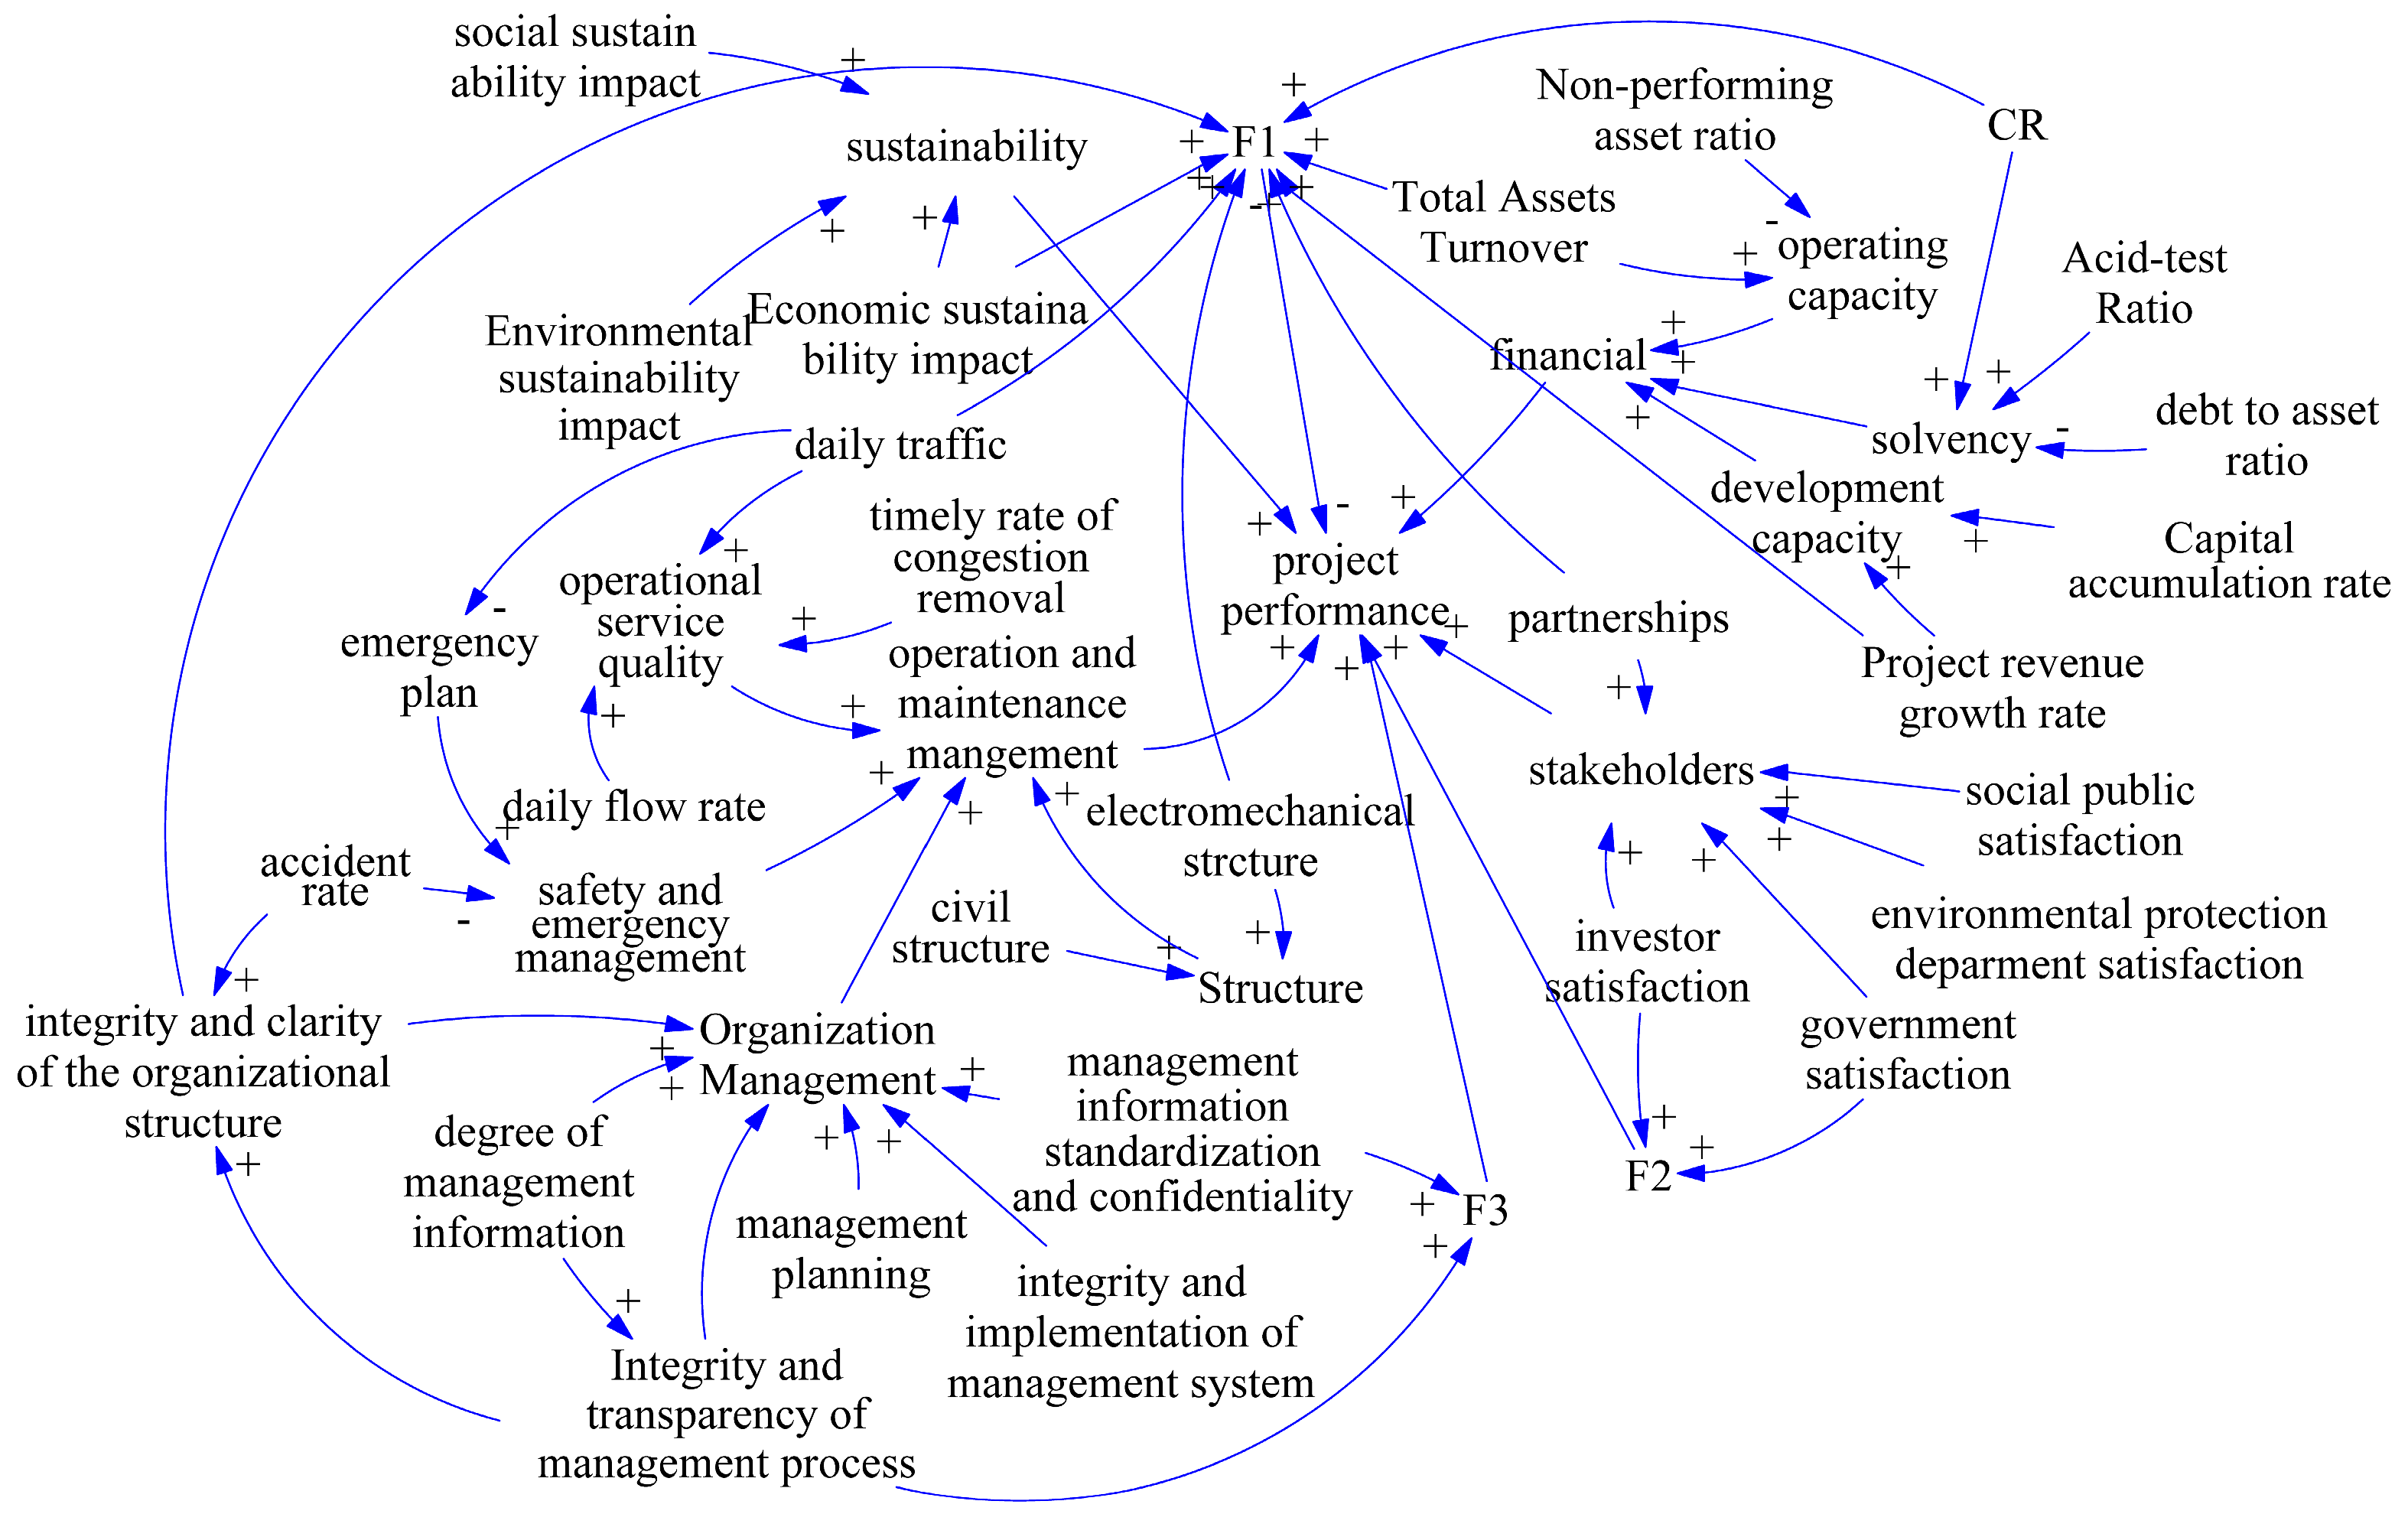
The causal feedback loop analyzes the causal relationship between indicators and their impact on project performance [50,73]. In terms of the operational performance of transportation infrastructure projects, it is generally believed that the current financial level of the project is related to its future economic sustainability [50], and the internal organization and management level of the project indirectly affects the safety of project operations and the effectiveness of project operations [18]. However, this kind of influence relationship is limited to the common-sense understanding of the logical relationship of qualitative indicators, and it is difficult to quantify its influence relationship through the simple quantitative relationship. The application of SEM solves the problem that the qualitative performance evaluation system is difficult to quantify. According to the representational meaning of the explicit variable to the latent variable in SEM, the “debt to asset ratio” increases, the solvency decreases; the “non-performing asset ratio” increases, the operating capacity decreases; and the accident rate increases, and the safety and emergency management capabilities decrease. Other explicit variable indicators all have a positive impact on latent variable indicators. In the exploration of the relationship between latent variables, it builds causal relationships based on the interpretation of key indicators in the system. This is an effective method for qualitative research problems that are difficult in directly quantifying the quantitative relationship between individuals. A causal feedback loop as shown in Figure 4 is built by VENSIM, an arrow with a “+” sign indicates that the increase of a certain variable will lead to an increase in the relevant variable, and the arrows with a “-” sign do the opposite.

6.2. Select System Variables

According to the characteristics of system dynamics model construction, variable types need to be set according to the research question. Among them, horizontal variables are variables that can be accumulated and obtained based on the integration calculation of initial values and rate variables; rate variables describe the change of horizontal variables and respond to the speed of change of the system; auxiliary variables constitute the intermediate part of the system structure analysis and are influenced by constants, stocks, and exogenous functions; and constant variables either do not change or show small fluctuations influenced by the external environment in the study range. In addition to the four dimensions improved in the BSC, according to the ESEM setup, a new regulating subsystem dimension consisting of three covariates is added to represent the structure of the system. The resulting model setup variables are shown in Table 4.

6.3. Build System Flow Diagram

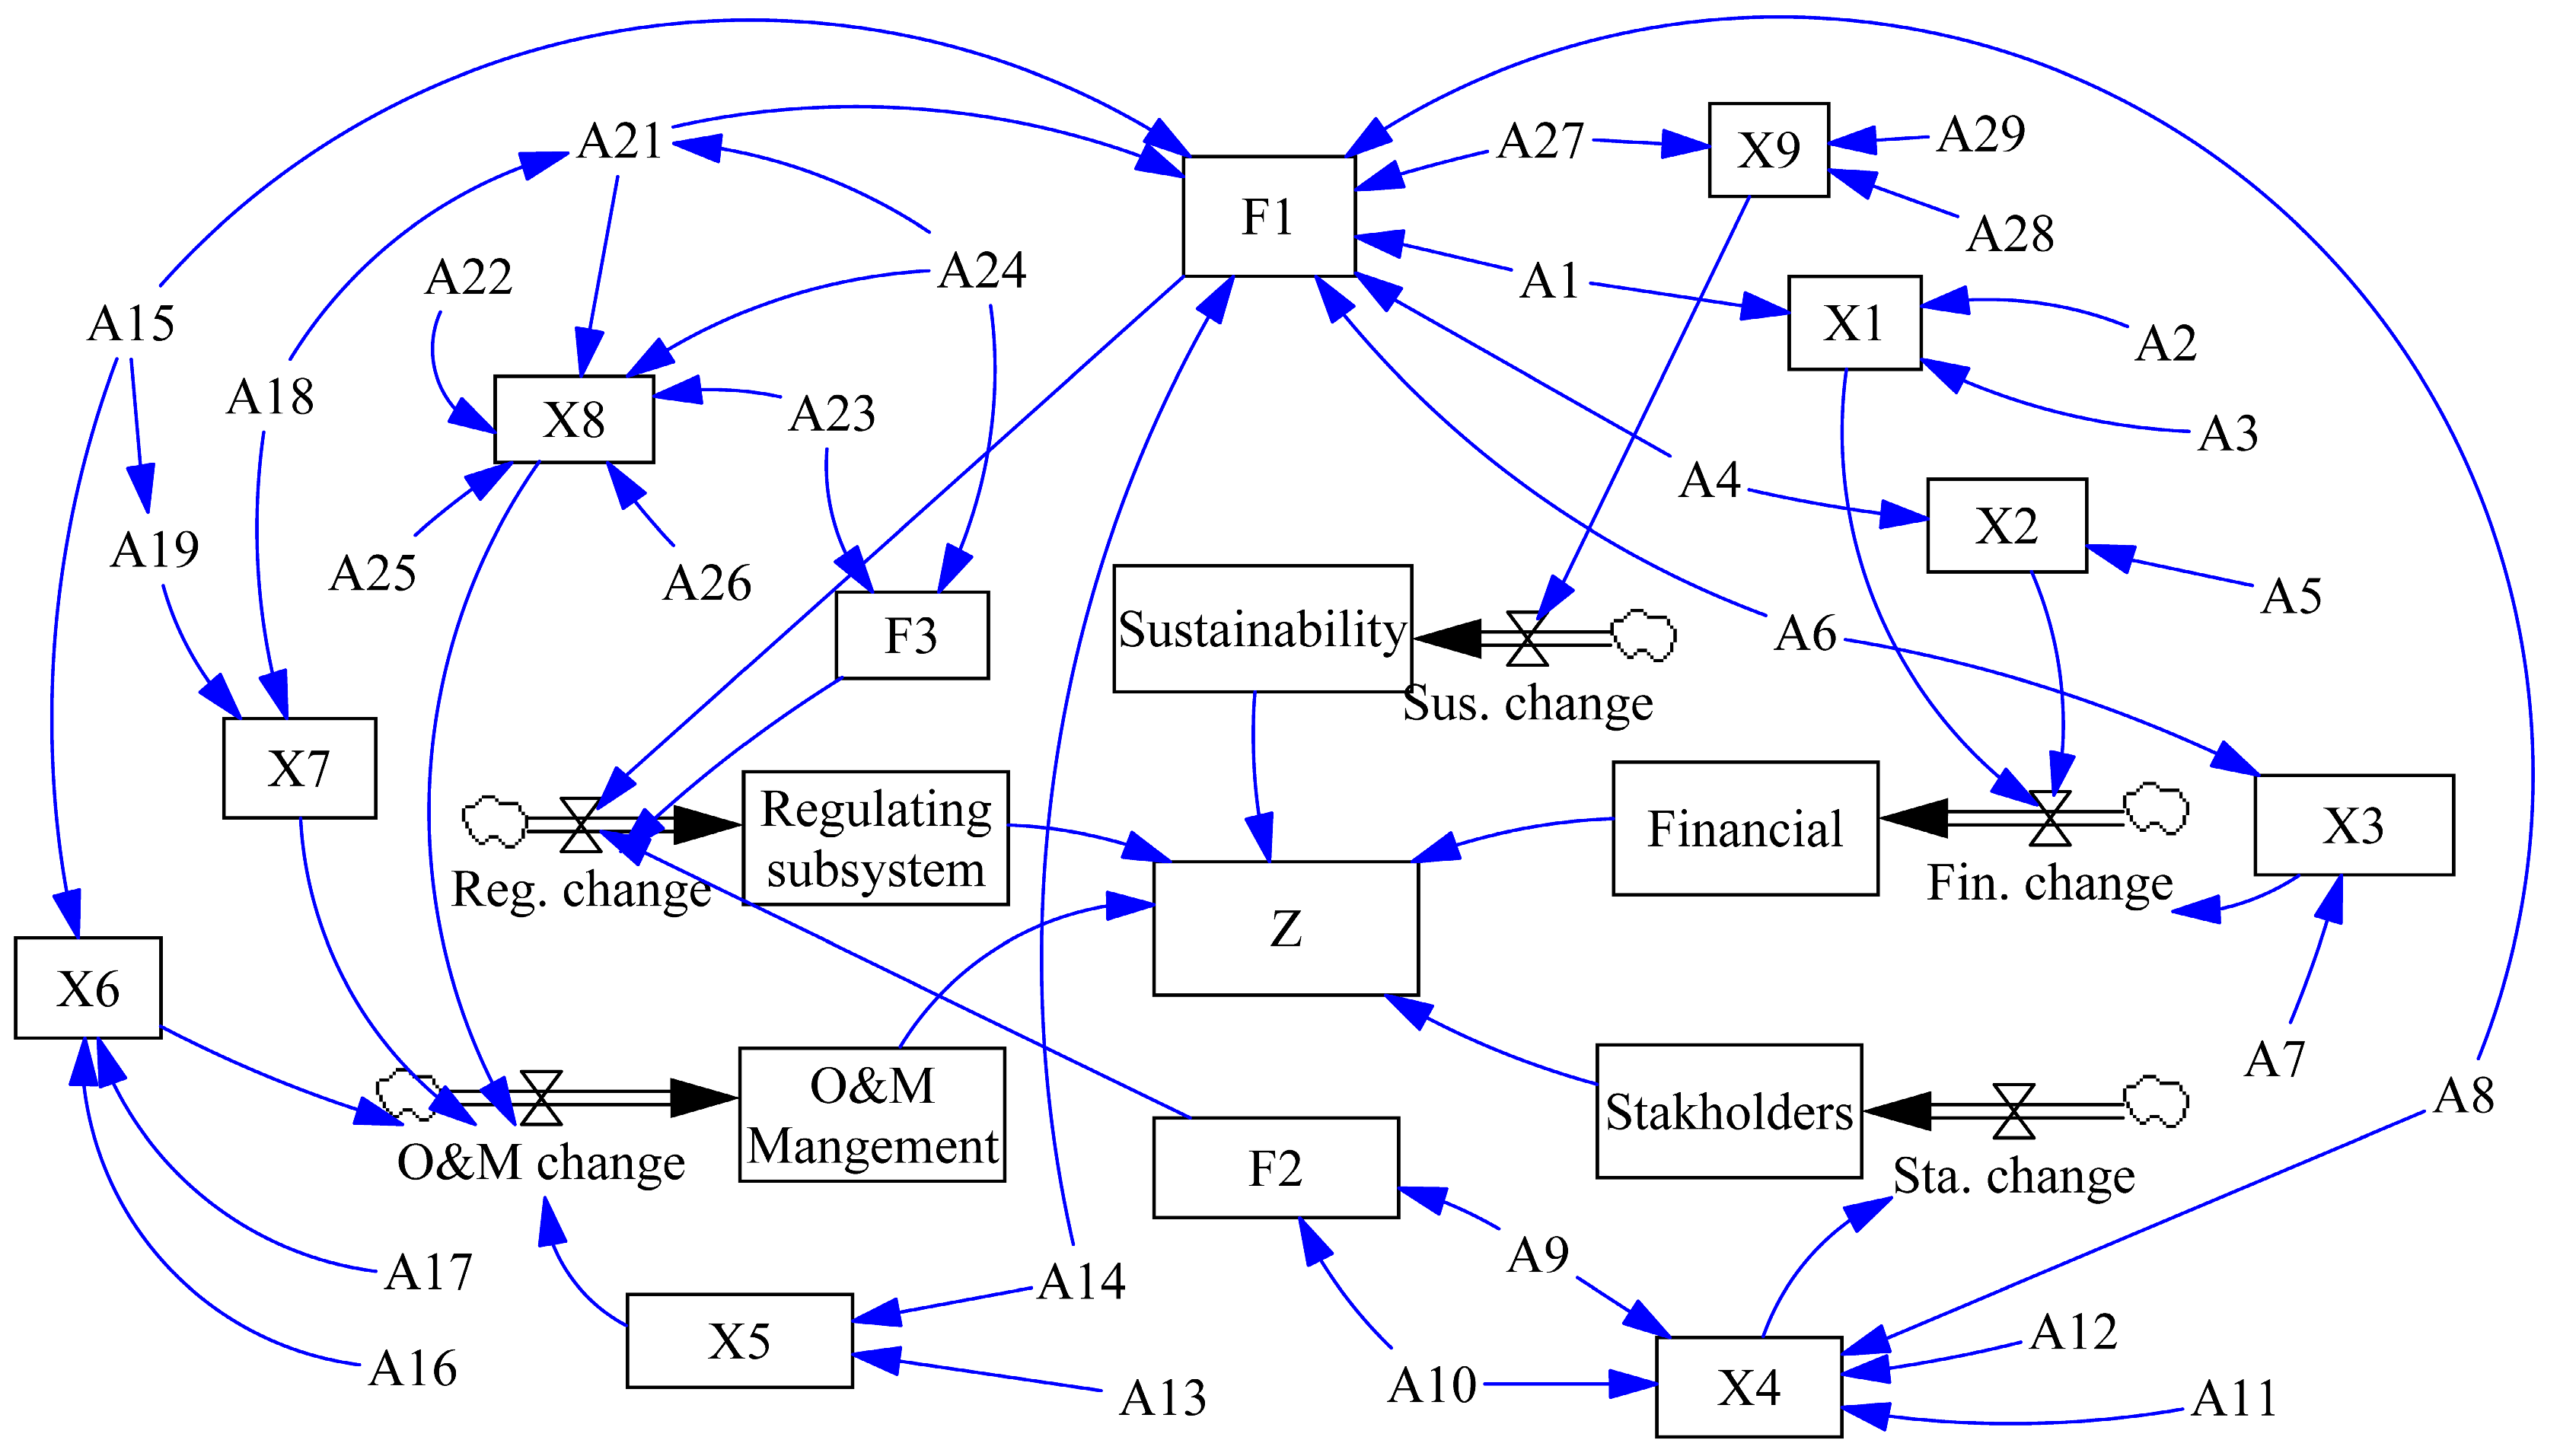
According to the causal relationship analysis and variable type setting, a system flow diagram is constructed, which sets the corresponding equation relationship for the variable to carry out the systematic simulation. The system flow diagram is shown in Figure 5.
Project performance is the accumulation of long-term performance levels within the system. Among them, system performance ( Z ) is characterized by the initial value of performance ( Z 0 ), financial level, stakeholder satisfaction, O&M level, sustainability level, and regulating subsystem, which has a maximum value of 1 (100%), as shown in Formula (1).
Z = Z 0 + F i n a n c i a l + S t a k e h o l d e r s + O & M m a n a g e m e n t + R e g u l a t i n g s u b s y s t e m + S u s t a i n a b i l i t y
The state variable is an integral function, which is the accumulation of its rate of change. Taking the financial level as an example, the formula is shown in (2).
F i n a n c i a l = I N T E G ( F i n . c h a n g e )
The level of change rate is determined by the change of its sub-indicators. For example, the change in financial level is characterized by profitability, solvency, and development ability, as shown in formula (3), and the change in stakeholder satisfaction, operation and maintenance level, sustainability level, and the regulation subsystem is as shown in Equations (4)–(7), where C i   i = 1 , 2 12 is a constant, obtained from the factor loading in ESEM. Δ X j   j = 1 , 2 9 is the cumulative value of performance between the previous and next phases, and the specific formula is shown in (8). Δ F k   k = 1 , 2 , 3 is similar to it.
F i n . c h a n g e = Δ X 1 × C 1 + Δ X 2 × C 2 + Δ X 3 × C 3
S t a . c h a n g e = Δ X 4 × C 4
O M . c h a n g e = Δ X 5 × C 5 + Δ X 6 × C 6 + Δ X 7 × C 7 + Δ X 8 × C 8
S u s . c h a n g e = Δ X 9 × C 9
R e g . c h a n g e = Δ F 1 × C 1 0 + Δ F 2 × C 2 + Δ F 3 × C 12
Δ X j = X ( j , t + 1 ) X ( j , t )
The latent variable index is represented by the observed variable, which consists of the true value of the corresponding observed variable with the loading coefficient in the ESEM. Taking X 1 as an example, its specific formula is shown in (9), where A i   i = 1 , 2 29 is the value of the observed variable and L i   i = 1 , 2 29 is the loading coefficient obtained in the ESEM.
X 1 = A 1 × L 1 + A 2 × L 2 + A 3 × L 3
The variables set as constants are determined according to the actual simulation project, and a certain floating range is set according to the change characteristics of the simulation period. The coefficient value in the formula is determined according to the results of the SEM and combined with the unified standard of the dimensions of the variables.

6.4. Model Validation

Model validation is the process of building confidence in the validity of the model. The verification technology of the SD model comes from Barla’s research [74], who divided the verification process into three stages: structural tests, structure-oriented behavior tests, and behavior pattern tests. This study is also based on these three aspects to verify the effectiveness of the model and discuss the research results of the model.

6.4.1. Structural Verification Result

Direct structural testing includes boundary, structural, parameter, and size confirmation. The boundary adequacy test checks whether the model contains all important variables that affect the research objectives. This research involved four evaluation subsystems established based on existing research and expert surveys. Through empirical analysis and correction, unapproved invalid variables were eliminated, and the boundaries and validity were recognized by experts. The structural confirmation test compares the causal relationship of the model with the relationship existing in the real system. In this study, the relationships between the variables were verified using SEM, and the causal relationship was consistent with the actual system. The parameter confirmation test means the confirmation of the concept and the value corresponding to the real system. Concept validation requires that the parameters of the model correspond to the elements in the real system. Digital confirmation requires that the model parameters are sufficiently accurate. In this study, the concept and value of each performance measurement indicator in the system are derived from the actual project evaluation and meet the requirements of parameter confirmation testing. The dimensional consistency test checks the right and left sides of each equation to obtain dimensional consistency. The test is carried out through the unit check provided by VENSIM, and all equation dimensions are confirmed.

6.4.2. Structure-Oriented Behavior Test Result

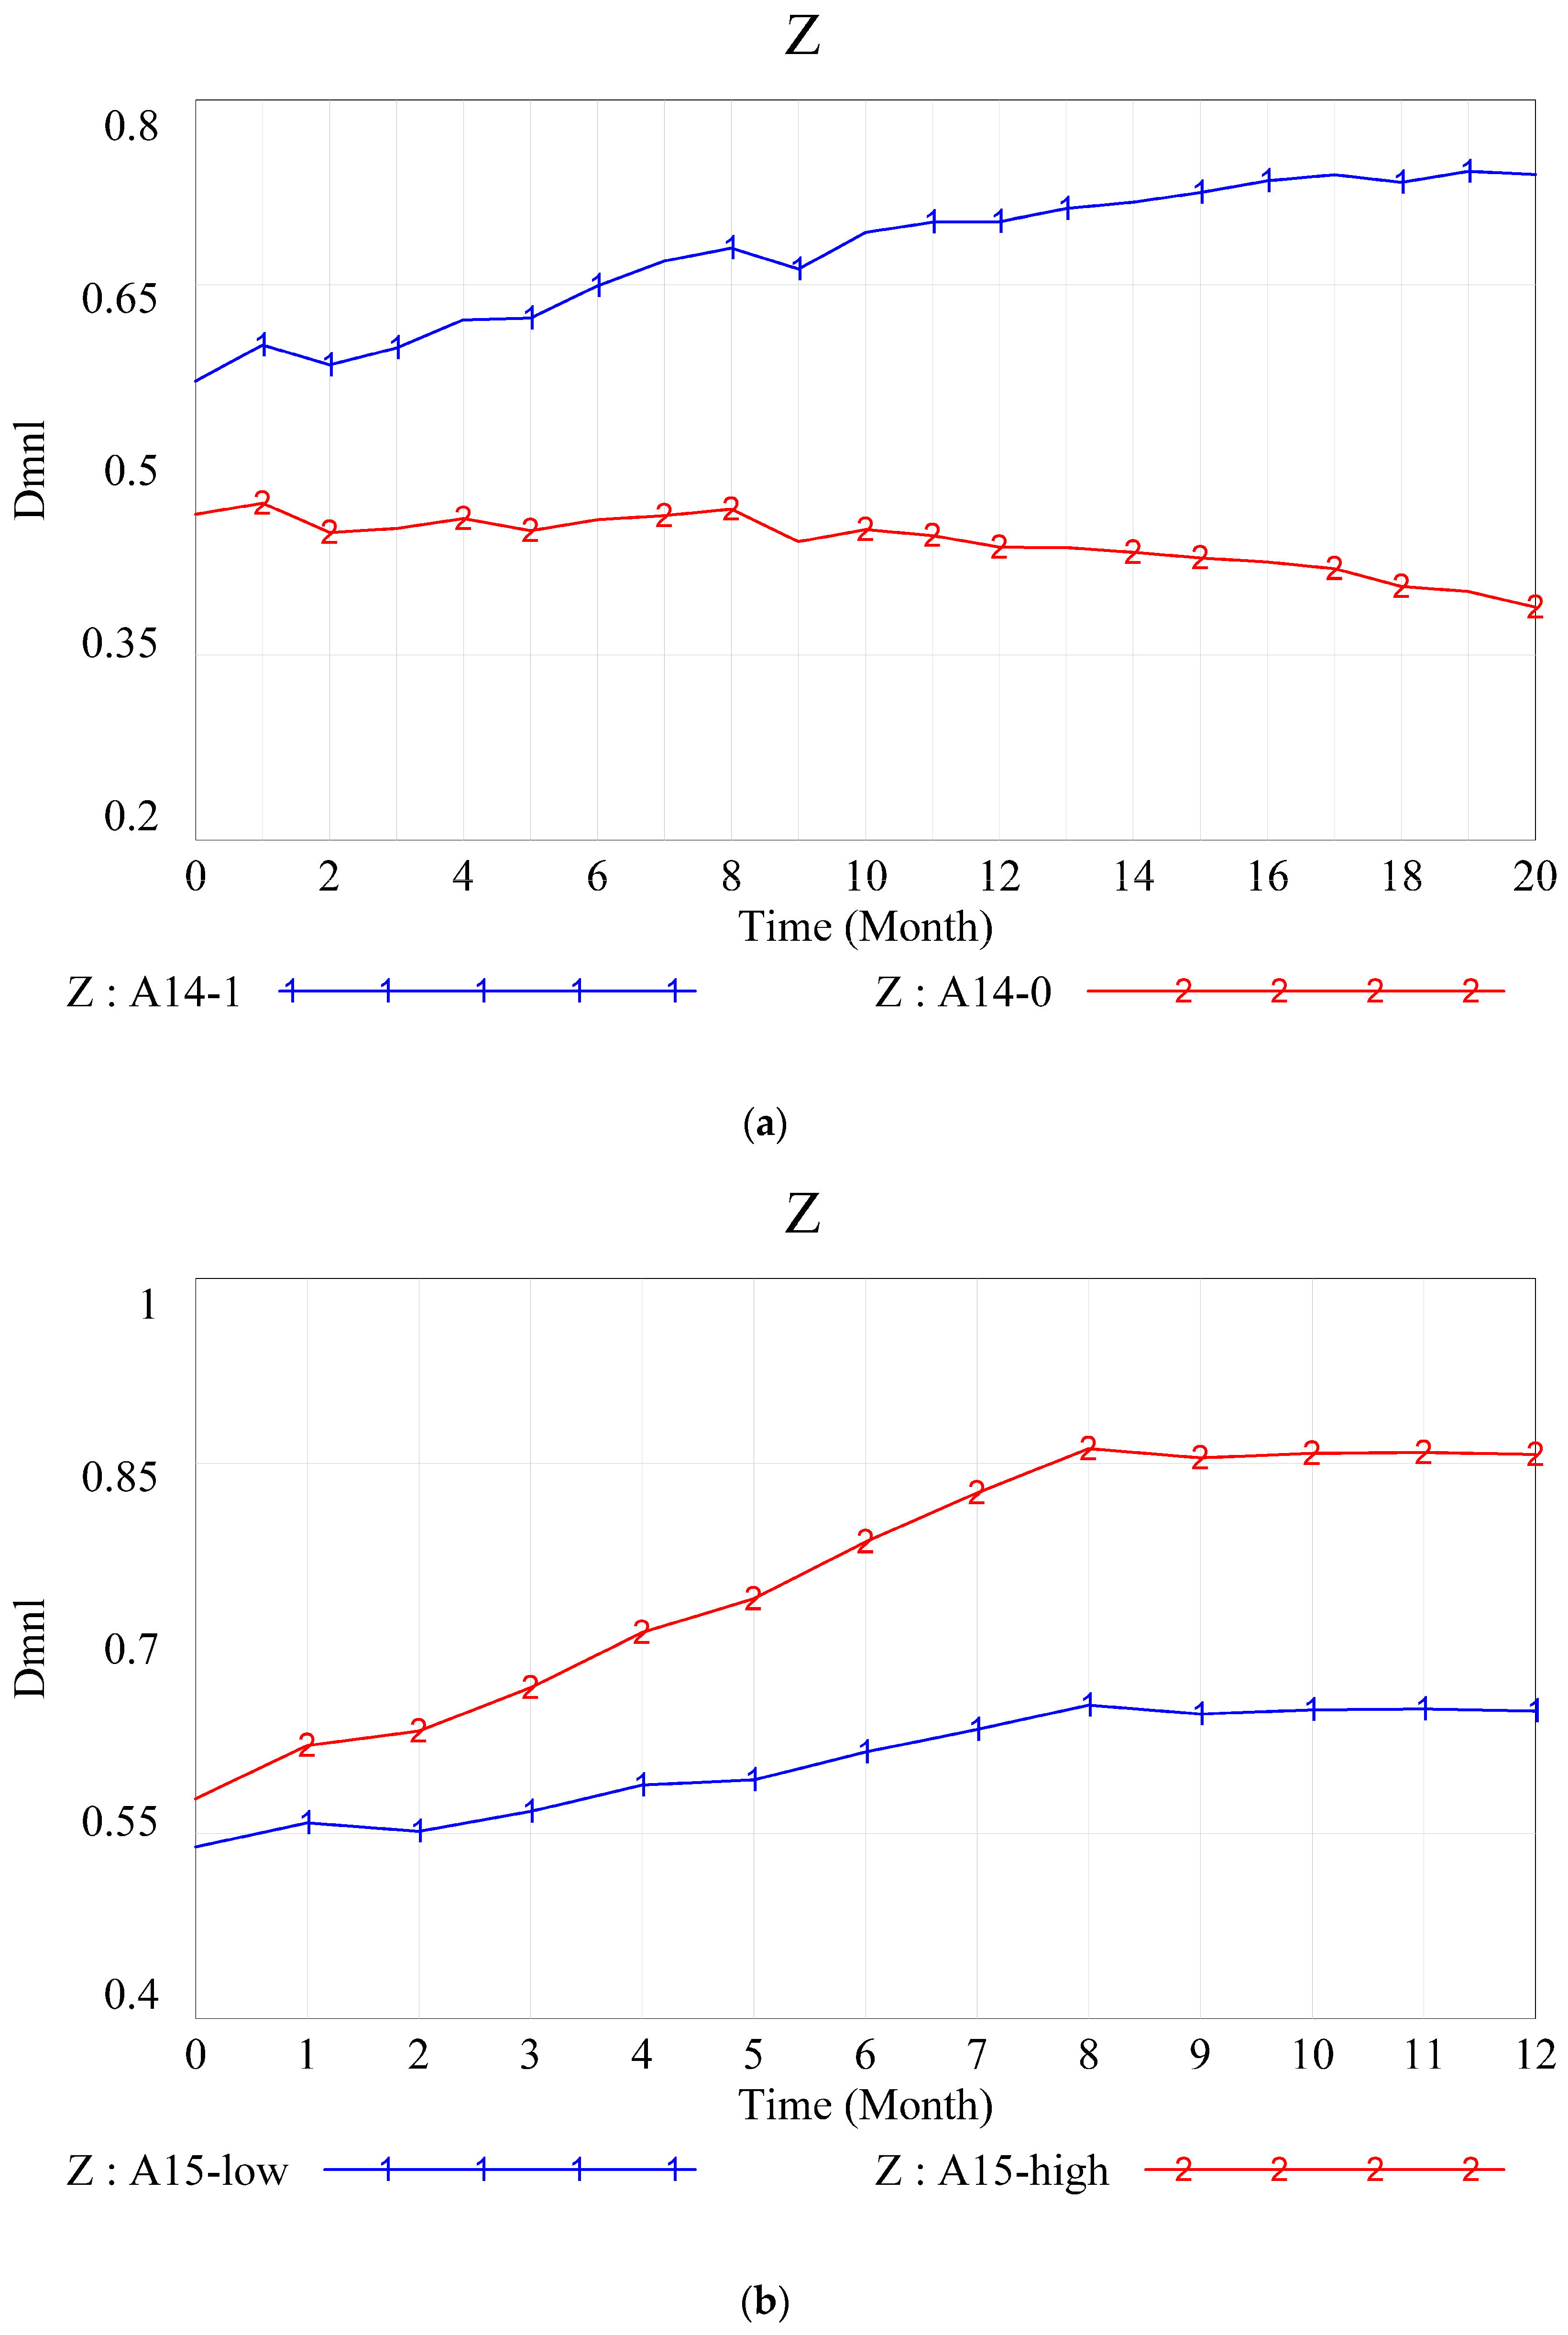
The structure-oriented behavior test is carried out by quantitative analysis. According to the analysis results of the structural equation model, the A14 electromechanical system performance evaluation index that characterizes the structural performance of the facility and the A15 day traffic flow index of the project’s operation status are particularly critical to the overall operational performance of the project, and they were chosen to conduct an extreme condition test. To effectively model the situation of the real system, the study sets a 5% fluctuation range for the index. The project performance is noted when A14 approaches 1 (95%) and approaches 0 (5%) (see as (a) in Figure 6). When the performance of the electromechanical system tends to be perfect, project performance has a trend of improvement. When facilities’ ventilation, drainage, and so on are poor, project performance is also at a poor level, and continues to decline. When A15 is close to saturation and has low flow (see as (b) in Figure 6), and when the daily traffic flow reaches its peak within a reasonable range of facility operation, project performance tends to be better, and under low traffic levels, project performance also stabilizes at a low level.

6.4.3. Behavior Test Result

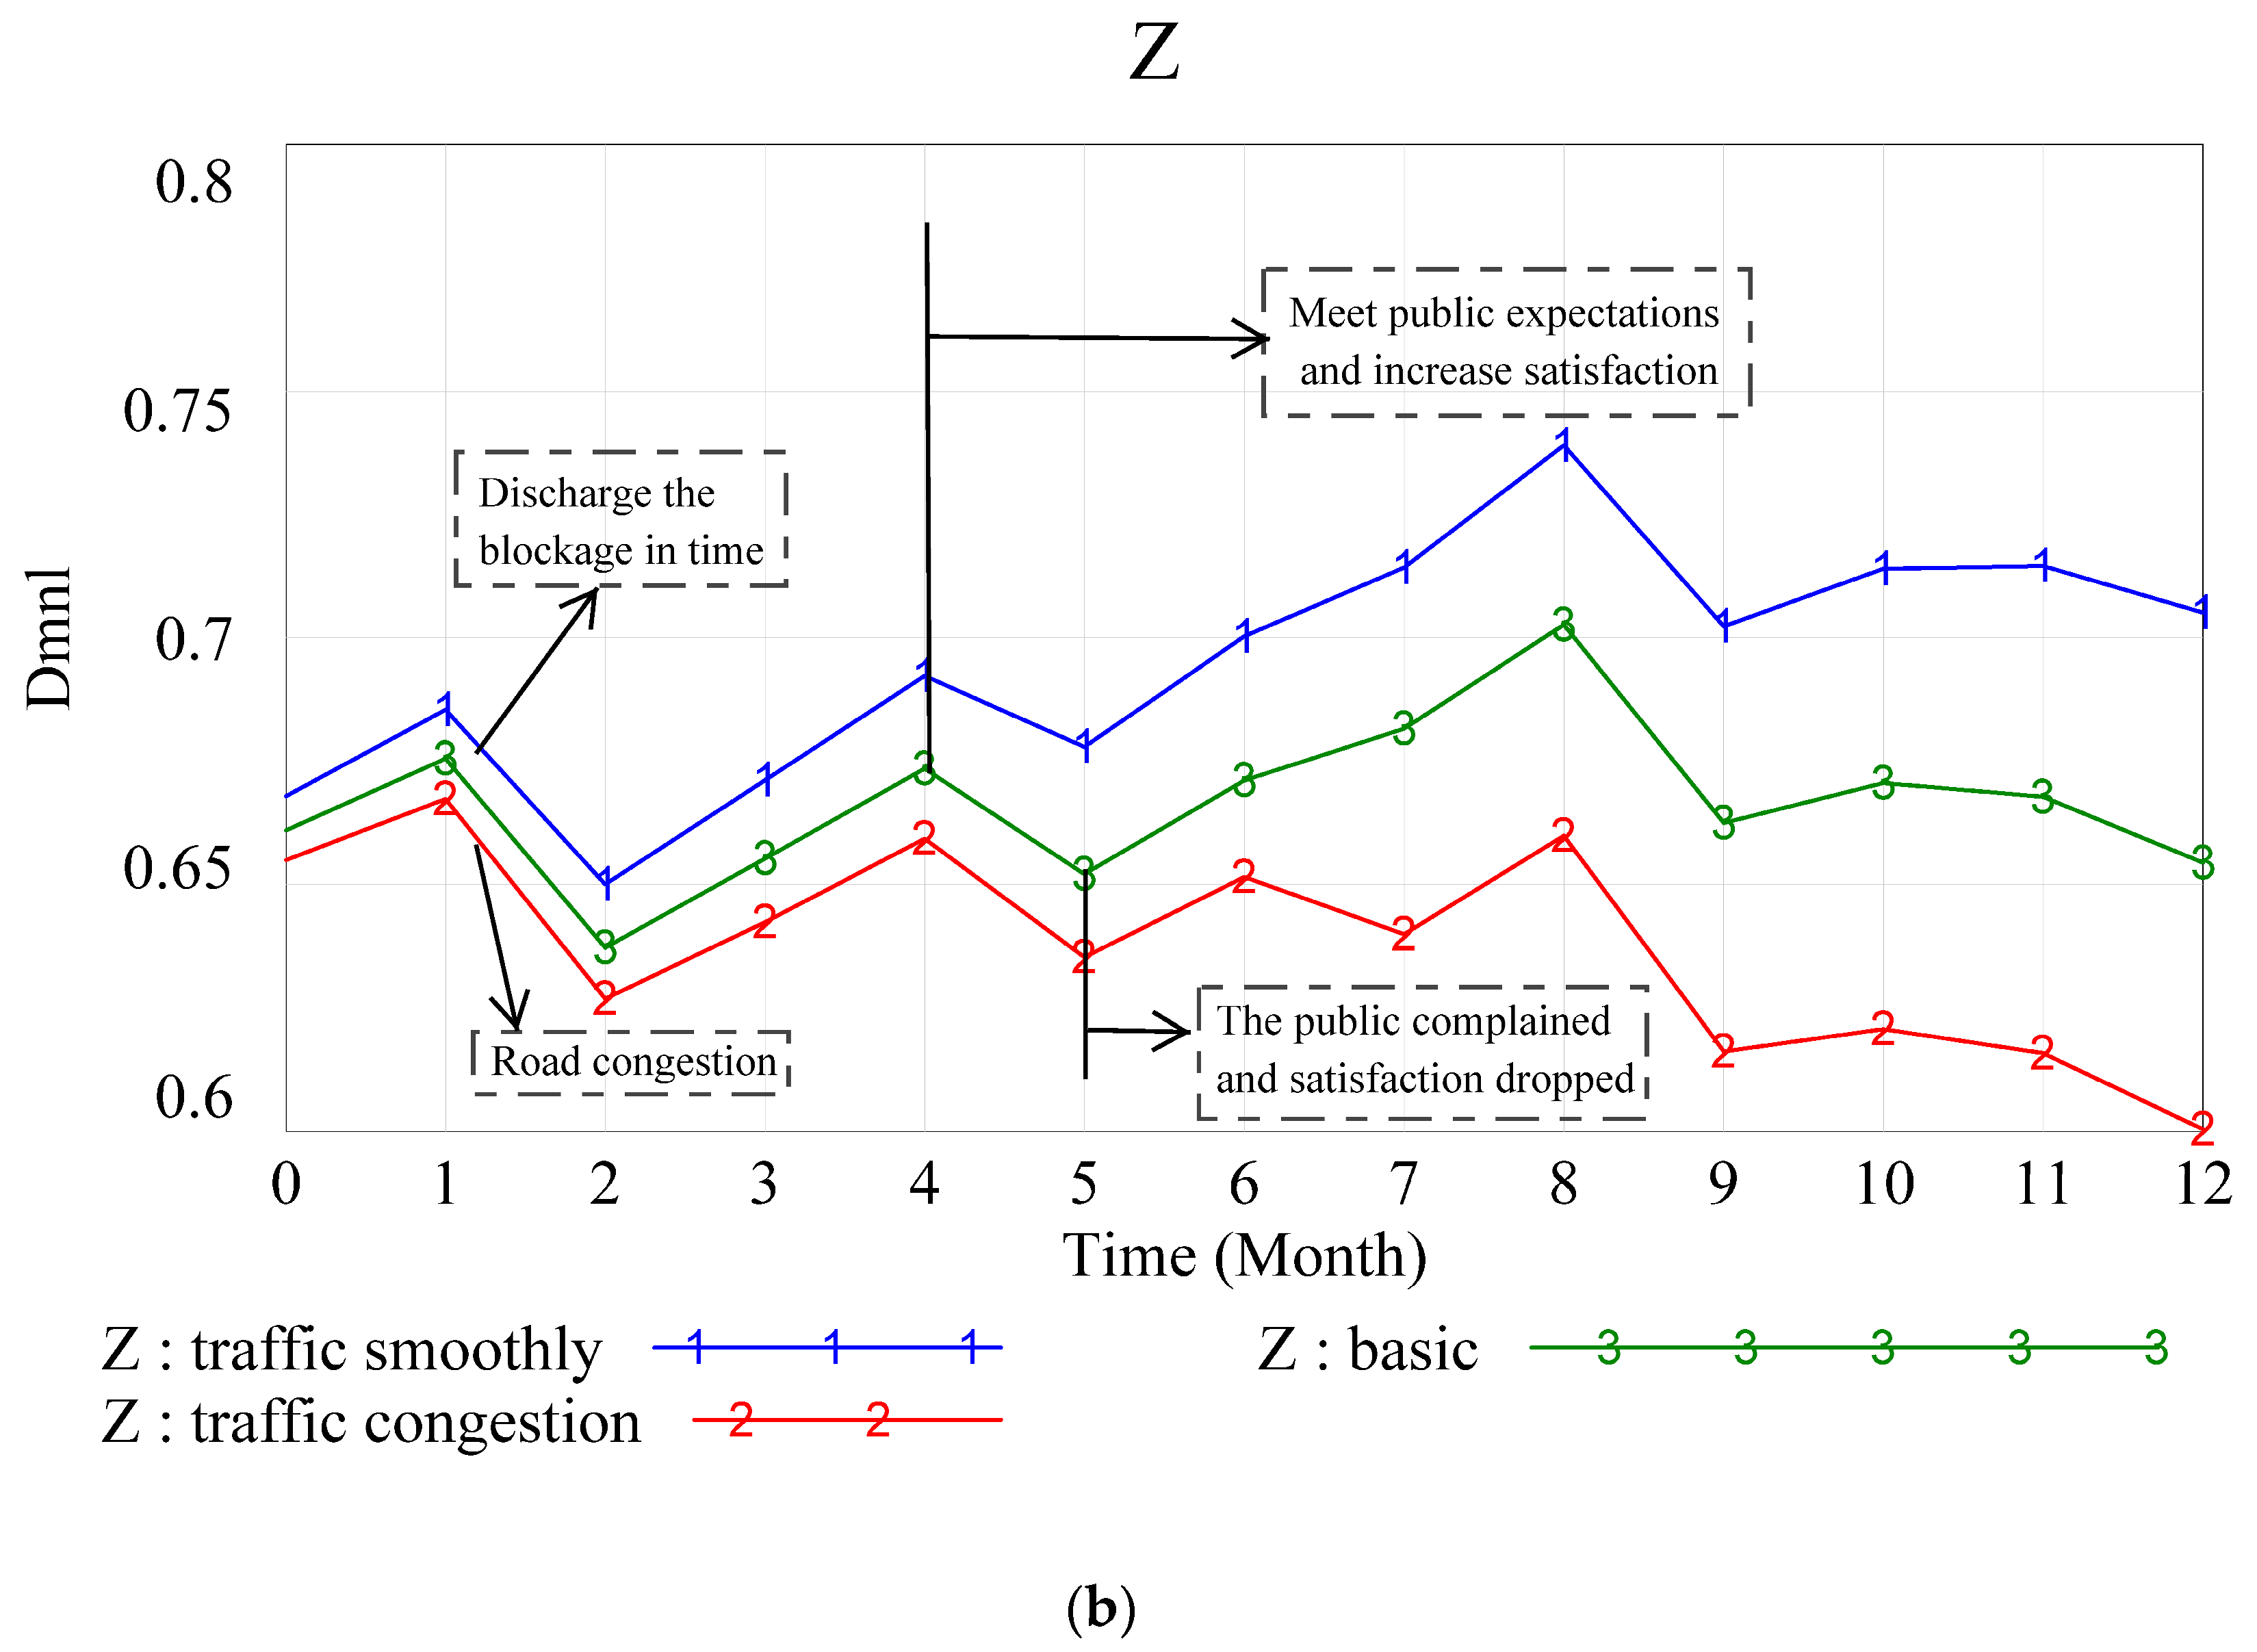
Behavior testing checks the consistency of the model performance and real system behavior. The study tests the behavior of the model from both long-term and short-term perspectives. According to the performance characteristics of indicators in the project, we set a fluctuation range of 0.05. Figure 7a shows the long-term project performance. Infrastructures are asset-heavy projects. In the early stage of operation, the project is high-input and low-output, which also results in a relatively poor system performance level. With the effective development of O&M activities, the project performance accumulates and stabilizes. Figure 7b simulates the project performance under the traffic congestion scenario in the short term. Among them, the “basic” curve represents the basic performance of the project in the growth phase; on this basis, the simulation of traffic congestion shown as the “traffic congestion” curve reduced the “daily flow rate” by 10%, and the overall project performance declined. With time, approximately after the fifth period, it results in a decrease in stakeholder satisfaction, and the decline in project performance increases significantly. On the contrary, the handling of traffic congestion was strengthened at the beginning of the period, the “Timely rate of congestion removal” increased by 10%, and the performance of the project was significantly improved. After about the fourth week, due to the improvement of public travel efficiency, public satisfaction increased, and system performance was also greatly improved. It is found that there is a cross effect between traffic flow change, congestion elimination timeliness, and stakeholder satisfaction. Specifically, the decline in traffic flow will cause stakeholder dissatisfaction and aggravate project performance. The timely implementation of traffic congestion optimization measures can reduce traffic congestion and maintain good operational performance. Kim et al. [24], in a study of PPP infrastructure project life-cycle performance, also mentioned the concern of stakeholders on the quality of the operation.

7. Case Analysis

The research model was applied to the operational Wenyi Road underground tunnel project in Hangzhou, China. This tunnel spans 5.8 km in length and has a speed limit of 80 km/h for traffic. It commenced operation in October 2018. According to statistics from the traffic department, the average daily traffic flow in the tunnel amounts to 32,600 vehicle trips. The tunnel serves as a vital link connecting the eastern and western parts of the city, effectively diverting surface vehicles and generating significant economic and social benefits (exceeding 90% of the expected level). Currently, the project is in its initial operational stage, and the facility operator prioritizes the repair and maintenance of the tunnel structure. The performance of both the civil structure and the electromechanical system scores above 90 out of 100. The operating revenue is also at a high level. However, the tunnel entrance and exit are susceptible to slow traffic flow and occasional congestion during urban peak traffic periods.
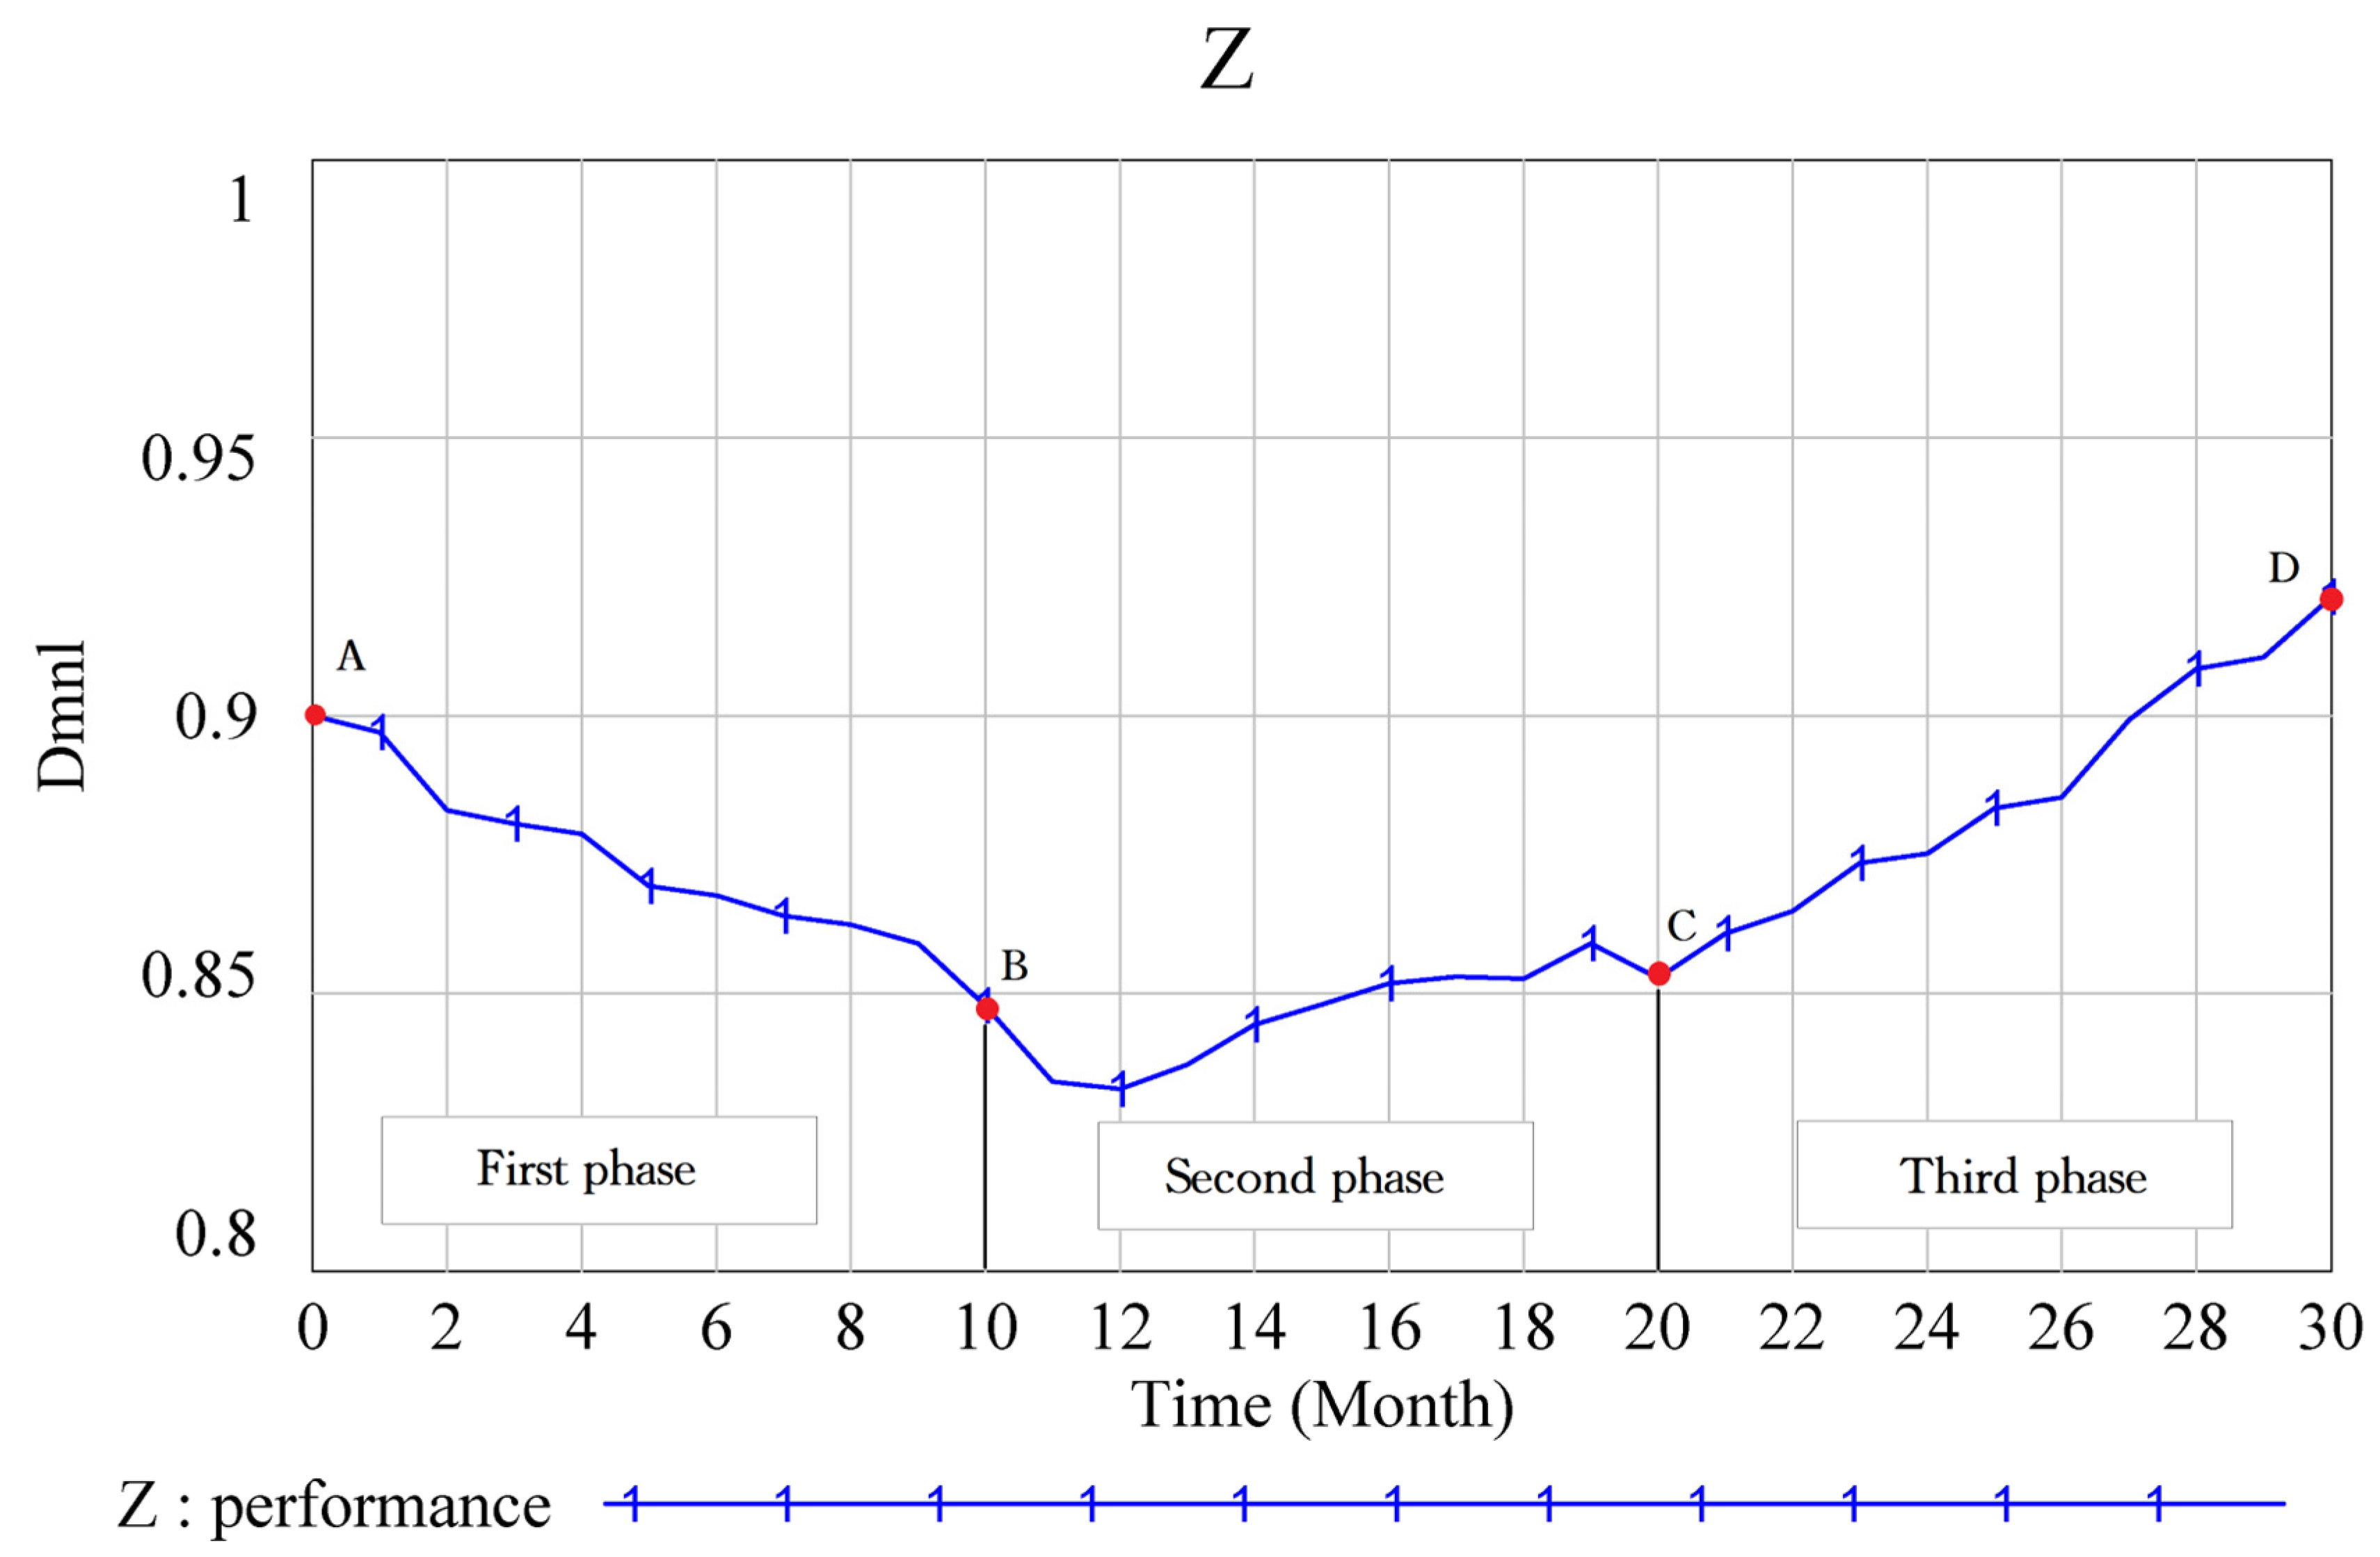
Based on the current context, this study establishes three phases to simulate the effects of different strategy options. In the first stage, no control measures are implemented. Consequently, vehicle movement becomes slow, leading to a decrease in traffic flow level (A15↓), an increase in queue length and queue time, and a decline in road traffic quality (A16↓). Poor traffic flow conditions result in an increased probability of vehicle breakdowns and traffic accidents, leading to a decrease in traffic safety (A18↓). Over time, public satisfaction in society decreases (A11↓), and overall project performance continues to decline, as depicted as point A to point B in Figure 8.
In the second phase, the proposal is to increase investment in rescue materials to enhance the efficiency of road accident management. However, this strategy leads to a decrease in financial indicators such as short-term solvency, asset liquidity, and project revenue growth due to increased financial expenses (A1, A2, A6↓). Although the increased availability of rescue supplies facilitates timely clearance of broken-down vehicles and improves blockage clearance (A17↑), traffic flow, and traffic quality level (A15, A16↑), the overall effectiveness in mitigating underperformance is limited. Point B to point C in Figure 8 illustrates these outcomes.
In the third phase, based on the characteristics of system performance interactions, the study proposes improving the level of informatization in the management process and enhancing the traffic signal guidance function by utilizing real-time traffic flow information for vehicle diversion. This involves enhancing the standardization of information interaction during operations, implementing a closed loop of information interaction in the management system, and improving the integrity and transparency of the management process to enhance the informatization of the operation process. As a result, there is a short-term increase in financial expenses (A1, A2, A6↓). The organizational and management level is improved (A22–A25↑), the efficiency of incident handling and resource allocation is enhanced, blockage clearance capacity is further improved (A17↑), traffic congestion is reduced, and both traffic flow and traffic quality level improve (A15, A16↑). Gradually, the project performance steadily improves as operational benefits begin to accumulate, as shown as point C to point D in Figure 8.
The research findings indicate that there is a causal relationship between the degree of organizational management informatization and the quality of project operation decisions, which indirectly affects project performance. Ming et al. [41] also underscored the significance of maintaining an integrated operation management system and establishing an information sharing platform in their study on evaluating the performance of PPP project operations. They regarded it as a crucial dimension of information management. Within the project operation process, enhancing the level of management informatization facilitates the improvement of the management system, enhances the standardization of management information, and strengthens the closed-loop data management. This, in turn, enables the utilization of data value, enhances the ability for situation prediction and management decision making, optimizes resource management and allocation decisions, and ultimately improves project operation performance.

8. Discussion and Conclusions

Through this research, a dynamic operational performance evaluation system of PPP transportation infrastructure is proposed. The system innovatively integrates four key attributes of finance, stakeholder satisfaction, O&M management, and sustainability to characterize project O&M performance and expands it into nine secondary indicators and twenty-eight tertiary indicators. Three types of causal relationships are verified based on SEM, and a simulation model is developed through the system dynamic approach. This dynamic system can simulate various real-world scenarios to determine the best solution and prevent low-performance situations.

8.1. Managerial Implications

This study introduces a novel approach by integrating structural equation modeling and system dynamics modeling to evaluate the operational performance of PPP transportation infrastructure projects. This hybrid approach surpasses traditional qualitative approaches used in operational performance assessment studies. By considering changes in the parameters of assessment metrics throughout the project’s long-term operation and aligning with the actual project conditions, this approach provides a more accurate representation. The developed model enhances our comprehension of the intricate nature of project performance assessment systems, identifies potential strategies for facility operators to enhance project performance when facing challenges, and evaluates the impact of these changes on project performance. Ultimately, this model can support facility operators in implementing effective PPP project management strategies.
The model employed in this study underwent various validation tests, including structural tests, extreme condition tests, and behavioral tests. The results of these tests were found to be consistent with the existing body of knowledge. For instance, in a study conducted by Kim et al. [24] on the life-cycle performance of PPP infrastructure projects, the importance of stakeholders’ concerns regarding operational quality was emphasized. We also observed complicated effects between operational quality indicators, such as changes in daily traffic flows, congestion elimination rates, and stakeholder satisfaction and project performance. It was evident that prolonged traffic congestion leads to decreased stakeholder satisfaction, thereby exacerbating the decline in project performance. This finding suggests that traffic congestion influences users’ travel choices and their satisfaction feedback, which subsequently impacts the satisfaction levels of investors and government officials regarding project operational performance. Considering the long-term perspective, facility operators must not overlook the significance of maintaining operational quality.
Furthermore, a case study was conducted to validate the performance of the model under various operation management strategies. The findings revealed a causal relationship between the degree of management informatization and the quality of project operations, subsequently influencing project performance indirectly. This was evidenced by the observation that an increase in the degree of management informatization, along with enhanced standardization and timely interactive information, led to improved efficiency in information processing and decision execution. Consequently, this optimization of operation management decisions resulted in enhanced project operation performance. This breakthrough goes beyond the current qualitative research on the impact of the informatization degree on project performance [41]. The developed model provides valuable insights for infrastructure operators to adopt long-term perspectives and make informed management decisions that contribute to the sustainable operation of their facilities.

8.2. Theoretical Contributions

This study contributes to the body of knowledge in three ways. (1) It complements the performance assessment dimensions of the PPP transportation infrastructure operation and maintenance period and its specific indicators, which include four dimensions—financial performance, multi-stakeholder satisfaction, operation and maintenance quality, and sustainability performance dimensions, thus enriching the theoretical system of performance assessment of PPP transportation infrastructure projects during the operation period. (2) It elaborates on the internal structure of the performance assessment system and its influence mechanism, providing a new explanation for the analysis of the system structure. (3) It integrates the dynamic influence relationships of indicators at different levels of different dimensions, carries out dynamic performance characterization of complex project systems, and reveals the dependence of different dimensions of PPP project performance management.

8.3. Limitations and Future Research

There are limitations to our research, and additional work is needed in the future. The first limitation is that our study was derived from a small sample, which is due to the limited number of PPP transport infrastructure projects that are currently in the phase of operation and maintenance and the limited project management knowledge, which makes sample acquisition difficult [20]. Although our sample is sufficient for this study, it is necessary (albeit challenging) to collect more empirical data to further explore the PPP transport infrastructure performance evaluation system. Second, limited by the lack of current project operations data, this study explores the inter-relationship between various performance indicators using empirical data. In the future, as the number of PPP transportation infrastructure projects entering operation increases, it will be necessary to accumulate more project operation data and develop a data-driven performance evaluation system model. Third, our data are based on the practice of PPP transportation infrastructure in China, and these findings may not be consistent with other institutional settings. We hope that this study will motivate scholars to study performance evaluation systems for transportation infrastructure in different theoretical and practical contexts.

Author Contributions

Conceptualization, J.D. and W.W.; methodology, J.D.; software, W.W.; validation, W.W., J.D. and M.H.; formal analysis, X.G.; investigation, W.W.; resources, H.J.; data curation, W.W.; writing—original draft preparation, W.W.; writing—review and editing, J.D., X.G. and M.H.; visualization, W.W.; supervision, X.G. and M.H.; project administration, J.D.; funding acquisition, J.D. All authors have read and agreed to the published version of the manuscript.

Funding

This work is funded by National Natural Science Foundation of China (Grant numbers: 71701121), the Science and Technology Commission of Shanghai Municipality Project (Grant numbers: 20DZ2251900 and 21ZR1423800) and Shanghai Municipal Transportation Committee (Grant numbers: JT2021-KY-013).

Institutional Review Board Statement

Not applicable.

Informed Consent Statement

Not applicable.

Data Availability Statement

The data presented in this study are available on request from the corresponding author. The data are not publicly available as they relate to the privacy of the survey respondents and are part of ongoing research.

Conflicts of Interest

The authors declare no conflict of interest.

References

  1. Wang, S.; Pang, M.; Wang, Y. Establishment of PPP Body of Knowledge in China. In Annual Report on the Development of PPP in China; Wang, T., Han, Z., Yang, Y., Wang, S., Li, K., Eds.; Springer: Singapore, 2020; pp. 25–48. [Google Scholar]
  2. Chan, A.P.C.; Lam, P.T.I.; Chan, D.W.M.; Cheung, E.; Ke, Y. Critical success factors for PPPs in infrastructure developments: Chinese perspective. J. Constr. Eng. Manag. 2010, 136, 484–494. [Google Scholar] [CrossRef]
  3. China Public Private Partnerships Center. Available online: https://www.cpppc.org/ (accessed on 3 May 2023).
  4. Sanger, M. Supporting the balanced scorecard. Work Study 1998, 47, 197–200. [Google Scholar] [CrossRef]
  5. Glendinning, R. The concept of value for money. Int. J. Public Sect. Manag. 1988, 1, 42–50. [Google Scholar] [CrossRef]
  6. Liang, Q.; Hu, H. Uncertainty analysis of value for money assessment for public-private partnership projects. J. Shanghai Jiaotong Univ. 2017, 22, 672–681. [Google Scholar] [CrossRef]
  7. Wibowo, A.; Sundermeier, M. Developing a fuzzy value-for-money analysis model for annuity-based public-private partnership infrastructure projects under consideration of risk mitigation capability. J. Constr. Eng. Manag. 2020, 146, 04020081. [Google Scholar] [CrossRef]
  8. Amos, D.; Musa, Z.N.; Au-Yong, C.P. A review of facilities management performance measurement. Prop. Manag. 2019, 37, 490–511. [Google Scholar] [CrossRef]
  9. Kagioglou, M.; Cooper, R.; Aouad, G. Performance management in construction: A conceptual framework. Constr. Manag. Econ. 2001, 19, 85–95. [Google Scholar] [CrossRef]
  10. Liu, J.; Love PE, D.; Smith, J.; Regan, M.; Palaneeswaran, E. Review of performance measurement: Implications for public–private partnerships. Built Environ. Proj. Asset Manag. 2015, 5, 35–51. [Google Scholar] [CrossRef]
  11. Kober, R.; Northcott, D. Testing cause-and-effect relationships within a balanced scorecard. Account. Financ. 2021, 61, 1815–1849. [Google Scholar] [CrossRef]
  12. Ecem Yildiz, A.; Dikmen, I.; Talat Birgonul, M. Using system dynamics for strategic performance management in construction. J. Manag. Eng. 2020, 36, 04019051. [Google Scholar] [CrossRef]
  13. Othman, R. Enhancing the effectiveness of the balanced scorecard with scenario planning. Int. J. Product. Perform. Manag. 2008, 57, 259–266. [Google Scholar] [CrossRef]
  14. Mladenovic, G.; Vajdic, N.; Wündsch, B.; Temeljotov-Salaj, A. Use of key performance indicators for PPP transport projects to meet stakeholders’ performance objectives. Built Environ. Proj. Asset Manag. 2013, 3, 228–249. [Google Scholar] [CrossRef]
  15. Liang, Y.; Wang, H. Sustainable performance measurements for public–private partnership projects: Empirical evidence from China. Sustainability 2019, 11, 3653. [Google Scholar] [CrossRef]
  16. Rahman, H.Z.; Miraj, P.; Andreas, A. Exploring public–private partnership scheme in operation and maintenance stage of railway project. Sustainability 2019, 11, 6517. [Google Scholar] [CrossRef]
  17. South, A.; Eriksson, K.; Levitt, R. How infrastructure public–private partnership projects change over project development phases. Proj. Manag. J. 2018, 49, 62–80. [Google Scholar] [CrossRef]
  18. Xu, Z.; Wang, X.; Xiao, Y.; Yuan, J. Modeling and performance evaluation of PPP projects utilizing IFC extension and enhanced matter-element method. Eng. Constr. Archit. Manag. 2020, 27, 1763–1794. [Google Scholar] [CrossRef]
  19. Cheng, Z.; Wang, H.; Xiong, W.; Zhu, D.; Cheng, L. Public–private partnership as a driver of sustainable development: Toward a conceptual framework of sustainability-oriented PPP. Environ. Dev. Sustain. 2021, 23, 1043–1063. [Google Scholar] [CrossRef]
  20. Liu, C.; Guo, X.; Men, R. Performance Evaluation of Urban Rail Transit PPP Mode Project; Springer: Cham, Switzerland, 2021; pp. 399–412. [Google Scholar]
  21. Hajarolasvadi, H.; Shahhosseini, V. A system-dynamic model for evaluating the effect of person-team fit on project performance. J. Constr. Eng. Manag. 2022, 148, 04022126. [Google Scholar] [CrossRef]
  22. Faturechi, R.; Miller-Hooks, E. Measuring the performance of transportation infrastructure systems in disasters: A comprehensive review. J. Infrastruct. Syst. 2015, 21, 04014025. [Google Scholar] [CrossRef]
  23. Wang, D.; Wang, X.; Wang, L.; Liu, H.J.; Jia, X. A performance measurement system for public–private partnerships: Integrating stakeholder influence and process trans-period effect. Int. J. Product. Perform. Manag. 2021, 72, 137–155. [Google Scholar] [CrossRef]
  24. Kim, S.Y.; Thuc, L.D. Life cycle performance measurement in public-private partnership infrastructure projects. J. Infrastruct. Syst. 2021, 27, 06021001. [Google Scholar] [CrossRef]
  25. Zhu, J.; Chen, M.; Lei, Q. Study on Evaluation Method of the Total Asset Value of National and Provincial Highway Infrastructure. In Proceedings of the International Conference on Construction and Real Estate Management, Stockholm, Sweden, 24–25 August 2020; pp. 793–803. [Google Scholar]
  26. Tan, R.P.; Pan, L.L.; Xu, M.M.; He, X.J. Transportation infrastructure, economic agglomeration and non-linearities of green total factor productivity growth in China: Evidence from partially linear functional coefficient model. Transp. Policy 2022, 129, 1–13. [Google Scholar] [CrossRef]
  27. Shepherd, S.P. A review of system dynamics models applied in transportation. Transp. B Transp. Dyn. 2014, 2, 83–105. [Google Scholar] [CrossRef]
  28. Lop, N.S.; Ismail, K.; Isa, H.M. A conceptual framework of performance measurement tool for private finance initiative projects in Malaysia. J. Build. Perform. 2018, 9, 1–12. [Google Scholar]
  29. Gorman, M.F. Evaluating the public investment mix in US freight transportation infrastructure. Transp. Res. Part A Policy Pract. 2008, 42, 1–14. [Google Scholar] [CrossRef]
  30. Lee, J.I.; Lee, H.-S.; Park, M. Contractor liquidity evaluation model for successful public housing projects. J. Constr. Eng. Manag. 2018, 144, 04018109. [Google Scholar] [CrossRef]
  31. Belikova, D.D.; Safiullin, R.N. The design and evaluation of a telematic automated system of weight control for heavy vehicles. Infrastructures 2022, 7, 86. [Google Scholar] [CrossRef]
  32. Ozbek, M.E.; de la Garza, J.M.; Triantis, K. Data and modeling issues faced during the efficiency measurement of road maintenance using data envelopment analysis. J. Infrastruct. Syst. 2010, 16, 21–30. [Google Scholar] [CrossRef]
  33. Makovšek, D.; Moszoro, M. Risk pricing inefficiency in public–private partnerships. Transp. Rev. 2018, 38, 298–321. [Google Scholar] [CrossRef]
  34. Hu, X.; Han, J. Highway project value of money assessment under PPP mode and its application. J. Adv. Transp. 2018, 2018, 1802671. [Google Scholar] [CrossRef]
  35. Zhao, J.; Liu Henry, J.; Sing Michael, C.P.; Jin, X.; Ginige, K. Delivery of transport infrastructure assets: Decision-making model to ensure value for money. J. Infrastruct. Syst. 2021, 27, 05020008. [Google Scholar] [CrossRef]
  36. Kaplan, R.S.; Norton, D.P. Putting the balanced scorecard to work. Econ. Impact Knowl. 1998, 71, 315–324. [Google Scholar]
  37. Eom Creed, S.; Yun Seok, H.; Paek Joon, H. Subcontractor evaluation and management framework for strategic partnering. J. Constr. Eng. Manag. 2008, 134, 842–851. [Google Scholar] [CrossRef]
  38. Jin, Z.; Deng, F.; Li, H.; Skitmore, M. Practical framework for measuring performance of international construction firms. J. Constr. Eng. Manag. 2013, 139, 1154–1167. [Google Scholar] [CrossRef]
  39. Sirin, O.; Gunduz, M.; Moussa, A. Application of tools of quality function deployment and modified balanced scorecard for optimal allocation of pavement management resources. IEEE Access 2020, 8, 76399–76410. [Google Scholar] [CrossRef]
  40. Liu, J.; Guo, Y.; Martek, I.; Chen, C.; Tian, J. A phase-oriented evaluation framework for China’s PPP projects. Eng. Constr. Archit. Manag. 2022, 29, 3737–3753. [Google Scholar] [CrossRef]
  41. Ming, Z.; Hu, Y.; Zheng, M. The Performance Evaluation of Expressway PPP Project during Operation Period Based on RF. In Proceedings of the ICCREM 2021: Challenges of the Construction Industry under the Pandemic, Beijing, China, 16–17 October 2021; pp. 917–924. [Google Scholar]
  42. Mohamad, R.; Ismail, S.; Mohd Said, J. Performance indicators for public private partnership (PPP) projects in Malaysia. J. Econ. Adm. Sci. 2018, 34, 137–152. [Google Scholar] [CrossRef]
  43. Hossain, M.; Guest, R.; Smith, C. Performance indicators of public private partnership in Bangladesh. Int. J. Product. Perform. Manag. 2019, 68, 46–68. [Google Scholar] [CrossRef]
  44. Samee, K.; Pongpeng, J. Structural equation model for construction equipment management affecting project and corporate performance. KSCE J. Civ. Eng. 2016, 20, 1642–1656. [Google Scholar] [CrossRef]
  45. Chen Yong, Q.; Zhang Yang, B.; Liu Jun, Y.; Mo, P. Interrelationships among critical success factors of construction projects based on the structural equation model. J. Manag. Eng. 2012, 28, 243–251. [Google Scholar] [CrossRef]
  46. Yuan, J.; Li, W.; Zheng, X.; Skibniewski Mirosław, J. Improving operation performance of public rental housing delivery by PPPs in China. J. Manag. Eng. 2018, 34, 04018015. [Google Scholar] [CrossRef]
  47. Leon, H.; Osman, H.; Georgy, M.; Elsaid, M. System dynamics approach for forecasting performance of construction projects. J. Manag. Eng. 2018, 34, 04017049. [Google Scholar] [CrossRef]
  48. Fitch Gregory, J.; Odeh, I.; Kautz, F.; Ibbs, C.W. System dynamics models for the valuation of real options in p3 concession project agreements. J. Infrastruct. Syst. 2018, 24, 04017047. [Google Scholar] [CrossRef]
  49. Rostamnezhad, M.; Nasirzadeh, F.; Khanzadi, M.; Jarban, M.J.; Ghayoumian, M. Modeling social sustainability in construction projects by integrating system dynamics and fuzzy-dematel method: A case study of highway project. Eng. Constr. Archit. Manag. 2020, 27, 1595–1618. [Google Scholar] [CrossRef]
  50. Pagoni, E.G.; Patroklos, G. A system dynamics model for the assessment of national public–private partnership programmes’ sustainable performance. Simul. Model. Pract. Theory 2019, 97, 101949. [Google Scholar] [CrossRef]
  51. Liu, B.; Wang, X.; Cao, L. Simulation study on dynamic formation mechanism about competitiveness of China’s construction industry based on the combination of SEM and SD. Syst. Eng. Theory Pract. 2010, 11, 2063–2070. [Google Scholar]
  52. Wang, C.; Zou, F.; Yap JB, H.; Wood, L.C.; Li, H.; Ding, L. System dynamics tool for entropy-based risk control on sleeve grouting in prefabricated buildings. Eng. Constr. Archit. Manag. 2022. [Google Scholar] [CrossRef]
  53. Kassem, M.A.; Khoiry, M.A.; Hamzah, N. Assessment of the effect of external risk factors on the success of an oil and gas construction project. Eng. Constr. Archit. Manag. 2020, 27, 2767–2793. [Google Scholar] [CrossRef]
  54. Narayanan, A. A review of eight software packages for structural equation modeling. Am. Stat. 2012, 66, 129–138. [Google Scholar] [CrossRef]
  55. Badamasi, A.A.; Aryal, K.R.; Makarfi, U.U.; Dodo, M. Drivers and barriers of virtual reality adoption in UK AEC industry. Eng. Constr. Archit. Manag. 2022, 29, 1307–1318. [Google Scholar] [CrossRef]
  56. Xu, B.; Yu, H. Study to the Performance Evaluation of Construction Enterprise Project Management Based on the Bsc. In Proceedings of the 2008 International Conference on Information Management, Innovation Management and Industrial Engineering, Taipei, Taiwan, 19–21 December 2008; pp. 242–246. [Google Scholar]
  57. Sánchez-Silva, M.; Frangopol Dan, M.; Padgett, J.; Soliman, M. Maintenance and operation of infrastructure systems: Review. J. Struct. Eng. 2016, 142, F4016004. [Google Scholar] [CrossRef]
  58. Hou, W.; Wang, L. Research on Financial Early Warning of PPP Projects from Refinancing Perspective. In Proceedings of the nternational Conference on Construction and Real Estate Management, Banff, AB, Canada, 21–24 May 2019; pp. 306–313. [Google Scholar]
  59. Mony, S.; Ramachandran, N. Impact of Management Control Systems on Sponsors’ Profitability in PPP Infrastructure Ventures. In Financial Issues in Emerging Economies: Special Issue Including Selected Papers from II International Conference on Economics and Finance, 2019, Bengaluru, India; Biswas, R., Michaelides, M., Eds.; Research in Finance 36; Emerald Publishing Ltd.: Bradford, UK, 2020; pp. 123–143. [Google Scholar]
  60. Kim, J.-M.; Kim, T.; Ahn, S. Loss assessment for sustainable industrial infrastructure: Focusing on bridge construction and financial losses. Sustainability 2020, 12, 5316. [Google Scholar] [CrossRef]
  61. Zhang, H.; Wang, B. Dynamic Research on Stakeholders of the Utility Tunnel PPP Project. In Proceedings of the ICCREM International Conference on Construction and Real Estate Management, Charleston, SC, USA, 9–10 August 2018; pp. 114–120. [Google Scholar]
  62. Hua, J.; Zhang, R.; Gu, J. Three-Dimensional Comprehensive Analysis of Transportation Network Operation Conditions. In Proceedings of the 19th COTA International Conference of Transportation Professionals, Nanjing, China, 6–8 July 2019; pp. 3286–3296. [Google Scholar]
  63. Zhou, B.; Wang, C.; Liu, F.; Wang, E. Whole risk assessment system and management system of urban road tunnel operation stage. J. Highw. Transp. Res. Dev. 2020, 14, 94–101. [Google Scholar] [CrossRef]
  64. Jovanovic, S.; Bozovic, D. Optimal structure and two case study implementations of a railway maintenance management system. J. Manag. Eng. 2015, 31, 05014013. [Google Scholar] [CrossRef]
  65. Quelhas Adriane, D.; Filho José Rodrigues, F.; Neto Julio, V.; Pereira, V. Model to measure adherence of culture, climate, and organizational behavior in a construction company. J. Manag. Eng. 2019, 35, 05019003. [Google Scholar] [CrossRef]
  66. Shi, K.; Feng, P.; Liu, Z.; Wang, N. Design and Application Research on Information Management System of Intelligent Maintenance Equipment in Urban Rail Transit. In Proceedings of the 20th COTA International Conference of Transportation Professionals, Xi’an, China, 16–19 December 2021; pp. 535–543. [Google Scholar]
  67. Schmitt, N. Uses and abuses of coefficient alpha. Psychol. Assess. 1996, 8, 350. [Google Scholar] [CrossRef]
  68. Kaiser, H.F. An index of factorial simplicity. Psychometrika 1974, 39, 31–36. [Google Scholar] [CrossRef]
  69. Asparouhov, T.; Muthén, B. Exploratory structural equation modeling. Struct. Equ. Model. A Multidiscip. J. 2009, 16, 397–438. [Google Scholar] [CrossRef]
  70. Satorra, A.; Bentler, P.M. Corrections to Test Statistics and Standard Errors in Covariance Structure Analysis. In Latent Variables Analysis: Applications for Developmental Research; Sage Publications Inc.: Thousand Oaks, CA, USA, 1994; pp. 399–419. [Google Scholar]
  71. Shrestha, N. Factor analysis as a tool for survey analysis. Am. J. Appl. Math. Stat. 2021, 9, 4–11. [Google Scholar] [CrossRef]
  72. Fornell, C.; Larcker, D.F. Evaluating structural equation models with unobservable variables and measurement error. J. Mark. Res. 1981, 18, 39–50. [Google Scholar] [CrossRef]
  73. Papachristos, G.; Jain, N.; Burman, E.; Zimmermann, N.; Wu, X.; Liu, P.; Mumovic, D.; Lin, B.; Davies, M.; Edkins, A. Low carbon building performance in the construction industry: A multi-method approach of system dynamics and building performance modelling. Constr. Manag. Econ. 2020, 38, 856–876. [Google Scholar] [CrossRef]
  74. Barlas, Y. Formal aspects of model validity and validation in system dynamics. Syst. Dyn. Rev. 1996, 12, 183–210. [Google Scholar] [CrossRef]
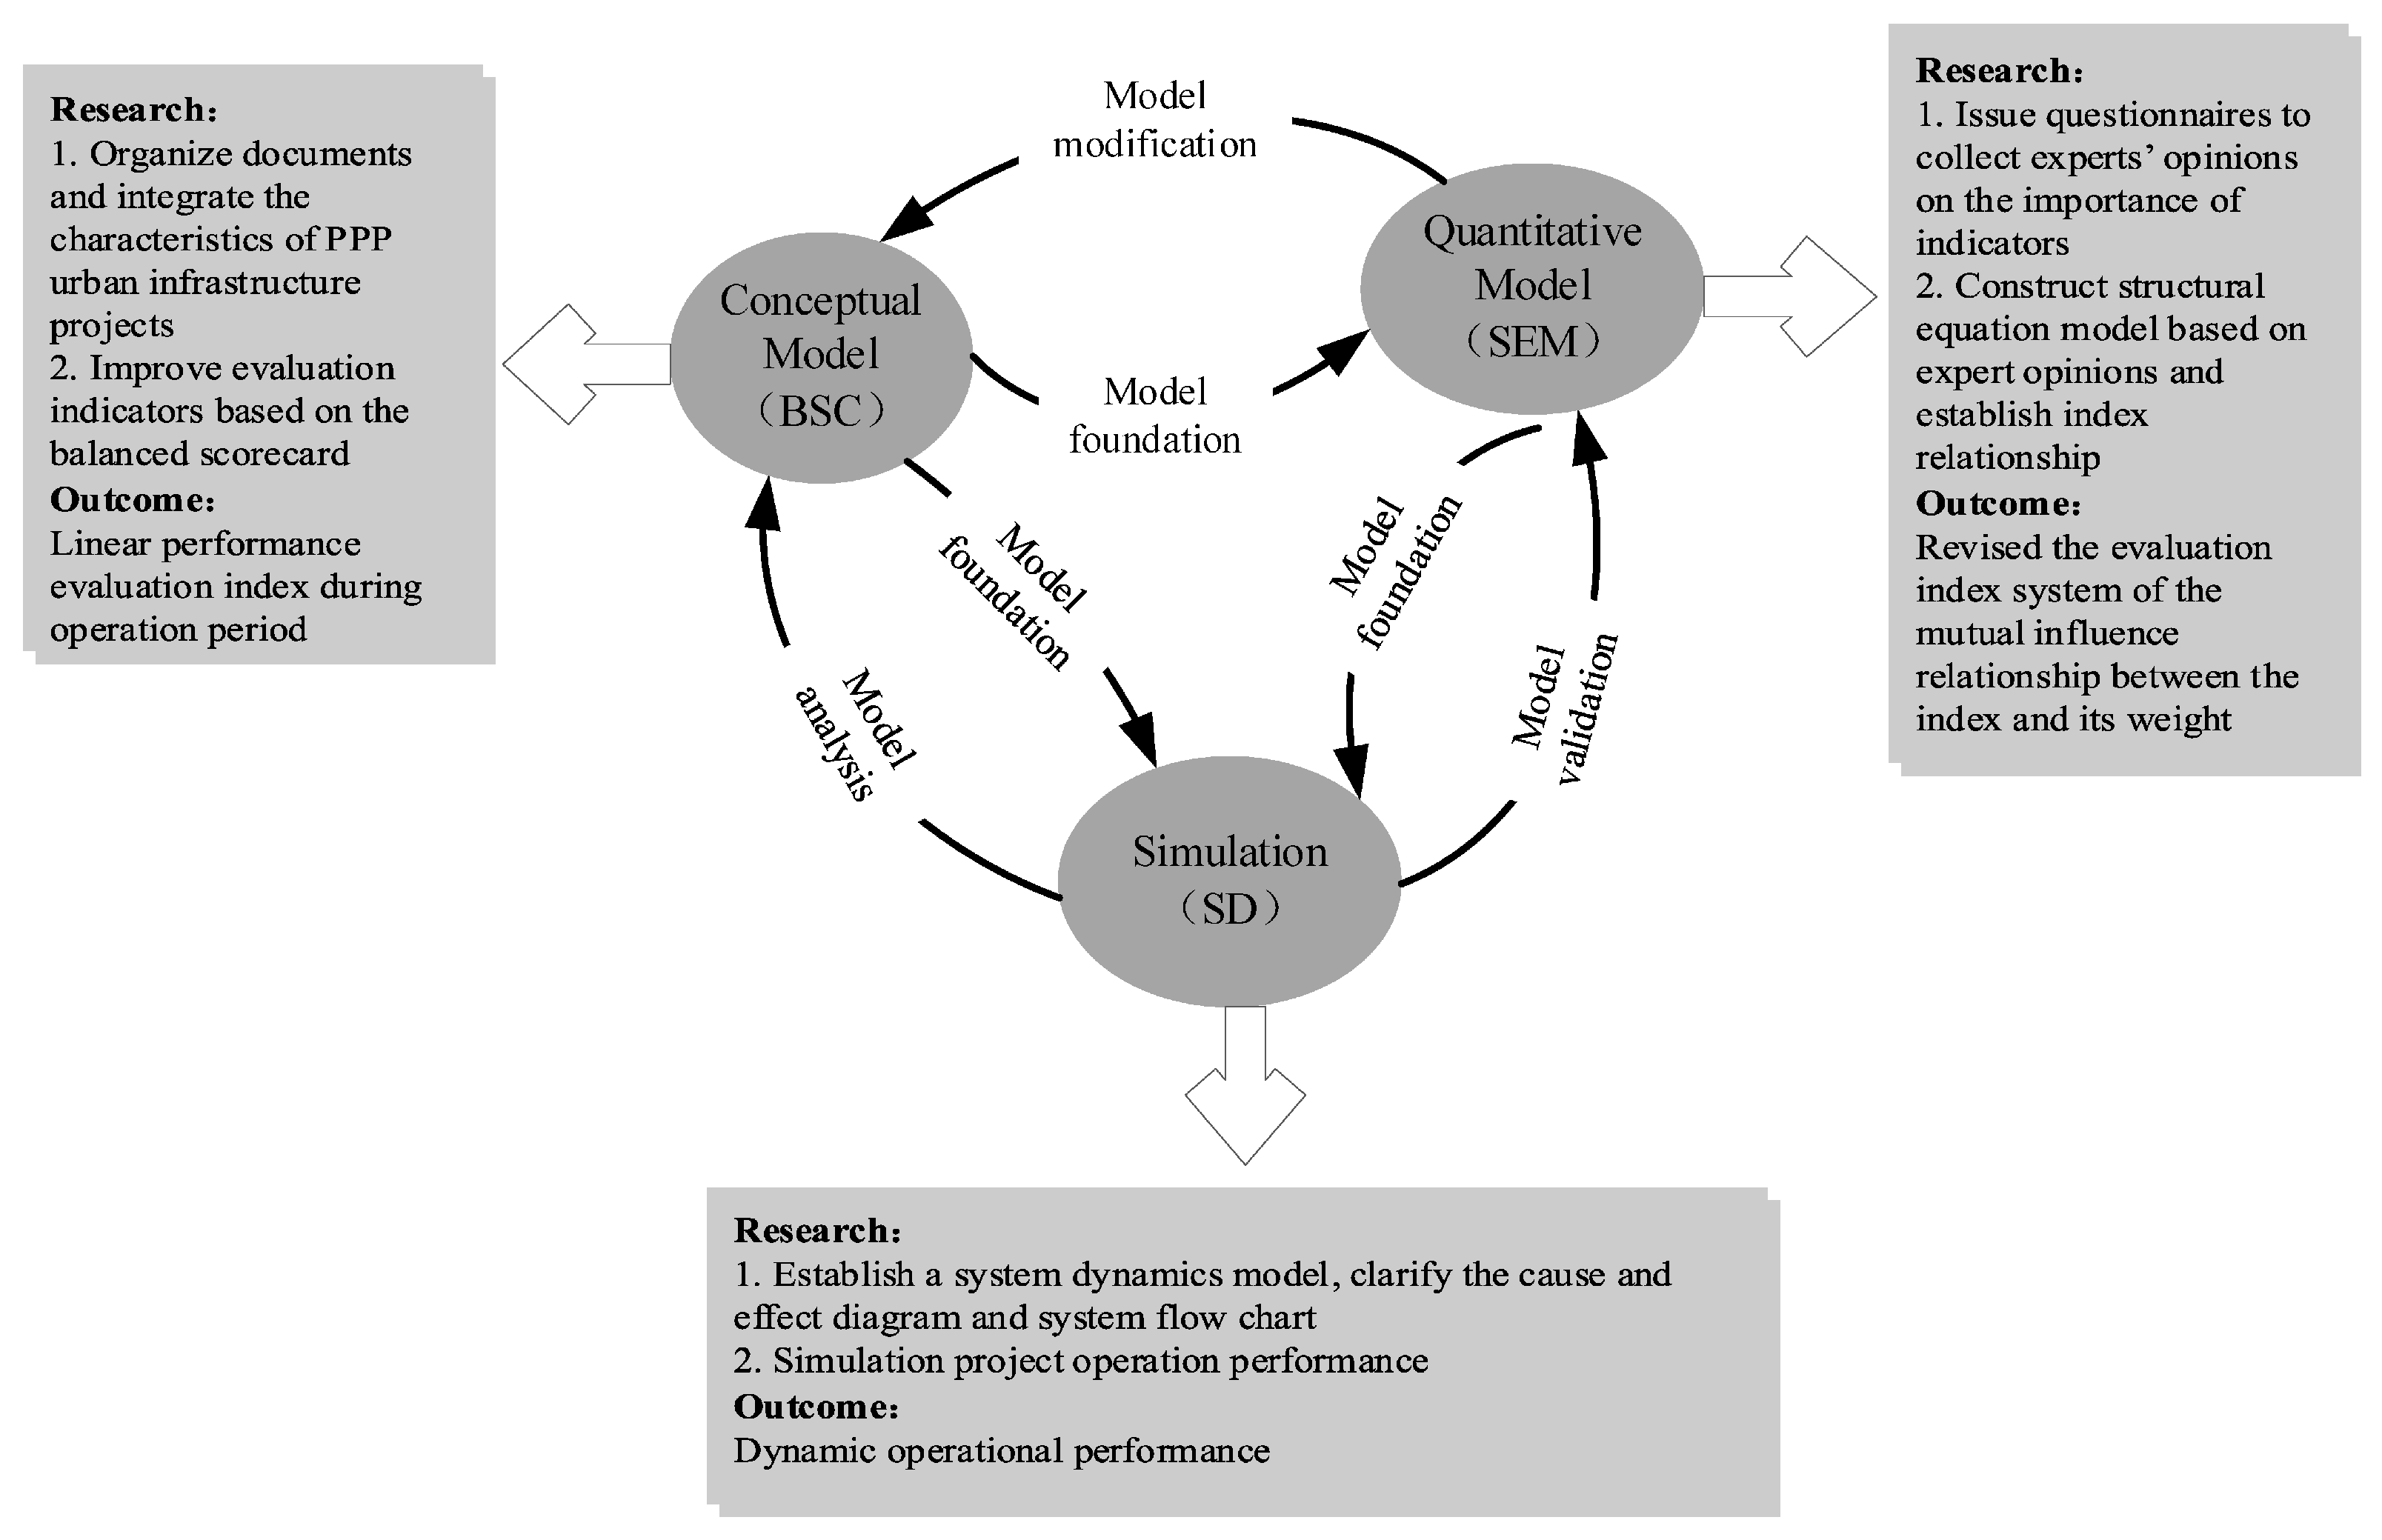
Figure 1. Research Flow.
Sustainability 15 07951 g001
Figure 2. PPP transportation infrastructure project operational performance index system.
Sustainability 15 07951 g002
Figure 3. SEM results.
Sustainability 15 07951 g003
Figure 4. The causality diagram.
Sustainability 15 07951 g004
Figure 5. System flow diagram.
Sustainability 15 07951 g005
Figure 6. Extreme value analysis. (a) Extreme condition test of A14. (b) Extreme condition test of A15.
Sustainability 15 07951 g006
Figure 7. System long-term and short-term performance. (a) The long-term project performance. (b) Project performance under the traffic congestion scenario in the short term.
Sustainability 15 07951 g007aSustainability 15 07951 g007b
Figure 8. Project performance under different strategies.
Sustainability 15 07951 g008
Table 1. PPP Transportation Infrastructure Project Operation Strategic Objectives.
Strategic ObjectivesConcerning AspectsSource
FinanceSolvency, operational capacity, growth capacity, etc.[29,30]
Multi-stakeholder satisfactionPrivate investors, government, facility managers and public, etc.[14,17]
O&MReliability of facility or equipment, quality of service and information management etc.[31,32]
SustainabilityEconomic, environment, social, etc.[15,19,26]
Table 2. List of current research.
SourceFinanceMulti-Stakeholders’
Satisfaction
O&MSustainability
PublicGovernmentInvestorReliability of
Facility/Equipment
Quality of ServiceInformation ManagementEconomicSocialEnvironment
[16]
[40] ------
[18]
[41]---
[42]
[43]---
[20]
Table 3. Improved Balanced Scorecard Indicators System.
Improved BSCSecond-Level Indicators/SourceThird-Level IndicatorsSource
Financial
ability
Solvency
(X1)
[30]Short-term solvency (A1)[58]
Asset liquidity (A2)
Debt operating ability (A3)
Operating
capacity (X2)
Overall asset operating ability (A4)[59]
Non-performing assets operating status (A5)
Development
capacity (X3)
Project revenue growth level (A6)[60]
Project capital accumulation ability (A7)
Multi-
stakeholders’
satisfaction
Stakeholders’
satisfaction
(X4)
[23]Partnerships (A8)[61]
Government satisfaction (A9)
Investor satisfaction (A10)
Social public satisfaction (A11)
Environmental protection department satisfaction (A12)
O&MFacility Structural
Condition (X5)
[18,40,41]Technical status of civil structure (A13)[25]
Technical status of electromechanical structure (A14)
Operational service
quality (X6)
Traffic flow levels (A15)[62]
Road traffic quality (A16)
Blockage removal ability (A17)
Safety and emergency
Management (X7)
Traffic safety level (A18)[63]
Completeness of emergency plans (A19)
The timeliness of emergency response (A20)
Organizational
Management (X8)
Integrity and clarity of the organizational structure (A21)[64,65,66]
Integrity and implementation of management system (A22)
Management information standardization and confidentiality (A23)
Integrity and transparency of management process (A24)
Degree of management information (A25)
Management planning (A26)
SustainabilitySustainability (X9)[19]Economic sustainability impact (A27)[15]
Social sustainability impact (A28)
Environmental sustainability impact (A29)
Table 4. Variables Set by The Model.
Variable TypeVariable Name
Horizontal
variables
Financial ability, stakeholders, O&M management, sustainability,
regulating subsystem
Rate variablesFinancial changes, stakeholder satisfaction changes, O&M
management changes, sustainability changes, and regulating
subsystem changes.
Auxiliary variablesProject performance, development ability, solvency, operating
ability, organizational management, safety and emergency
management, operation services, structure, F1, F2, F3
ConstantsProject revenue growth rate, capital accumulation rate, current ratio, acid-test ratio, debt-to-asset ratio, total asset turnover,
non-performing asset ratio, investor satisfaction, environmental
protection department satisfaction, government satisfaction, social public satisfaction, partnerships, electromechanical structure, civil structure, management system integrity and implementation,
management planning, management information standardization and confidentiality, degree of management information,
organizational structure soundness and clarity, integrity and
transparency of management process, emergency plan, accident rate, daily traffic, daily flow rate, timely rate of congestion removal, environmental sustainable impact, social sustainable impact,
economic sustainable impact
Disclaimer/Publisher’s Note: The statements, opinions and data contained in all publications are solely those of the individual author(s) and contributor(s) and not of MDPI and/or the editor(s). MDPI and/or the editor(s) disclaim responsibility for any injury to people or property resulting from any ideas, methods, instructions or products referred to in the content.