Article

An Evaluation of Local Comprehensive Plans Regarding Green Infrastructure in 52 Cities across the U.S. Gulf Coast Region

1
Department of Recreation, Park & Tourism Sciences, Texas A&M University, College Station, TX 77843, USA
2
Civilitude LLC, Austin, TX 78723, USA
*
Author to whom correspondence should be addressed.
Sustainability 2023, 15(10), 7939; https://doi.org/10.3390/su15107939
Submission received: 14 April 2023 / Revised: 5 May 2023 / Accepted: 10 May 2023 / Published: 12 May 2023
(This article belongs to the Special Issue Nature-Based Solutions to Foster Sustainable Urban Development)

Abstract

:
The utilization of green infrastructure (GI) showed promising results as a flood mitigation strategy and a viable solution for building community resilience and achieving sustainability, especially in light of the challenges posed by climate change and increasing climate-related hazards. Meanwhile, it remains uncertain how local governments incorporated the key principles of GI into their planning and regulatory frameworks, particularly their comprehensive plans. This study aimed to fill in the gaps by evaluating U.S. Gulf Coast cities’ comprehensive plans regarding GI. Using the content analysis method, a sample of fifty-two city comprehensive plans was evaluated to determine how well local plans support GI and to examine the factors which influence the quality of local plans. Our results indicate that the sampled cities in the Gulf Coast region are likely to have low willingness to plan and implement GI. Moreover, results from statistical analysis implied that the sampled Gulf Coast cities are more likely to produce higher-quality plans in terms of GI when there are more opportunities for public participation and involvement in the planning process. Findings from our study can provide valuable information and direction for local authorities and planners to improve the performance of their comprehensive plans and support GI implementation in the future.

1. Introduction

Over the past few decades, the Gulf Coast of the U.S. faced numerous natural and human-caused hazards including hurricanes, tornadoes, droughts, wildfires, floods, harmful algal blooms, and oil spills. Among them, floods are the most frequent hazards that are often caused by sea level rise, storm surge, hurricanes, heavy rainfall, overflowing of rivers, among others [1]. Such hazards resulted in lasting effects on the social, economic, and environmental aspects of the coastal communities. Therefore, coastal communities have to take proper mitigation actions to eliminate or reduce the adverse effects of flooding. However, traditional structural mitigation and protection measures such as flood barriers, levees, and reservoirs, often require extensive investment in buildings and infrastructure and sometimes result in unintended consequences caused by interruption to natural processes, inadequate protection, and even failure during disaster events [2]. Alternatively, nature-based solutions that allow for ecosystem function in combination with engineered solutions demonstrated success. The development of GI appears promising for mitigating flood risks and contributing to community resilience [3].
Several studies evaluated the role of GI in the planning domain and developed guidelines for GI planning. However, few studies evaluated how local governments incorporated the key principles of GI into their planning and regulatory frameworks, in other words, how well local plans incorporated key principles of GI. The results of this evaluation could provide valuable opportunities for local governments to learn how to improve their local plans regarding GI. Among local planning documents, a comprehensive plan is one of the most important decision-making tools that is often prepared by the local government and adopted by local residents to guide the development of their communities for the next ten, twenty, or more years [4]. The document shows the communities’ current conditions in terms of population, land use, transportation, economic development, utility, housing, environment, parks, and recreation. It also reflects the future visions and the approach of local residents and leaders for the future management of their community. A quality comprehensive plan regarding GI could help to shape priorities for the development of GI and, thus, effective GI policies. Contrarily, a low-quality plan could limit the possibilities of local government and other departments to promote and adopt GI.
Therefore, the primary objective of this study is to investigate the ability of city comprehensive plans in the U.S. Gulf Coast region to include and implement the principles of GI. Accordingly, two research questions were addressed: (1) have Gulf Coast cities adequately integrate key concepts of GI into their comprehensive plans? and (2) what factors affect the quality of the cities’ plans in terms of their integration of GI principles? The evaluation protocol designed by Kim and Tran [5] was used to assess the quality of 52 comprehensive plans in cooperating with key principles of GI. This protocol, with its 93 assessment criteria, enabled a systematic approach to GI assessment covering different components of a comprehensive plan, such as factual basis, goals, strategies, implementation, and inter-organizational cooperation. Multiple regression analysis was then applied to examine which factors influence the quality of local plans.
Understanding the degree to which local governments incorporate the key principles of GI into their comprehensive plans can shed light on how GI and its elements can be better adopted and managed in the future which, in turn, contribute to the success of the implementation of GI and achieving sustainability and resilience goals. Furthermore, the study can be broadly implemented in many other coastal cities in the United States and worldwide that are vulnerable to floodings. This study, however, focuses on evaluating the quality of the plans, not the quality or extent of the plans’ implementation.

2. Materials

2.1. Green Infrastructure and Green Infrastructure Approaches

To review, GI refers to a “strategically planned network of natural and semi-natural areas that is designed to provide a wide range of ecosystem services” [6]. GI practices are varied and can be applied at various scales from private properties to entire neighborhoods, city, state, and even multi-state regions [7]. At the smallest scale, GI in the forms of rain gardens, green roofs, and rain barrels on private properties, mimics natural systems by absorbing stormwater into the ground, using trees for evapotranspiration, and using rain barrels to capture and store stormwater for household uses. At the neighborhood/community scale, GI including community gardens, green streets, and urban green spaces incorporates planning and design approaches to reduce impervious surfaces and create attractive and livable communities. At the regional scale, GI is the interconnected network of large-scale green spaces (e.g., preserved and restored wetlands) that provide a range of ecosystem services for multiple cities and towns [8]. Moreover, GI is capable of withstanding a wide range of urban challenges, such as land-use change, climate change, biodiversity loss, and many social and economic issues.
In the last few decades, GI was applied across regions and scales with the shared goal as to design, construct, and manage nature by harmonizing environmental resources within the urban landscape [9]. For example, the Netherlands’ Room for the River program emerged as a highly effective, long-term GI strategy in Europe, aimed at reducing flood damage, returning green space to the floodplain, and generating a wide range of economic, social and environmental benefits. With more than 30 ongoing projects, this program is the result of proactive collaboration between the Dutch government, local municipalities, and water management authorities. In the U.S., a well-known GI project is the High Line in New York City which is a linear park built on an old railroad track. The variety of GI elements of the park brought many benefits to the surrounding communities and the city as a whole including increased property values, increased recreational opportunities, and improved air and water quality. The High Line is also considered a successful example of community-driven GI, as it was initiated by local residents and community organizations who were extensively involved in the planning, design, and construction of the park.
In order to help local governments better protect water quality, effectively manage stormwater, and incorporate GI at the municipal, neighborhood, and site scale, the U.S. Environmental Protection Agency (EPA) developed the Water Quality Scorecard [8]. The scorecard includes revising city regulations and practices, creating new rules or ordinances, and providing incentives to support GI initiatives. Diverse GI approaches are divided into five sections, including: (1) protecting natural resources and open space, (2) promoting efficient, compact development patterns and infill, (3) designing complete, smart streets that reduce overall imperviousness, (4) encouraging the efficient provision of parking, and (5) adopting GI stormwater management provisions.

2.2. Plan Quality Evaluation

While the Water Quality Scorecard is specific to GI evaluation, it does not include plan criteria widely used in previous plan quality evaluations. Plan quality evaluation is emerging as a valuable tool for systematic analysis of the goodness of a plan [10]. Early attempts to evaluate plans focus on ranking and choosing alternative plans based on how they achieved a set of goals [11]. These attempts, however, can only be applied in the plan-making process, and cannot be used to evaluate many plans from different jurisdictions, such as from different states, counties or cities. Since the 1990s, the empirical base of assessing plan quality developed rapidly. Planning researchers started to develop and improve theories related to plan quality and apply systematic methodologies to conduct comparative research and professional evaluation of plans [12]. Studies evaluated plans and their influences on local decision-making across a wide variety of domains, such as land use patterns, environmental protection, natural and technological hazards, and housing [13]. These studies identified a consensus on plan characteristics or components that most influence local decision-making and are most important in achieving plan implementation [14]. Plan’s components include (1) fact basis, (2) goals, and (3) policies [15]. The plan’s fact basis identifies existing local conditions as well as needs related to community physical development. Goals reflects the vision communities aspire towards, problem alleviation, and needs that are premised on shared local values. Policies serve as a guide for communities to achieve their goals [14]. Berke, J, Kaiser, and Burby [13] summarized that the key characteristics defining plan quality are solid facts and analyses; clear, substantive, and comprehensive goals; and specific action-oriented policies.
In seeking to understand how comprehensive plans can effectively contribute to ecosystem management, Brody [16] introduced two additional plan components of inter-organizational coordination and capacities and implementation, which, as he stated, can capture more effectively the principles of ecosystem management. The first additional component, inter-organizational coordination & capacities, includes different aspects of collaboration and conflict management. This component is needed because the management of ecological systems such as watersheds requires collaboration across political, administrative, and land ownership boundaries. Knowledge from the collaborative planning efforts among resource owners, managers, and users can improve the ability of local plans and planning processes to manage transboundary ecological systems [17]. The second additional component, implementation, captures how likely the goals, objectives, policies, and actions in the plan are implemented [16]. This component reflects a commitment of the jurisdiction to implement the final plan in the future. Collectively, these five components create the basis of a high-quality plan to manage and protect the integrity of the ecological system. These components are widely applied across substantive planning domains, such as environmental protection [18,19], open space protection [20], ecosystem management [21], climate change [22] and GI [5].
Methodologically, plan quality studies often use content analysis to measure the several characteristics of the plans. In the plan evaluation literature, scholars frequently focus on the words, charts, tables, maps, and other inventory in both paper and digital plan documents (Baer, 1997; Berke and Godschalk, 2009) [10,12]. They use coding items to evaluate whether the plan mentions or does not mention specific content. In addition, data from the content analysis were used to examine whether plan quality is associated with the success in implementation and achieving goals of the plan [20,23,24], and to scrutinize the influence of federal and state planning mandates on plan quality [13,25,26,27,28]. In these studies, plan quality scores are used as both analytical dependent and independent variables to develop planning theories of how plans are and should be developed and how they are and should be implemented [29].
Concerning GI, Kim and Tran [5] adapted the Water Quality Scorecard and followed the evaluation protocol that consists of five plan components: factual basis, goals and objectives, policies and strategies, inter-governmental cooperation, and implementation. In particular, their study assessed five EPA principles of GI. They were:
  • Promoting natural resources and open spaces: this principle assesses how the local government concerns about natural resources and open spaces, and how it acts to protect these resources from future development;
  • Promoting efficient, compact development patterns and infill development: this principle seeks to evaluate how the local government encourages sustainable development for urban areas, including infill, redevelopment for brownfields and grey-fields, mixed-use, and transit-oriented development;
  • Applying smart design strategies: this principle focuses on evaluating the design aspect of urban development, in particular the reduction in impervious surfaces. These strategies might include the integration between street design and green infrastructure, paving materials for the sidewalk, public streets, driveways, parking lots, and other traffic infrastructures;
  • Promoting the efficiency of parking: this principle assesses the effectiveness of parking. It examines how well the local government manages transportation demands, reduces parking requirements, and minimizes stormwater runoff from parking lots; and
  • Promoting GI stormwater management: the final principle addresses the performance of the local government in governing GI practices. It addresses how GI practices are integrated into stormwater management provisions of the city, how the local government maintains and enforces green infrastructure, and how the public is encouraged (through education and outreach) to use GI practices effectively.

2.3. Factors Influencing Plan Quality Regarding Green Infrastructure

This study quantitatively examined the impacts of several factors on plan quality. Specifically, it tested the relationship between three groups of independent variables, namely (1) socio-economic characteristics, (2) risks, and (3) planning preparation, and the quality of local comprehensive plans in Gulf Coast areas in terms of GI practices.

2.3.1. Socio-Economic Characteristics

Socio-economic characteristics (population size, population change, median income, and education) are contextual factors that directly affect the quality of local planning documents. Several previous studies tested the impacts of socio-economic and demographic variables on plan-quality scores. The most used variable in this context is population. Numerous studies included population size, population change, and population density [19,30,31,32,33]. While some studies found a significant link between population variables and plan quality [5,31,32], others found no effect. For example, local jurisdictions with a large population may have more expertise, resources, and financial support for local land-use planning than those with a small population. However, jurisdictions with a larger population may face greater environmental pressures and conflicts [19].
Wealth (income or home value) was also found as one of socio-economic predictors of the plan quality. Berke, J, Kaiser, and Burby [13] discovered that wealth (median home value) has a positive influence on plan quality. Thus, jurisdictions with wealthier populations tend to have more financial, human, and technical resources to support plan development. A similar variable, income, was also tested for the effects on plan quality [5,19]. Related to environmental planning, medium and high-income people tend to have more time and interest in environmental issues than low-income people. In short, a wealthy jurisdiction may have more interest in local environmental issues. However, the variable of wealth can present a complex U-shape relationship with environmental planning efforts [19]. Brody, Carrasco, and Highfield [32] systematically evaluated 46 comprehensive plans of southern Florida cities for the presence of several sprawl-reduction planning policies and also claimed that wealth negatively influences plan scores related to sprawl-reduction planning policies. Their results suggested that jurisdictions with wealthy populations have little motivation to adopt policies/strategies to reduce local sprawl. Past literature also found a significant positive effect of education level on plan quality. In other words, jurisdictions with higher levels of education, and perhaps higher awareness of the environmental issues of sprawl, have significantly higher plan scores [32].

2.3.2. Planning Characteristics

Planning characteristics include the plan’s updated year, involvement of consultants, and public participation in the planning process. Such planning characteristics positively affect plan quality [32] because preparing a quality plan requires adequate funding, necessary technical skills, and sufficient collaboration. The first measure is the plan’s updated year which reflects changes and regularly monitors of land-use elements to ensure plan consistency with new conditions, regulations, information, and techniques [19]. The more recently updated plans tend to result in higher quality plans.
The second factor in measuring planning characteristics is the involvement of consultants. With a group of qualified urban planners and many other multi-disciplinary experts, consulting firms can provide specialized expertise and technical skills for preparing and developing planning documents. Their roles may vary from collecting and analyzing data, developing plan recommendations and implementation strategies, to facilitating public participation and engagement. By collaborating with local authorities, consultants can help to improve the overall quality of the plan [5].
High-quality planning, however, does not only deliver a promising vision from the view of local authorities and professionals but also meets the needs of local citizens and inspires them to implement planning recommendations. Public participation and involvement in the planning and decision-making process from problem identification to landscape design and implementation can result in more successful and durable interventions in the urban landscape [34]. Therefore, public participation is always encouraged and sometimes obligatory. Public participation can be measured through the number of citizen groups participating in the planning process [30], participation formats (e.g., public hearings, meetings, workshops, charettes), public-notice channels (Internet, radio, newspaper, mail, notices), and public participation incentives (e.g., providing daycare at public meetings, allow public comments via emails or Internet, providing transportation) [19].

2.3.3. Risks

Jurisdictions located near areas subject to hazards (e.g., coastal line and floodplain) may have higher flood risks, leading to higher investment, and more efforts and awareness of their vulnerability. Thus, it is often expected that the local government will respond by protecting its people and properties with a stronger plan and a higher plan quality score. Kim and Tran [5] found that jurisdictions with a higher proportion of land located inside a 100-year floodplain tend to produce a higher-quality plan. However, some research suggested otherwise. Results from examining 40 adopted local climate change plans indicated that as hazard damages increase, the quality of local plans decreases [35]. It is likely because of the lack of restricting development in hazardous areas. Many local governments fear losing the fiscal benefits of development including the influence of development interests on local politics and disaster relief provided by the federal government [24]. Berke, J, Kaiser, and Burby [13] reported that plan quality was not influenced by the proportion of land subject to hazards [13]. Other studies indicated no effects of risks on plan quality.
As cities grow rapidly and more development sprawls across the landscape, the natural landscape is replaced by impervious surfaces such as roads, buildings, infrastructures, and parking lots. The natural hydrological systems are altered and the capacity to hold and store surface run-off is diminished. Consequently, communities are increasingly vulnerable to damage from repetitive floods and other hydrological consequences [36]. Thus, reducing impervious surfaces is considered to be an effective solution for every jurisdiction to lessen the impact of stormwater risks. A plan quality score is expected to be higher in jurisdictions with a higher percentage of impervious surfaces [5].
In this study, the evaluation protocol developed by Kim and Tran [5] was adopted to assess the quality of 52 city comprehensive plans in cooperating with the five key principles of GI. This protocol consisted of 93 assessment criteria covering different components of a comprehensive plan, such as factual basis, goals, strategies, implementation, and inter-organizational cooperation. Multiple regression analysis was then applied to examine which factors among socio-economic characteristics, planning characteristics, and risks influence the quality of local plans (Figure 1).

3. Methods

3.1. Sample Selection

This study focused on the U.S. Gulf Coast region and its coastal cities because of their highly vulnerable location to climate hazards, in particular flooding. Given the magnitude of climate change and sea level rise, Gulf Coast cities should better prepare, adapt, and build capacity for resilience for future events. A sampling frame was obtained based on the following sampling strategies. First, cities were chosen based on their close locations to the coastal lines to maintain a degree of consistency and comparability in terms of their vulnerability to flooding. Thus, the study included cities located in coastal counties in an area from Texas through the western Florida Panhandle [37]. As defined by the National Oceanic and Atmospheric Administration (NOAA), those counties have at least 15% of their total land area situated within a coastal watershed or include at least 15% of a coastal cataloging unit. Second, to assure that the city’s comprehensive plans reflected contemporary practice, only plans that were adopted between 2000 and 2020 were included, except Texas City’s comprehensive plan 1998 (vision 2020 and the plans are still in effect). Third, cities with a population of less than 2500 were excluded because small jurisdictions might lack the resources to initiate a sufficient planning effort [25]. Fourth, cities with a population of more than 1 million were also excluded because types of urban planning programs in such large cities are considered unique and ungeneralizable to the study population [13].
From the sampling frame, a sample of 52 cities was drawn to include: 27 cities in Texas, 4 cities in Mississippi, 4 cities in Alabama, 6 cities in Louisiana, and 11 cities in Florida (see Figure 2). Among these cities, 30 cities were adjacent to the coastal line, while 22 cities were situated at an average distance of 32 miles from the coast. Each of these cities’ comprehensive plans were evaluated based on an evaluation protocol to determine a high-quality plan in terms of GI.

3.2. Data Entry

Four types of data were collected for this study: (1) coding data (plan quality score), (2) census data, (3) GIS data, and (4) planning data.
  • Plan quality score was obtained through content analysis of GI principles of city comprehensive plans. To ensure transparency and minimize bias during the assessment and the coding process, Lacy et al. [38] recommended that two or more trained coders should independently code content units. Additionally, it is important for at least one of the coders to not have been involved in developing the protocol. Accordingly, 52 comprehensive plans were evaluated by the two researchers working independently of each other from Fall 2019 to Spring 2020. Intercoder reliability scores of each component from the two coders were then computed. Reliability score was measured the number of agreements in coding divided by the number of total items in each component (simple agreement). A score of 80% and above was considered acceptable according to previous studies [39,40]. In this study, an overall intercoder reliability score of approximately 82% was achieved. In cases of disagreement, they were resolved referring to the qualitative content of the plan through discussions. Additionally, as suggested by Lacy, Watson, Riffe, and Lovejoy [38], Krippendorff’s alpha was conducted in order to determine the consistency of inter-item. The overall alpha value for all plan components was approximately 0.78, which was close to the cutoff threshold of 0.8 indicating good reliability.
  • Census data for each city were used to identify the local population size (2010), the change in population from 2010 to 2020, the level of education attainment (2010), and median household income (2010). These types of data were all collected from the 2010 and 2020 Census data which are also the most two recent U.S. censuses (U.S. Census Bureau).
  • GIS data (including the percentage of the 100-year floodplain, percentage of impervious surface, and coastal area) were obtained using ArcMap 10.8. This information was used to represent the risks posed by coastal cities in the Gulf Coast region. The percentage of 100-year floodplain in the city was calculated based on the National Flood Hazard Layer (NFHL) 2019, collected from the FEMA Flood Map Service Center. However, many cities lack GIS floodplain information. Alternatively, floodplain maps in other types of data (e.g., jpeg, pdf) were collected and the percentage of the floodplain was calculated using Adobe Photoshop. This involved dividing the total number of pixels within the 100-year floodplain by the total number of pixels covering the entire city boundary. Impervious surface data were calculated using the National Land Cover Database (NLCD) 2016 Percent Developed Imperviousness (CONUS) collected from the U.S. Geological Survey (USGS). Coastal area is a dummy variable with a score of 1 indicating that the city is located adjacent to the coastal line with a higher risk of flooding (see Table 1).
  • Planning data, including plan adopted year, consultant, and the number of public participation techniques were collected from each city’s comprehensive plan or city official website. Where data were not available, information was collected by personally contacting the city’s planning staff.

3.3. Evaluation Criteria

Following previous studies on plan content analysis [10], each indicator was measured on a three-level ordinal scale, (0-0.5-1) or (0-1-2). For example, in the 0-1-2 ordinal scale, 0 is not identified or mentioned, 1 is suggested or identified but not detailed, and 2 is fully detailed or mandatory in the plan.
Once plan scores were coded, the scores of each indicator were added up within each plan component. The resulting sum of all indicators was then divided by the total possible score of each plan component. To create component scales ranging from 0 to 10, the final plan component scores were multiplied by 10. Finally, the scores of the five plan components were added together to obtain the total plan quality score. Accordingly, each plan has a maximum quality score of 50.

3.4. Data Analysis

Data were analyzed in two phases. First, the plan quality score for each city was measured using the process described in the previous section. Descriptive statistics were used to assess 52 local comprehensive plans’ scores as well as the performance of each indicator. Based on the techniques used in Godschalk [26] and Brody [16], the researcher calculated the presence (breadth score), the quality (depth score), and the total quality score of each indicator using Equations (1)–(3). Breadth scores show the number of plans that addressed a specific indicator, whereas depth scores indicate the degree of detail of an indicator.
Item   breadth   score = number   of   plans   that   address   item number   of   plans   in   the   sample   ,
Item   depth   score = total   score   of   all   plans   that   addressed   an   item 2 ×   number   of   plans   that   address   the   item   ,   and
Total item score = item breadth score + item depth score
Second, to examine how independent variables, such as population size, income, consultants, and risks, explain the variance of the plan quality score, the ordinary least square (OLS) was employed on STATA 13. Due to the small sample size, independent variables were grouped into three factors including socio-economic factors, planning capacities, and risks, then ran regression analysis separately (models 1–3). After running three models, a final full model (model 4) was tested with variables statistically significant in previous models. A diagnostic process was also employed to check the violation of the OLS assumptions (e.g., heteroskedasticity, multicollinearity, autocorrelation, and outliers).

4. Results

4.1. Descriptive Analysis

Using the evaluation protocol developed by Kim and Tran [5], the sample of 52 comprehensive plans was evaluated to determine how well their strategies and policies support the implementation of green infrastructural principles. The results indicated that key concepts of GI were not fully incorporated among the 52 city comprehensive plans, with an average score of 17.56 out of 50. With the large variations in plan quality scores, the city of Pensacola (FL) had the highest of 28.29 and Texas City (TX) had the lowest of 6.30. In the state of Texas, the city of League City had the highest score of 24.24 and Texas City had the lowest score. Appendix A shows the total plan score of all 52 comprehensive plans and each plan’s component scores. Across all 52 plans, there were less than a majority (16 plans) declaratively mentioning the need for GI, and far fewer local governments (11 plans) among them integrating specific GI practices to manage stormwater.
As shown in Table 2, goals and objectives obtained the highest average score (4.96) among the five components. Following goals and objectives, the implementation component scored an average of 4.10 which means the city’s comprehensive plans presented an adequate implementation plan to carry out their goals and policies. However, there was not enough basic information related to natural and human resources, as well as the projection of population and climate information (2.61). Policies and strategies (2.99), as well as Inter-governmental cooperation (2.71), were not sufficiently covered in most plans. Comparing between states, although Texas received a lower score in terms of factual basis, goals and objectives, policies and strategies, as well as implementation, its inter-organizational cooperation score was slightly higher (Figure 3).

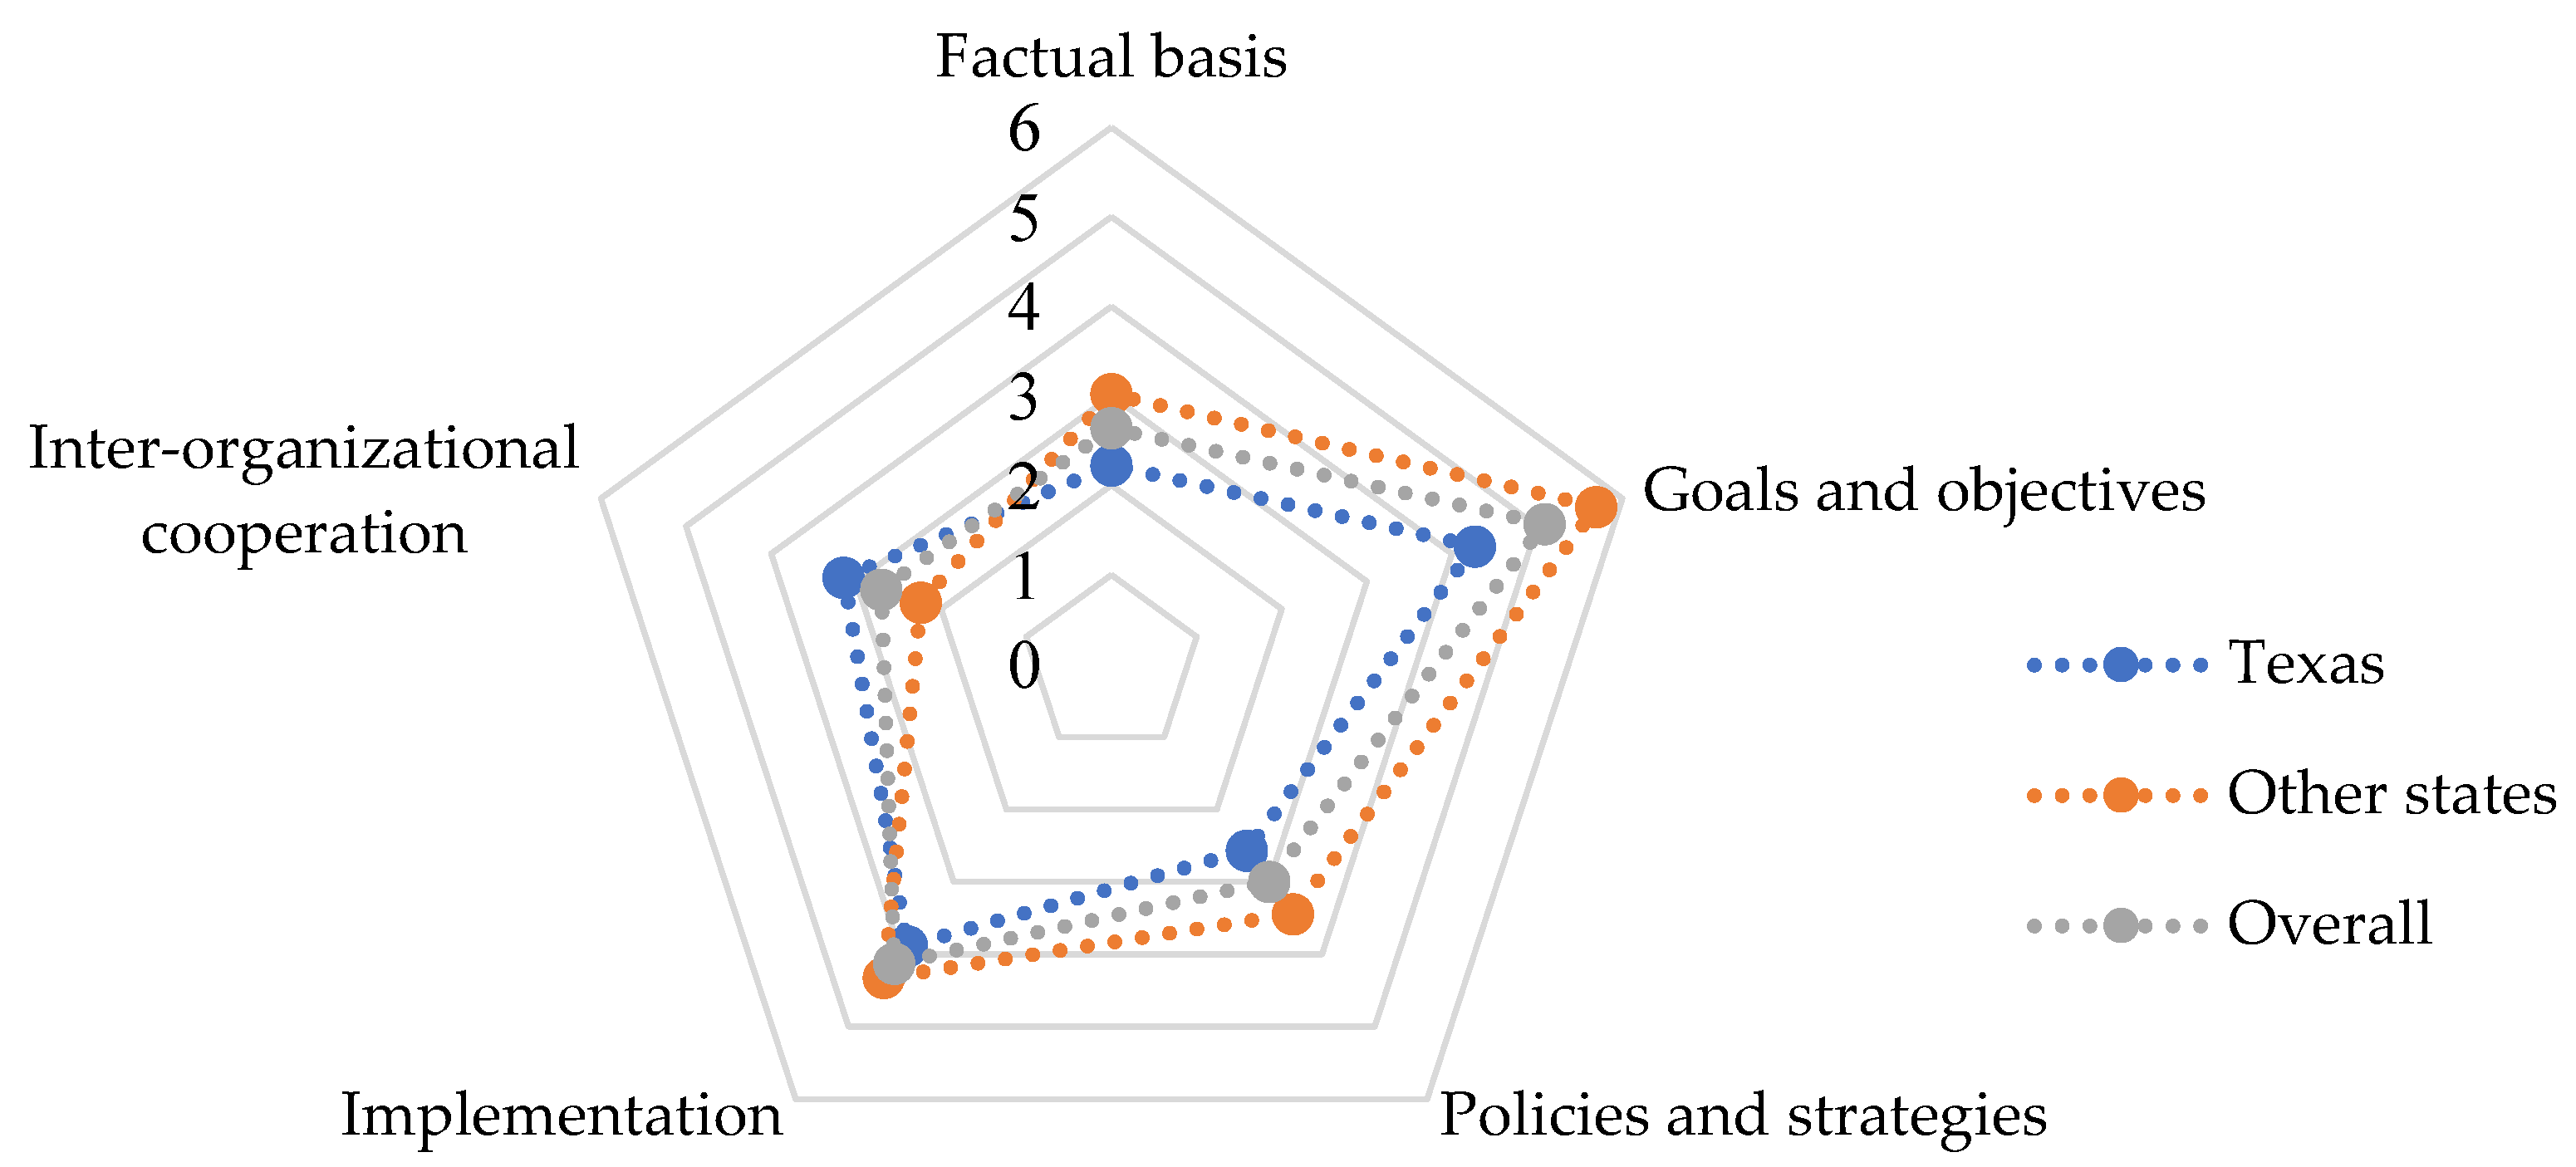
4.2. Analysis by Plan Components

Regarding the performance of the factual basis component, analysis of the breadth score and depth score revealed that fundamental inventories such as population projection, current and future land-use map, natural resources, water resources, water supply sources, and mixed-use development were well examined with the fairly high total scores ranging from 0.81 to 1.75 out of 2. However, such information as water quality status (0.36), water pollution sources (0.41), aquifer recharge (0.36), and brownfield and greyfield sites (0.40) were not adequately included. Especially, most plans lacked updated impervious surface density with a low breadth score of 0.13. Even if mentioned, almost no plan gave detailed information and showed any maps related to impervious surfaces (depth score of 0.04).
Concerning the goals and objectives component, the majority of the sample city plans expressed a commitment to preserve natural resources, protect critical areas, create open space networks, and control the volume of stormwater runoff with breath scores ranging from 0.71 to 0.87. However, they placed little emphasis on goals related to GI planning, including the restoration of wetland areas, planting more trees, reduction in high-capacity streets with wide rights-of-way, and reduction in parking spaces with both low breath scores (0.08–0.40) and low depth scores (0.05–0.34) (see Figure 4).
Regarding policies and strategies, growing and protecting urban tree systems were the least used practices by local governments. Only 3 out of 52 comprehensive plans (breadth score of 0.06) mentioned the adoption of providing free or reduced-price trees to homeowners and only eight comprehensive plans (breadth score of 0.15) mentioned the adoption of minimum tree preservation standards for new development sites. Furthermore, plans in the sample poorly provided strategies and programs to increase awareness of GI and related tools, such as GI workshops or training programs (breadth score of 0.10) and information brochures/manuals for homeowners (breadth score of 0.04). In contrast, policies and strategies such as open space preservation, mixed-use development, and low-impact development (LID) practices were widely used with relatively high breadth scores (0.9, 0.88, and 0.79, respectively) and depth scores (0.82, 0.82, 0.65, respectively).
Regarding implementation, results indicated that cities in our sample adequately identified timelines, responsibilities, and funding sources for implementing various policies and strategies as well as monitoring plan performances in the future. Though, only three out of all the plans identified barriers to GI implementation with a low breadth score of 0.04. Results for the inter-governmental cooperation component showed the lack of specified collaboration with adjacent jurisdictions (breadth score of 0.21), with local universities (breadth score of 0.19), and with higher levels of governments (breadth score of 0.19). Depth scores, however, were relatively high across indicators ranging from 0.59 to 0.95, indicating that each indicator was described with detailed information in the comprehensive plans.

4.3. Regression Analysis

Using plan quality score as the dependent variable, four regression models were then tested with the inclusion of three groups of independent variables, including socio-economic characteristics (model 1), risks (model 2), and planning characteristics (model 3). Table 3 below reports both coefficients and standardized coefficients for the plan quality score.
Based on model 1, analyzing socioeconomic characteristics, population (β = 0.317, p < 0.05), and education (β = 0.534, p < 0.01) significantly increased the plan quality scores regarding GI principles. The other variables, population change and income, were not found to be significant predictors of the plan quality scores. In model 2, land area (β = 0.382, p < 0.05) and impervious surface (β = 0.299, p < 0.05) significantly influenced the quality of the comprehensive plan. Risk variables such as floodplain and coastal areas which often directly link to flooding preparation and response, however, were not found to be statistically significant in this model. Most prominently, in the planning characteristics model, only public participation variable had a positive and significant effect on the plan quality score, (β = 0.397, p < 0.05). Based on the level of significance, five variables were included in the best-fit model (model 4), namely population, education, area, impervious surfaces, and public participation.
In the best-fit model, public participation (β = 0.409) was found to be statistically significant at the 0.05 level. A diagnostic process was also employed to check the violation of OLS assumptions and to ensure that the OLS would yield the best, linear, and unbiased parameter estimates. First, the test for heteroskedasticity was conducted using the Breusch–Pagan/Cook–Weisberg test. This test was insignificant (p = 0.777), removing the threat of heteroskedasticity in the model. Second, the Ramsey regression equation specification error test (RESET) indicated no omitted variables in the model (p = 0.102). The model residuals were also found to be close to a normal distribution and no major outliers were found. Finally, tests for multicollinearity using variance inflation factors (VIF) were run to detect issues of multicollinearity. The VIF values for land area and population variable were fairly large at 8.06 and 6.48, respectively, which showed a sign of multicollinearity. Correlation analysis suggested that population was strongly correlated with the land area (r = 0.90, p < 0.001) and public participation (r = 0.59, p < 0.001). As the result, the population size variable was removed from the best-fit model. In the final model, public participation (β = 0.384) was still found to be statistically significant at the 0.05 level. Additionally, public participation was the strongest predictor to explain the variance of plan quality score. All VIF values were less than 2, indicating no issue of multicollinearity. The results also implied that cities were more likely to produce higher-quality plans in terms of GI when there were more chances for public participation and involvement in the planning process. Other variables including education, land area, and impervious surface were not significant predictors of plan quality scores.

5. Discussions and Conclusions

GI was realized as a promising approach that helps cities to withstand a wide range of urban challenges, especially adapting to climate change and increasing natural disasters. If GI is proactively planned, implemented, and maintained in a systematic way, it should be a better model for land use and urban development which will effectively contribute to urban resilience. However, the results of evaluating 52 comprehensive plans in terms of GI application revealed that cities in the Gulf Coast region were likely to have low willingness to plan and implement GI, with an average score of only 17.56 out of 50. Moreover, although GI is not a new concept and its benefits are quite observable, only 16 out of 52 plans clearly mentioned the term and about half of these plans just mentioned GI as a possible approach to pursue their goals without any specific strategies and policies. This result could not be explained for the reason of outdated plans because 43 out of 52 plans were adopted after 2010. Findings from regression analysis confirmed this result by showing no significant relationship between the plan’s updated year and the score of plan quality. Zuniga-Teran et al. [41] proposed several explanations for the hesitance to implement GI including (1) design standards (e.g., lack of a standardized design process for hybrid infrastructure), (2) regulatory pathways (e.g., lack of regulatory pathways in place to capture GI’s multidimensional benefits, lack of stakeholder engagement, lack of urban planning policies), (3) socio-economic trends (e.g., equity issues, gentrification, lack of public participation), (4) financeability (e.g., who pays for GI, who maintains GI, and how to value GI benefits), and (5) innovation (e.g., insufficient technical knowledge and experience).
When it came to evaluating each component of the comprehensive plans, the local plans exhibited similar characteristics. Accordingly, local governments often provided relatively good goals and objectives concerning GI planning which reflects the vision to which the communities aspire towards. Following goals and objectives, the city’s comprehensive plans presented an adequate implementation plan to carry out their goals and objectives. Policies and strategies, however, scored low among the sampled comprehensive plans. Large variations in the policies and strategies components indicated that cities in the sample tended to only focus on well-established policy areas such as open space preservation, mixed-use development, and LID practices while placing little emphasis on growing and protecting urban tree systems and increasing awareness of GI and related tools, such as GI workshop or training programs and providing information brochures/manual for homeowners. Therefore, localities should commit greater efforts to improve public education in terms of GI. Accordingly, knowledge of GI can be integrated into education programs in order for institutions and local communities to fully understand what GI is, the different types of GI, their benefits to the community, and guidance to install and maintain GI practices. Indeed, across the Gulf Coast, some programs have been applied to provide GI information to local residents as a tool of sustainability and resilience. For example, the Green infrastructure for Texas (GIFT) operated by Texas Community Watershed Partners was developed to help Texans build resilient communities adaptable to economic, social, and environmental change through promoting rain gardens, floating wetlands, and many other LID elements.
Planning for sustainability and urban resilience brings together various stakeholders in the planning and development process ensuring the proper translation of policy into practice and meeting the needs and expectations of the community, which is no different for GI. However, the inter-governmental cooperation component was not sufficiently covered in most plans. This indirectly implied that the sample cities did not have high commitments to collaboration with various stakeholders, in particular with adjacent jurisdictions, local universities, and higher levels of government in managing GI. The findings may suggest that future plans should strive to engage various stakeholders representing different sectors of the community. Collaboration between these stakeholders is a key to overcome barriers to GI adoption and to shift the paradigms from grey infrastructure to GI [42].
Results from the statistical analysis revealed that the number of public participation techniques significantly influenced plan quality in terms of GI principles across models. These results were consistent with previous plan quality studies demonstrating the link between public participation and plan quality [19,30,32,43]. The results also implied that “good” GI planning requires inclusive public participation using various engagement methods such as public meetings, resident surveys, workshops, and other planning activities. The lack of public participation and involvement in GI planning processes could lead to GI’s failure to meet residents’ needs and preferences, exclusion of certain groups, the performance of undesirable activities, and the abandonment of GI in the worst cases [44].
Although this study provided evidence of factors influencing the quality of the comprehensive plan, it encountered several limitations that warrant further investigation. First, the small sample size of 52 cities limited the statistical power to generate more robust statistical conclusions from the regression models. Thus, future analyses should take greater efforts to investigate larger sample sizes in order to increase the statistical power as well as confidence in identifying the influence of more predictors on the plan quality. However, it is noteworthy to mention that although comprehensive plans are essential for the long-term planning of cities all over the U.S., they are not required in all states. For example, the states of Texas and Mississippi have optional comprehensive planning requirements for cities, while states such as Florida have mandatory comprehensive planning requirements (2020 Florida Statutes). Moreover, specific requirements for comprehensive plans may vary among states or even within a state. They can also change over time, which would significantly impact the quality of each component in the plan and the overall quality of the document. Second, the scope of this study was limited to comprehensive plans for coastal cities, while some other local plans may also discuss GI planning such as Stormwater Management Plans, Coastal Master Plans, Aquifer Protection Plans, and even Green Infrastructure Plans. This limitation restricted a full assessment of the performance of local government in the sample regarding GI planning. Therefore, further research should be undertaken to explore other local plans in terms of GI planning. Third, this study focused on evaluating the quality of the plans through content and statistical analysis. Future studies would benefit from the conduct of personal interviews, surveys, or case-study analysis with local authorities and planners to get a comprehensive understanding of their perceptions of GI as well as the barriers they encountered while planning to adopt GI practices. Finally, a higher score of plan quality does not necessarily equate to successful action in practices and positive outcomes. Along with evaluating the quality of the plans, additional research needs to be conducted to explore the quality or extent of the plan’s implementation and the degree to which plans are contributing to climate change adaptation and fostering community resilience.
This study of 52 city comprehensive plans in the Gulf Coast region clarified the performance of these plans regarding GI principles and the key indicators affecting their quality. The results of this study offered insights and guidance for local policymakers and planners to enhance the effectiveness of their plans and promote the implementation of green infrastructure.

Author Contributions

Conceptualization, T.L.; methodology, T.L. and T.T.; validation, T.L.; formal analysis, T.L.; investigation, T.L. and T.T.; resources, T.T.; data curation, T.L.; writing—original draft preparation, T.L.; writing—review and editing, T.L. and T.T.; visualization, T.L.; supervision, T.L.; funding acquisition, T.L. All authors have read and agreed to the published version of the manuscript.

Funding

This research was funded in part by an Institutional Grant (grant award number NA18OAR4170088) to the Texas Sea Grant College Program from the National Oceanic and Atmospheric Administration, U.S. Department of Commerce.

Institutional Review Board Statement

Not applicable.

Informed Consent Statement

Not applicable.

Data Availability Statement

Data is contained within the article.

Acknowledgments

The authors would like to thank the anonymous reviewers for their valuable comments.

Conflicts of Interest

The authors declare no conflict of interest.

Appendix A

Table A1. Plan quality score for each plan component by city.
CityStateIIIIIIIVVTotal
Aransas PassTX2.084.711.505.633.5017.41
Bay CityTX0.562.350.881.881.507.16
BaytownTX2.924.713.380.003.5014.50
BellaireTX1.533.532.385.634.0017.06
BiloxiMS2.926.473.633.751.0017.76
BrownsvilleTX4.035.003.885.634.0022.53
CallawayFL0.424.122.502.500.009.53
ClearwaterFL3.757.655.255.630.5022.77
Corpus ChristiTX1.255.593.502.502.0014.84
DaphneAL2.363.240.633.752.0011.97
DestinFL3.756.184.506.882.0023.30
DickinsonTX1.252.350.630.633.007.85
El CampoTX2.224.121.754.382.0014.46
FairhopeAL0.975.292.752.503.0014.52
Fort MyersFL2.363.531.251.885.0014.02
Fort Walton BeachFL1.945.293.133.751.0015.11
GalvestonTX3.066.764.255.633.5023.20
GonzalesLA1.115.293.002.502.5014.41
GretnaLA4.585.592.886.883.0022.92
GulfportMS4.867.063.001.253.5019.67
HammondLA4.447.355.252.504.5024.05
HarlingenTX2.783.822.383.132.0014.10
Ingleside cityTX1.112.941.385.002.5012.93
KennerLA2.504.120.883.134.5015.12
La PorteTX1.945.883.505.632.5019.45
LafayetteLA2.925.294.638.135.0025.96
Lake JacksonTX1.944.122.006.252.5016.81
LaredoTX2.926.765.632.506.0023.81
League CityTX5.008.244.502.504.0024.24
MiltonFL5.286.183.757.500.0022.70
MobileAL2.644.412.506.253.0018.80
Mont BelvieuTX2.504.714.001.253.0015.46
Moss PointMS2.503.531.381.881.5010.78
New OrleansLA2.086.184.008.133.0023.38
Panama CityFL0.422.943.631.250.008.23
PascagoulaMS2.507.654.503.130.5018.27
PearlandTX2.364.714.006.254.5021.82
PensacolaFL1.817.065.136.251.0028.30
Port ArthurTX3.065.002.886.255.0022.18
Port LavacaTX3.193.241.503.754.0015.68
PortlandTX2.083.821.631.883.5012.91
Punta GordaFL6.117.654.382.502.5023.13
RichmondTX1.254.711.752.503.0013.21
RosenbergTX2.223.532.256.253.5017.75
South Padre IslandTX1.674.713.752.501.5014.12
Spanish FortAL3.334.412.254.382.5016.87
St. PetersburgFl5.567.655.886.252.5027.83
TampaFL4.448.245.505.632.0025.80
Texas CityTX0.421.760.132.501.506.31
VictoriaTX1.942.652.756.882.0016.22
VidorTX1.940.590.251.253.507.53
WhartonTX2.925.003.006.883.5021.29
Note: I = Factual Basis (Range 0–10); II = Goals and objectives (0–10); III = Policies and strategies (0–10); IV = Implementation (0–10); V = Intergovernmental cooperation (0 = 10); Total = Sum of five plan component scores (0–50).

References

  1. NOAA. What Threats Do Coastal Communities Face? Available online: https://oceanservice.noaa.gov/hazards/ (accessed on 25 January 2023).
  2. Schwab, J. Planning for Post-Disaster Recovery: Next Generation; American Planning Association: Chicago, IL, USA, 2014. [Google Scholar]
  3. McPhearson, T.; Andersson, E.; Elmqvist, T.; Frantzeskaki, N. Resilience of and through urban ecosystem services. Ecosyst. Serv. 2015, 12, 152–156. [Google Scholar] [CrossRef]
  4. Kaiser, E.J.; Godschalk, D.R. Twentieth century land use planning: A stalwart family tree. J. Am. Plan. Assoc. 1995, 61, 365–385. [Google Scholar] [CrossRef]
  5. Kim, H.; Tran, T. An Evaluation of Local Comprehensive Plans Toward Sustainable Green Infrastructure in US. Sustainability 2018, 10, 4143. [Google Scholar] [CrossRef]
  6. Benedict, M.A.; McMahon, E.T. Green Infrastructure: Smart Conservation for the 21st Century, Sprawl Watch Clearinghouse Monograph Series. Renew. Resour. J. 2002, 20, 12–17. [Google Scholar]
  7. Benedict, M.A.; McMahon, E.T. Green Infrastructure: Linking Landscapes and Communities; Island Press: Washington, DC, USA, 2012. [Google Scholar]
  8. USEPA. Water Quality Scorecard: Incorporating Green Infrastructure Practices at the Municipal, Neighborhood, and Site Scales; US EPA: Washington, DC, USA, 2009. [Google Scholar]
  9. Lennon, M. Green infrastructure and planning policy: A critical assessment. Local Environ. 2015, 20, 957–980. [Google Scholar] [CrossRef]
  10. Berke, P.; Godschalk, D. Searching for the good plan: A meta-analysis of plan quality studies. J. Plan. Lit. 2009, 23, 227–240. [Google Scholar] [CrossRef]
  11. Hill, M. A goals-achievement matrix for evaluating alternative plans. J. Am. Inst. Plan. 1968, 34, 19–29. [Google Scholar] [CrossRef]
  12. Baer, W.C. General plan evaluation criteria: An approach to making better plans. J. Am. Plan. Assoc. 1997, 63, 329–344. [Google Scholar] [CrossRef]
  13. Berke, P.R. Enhancing plan quality: Evaluating the role of state planning mandates for natural hazard mitigation. J. Environ. Plan. Manag. 1996, 39, 79–96. [Google Scholar] [CrossRef]
  14. Berke, P.R. Evaluating environmental plan quality: The case of planning for sustainable development in New Zealand. J. Environ. Plan. Manag. 1994, 37, 155–169. [Google Scholar] [CrossRef]
  15. Kaiser, E.J.; Godschalk, D.R.; Chapin, F.S. Urban Land Use Planning; University of Illinois Press Urbana: Urbana, IL, USA, 1995; Volume 4. [Google Scholar]
  16. Brody, S.D. Implementing the principles of ecosystem management through local land use planning. Popul. Environ. 2003, 24, 511–540. [Google Scholar] [CrossRef]
  17. Brody, S.D.; Highfield, W.; Carrasco, V. Measuring the collective planning capabilities of local jurisdictions to manage ecological systems in southern Florida. Landsc. Urban Plan. 2004, 69, 33–50. [Google Scholar] [CrossRef]
  18. Evans-Cowley, J.S.; Gough, M.Z. Evaluating environmental protection in post-Hurricane Katrina plans in Mississippi. J. Environ. Plan. Manag. 2008, 51, 399–419. [Google Scholar] [CrossRef]
  19. Tang, Z.; Brody, S.D. Linking planning theories with factors influencing local environmental-plan quality. Environ. Plan. B Plan. Des. 2009, 36, 522–537. [Google Scholar] [CrossRef]
  20. Steelman, T.A.; Hess, G.R. Effective protection of open space: Does planning matter? Environ. Manag. 2009, 44, 93–104. [Google Scholar] [CrossRef] [PubMed]
  21. Berke, P.; Spurlock, D.; Hess, G.; Band, L. Local comprehensive plan quality and regional ecosystem protection: The case of the Jordan Lake watershed, North Carolina, USA. Land Use Policy 2013, 31, 450–459. [Google Scholar] [CrossRef]
  22. Fu, X.; Gomaa, M.; Deng, Y.; Peng, Z.-R. Adaptation planning for sea level rise: A study of US coastal cities. J. Environ. Plan. Manag. 2017, 60, 249–265. [Google Scholar] [CrossRef]
  23. Burby, R.J.; May, P.J. Making Governments Plan: State Experiments in Managing Land Use; JHU Press: Baltimore, MD, USA, 1997. [Google Scholar]
  24. Nelson, A.C.; French, S.P. Plan quality and mitigating damage from natural disasters: A case study of the Northridge earthquake with planning policy considerations. J. Am. Plan. Assoc. 2002, 68, 194–207. [Google Scholar] [CrossRef]
  25. Berke, P.R.; French, S.P. The influence of state planning mandates on local plan quality. J. Plan. Educ. Res. 1994, 13, 237–250. [Google Scholar] [CrossRef]
  26. Godschalk, D. Natural Hazard Mitigation: Recasting Disaster Policy and Planning; Island Press: Washington, DC, USA, 1999. [Google Scholar]
  27. Kang, J.E.; Peacock, W.G.; Husein, R. An assessment of coastal zone hazard mitigation plans in Texas. J. Disaster Res. 2010, 5, 520–528. [Google Scholar] [CrossRef]
  28. Berke, P.; Smith, G.; Lyles, W. Planning for resiliency: Evaluation of state hazard mitigation plans under the disaster mitigation act. Nat. Hazards Rev. 2012, 13, 139–149. [Google Scholar] [CrossRef]
  29. Lyles, W.; Stevens, M. Plan Quality Evaluation 1994–2012 Growth and Contributions, Limitations, and New Directions. J. Plan. Educ. Res. 2014, 34, 433–450. [Google Scholar] [CrossRef]
  30. Brody, S.D. Are we learning to make better plans? A longitudinal analysis of plan quality associated with natural hazards. J. Plan. Educ. Res. 2003, 23, 191–201. [Google Scholar] [CrossRef]
  31. Conroy, M.M.; Berke, P.R. What makes a good sustainable development plan? An analysis of factors that influence principles of sustainable development. Environ. Plan. A 2004, 36, 1381–1396. [Google Scholar] [CrossRef]
  32. Brody, S.D.; Carrasco, V.; Highfield, W.E. Measuring the adoption of local sprawl: Reduction planning policies in Florida. J. Plan. Educ. Res. 2006, 25, 294–310. [Google Scholar] [CrossRef]
  33. Deyle, R.E.; Chapin, T.S.; Baker, E.J. The proof of the planning is in the platting: An evaluation of Florida’s hurricane exposure mitigation planning mandate. J. Am. Plan. Assoc. 2008, 74, 349–370. [Google Scholar] [CrossRef]
  34. Lovell, S.T.; Taylor, J.R. Supplying urban ecosystem services through multifunctional green infrastructure in the United States. Landsc. Ecol. 2013, 28, 1447–1463. [Google Scholar] [CrossRef]
  35. Tang, Z.; Brody, S.D.; Quinn, C.; Chang, L.; Wei, T. Moving from agenda to action: Evaluating local climate change action plans. J. Environ. Plan. Manag. 2010, 53, 41–62. [Google Scholar] [CrossRef]
  36. Mileti, D. Disasters by Design: A Reassessment of Natural Hazards in the United States; Joseph Henry Press: Baltimore, MD, USA, 1999. [Google Scholar]
  37. NOAA. Defining Coastal Counties; NOAA: Washington, DC, USA, 2010. [Google Scholar]
  38. Lacy, S.; Watson, B.R.; Riffe, D.; Lovejoy, J. Issues and best practices in content analysis. J. Mass Commun. Q. 2015, 92, 791–811. [Google Scholar] [CrossRef]
  39. Miles, M.B.; Huberman, A.M. Qualitative Data Analysis: An Expanded Sourcebook; Sage: New York, NY, USA, 1994. [Google Scholar]
  40. Berke, P.R.; Conroy, M.M. Are we planning for sustainable development? An evaluation of 30 comprehensive plans. J. Am. Plan. Assoc. 2000, 66, 21–33. [Google Scholar] [CrossRef]
  41. Zuniga-Teran, A.A.; Staddon, C.; de Vito, L.; Gerlak, A.K.; Ward, S.; Schoeman, Y.; Hart, A.; Booth, G. Challenges of mainstreaming green infrastructure in built environment professions. J. Environ. Plan. Manag. 2020, 63, 710–732. [Google Scholar] [CrossRef]
  42. Abhold, K.; Lorraine, L.; Grumbles, B. Barriers and Gateways to Green Infrastructure; Clean Water America Alliance: Washington, DC, USA, 2011; Volume 137. [Google Scholar]
  43. Godschalk, D.R. Urban hazard mitigation: Creating resilient cities. Nat. Hazards Rev. 2003, 4, 136–143. [Google Scholar] [CrossRef]
  44. Farahani, L.M.; Maller, C.J. Perceptions and preferences of Urban greenspaces: A literature review and framework for policy and practice. Landscape Online 2018, 61, 1–22. [Google Scholar] [CrossRef]
Figure 1. Evaluation framework.
Sustainability 15 07939 g001
Figure 2. Location of sampled cities along the Gulf Coast.
Sustainability 15 07939 g002
Figure 3. Variation in plan component score by states.
Sustainability 15 07939 g003
Figure 4. Variation in Plan Component Score—Goals and objectives.
Sustainability 15 07939 g004
Table 1. Summary of independent variables.
VariableMeasurement MeanS.D.Range
Socio-economic characteristics
Population Number of people in 2010 divided by 10,0006.458.650.28–34.38
Population change Percentage of population change from 2010 to 20208.0813.96−36.30–49.90
Education Percentage of people over 25 years of age in 2010 with bachelor’s or higher degrees23.8512.437.90–78.4
Income Median Household Income in 2010 in dollars49,459.0819,705.6223,727–150,519
Risks
Land area Total land area in sq. kilometers96.07108.615.50–452.00
Impervious surfaces Percentage of impervious surface 22.5611.363.78–57.00
Floodplain Percentage of 100-year floodplain in the sample municipality38.5123.364.86–96.37
Coastal area Municipalities that are close to the coastal side (1 = Yes, 0 = No)0.580.500.00–1.00
Planning characteristics
Plan up-to-date 2020 minus Plan adopted year6.584.491.00–22.00
Consultant Consultants’ participation while adopting the plan (1 = Yes, 0 = No)0.600.500.00–1.00
Public participation Number of public participation techniques (e.g., meetings, workshops, surveys)3.891.921.00–10.00
Table 2. Plan quality evaluation components and summary statistics.
Plan ComponentsDefinitionMeanS.D.Range
Factual basisFundamental information for managing GI2.611.350.42–6.11
Goals and objectivesBroad goals to achieve visions for GI planning4.961.760.59–8.24
Policies/Strategies and actionsSpecific and measurable tools to achieve goals and objectives2.991.490.13–5.88
Inter-governmental cooperationIdentification and capability to coordinate with different levels of stakeholders2.711.390.00–6.00
ImplementationCapability to carry out goals and policies4.102.160.63–8.13
Total plan quality scoreSum of five plan component scores17.505.626.31–28.30
Table 3. Multiple regression results.
VariableCoef.BetaStd. Error.t-Value
Model 1: Socioeconomic characteristics
Population0.2060.317 *0.0842.44
Population change0.0190.0480.050.38
Education0.2450.534 **0.0872.83
Income0−0.3570−1.85
N52
R20.306
Model 2: Risks
Land area0.020.382 *0.0072.68
Impervious surfaces0.1480.299 *0.072.1
Floodplain0.010.0430.0330.32
Coastal area0.5590.051.610.35
N52
R20.172
Model 3: Planning characteristics
Plan up-to-date−0.143−0.120.157−0.91
Consultant2.1950.1921.5221.44
Public participation1.3310.481 **0.3553.75
N46
R20.32
Model 4: Best-fit model 1
Population0.3650.6030.191.92
Education0.0590.1370.0581.01
Land area−0.02−0.4140.017−1.18
Impervious surfaces0.0410.0890.070.06
Public participation1.0990.397 *0.4572.4
N46
R20.389
Model 5: Best-fit model 2
Education0.0690.1610.061.15
Land area0.0080.1720.0090.97
Impervious surfaces0.0860.1870.0681.27
Public participation1.0630.385 *0.4712.26
N46
R20.333
Note: * p < 0.05; ** p < 0.01.
Disclaimer/Publisher’s Note: The statements, opinions and data contained in all publications are solely those of the individual author(s) and contributor(s) and not of MDPI and/or the editor(s). MDPI and/or the editor(s) disclaim responsibility for any injury to people or property resulting from any ideas, methods, instructions or products referred to in the content.

