Article

Analysis of Noise Levels in Typical Passenger Cars

1
Faculty of Engineering Science, University of Applied Sciences in Nowy Sacz, Zamenhofa 1a, 33-300 Nowy Sacz, Poland
2
Department of Environmental Engineering and Mechanical Engineering, Faculty of Engineering, “Vasile Alecsandri” University of Bacau, 600115 Bacau, Romania
*
Authors to whom correspondence should be addressed.
Sustainability 2023, 15(10), 7910; https://doi.org/10.3390/su15107910
Submission received: 4 April 2023 / Revised: 9 May 2023 / Accepted: 10 May 2023 / Published: 11 May 2023

Abstract

:
Passenger cars differ in their levels of emitted noise and mileage, which can have a negative impact on the environment and humans. This was confirmed by the results of this study on the noise levels generated by passenger cars that have the same parameters, or are of one type. The loudest place in the tested vehicles turned out to be the combustion engine compartment, with the average noise level exceeding 90 dB and exhibiting a noticeable, significant increase alongside an increase in the mileage of the vehicles. This value of noise intensity is classified as dangerous for the human body. As a result of the conducted tests, it can be concluded that an engine cover is an important element in damping the sounds emitted by an internal combustion engine after the use of an aluminum heat shield to increase noise absorption. In the future, the environmental problem of noise emission from cars can be solved by encouraging the use of quieter, electric vehicles.

1. Introduction

The automotive industry is constantly evolving in terms of technological solutions. The reason for such a significant evolution in this industry is the high expectations of consumers. Modern technological solutions that meet the needs of users are not always appropriate from the point of view of environmental protection. In order to prevent solutions that are unfavorable for the customer and harmful to the environment, it is necessary to tighten environmental standards based on the greater accuracy of vehicle identification [1]. In this context, it should be recognized that noise pollution has become a source of social tension related to economic development, on the one hand, and quality of life on the other.
The first European Directive 70/157/EEC [2] deals with the maximum noise level values and the corresponding procedure for measuring noise levels in motor vehicles. In turn, the second of the EU directives, marked as 97/24/EC [3], introduced appropriate limit values for two- or three-axle vehicles, taking into account the currently used silencing and exhaust systems of motor vehicles. On this basis, an EU regulation (540/2014/EU) [4] specifies the acceptable sound levels of vehicles and suggests the replacement of noise reduction systems. In turn, another EU directive, 2001/43/EU [5], specifies the limits on different types and widths of tires, which also relates to type approval for all new tires. Following the introduction of EU regulation 2020/740 [6], related to noise levels generated by tires, new markings for tires sold in the European market were also introduced.
The basic national legal act in the field of environmental protection, which includes protection from noise, is the Environmental Protection Law published on 27 April 2001 [7], and permissible noise levels for environmental protection were specified in the Ordinance of the Minister of the Environment on 15 October 2013 [8].
The forementioned national and European standards may apply to not only the operation of cars, but also their production. Manufacturers of passenger cars are required to use natural sources, as well as those from recycling, to obtain products for the production of vehicles. According to some researchers from the automotive industry [9,10], it goes unnoticed that rational waste management is conducive to minimizing negative impacts on the environment. In turn, several researchers have studied the issue of vehicle noise [11,12,13,14], and Cherry [15] has demonstrated active sound control technology that can be used to not only reduce noise in the car environment, but also improve driving comfort.
One source of vehicular noise is the engine noise, which is transferred inside the cabin of a car through an airborne path and a structure-borne path [16]. Moreover, vehicle-specific noises include, among other examples, an air conditioning system and car horns. A large portion of such noises changes between vehicles [1]. Another researcher [17] showed a significant disease burden caused by environmental noise, stressing that noise is a public health problem.
To obtain a more comfortable and safer driving environment, it is extremely important to control the low-frequency noise radiated to a vehicle via the vibration of sheet metal car parts [18]. Therefore, it is important to reduce noise in cars, particularly through modifying the acoustic properties of the interior with a particular emphasis on increasing passenger comfort, which may be caused by many of the auxiliary components, such as the electric water pump, vacuum pump, low-speed fan, or ventilation equipment [19]. Hybrid and electric vehicles are an alternative that pollute the environment to a lesser extent than vehicles that are based on conventional technology [20,21].
This work aims to assess the variability in the noise levels of selected passenger cars that have the same parameters and differ in their mileage and production year (2020–2022), as well as to indicate methods of minimizing these levels. According to Ibarra et al. [22], new vehicles may not yet be characterized in terms of noise emission.

2. Materials and Methods

Krishnamurthy and Hansen [1] demonstrated that road characteristics are a significant factor effecting the noise levels of a vehicle, and that road surface characteristics may change the noise levels of the vehicle (e.g., asphalt vs. concrete, smooth vs. cracks or holes). Hence, passenger cars generate noise in various forms, and this noise may be generated by various components of the vehicle. Noise from motor vehicles is generated by the act of driving, vehicle movement, and overcoming rolling resistance (tire–surface) and air resistance (air resistance coefficient “cx”), as well as friction resulting from braking and acceleration forces. This research was based on the requirements outlined in the Environmental Noise Directive (END) [23]. Measurements were taken at a standstill. Noise levels were measured using a noise level meter (Sonometer BENTECH GM1356), which performs measurements with an accuracy of 1.5 dB in the range of 30 dB to 130 dB. Immediately before the measurements were taken, the meter was calibrated using a calibrator. The test was considered invalid if the sound level meter showed that errors exceeding 1.0 dB were recorded during calibration (EN IEC 60942:2018-06) [24]. A total of 13 cars that were manufactured in 2020–2022 (5 cars—2020, 4 cars—2021, 4 cars—2022) of the same type with the following parameters were used for the tests:
  • Model—X3 G01, standard version;
  • Type of fuel—diesel;
  • Engine power—125 kW;
  • Displacement—1995 dm3;
  • Engine fueling mode—normal;
  • SUV.
The measurement process consisted of reading the noise levels of each vehicle, in dB, from a short period of engine operation. Before the measurements were taken, each vehicle was brought to the operating temperature of the engine, i.e., the temperature reached by the coolant, or a temperature of about 90 °C. Operating conditions during the engine test, such as types of fuel and oils and ignition timing, were set to default to follow the factory manual of the cars.
Table 1 shows the coded notation for identifying the vehicles used in the test. A letter was assigned to cars with the same year of production. Since the same types of cars were used in this study, the kilometers driven by each car served as a differentiator.
The vehicles’ noise measurements were taken in 2020–2022 at an external stand that met the requirements set by the EU regulation from 2006 [25] on detailed requirements for stations carrying out technical tests of vehicles.
During measurement, the owner (driver) of the vehicle and the person who conducted the measurement were present at the measurement site as in Ferrari et al. [26], who also carried out a study measuring vehicle noise.
For the tests to run properly, the following requirements—taken from the EU regulation from 2002 [27], ISO 16254:2016 [28], and ISO/DIS 5128 [28]—had to be met:
  • The vehicle could not be loaded during the test;
  • During the test, the vehicle should be disconnected from trailers (semi-trailers); this does not apply to inseparable vehicles;
  • Before the test, the vehicle’s engine was brought to its normal operating temperature.
  • If the vehicle’s cooling system was equipped with an automatically actuated blower, the system would operate normally during measurement;
  • If the diesel engine of the vehicle was equipped with a fuel enrichment system, the lever of this system would be set to the “no load” position;
  • The test vehicle was to be placed in the middle of the test area with the drive system in neutral position and the clutch and parking brake engaged.
To perform the measurements, an appropriate measuring station was prepared. Measurements of the noise levels from the exhaust system were performed on a measuring stand where there were no obstacles up to 3 m on each side of the vehicle. This was necessary due to the physical propagation of sound waves and their reflection. Failure to comply with this rule would have led to measurement errors. The measurements were taken at 12 research points in the interior (2 points) or on the exterior (10 points) of the vehicle at a distance of 2000 mm or a higher distance of 4000 mm (2 points). This distance made it possible to take measurements near the car. These measurements were taken at idle and maximum engine speeds at the following points (including the tripod) (Figure 1):
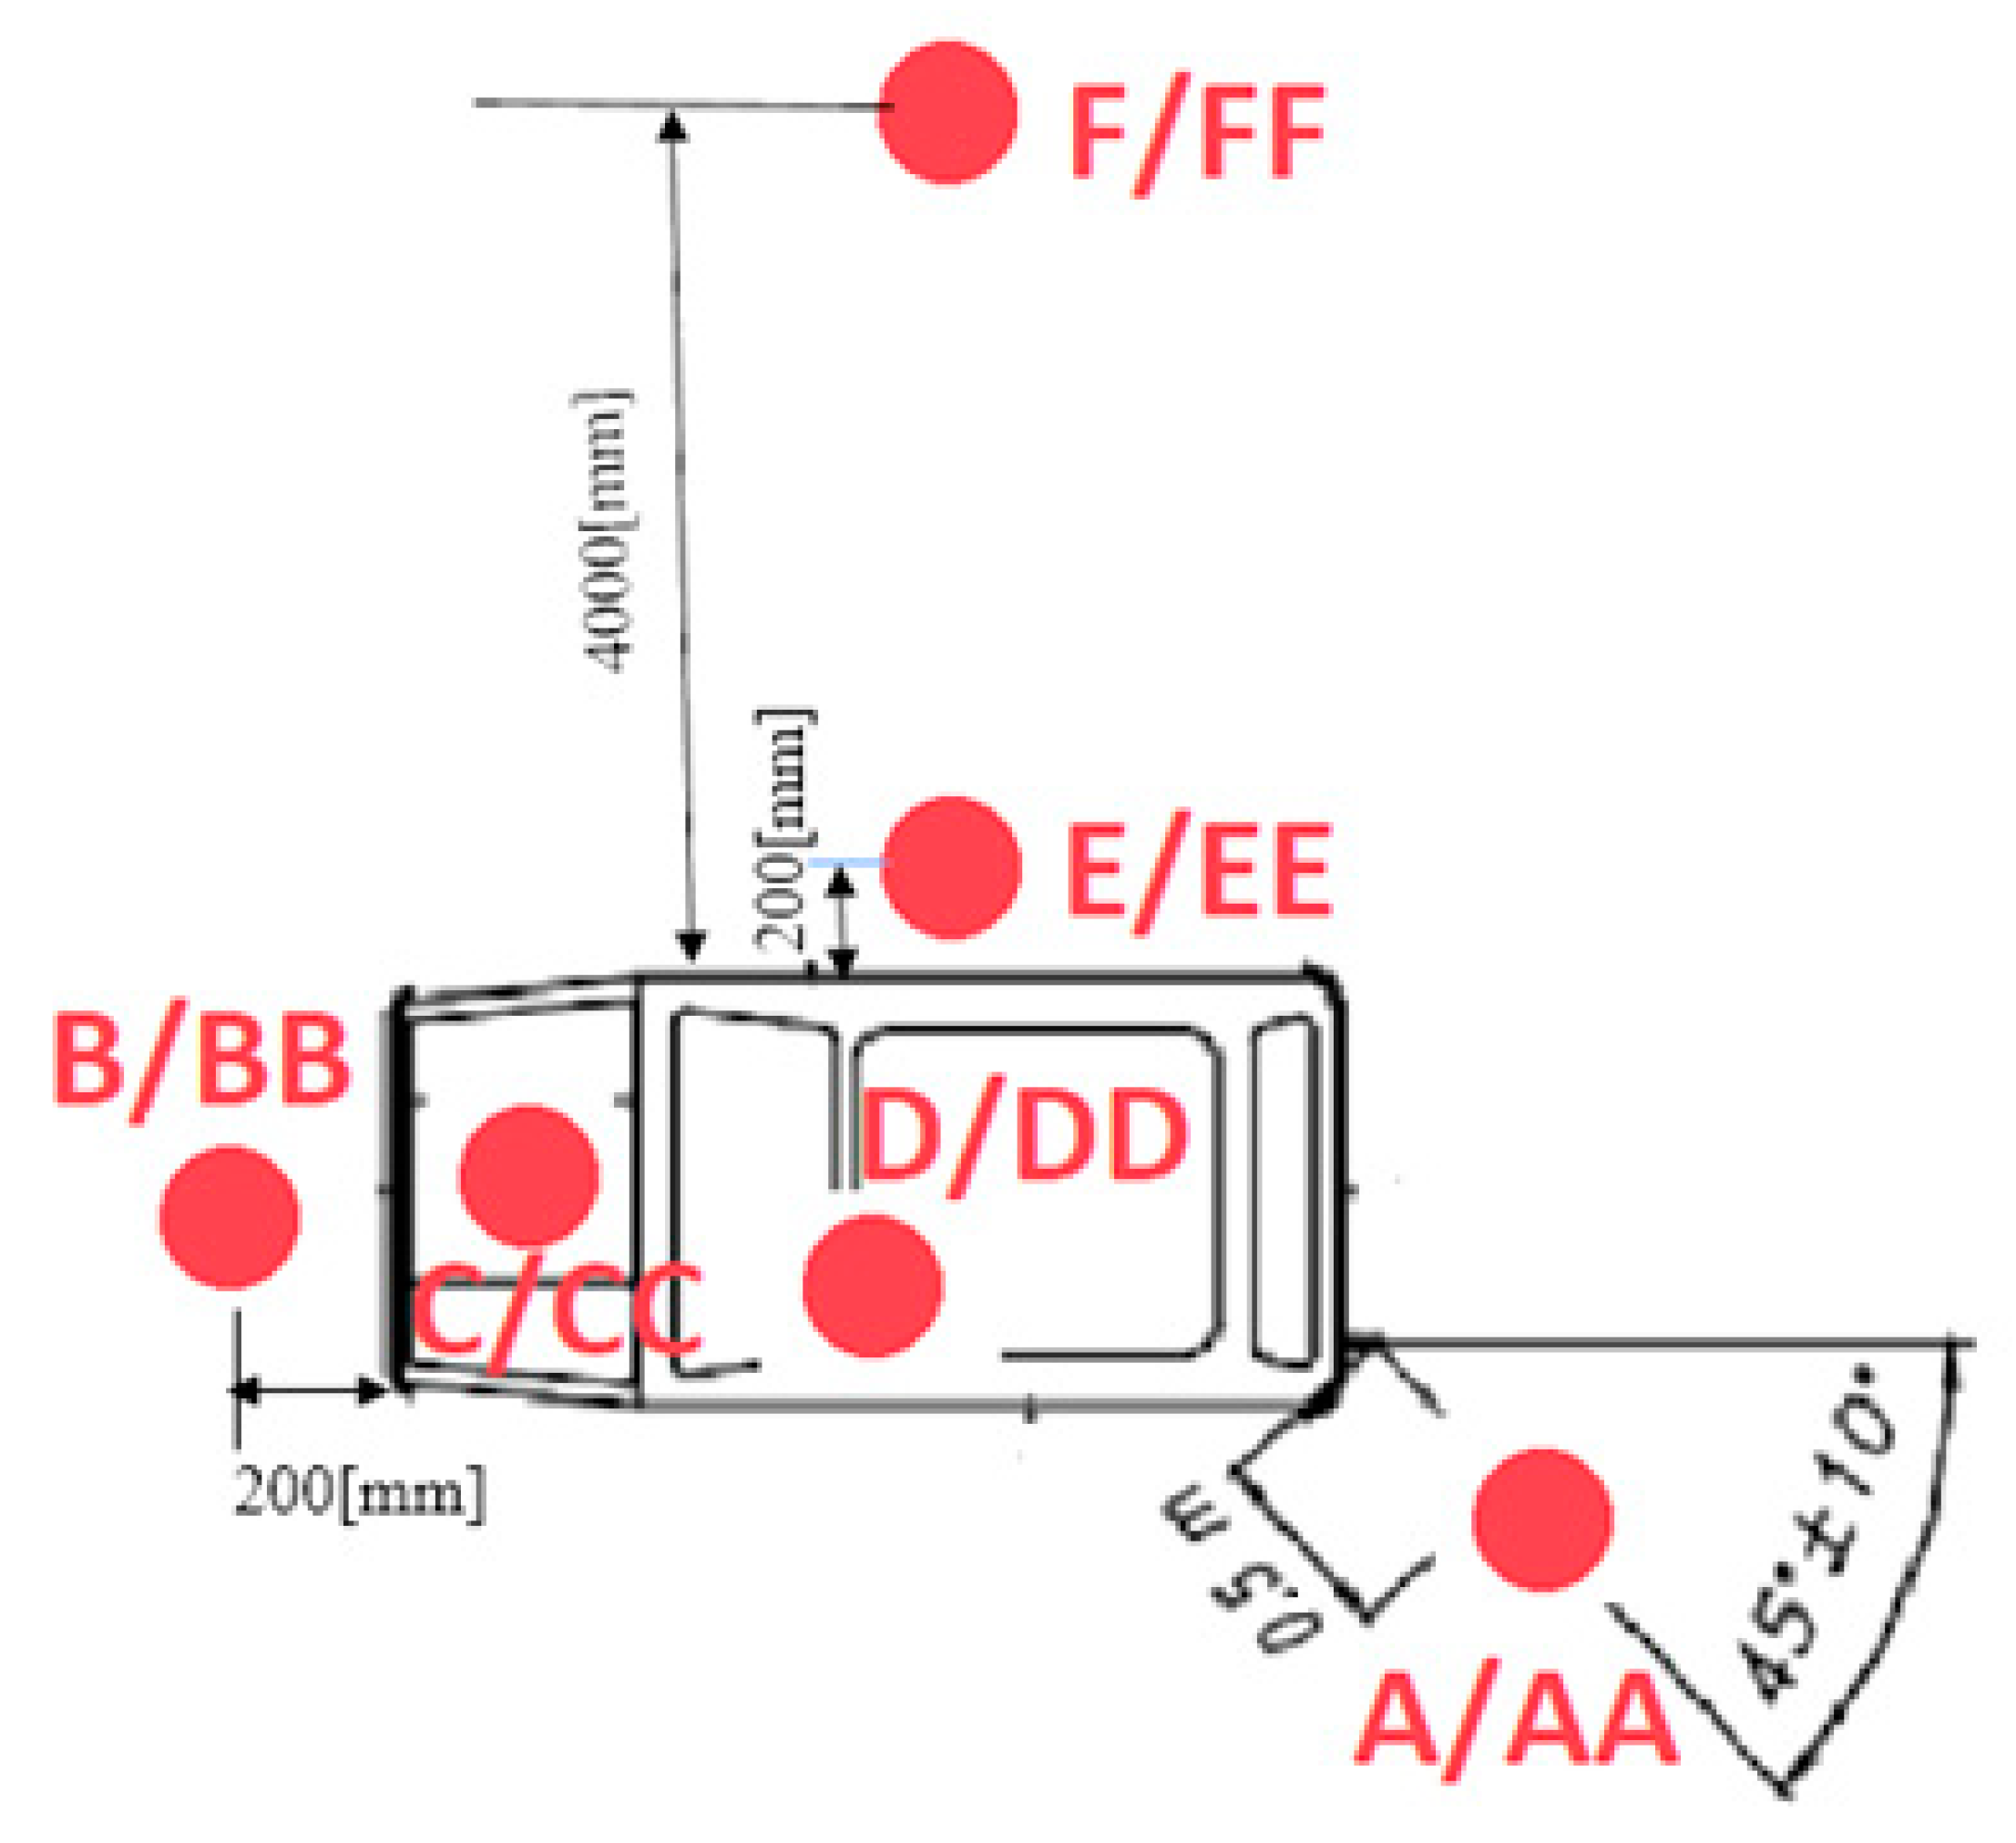
  • Measurement A—measurement of the noise level from the exhaust system at idle speed;
  • Measurement AA—measurement of the noise level from the exhaust system at maximum engine revolutions (75% of rotational speed);
  • Measurement B—measurement of the noise level at the front of the vehicle at idle speed;
  • Measurement BB—measurement of the noise level at the front of the vehicle at maximum engine speed;
  • Measurement C—measurement of the noise level above the engine compartment at idle speed;
  • Measurement CC—measurement of the noise level above the engine compartment at maximum engine speed;
  • Measurement D—measurement of the noise level inside the vehicle at idle speed;
  • Measurement DD—measurement of the noise level inside the vehicle at maximum engine speed;
  • Measurement E—measurement of the noise level 200 mm away from the vehicle at idle speed;
  • Measurement EE—measurement of the noise level 200 mm away from the vehicle at maximum engine speed;
  • Measurement F—measurement of noise level 4000 mm away from the vehicle at idle speed;
  • Measurement FF—noise level measurement 4000 mm away from the vehicle at maximum engine speed.
To eliminate measurement errors, three measurements were taken at each measurement point, and then the average was calculated. During measurement, atmospheric conditions were favorable, i.e., there was no rain or snowfall [21]. The results of the noise level tests were related to the limit value specified in the EU regulation from 2002 [27].
The base statistics—minimum, maximum, arithmetic average, standard deviation, and median—were used. The Shapiro–Wilk test was used to check the normality of the distribution of the analyzed data, and the Pearson linear correlation coefficient (n = 13) was used to identify relationships between the above-mentioned variables [10]. A scatterplot for groups of three variables was used. As part of the analysis of variance, multiple post hoc comparison tests (Tukey’s test) were also used as a result of some means differing significantly from the others. The test’s probability (p < 0.05) was considered significant. The Statistica 12 software (StatSoft Poland, StatSoft, Inc., Tulsa, OK, USA) was used for statistical analysis.

3. Results

Figure 2 shows a graph illustrating the measurements taken at the exhaust outlet at idle speed. The chart shows that a vehicle manufactured in 2020 generated the most noise, as much as 59.9 dB. The quietest vehicle—considering all the tested vehicles—was produced in 2022. This vehicle generated only 58.1 dB of noise. The average value of all measurements is 58.8 dB, while the standard deviation is 0.51 dB (Table 2).
Figure 3 shows the measurements taken at the exhaust outlet at maximum engine speed. As shown in the figure below, the maximum noise level identified was 89.2 dB, with a permissible 96 dB as specified in the EU regulation from 2002 [27]. This level was generated by a vehicle with a mileage of 22,453 km that was manufactured in 2020. The lowest noise level belongs to a vehicle manufactured in 2022, and this value is 83.9 dB. The average value of the measurements is 86.6 dB. The greatest standard deviation occurred at this point and was 1.79 dB (Table 2).
Figure 4 shows the individual measurements taken at the front of the car at idle speed (approximately 200 mm from the vehicle). In this case, the measurements were taken with the combustion engine idling. The chart shows that the loudest vehicle was produced in 2022 and generated a noise level of 67.4 dB. The quietest vehicle was produced in 2021 and generated a noise level of 65.2 dB. It was calculated that the average value of the noise levels from all measurements is 66.7 dB (Table 2). The highest value of noise intensity was achieved by a vehicle that traveled only 600 km, but the quietest vehicle had a mileage of 10,121 km.
At measurement point “BB,” as shown in Figure 5, a vehicle produced in 2022 achieved the lowest noise level of 92.1 dB, and the loudest noise level, at 94.2 dB, was emitted by a car manufactured in 2020 with a mileage of 34,920 km. The average noise level was 93.5 dB (Table 2).
Figure 6 shows the noise measurements taken at measurement point “C,” that is, at the engine compartment above the drive unit at the minimum amount of evolutions for the combustion engine. Measurements showed that the loudest vehicle was a car produced in 2022, and the noise level of this car was 75.2 dB with a mileage of only 10 km. A car with a mileage of 22,100 km emitted the lowest level of 73.2 dB. The average value of the noise level measurements was 74.2 dB (Table 2).
Figure 7 includes the measurements taken at the “CC” measurement point above the engine compartment at the maximum amount of engine revolutions, where the permissible value is 96 dB. The highest noise value of 101.8 dB was generated by a vehicle manufactured in 2022 with a mileage of 15 km. On the other hand, the car with the greatest mileage, 60,432 km, turned out to be the quietest, as it emitted noise at the level of 98.3 dB. Similarly, the greatest averages of the noise levels of researched vehicles were 99.7 dB and 99.6 dB at a low standard deviation of 0.95 dB.
Figure 8 shows the measurements of noise levels inside the vehicle in the driver’s position with the internal combustion engine at an idle speed. The highest noise value recorded is 47.6 dB at a mileage of 60,432 km, in a vehicle produced in 2021. A car from 2022 with a mileage of 15 km generated the lowest noise value at the level of 45.4 dB. The lowest average value was 46.1 dB and the median was 45.9 dB.
Figure 9 shows results that varied significantly. The highest noise was generated by a vehicle manufactured in 2021, and its measured value was 66.2 dB. The lowest noise was recorded in a car manufactured in 2022 at only 63 dB. It was also calculated that the average value of the noise levels of all vehicles oscillates around 64.3 dB. The vehicle with the greatest mileage, 60,432 km, generated the most noise. The noise intensity in this case was 66.2 dB. A car with a mileage of 10 km turned out to be the quietest, at the sound intensity level of 63 dB.
Figure 10 presents a summary of the results of noise level measurements, which were carried out at a distance of 200 mm next to the vehicle at idle speed. According to the data, the highest noise level was achieved by a vehicle manufactured in 2020, and the noise level was equal to 62.4 dB with a mileage of 22,100 km. The lowest noise level, only 61.3 dB, was generated by the vehicle produced in 2022 with a low mileage of 15 km. It was calculated that the average value of the noise levels of all vehicles amounted to 61.9 dB, (Table 2).
Figure 11 shows a graph illustrating the noise level measurements taken with the device placed 200 mm next to the vehicle at maximum engine speed. The highest measured noise level was 78.5 dB with a mileage equal to 60,432 km. This result was achieved by a vehicle produced in 2021. The lowest recorded noise value was 77.1 dB, generated by a vehicle from 2022 with a mileage of 15 km. The average measurement of noise levels was 77.7 dB (Table 2).
The results (Figure 12) of the noise measurements at the measuring point located 4000 mm next to the vehicle at idle speed showed a highest measured value of 57.9 dB, which was generated by a vehicle manufactured in 2021. The lowest noise level amounted to 56.6 dB and was produced by a vehicle manufactured in 2022. A vehicle with a mileage of 60,432 km generated the highest noise level, while the lowest noise level was generated by a car with a mileage of 15 km. The average of the measurements was 57.2 dB (Table 2).
Figure 13 summarizes the results of measurements taken at a distance of 4000 mm from the side of the vehicle at maximum engine speed. The loudest vehicle, generating 80.1 dB, was produced in 2020, while the quietest vehicle, emitting 79.2 dB, was produced in 2022.
The highest noise level, 80.1 dB, was obtained from a vehicle with a mileage of 40,211 km. The lowest noise was produced by a vehicle with a mileage of 10 km and reached a level of 79.2 dB. The average value of all measurements was 79.7 dB at the lowest standard deviation of 0.26 dB (Table 2).
In Figure 14a,b, a scatterplot of the measurement noise level at the “CC” measurement point, above the engine, confirmed that all cars produced in 2022 with mileages below 10,000 km exceeded the level of 100 dB. At measurement point “D,” inside the vehicle, cars produced in 2020 and 2021 with mileages of more than 10,000 km exceeded the level of 40 dB.
Post hoc studies showed that statistically significant differences in noise measurements occurred in 2020–2022. For the “AA” variable, outside the cars, results were significantly different between vehicles manufactured in the years 2020 and 2022, as well as between those manufactured in the years 2021 and 2022. For the “DD” variable, inside of the cars, the results from the years 2020 and 2022 were also significantly different (Figure 15).
Table 3 presents correlations between the variables covering the 12 test points and vehicle mileage. High correlations between mileage and measurement points “F” (0.936536), next to the vehicle at idle speed, and “BB” (0.748879), at the front of vehicle at maximum engine speed, were identified from the statistical analysis. A positive correlation means that, as mileage increases, so does the noise level.

4. Discussion

The measurement of noise emitted by vehicles remains important in the context of eliminating its sources, as it may affect the deterioration of the environments in which people live. This research showed that a cars’ manufacturing year, especially for those produced from 2020 to 2021, and the distance traveled by a vehicle with average mileages above 10,000 km have an impact on changes to the noise levels generated by the vehicle. Not without significance are the measurements of noise levels, which showed that the highest noise level occurred in the engine compartment at 101.8 dB, from a vehicle with a mileage of 15 km that was manufactured in 2022. Wróbel [29] obtained lower noise levels inside vehicles during their tests, but Chiatti et al. [30] showed the dependence of noise level on combusted fuel with an indication of biodiesel. The highest average value of noise levels was confirmed at 99.7 dB, above the engine compartment at the maximum engine speed, exceeding the allowable level. The lowest average value of noise levels was 46.1 dB, inside the vehicle at idle speed, and differences in the research results were confirmed. According to Lee and Nasiri [31], the dominant irritating noise component covers engine sound frequencies in the range of 20 to 200 Hz. Ambroszko [32] has shown that the main noise sources are characterized by their location in the car and the spectra of the sound pressure level. The high noise levels of 89.2 and 94.2 dB also occurred in the driver’s cabin and at the front of vehicles produced in 2020 with mileages above 10,000 km. In this case, the long and intensive use of the vehicle significantly affects the acoustic sensation inside the vehicle, a fact that was confirmed by the high correlation (0.7) between the noise levels and the mileages of the cars. Some researchers [33] showed a correlating relationship between engine noise and rotating speed, enabling the control of the engine sound by using active control systems. According to Lee [34], the frequency components of engine noise are correlated with the rotational speed of the engine crankshaft and its harmonics.
Significant differences in noise emission intensities occurred mainly between vehicles produced in 2020 and 2022 at points outside of the vehicles. On the other hand, the difference in the noise levels in the driver’s cabin between the loudest and the quietest vehicles was 3.2 dB. During a noise emission test, Sup Lee et al. [35] also showed different results. Similarly, the highest standard deviation, 1.79 dB, showed a significant dispersion of the results at the outside point. This may indicate changes in amplitude sound signal [36], which are produced by rapid periodic changes over time [37].
According to Miloradović et al. [28], surfaces of the engine and underbody of the vehicle generate vibrations and sound waves that constitute noise. This phenomenon may be influenced by material aging clearances between elements and the deformation of vehicle parts as a result of weather conditions [36]. Yu et al. [38] showed that noise reduction in these parts of the vehicle can be achieved by using acoustic materials such as fiber, foam, and polyurethane. Manufacturers, to some extent, minimize undesirable phenomena related to noise emission by installing various types of noise-absorbing elements, e.g., the soundproofing of door upholstery, of the engine bulkhead wall, and of the floor. However, they do not install them in all sensitive places exposed to the penetration of noise outside or inside the vehicle as a result of the significant costs of these operations. Another solution may be the use of either “quiet surfaces” that reduce noise by 15 dB [39] or an adaptive filter with an optimal weight vector for the active control of engine noise [35]. The final reduction in noise inside a motor vehicle above the standard is, therefore, the result of several factors [40]. Hence, in the mentioned case, it would be advisable to use a thermal screen in the form of a thin layer of extruded aluminum. Similarly, Noh [41] used a solution with extruded aluminum. Generally, to minimize the level of noise emitted by internal combustion engines, the solution, in short, is a gradual increase in the number of electric cars in use. Klöckner et al. [42] have shown that, at the micro level, electric cars benefit the local environment as a result of their lack of local emissions and low noise levels. However, transportation is certainly needed during electrification, and electric vehicles are inherently an intensively exploited resource; thus, it is not certain whether the necessary resources will be available to meet the increase in demand [43].

5. Conclusions

This study provides data on the levels of noise emitted by vehicles with identical parameters manufactured in 2020–2022. The highest arithmetic average noise value in the tested vehicles was 99.7 dB and came from above the engine, exceeding the permissible noise level. It is worth emphasizing that statistically significant differences in the noise measurements of the tested cars occurred between 2020 and 2022, as well as 2021 and 2022. In turn, the noise levels increased in vehicles mainly produced between 2020 and 2021 with mileages of over 10,000 km. This is related to the high correlation (0.7) between noise level and mileage in the tested cars, which showed that long-term and intensive use of the vehicle significantly affects the noise level.
The loudest place in a passenger car turned out to be above the engine compartment, where noise levels oscillated around 100 dB with mileages of less than 10,000 km. This proves the impact of the moving or mechanical parts of a vehicle on noise, as well as the need for noise reduction solutions developed by vehicle manufacturers. Our hope for the reduction in noise levels in the future is an increase in the use of electric vehicles, which would have a positive impact on the local environment.

Author Contributions

Conceptualization, G.P. and A.R.; methodology, G.P.; software, E.M.; validation, C.T., O.I. and M.B.; formal analysis, G.P.; investigation, G.P.; resources, A.R.; data curation, G.P.; writing—original draft preparation, G.P. and A.R.; writing—review and editing, E.M. and C.T.; visualization, O.I.; supervision, G.P. All authors have read and agreed to the published version of the manuscript.

Funding

This research received no external funding.

Institutional Review Board Statement

Not applicable.

Informed Consent Statement

Not applicable.

Data Availability Statement

Not applicable.

Acknowledgments

The authors of this article would like to thank the Authorized Service Centre for making this research possible.

Conflicts of Interest

The authors declare no conflict of interest.

References

  1. Krishnamurthy, N.; Hansen, J.H.L. Car noise verification and application. Int. J. Speech Technol. 2014, 17, 167–181. [Google Scholar] [CrossRef]
  2. Council Directive 70/157/EEC of 6 February 1970 on the Approximation of the Laws of the Member States Relating to the Permissible Sound Level and the Exhaust System of Motor Vehicles. Available online: https://eur-lex.europa.eu/legal-content/EN/ALL/?uri=CELEX%3A31970L0157 (accessed on 1 February 2023).
  3. Directive 97/24/EC of the European Parliament and of the Council of 17 June 1997 on Certain Components and Characteristics of Two or Three-Wheel Motor Vehicles. Available online: https://eur-lex.europa.eu/legal-content/en/ALL/?uri=CELEX%3A31997L0024 (accessed on 1 February 2023).
  4. Regulation (EU) No 540/2014 of the European Parliament and of the Council of 16 April 2014 on the Sound Level of Motor Vehicles and of Replacement Silencing Systems and Amending Directive 2007/46/EC and Repealing Directive 70/157/EEC Text with EEA Relevance. Available online: https://eur-lex.europa.eu/legal-content/EN/TXT/?uri=celex%3A32014R0540 (accessed on 27 March 2023).
  5. Directive 2001/43/EC of the European Parliament and of the Council of 27 June 2001 Amending Council Directive 92/23/EEC Relating to Tires for Motor Vehicles and Their Trailers and Their Fitting. Available online: https://eur-lex.europa.eu/legal-content/en/TXT/?uri=CELEX%3A32001L0043 (accessed on 1 February 2023).
  6. Regulation (EU) 2020/740 of the European Parliament and of the Council of 25 May 2020 on the Labelling of Tyres with Respect to Fuel Efficiency and Other Parameters Amending Regulation (EU) 2017/1369 and Repealing Regulation (EC) No 1222/2009. Available online: https://eur-lex.europa.eu/legal-content/EN/TXT/?uri=CELEX%3A32020R0740 (accessed on 1 February 2023).
  7. Environmental Protection Act. 21 April 2001 (Journal of Laws 2020 Pos. 1219). Available online: https://leap.unep.org/countries/pl/national-legislation/environment-protection-act (accessed on 1 February 2023).
  8. Ordinance of the Minister of the Environment of 15 October 2013 on the Permissible Noise Levels in the Environment (Journal Laws 2014 Item 112). Available online: https://isap.sejm.gov.pl/isap.nsf/DocDetails.xsp?id=WDU20140000112 (accessed on 1 May 2023). (In Polish)
  9. Sitepu, H.M.; Rahim, M.A.; Sembiring, M.T. Used tires recycle management and processing: A review. IOP Conf. Ser. Mater. Sci. Eng. 2019, 801, 012116. [Google Scholar] [CrossRef]
  10. Przydatek, G.; Budzik, G.; Janik, M. Effectiveness of selected issues related to used tyre management in Poland. Environ. Sci. Pollut. 2022, 29, 31467–31475. [Google Scholar] [CrossRef]
  11. Chen, H.; Samarasinghe, P.; Abhayapala, T.D. In car noise field analysis and multi-zone noise cancellation quality estimation. In Proceedings of the 2015 Asia-Pacific Signal and Information Processing Association Annual Summit and Conference (APSIPA), Hong Kong, China, 16–19 December 2015; pp. 773–778. [Google Scholar]
  12. Li, T.; Wang, M.; He, Y.; Wang, N.; Yang, J.; Ding, R.; Zhao, K. Vehicle engine noise cancellation based on a multi-channel fractional-order active noise control algorithm. Machines 2022, 10, 670. [Google Scholar] [CrossRef]
  13. Camacho, A.; Pinero, G.; De Diego, M.; Gonzalez, A. Exploring roughness perception in car engine noises through complex cepstrum analysis. Acta Acust. 2008, 94, 130–140. [Google Scholar] [CrossRef]
  14. Meyer, R.; Benetto, E.; Igos, E.; Lavandier, C. Analysis of the different techniques to include noise damage in life cycle assessment. A case study for car tires. Int. J. Life Cycle Assess. 2017, 22, 744–757. [Google Scholar] [CrossRef]
  15. Cheer, J. Active sound control in the automotive interior. In Future Interior Concepts; Springer: Cham, Switzerland, 2021. [Google Scholar] [CrossRef]
  16. Kim, S.J.; Lee, S.K. Prediction of structure-borne noise caused by the powertrain on the basis of the hybrid transfer path. Proc. Inst. Mech. Eng. Part. D J. Autom. Eng. 2009, 23, 485–502. [Google Scholar] [CrossRef]
  17. Fritschi, L.; Brown, L.; Kim, R.; Schwela, D.; Kephalopolous, S. Burden of Disease from Environmental Noise: Quantification of Healthy Years Life Lost in Europe; World Health Organisation: Geneva, Switzerland, 2011; ISBN 9789289002295. [Google Scholar]
  18. Wellmann, T.; Govindswamy, K.; Tomazic, D. Impact of the Future Fuel Economy Targets on Powertrain, Driveline and Vehicle NVH Development. SAE Int. J. Veh. Dyn. Stab. NVH 2017, 1, 428–438. [Google Scholar] [CrossRef]
  19. Qin, Y.; Tang, X.; Jia, T.; Duan, Z.; Zhang, J.; Li, Y.; Zheng, L. Noise and vibration suppression in hybrid electric vehicles: State of the art and challenges. Renew. Sustain. Energy Rev. 2020, 124, 109782. [Google Scholar] [CrossRef]
  20. Judd, S.L.; Overbye, T.J. An evaluation of PHEV contributions to power system disturbances and economics. In Proceedings of the 2008 40th North American Power Symposium, Calgary, AB, Canada, 28–30 September 2008. [Google Scholar]
  21. Taymaz, I.; Benli, M. Emissions and fuel economy for a hybrid vehicle. Fuel 2014, 115, 812–817. [Google Scholar] [CrossRef]
  22. Ibarra, D.; Ramírez-Mendoza, R.; López, E. Noise emission from alternative fuel vehicles: Study case. Appl. Acoust. 2017, 118, 58–65. [Google Scholar] [CrossRef]
  23. Directive 2002/49/EC of the European Parliament and of the Council of 25 June 2002 Relating to the Assessment and Management of Environmental Noise. Available online: https://eur-lex.europa.eu/legal-content/EN/TXT/PDF/?uri=CELEX:32002L0049&from=EN (accessed on 27 March 2023).
  24. EN IEC 60942:2018-0 Electroacoustics—Acoustic Calibrators. Available online: https://standards.iteh.ai/catalog/standards/clc/bf76110c-d49e-497a-a87a-b48bcfbd2cba/en-iec-60942-2018 (accessed on 30 April 2023).
  25. Regulation of the Minister of Infrastructure of 10 February 2006 on Detailed Requirements for Stations Conducting Technical Inspections of Vehicles (Journal of Laws of 2006, No. 40, Item 275). Available online: https://isap.sejm.gov.pl/isap.nsf/download.xsp/WDU20060400275/O/D20060275.pdf (accessed on 28 February 2023). (In Polish)
  26. Ferrari, C.L.; Cheer, J.; Mautone, M. Investigation of an engine order noise cancellation system in a super sports car. Acta Acust. 2023, 7, 1. [Google Scholar] [CrossRef]
  27. Regulation of the Minister of Infrastructure of 31 December 2002 on the Technical Conditions of Vehicles and the Scope of Their Correct Standard (Journal of Laws of 2003, No. 32, Item 262). Available online: https://isap.sejm.gov.pl/isap.nsf/DocDetails.xsp?id=wdu20030320262 (accessed on 1 February 2023). (In Polish)
  28. Miloradović, D.; Glišović, J.; Lukić, J. Regulations on Road Vehicle Noise–Trends and Future Activities. Mobil. Veh. Mech. 2017, 43, 57–72. [Google Scholar] [CrossRef]
  29. Wróbel, A.; Łazarz, B.; Czech, P.; Matyja, T.; Witaszek, M. Effect of selected operating conditions on passenger car noise (Wpływ wybranych warunków eksploatacyjnych na hałas samochodów osobowych). Tech. Transp. Szyn. 2015, 22, 1696–1702. [Google Scholar]
  30. Chiatti, G.; Chiavola, O.; Palmieri, F. Vibration and acoustic characteristics of a city-car engine fueled with biodiesel blends. Appl. Energy 2017, 185, 664–670. [Google Scholar] [CrossRef]
  31. Lee, Y.; Nasiri, A. Real Time Active Noise Control of Engine Booming in Passenger Vehicles; SAE Technical Paper; 2007-01-0411; SAE: Warrendale, PA, USA, 2007; 2007-01-0411. [Google Scholar]
  32. Ambroszko, W. Sources of noise in automotive vehicles. Studies of noise in road traffic in a selected locality and assessment of its impact on safety (Źródła hałasu w pojazdach samochodowych. Badania hałasu w ruchu drogowym w wybranej miejscowości i ocena jego wpływu na bezpieczeństwo). AUTOBUSY—Tech. Eksploat. Syst. Transp. 2019, 24, 120–127. (In Polish) [Google Scholar]
  33. Samarasinghe, P.N.; Zhang, W.; Abhayapala, T.D. Recent Advances in active noise control inside automobile cabins: Toward quieter cars. IEEE Signal. Process. Mag. 2016, 33, 61–73. [Google Scholar] [CrossRef]
  34. Lee, S.K. Objective Evaluation of Interior Sound Quality in Passenger Cars during Acceleration. J. Sound Vib. 2008, 310, 149–168. [Google Scholar] [CrossRef]
  35. Lee, S.K.; Lee, S.; Back, J.; Shin, T. A new method for active cancellation of engine order noise in a passenger car. Appl. Sci. 2018, 8, 1394. [Google Scholar] [CrossRef]
  36. Xiong, J. A study on psychoacoustics-based high-mileage automobile vibration and noise robustness evaluation modeling. Int. J. Interact. Des. Manuf. IJIDeM 2022. [Google Scholar] [CrossRef]
  37. Fastl, H.; Zwicker, E. Psycho-Acoustics: Facts and Models, 3rd ed.; Springer: Berlin, Germany, 2007; p. 417. [Google Scholar]
  38. Yu, L.; Dai, S.; Wang, P. Design of noise reduction method for light bus. Automob. Technol. Mater. 2015, 30, 33–37. [Google Scholar]
  39. Sandberg, U.; Goubert, L. Persuade—A European project for exceptional noise reduction by means of poroelastic road surfaces. In Proceedings of the 40th International Congress and Exposition on Noise Control Engineering 2011 (INTER-NOISE 2011), Osaka, Japan, 4–7 September 2011; pp. 673–684. [Google Scholar]
  40. Pilewski, S.; Łazarz, B.; Czech, P.; Witaszek, K.; Witaszekm, M. Driving comfort of selected passenger cars as an effect of noise recorded inside the vehicle (Komfort jazdy wybranymi samochodami osobowymi jako skutek hałasu rejestrowanego wewnątrz pojazdu). Tech. Transp. Szyn. 2015, 22, 1226–1230. (In Polish) [Google Scholar]
  41. Noh, H.M. Improvement of noise reduction performance in bellows using multilayer perforated panels. Adv. Mech. Eng. 2021, 13, 1–11. [Google Scholar] [CrossRef]
  42. Klöckner, C.A.; Nayum, A.; Mehmetoglu, M. Positive and negative spillover effects from electric car purchase to car use. Transp. Res. Part D Transp. Environ. 2013, 18, 32–38. [Google Scholar] [CrossRef]
  43. Richter, J.L. A circular economy approach is needed for electric vehicles. Nat. Electron. 2022, 5, 5–7. [Google Scholar] [CrossRef]
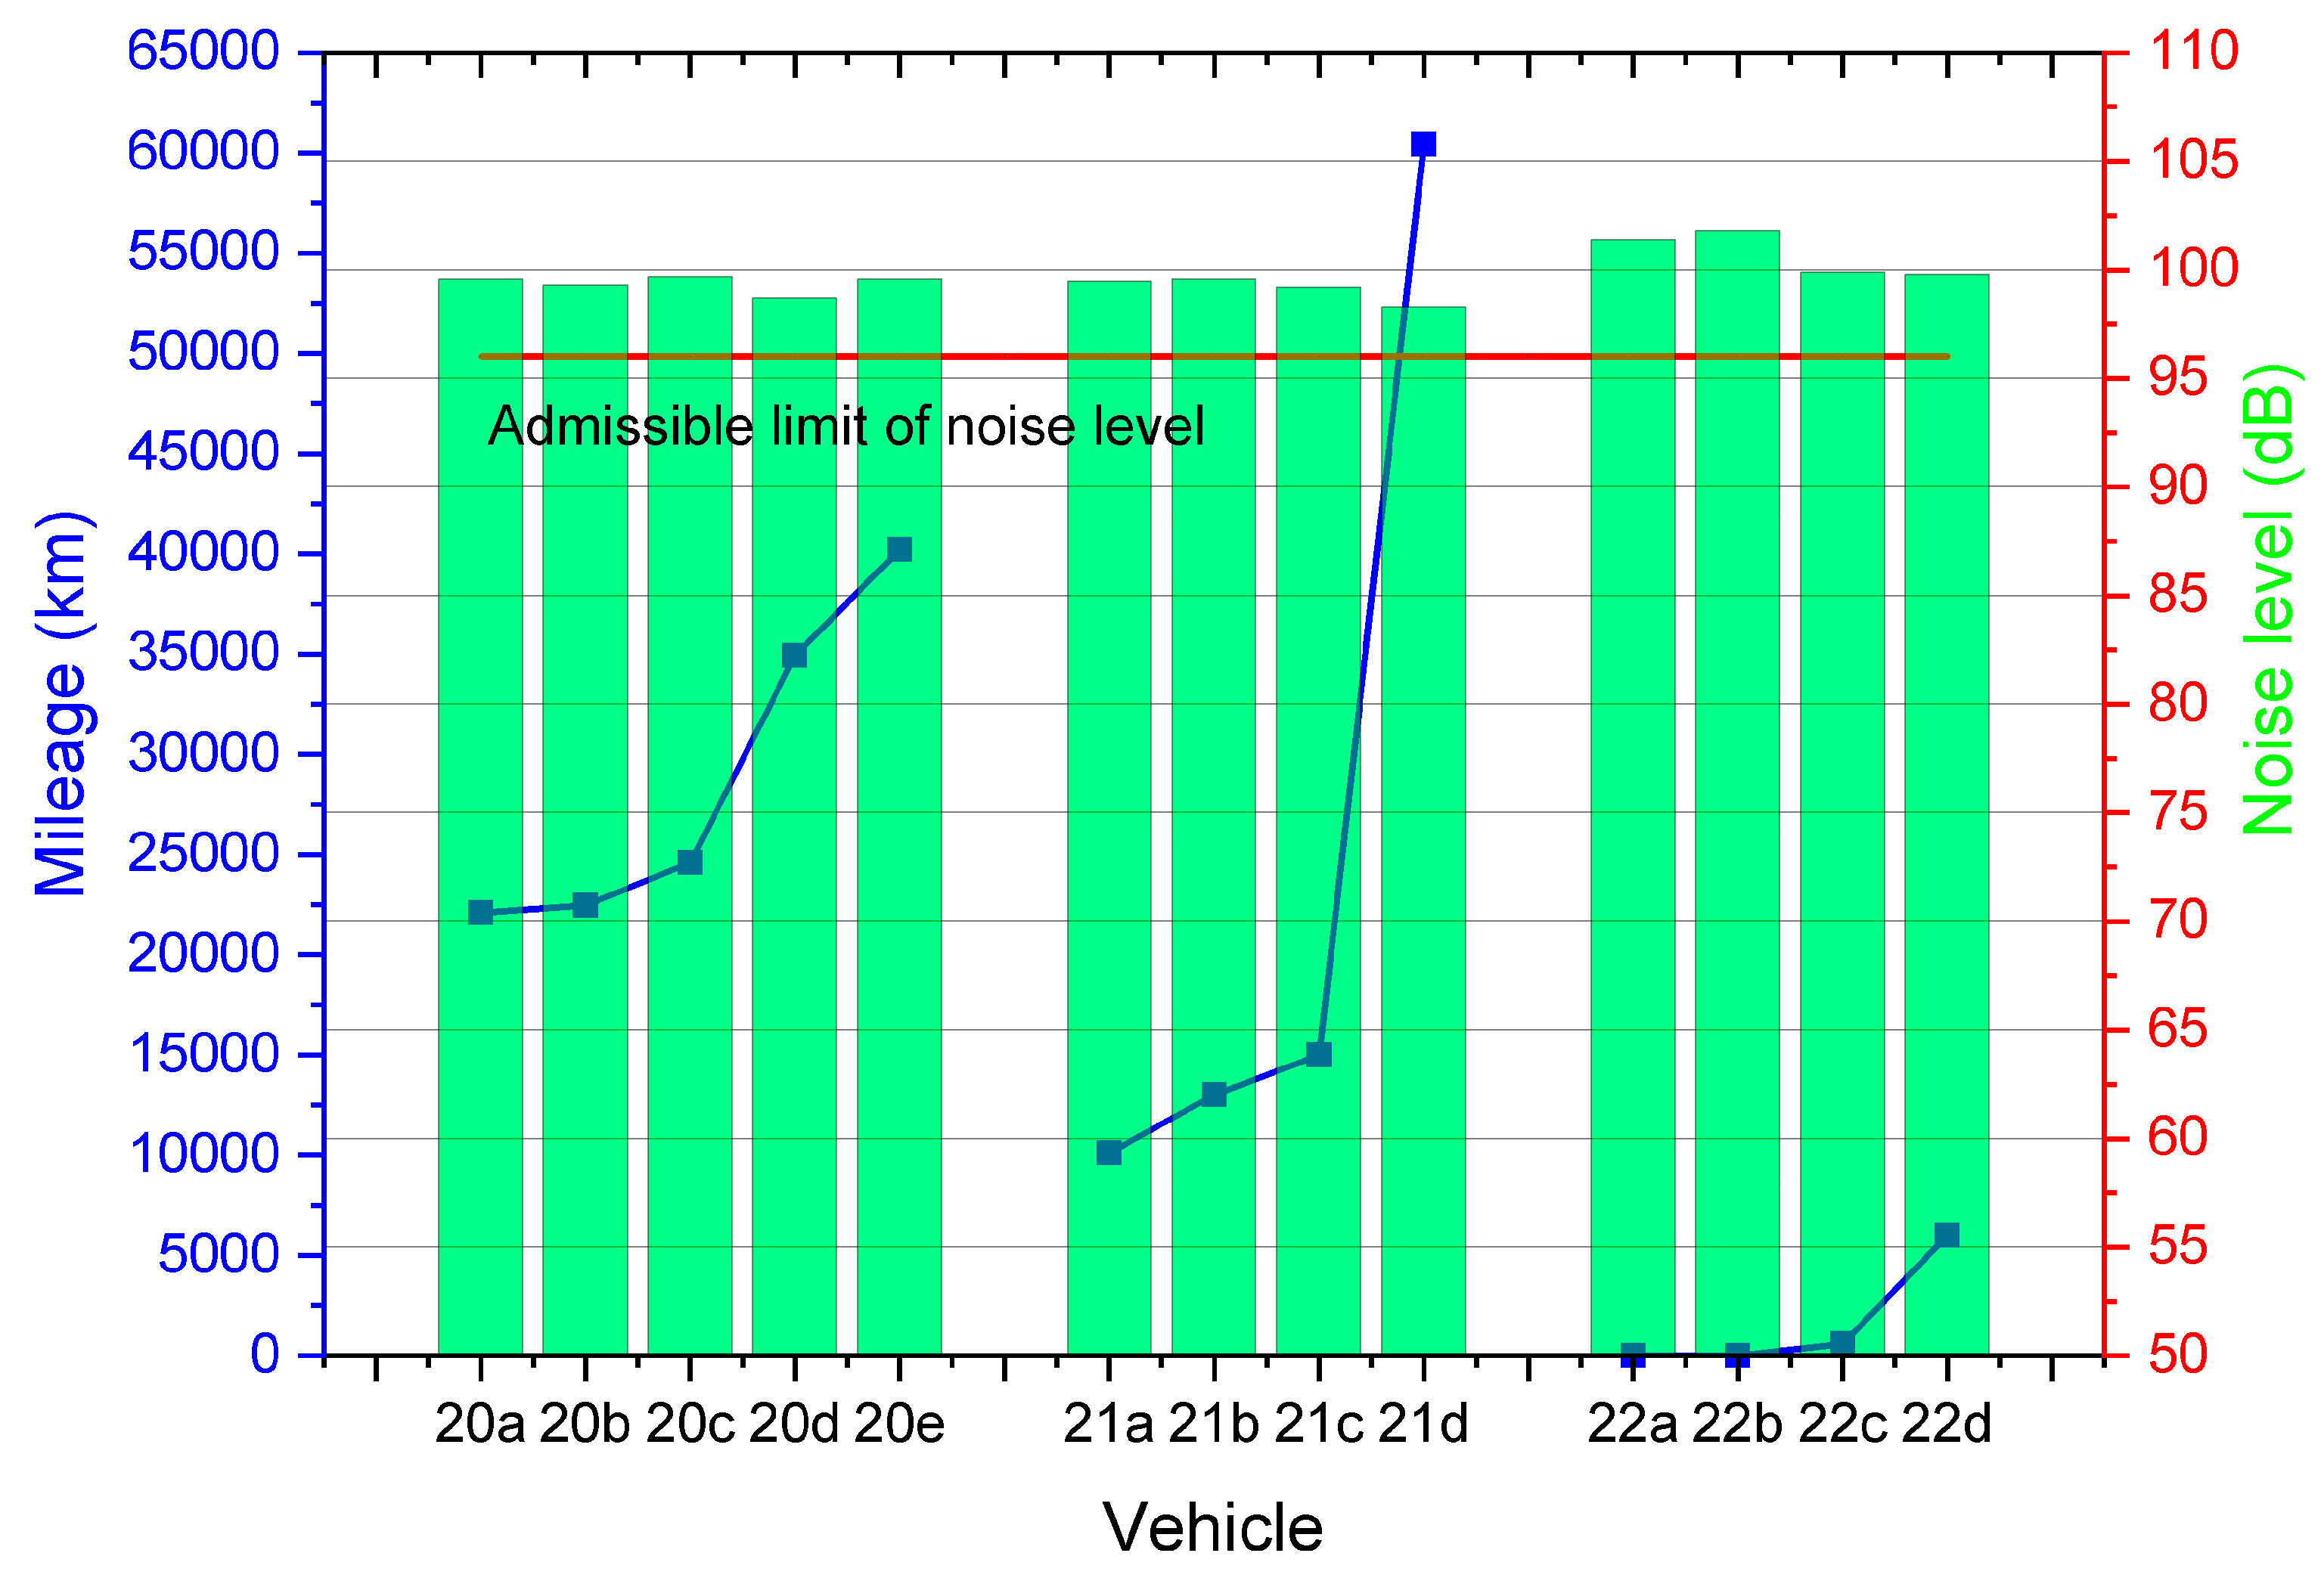
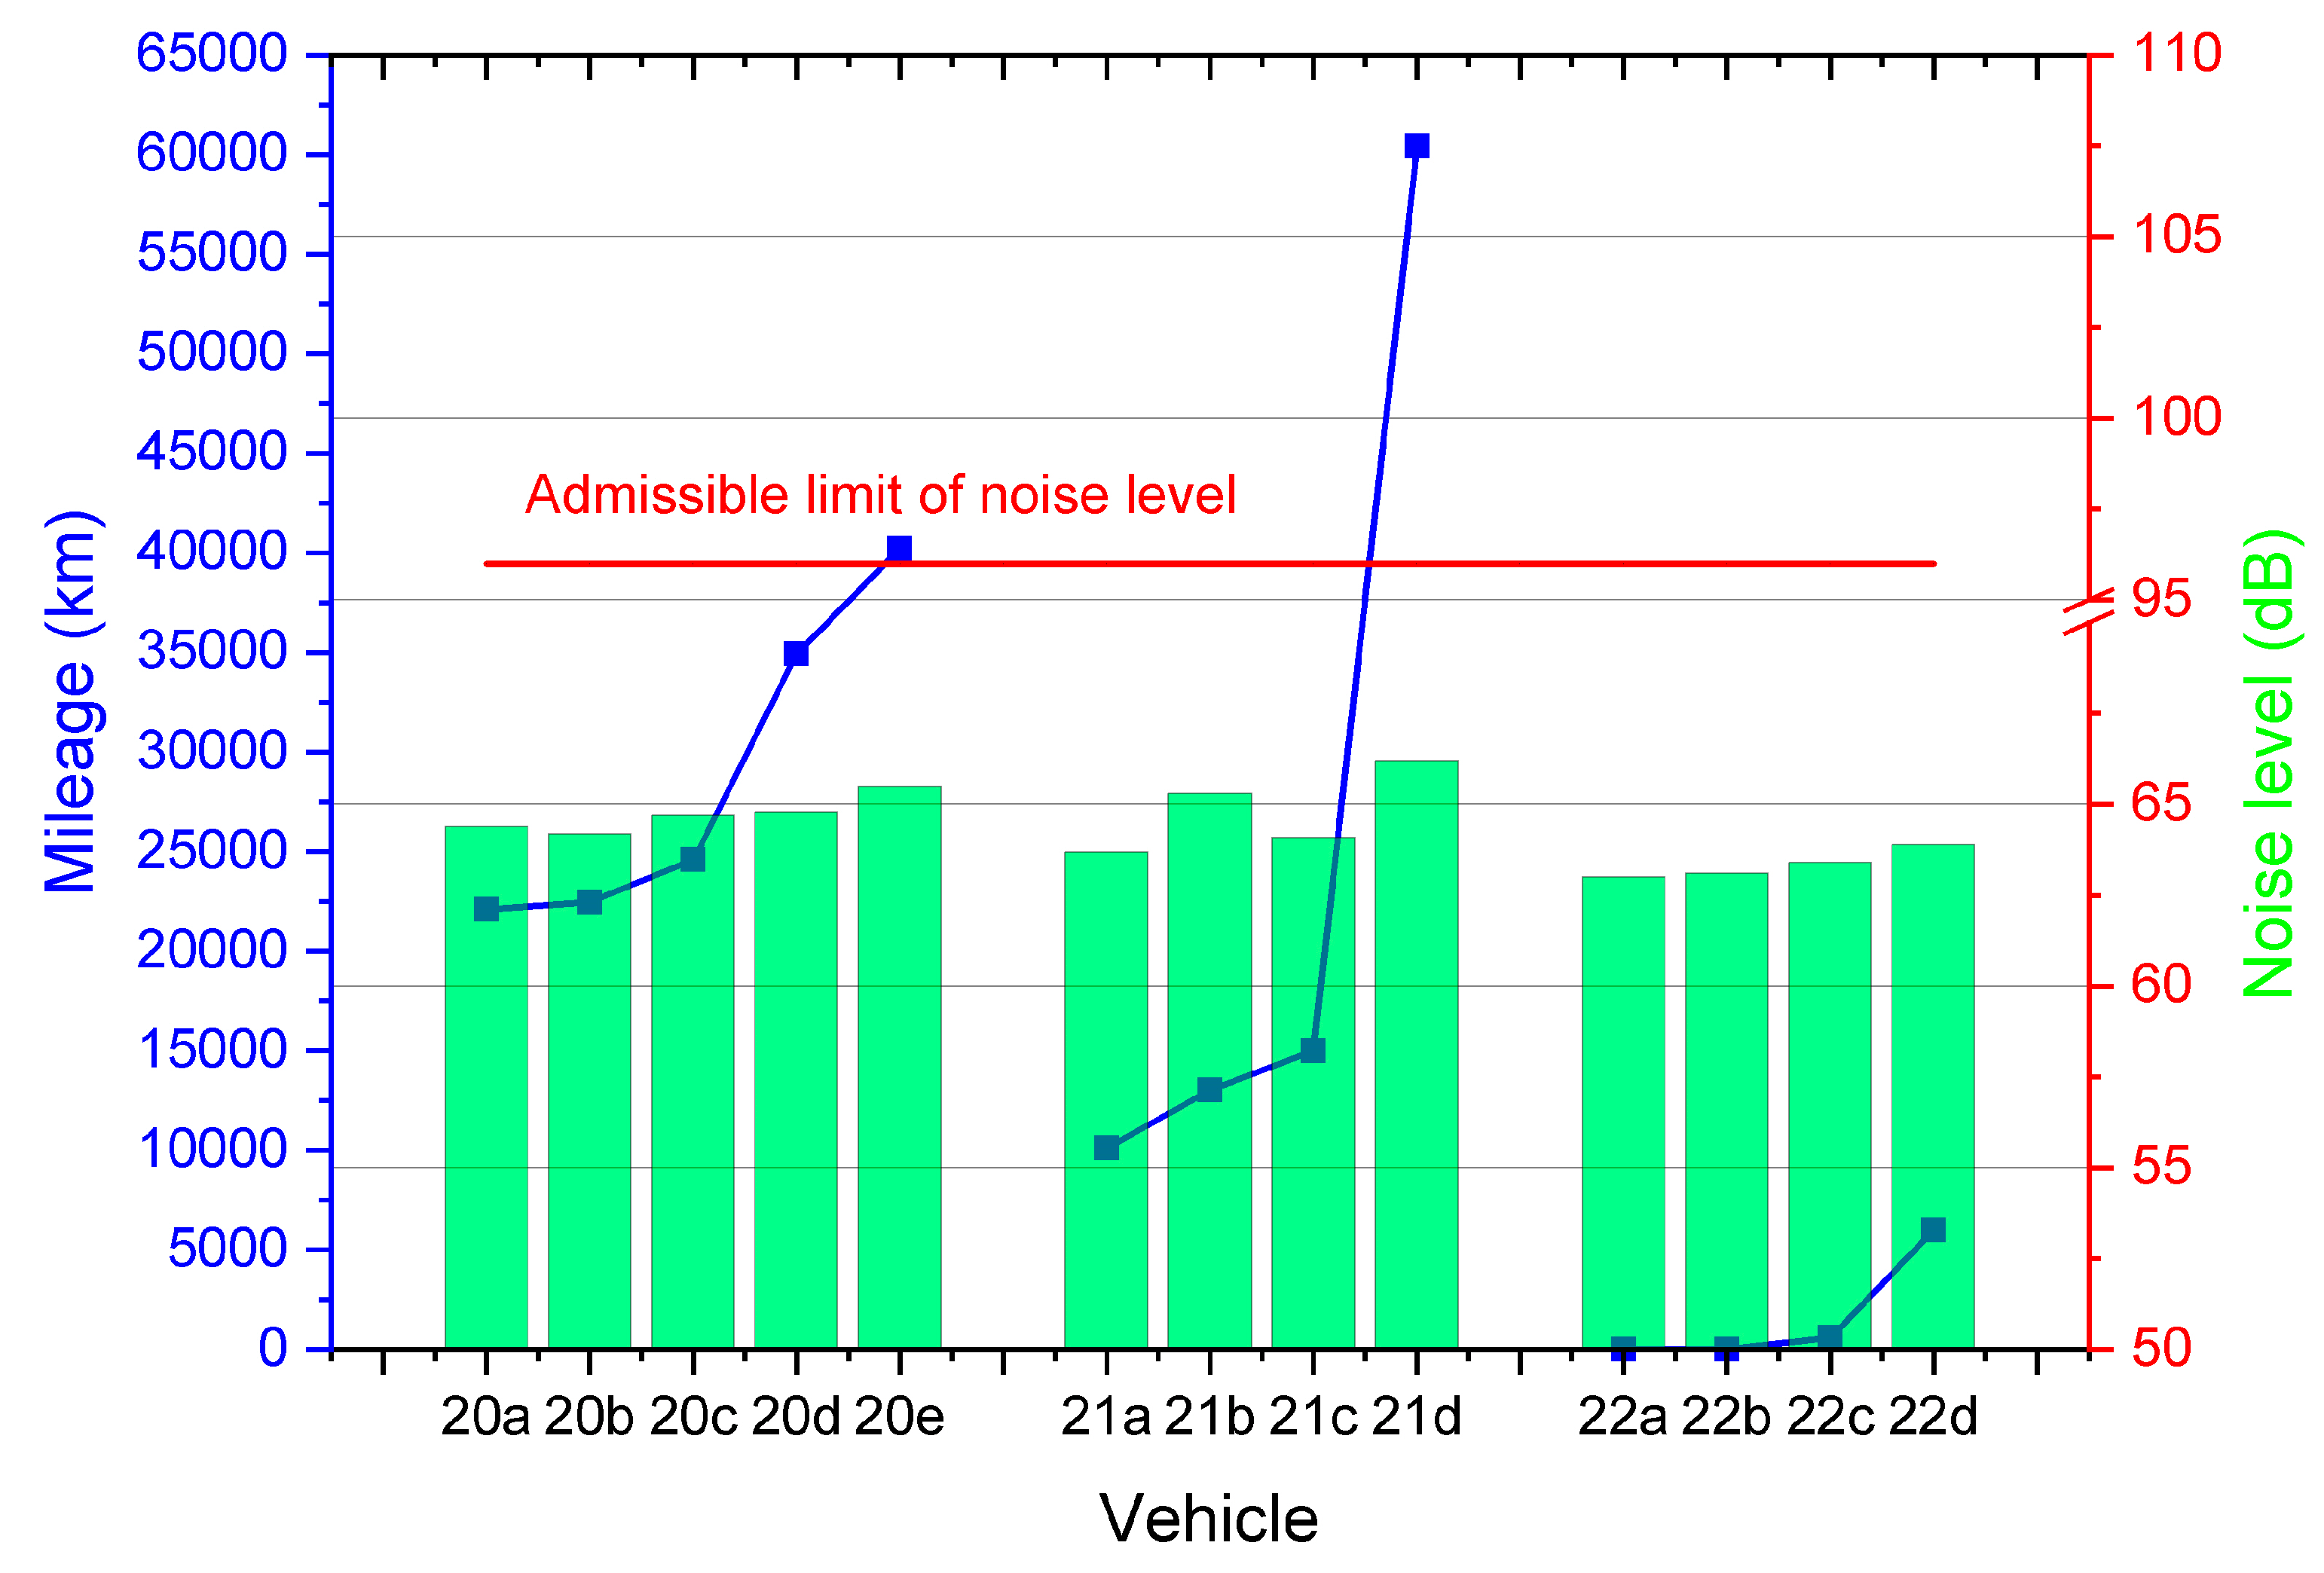
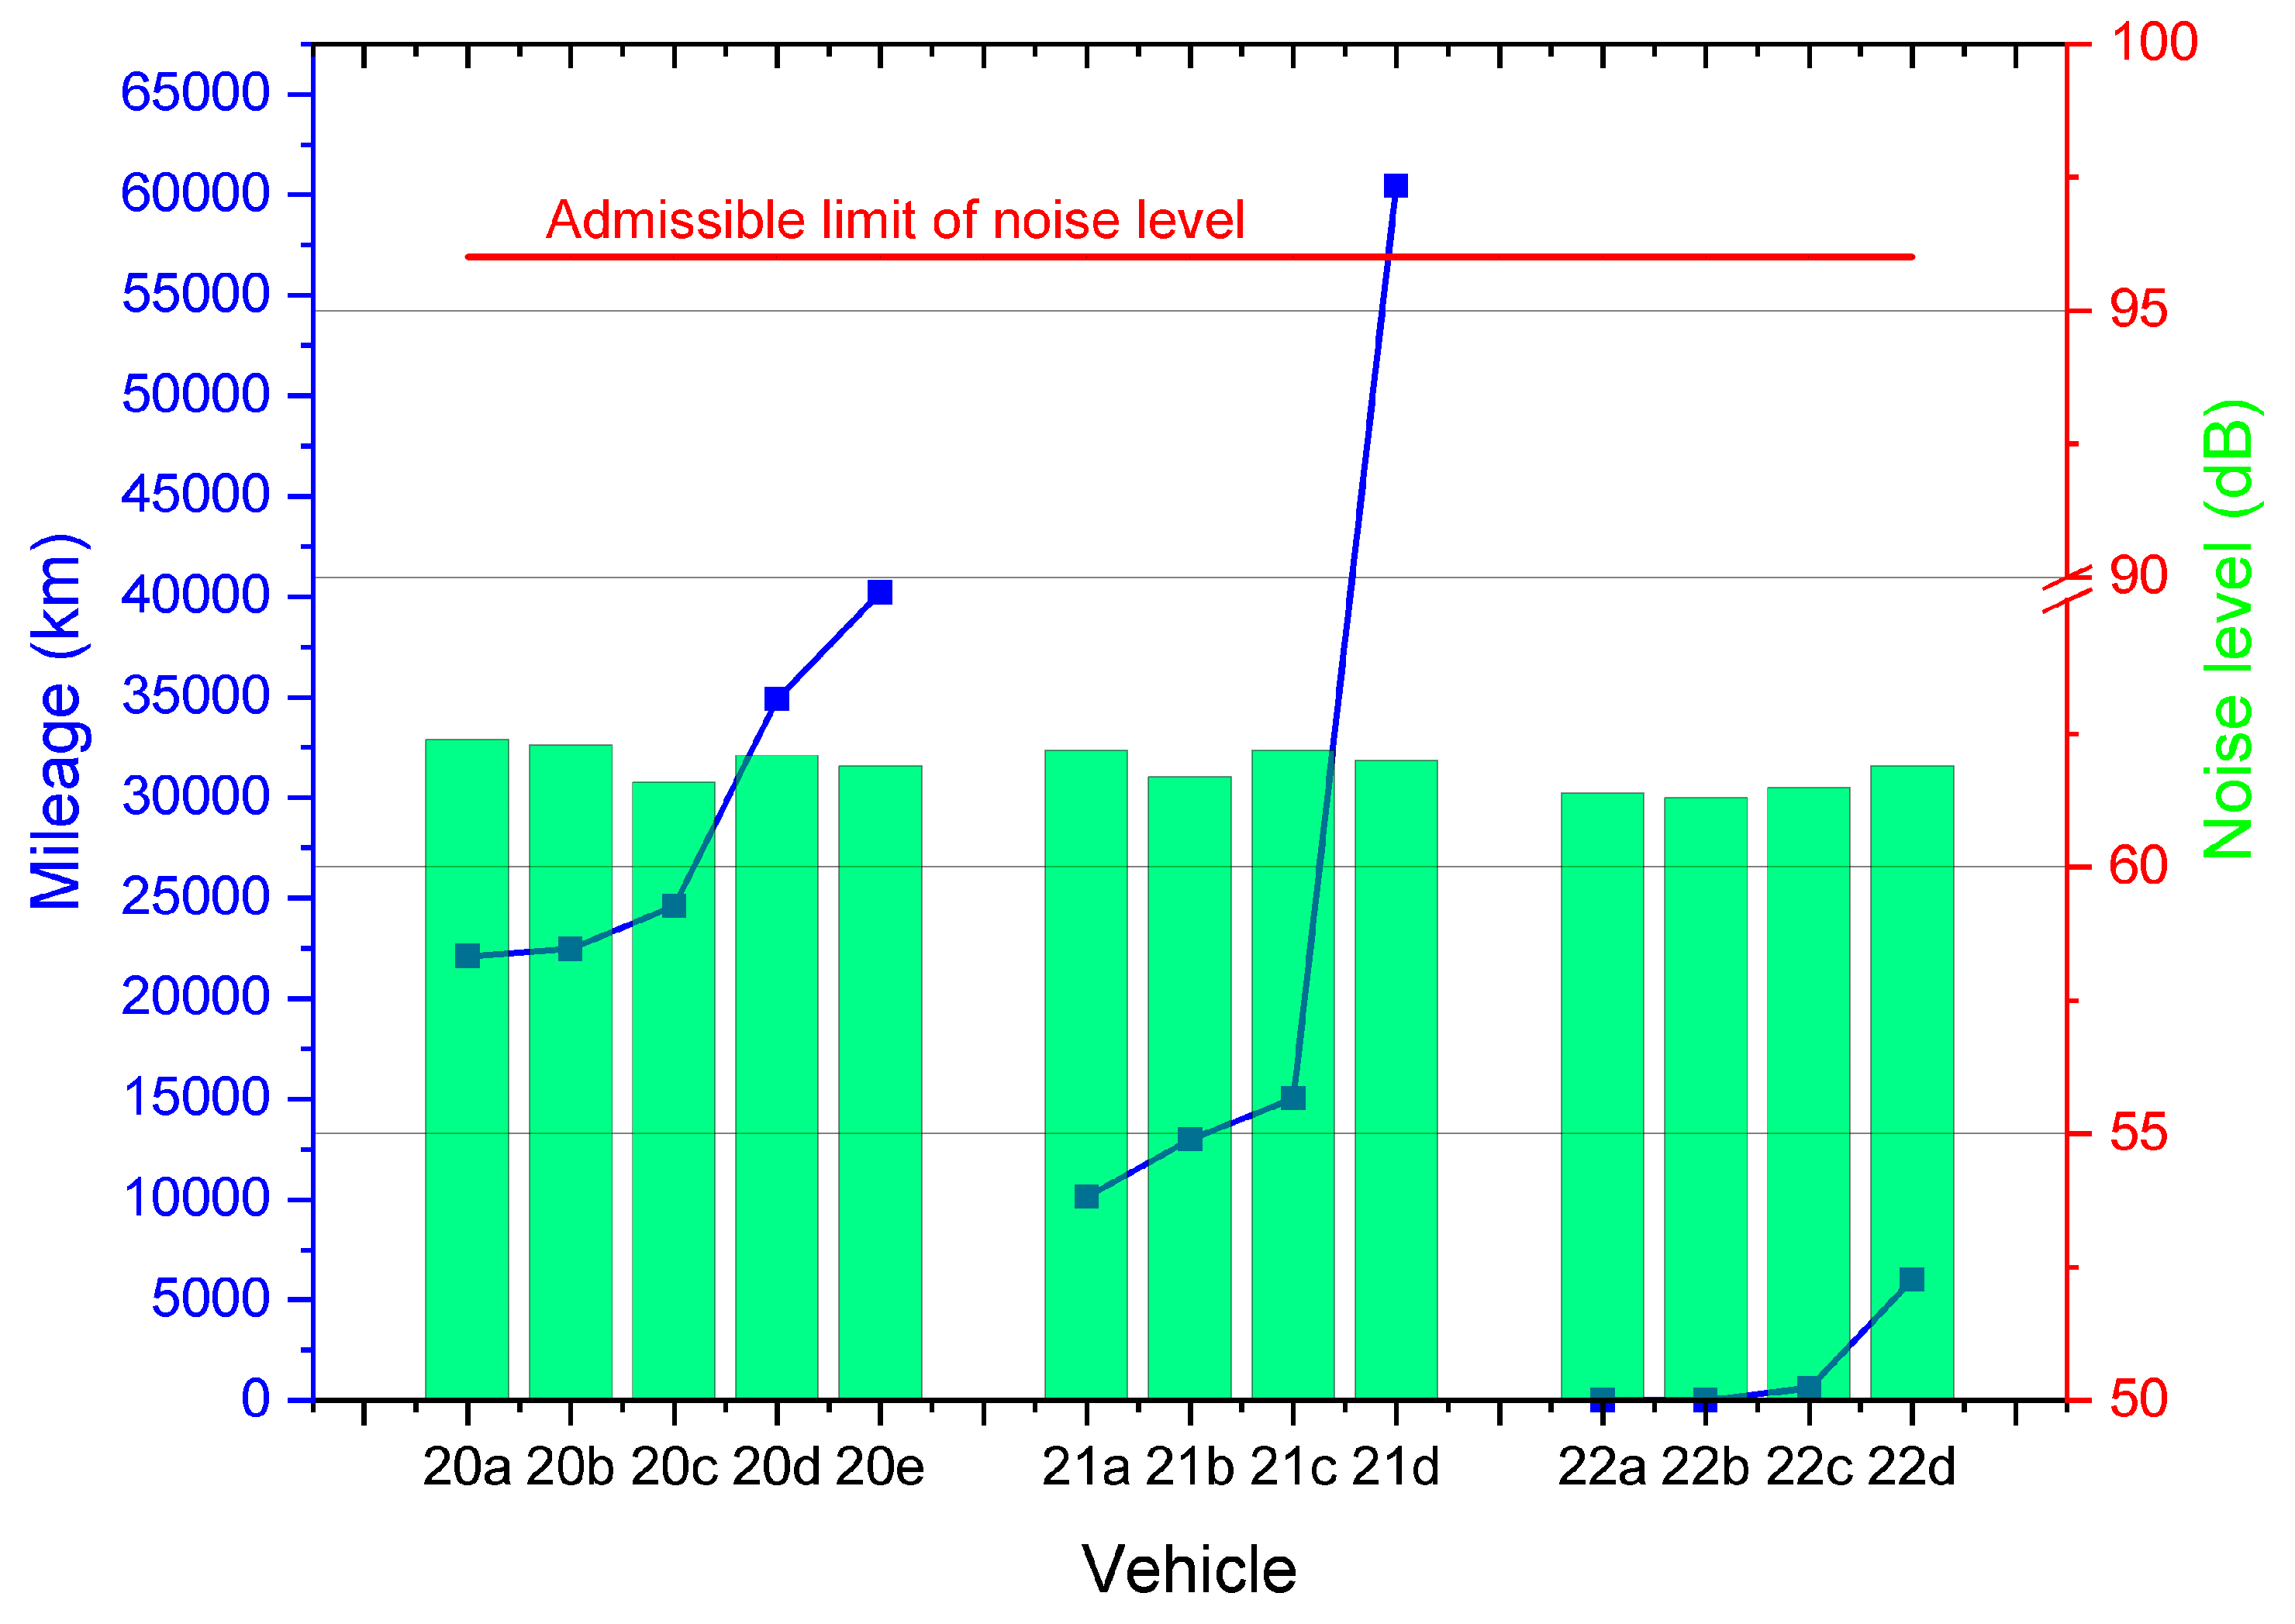
Figure 1. Scheme of the distribution of noise level testing points in the examined vehicles.
Sustainability 15 07910 g001
Figure 2. Variation in the noise levels emitted by the tested vehicles at the “A” measurement point.
Sustainability 15 07910 g002
Figure 3. Variation in the noise levels emitted by the tested vehicles at the “AA” measurement point.
Sustainability 15 07910 g003
Figure 4. Variation in the noise levels emitted by the tested vehicles at the “B” measurement point.
Sustainability 15 07910 g004
Figure 5. Variation in the noise levels emitted by the tested vehicles at the “BB” measurement point.
Sustainability 15 07910 g005
Figure 6. Variation in the noise levels emitted by the tested vehicles at the “C” measurement point.
Sustainability 15 07910 g006
Figure 7. Variation in the noise levels emitted by the tested vehicles at the “CC” measurement point.
Sustainability 15 07910 g007
Figure 8. Variation in the noise levels emitted by the tested vehicles at the “D” measurement point.
Sustainability 15 07910 g008
Figure 9. Variation in the noise levels emitted by the tested vehicles at the “DD” measurement point.
Sustainability 15 07910 g009
Figure 10. Variation in the noise levels emitted by the tested vehicles at the “E” measurement point.
Sustainability 15 07910 g010
Figure 11. Variation in the noise levels emitted by the tested vehicles at the “EE” measurement point.
Sustainability 15 07910 g011
Figure 12. Variation in the noise levels emitted by the tested vehicles at the “F” measurement point.
Sustainability 15 07910 g012
Figure 13. Variation in the noise levels emitted by the tested vehicles at the “FF” measurement point.
Sustainability 15 07910 g013
Figure 14. Mileage relative to (a) “CC” and (b) “D” measurement point—category relative to year production.
Sustainability 15 07910 g014
Figure 15. Interaction graph of variables at points (a) “AA” and (b) “DD”.
Sustainability 15 07910 g015
Table 1. Code notation of and data on the tested vehicles.
Number of CarsYear of ProductionMileage (km)Vehicle Code
1202022,10020a
2202022,45320b
3202024,60220c
4202034,92020d
5202040,21120e
6202110,12121a
7202113,00221b
8202115,02121c
9202160,43221d
1020221022a
1120221522b
12202260022c
132022601222d
Table 2. Statistical data of measurements performed at specific measurement points.
Value/Research PointsUnitAAABBBCCCDDDEEEFFF
Max.(dB)59.989.267.494.275.2101.847.666.262.478.557.980.1
Min.58.183.965.292.173.298.345.46361.377.156.679.2
Arithmetic average58.886.666.793.574.299.746.164.361.977.757.279.7
Standard deviation 0.511.790.750.760.560.950.660.960.360.430.330.26
Median58.987.166.993.674.199.645.964.261.977.857.179.7
Table 3. Correlation results between noise level and mileage.
VariableCorrelation
AAABBBCCCDDDEEEFFF
Mileage0.5322750.658989−0.2467620.748879−0.493777−0.7407350.9341060.8957110.4457390.673020.9365360.534013
Statistical values in italics are statistically significant values at p < 0.05.
Disclaimer/Publisher’s Note: The statements, opinions and data contained in all publications are solely those of the individual author(s) and contributor(s) and not of MDPI and/or the editor(s). MDPI and/or the editor(s) disclaim responsibility for any injury to people or property resulting from any ideas, methods, instructions or products referred to in the content.

