Article

Spatial Analysis of Socioeconomic Factors Contributing to Food Desert in North Carolina

by
Victoria Tanoh
1 and
Leila Hashemi-Beni
2,*
1
Applied Science and Technology Program, NC A&T State University, Greensboro, NC 27411, USA
2
Built Environment Department, NC A&T State University, Greensboro, NC 27411, USA
*
Author to whom correspondence should be addressed.
Sustainability 2023, 15(10), 7848; https://doi.org/10.3390/su15107848
Submission received: 1 March 2023 / Revised: 1 May 2023 / Accepted: 8 May 2023 / Published: 10 May 2023

Abstract

:
Food deserts (FD) have attracted attention after the post-COVID-19 pandemic, primarily due to adverse health and other implications of living in areas designated as food deserts. Most studies have focused on various aspects of the impact of food deserts, including the nutritional and health risks of living in FDs. Spatial integration and analysis of the GIS data in food provide a powerful way to expose the issues of creating deserts and how they change over space and time. This study aims to investigate the socioeconomic factors influencing food deserts using geospatial analyses. Guilford, Bladen, and Rutherford Counties in North Carolina were selected as case studies due to their higher percentage of the population with limited healthy food access. This study used open-source data, such as the USDA’s Crop Land Layer (CDL) land cover maps, census data, and the Food Access Research Atlas. This research provides a geostatistical analysis of FDs based on income/expenditure, population, vehicle, and food aid. The study results generally showed that geospatial technologies are vital for investigating FDs. The results will assist policy makers and other responsible agencies in formulating appropriate intervention policies tailored to meet the demands of these counties.

1. Introduction

Food is vital for human survival and individuals’ proper growth and development. Therefore, access to fresh, healthy, and affordable food in all communities is essential for overall community development, regardless of socioeconomic status or geographical location. Despite the significant benefits derived from consuming fruits and vegetables, not all communities have access to them at a reasonable price. Food access and availability are essential determinants of food deserts (FD), which refer to areas with limited access to healthy and fresh food. Lower incomes, abandoned or deserted residences, and low-density urban regions often characterize these areas [1,2]. FDs are associated with various diet-related health issues, including obesity and mental health disorders, particularly among vulnerable populations [3]. This problem has been exacerbated by the COVID-19 pandemic, highlighting the adverse health implications of living in food deserts. Low-income households are more likely to face limited access to healthy food options due to the complex and multifaceted socioeconomic factors contributing to food deserts. These factors include income, population, and vehicle access, which all play vital roles in determining access to healthy food options and can make it difficult for low-income families to afford them [4]. There is a need for comprehensive assessments of land use and transitions near food deserts to identify areas where interventions may be necessary.
Numerous studies have focused on various aspects of the impact of food deserts, including the nutritional and health risks of living in food deserts. Research conducted in the United States has revealed that food insecurity is more prevalent in southeastern areas with lower incomes, higher poverty rates, and limited transportation access [5]. This issue has garnered even more attention in the post-COVID-19 pandemic era due to the adverse health and other implications of living in areas designated as food deserts. A study analyzing 300 online survey responses highlighted the stressful effect of individuals in food desert regions already struggling with unemployment and severe mental illness, underscoring the urgent need for clinical and policy-level interventions to address this social challenge [6]. In North Carolina, FDs are significant public health concerns, particularly in low-income and rural areas within the State. Approximately sixteen percent of North Carolina census tracts are designated food deserts [7]. More recently, the number of North Carolina residents living in FDs has been brought to the attention of stakeholders. In 2022, approximately 1.6 million North Carolinians resided in FD areas across the State 2022 [7]. To reduce food insecurity and build resilient communities, researchers have collaborated efforts and proposed alternative measures to curb the effects of FD on low-income earning communities. Research shows that interventions to improve food access in food desert areas can positively impact health outcomes, including reducing obesity rates and related health concerns [8]. One approach suggests opening grocery stores in underserved areas. At the same time, another incentivizes farmers to sell fresh produce in low-income neighborhoods. These policy solutions have shown promise in curbing the adverse effects of food deserts. They represent essential steps toward building more equitable and healthy communities. Alternative strategies were using selected food banks as substitutes for grocery stores and assessing their capacity to provide food assistance while addressing the underlying causes of hunger in their communities [9].
The socioeconomic factors that contribute to food deserts are complex and multifaceted. Income, education, race, ethnicity, and transportation all play a role in determining access to healthy food options. Income is a critical socioeconomic factor that contributes to food deserts. Several studies above have found that low-income households were more likely to have limited access to healthy food options primarily because healthy foods are more expensive, making it difficult for low-income families to afford them. Additionally, lower demand levels make grocery stores and supermarkets less likely to open in low-income areas [10]. In recent years, there has been an increasing interest in using geospatial analysis to study food deserts. This approach allows researchers to examine the spatial distribution of food deserts and identify areas where interventions may be needed.
Spatial analysis of socioeconomic factors is essential for identifying and addressing FD in North Carolina. Lower educational status has been identified as a contributing factor to FDs. Studies, such as those referenced in [11,12], have confirmed that areas with lower educational attainment are more likely to experience FDs. This indicates that residents in these areas may need more knowledge and resources to make healthy food choices, such as preparing meals or reading food labels. Additionally, race and ethnicity are critical socioeconomic factors contributing to FDs. Hence, education and outreach efforts are also needed to help residents make healthy food choices and navigate the food system [13].
Finally, transportation is critical in determining access to healthy food options. Residents who do not have access to vehicles or other means of transport will find it difficult to travel to grocery stores or supermarkets, mainly if they live in areas with limited public transportation options, resulting in limited access to healthy food, primarily fresh fruits, and vegetables. Other researchers have argued that despite the attempt to increase the consumption of fruits and vegetables in the designated areas, consumers’ tastes and preferences supersede all interventions amid varying barriers.
These studies demonstrate a broad spectrum of studies centered on FD, including the value of geospatial analysis in understanding the spatial distribution of FDs in the United States. In contrast, further research is needed to examine the effectiveness of different interventions and develop strategies that address the underlying socioeconomic factors contributing to FDs. Further, there is a need for a comprehensive assessment of land use and land-use transitions (LUTs) near FDs and to reveal the underlying social characteristics of these areas.
This study aims to provide a geospatial approach to investigating the socioeconomic factors influencing FDs identified by the USDA in three North Carolina counties. In addition to the USDA’s FD criteria, this study incorporates additional socioeconomic factors such as income, population, household size, and SNAP beneficiaries in assessing FDs and their associated social challenges.

2. Methodology

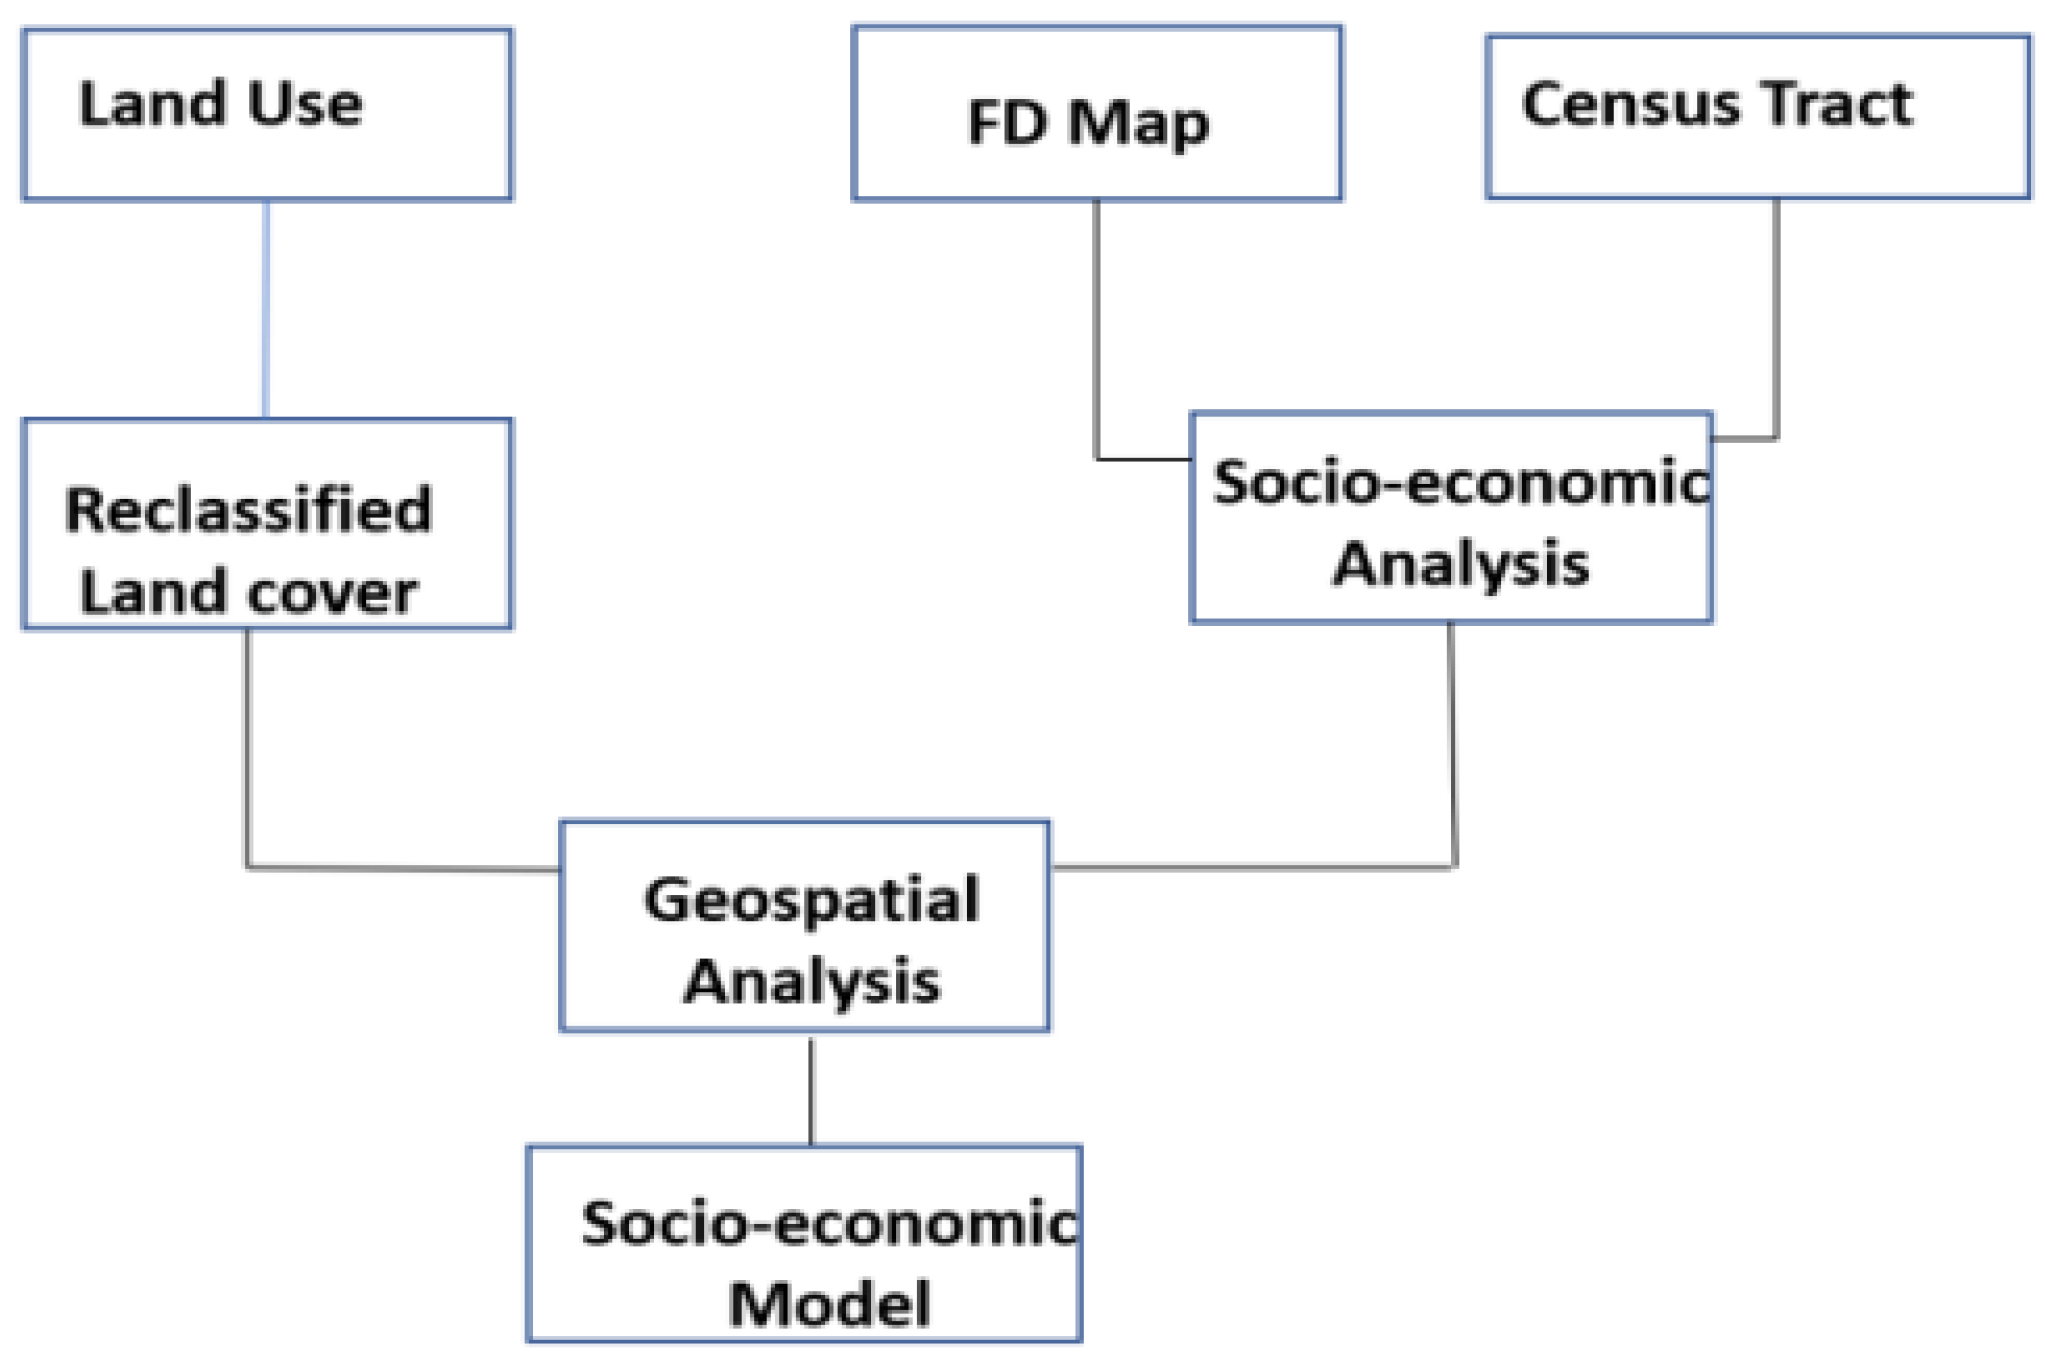
2.1. Conceptual Framework

This study proposes a framework for spatial analysis of FDs in Figure 1, by combining land use, FD maps, and census tract data with the unique socioeconomic characteristics of the area to generate a spatial correlation model that provides comprehensive insights into areas that are FDs. Socioeconomic characteristics such as population, income, household size, and SNAP beneficiaries are essential for FD analysis as they impact food access and availability. Additionally, promoting healthy land use patterns is a way to reduce FD in communities. Effective land use decisions play a significant role in influencing the availability and location of food retailers as well as food supply. This influence can be achieved by implementing zoning laws and industrial development practices. Thus, the decisions made regarding land use directly impact FDs [14]. Therefore, an understanding of the complex relationship between these factors and food access in areas identified as food deserts can be obtained by better evaluating these characteristics. For instance, a higher population in an area may increase the demand for food. Additionally, a lower income may limit access to healthier and more expensive food options. Similarly, household size can influence food purchasing patterns and the quantity needed, while SNAP beneficiaries may be more vulnerable to food insecurity due to financial constraints. By evaluating these socioeconomic characteristics, we can better understand the complex relationship between these factors and food access in areas identified as FDs.

2.2. Data and Study Area

2.2.1. Data

This study utilized data from the U.S. Census Bureau [15], the National Agricultural Statistical Service (NASS) USDA, and the USDA Food Access Research Atlas (FARA) [16] to analyze FDs in three counties in North Carolina. The datasets include:
(a)
FD Maps: USDA FD maps indicate areas where people have limited access to affordable and nutritious food based on food availability, income levels, and transportation infrastructure.
(b)
Census Tract: Census tracts are critical data for analyzing demographic and economic data in the United States, reporting essential statistics such as population size, age, race and ethnicity, income, education, housing, and employment. Government agencies, researchers, and policy makers widely use the data collected through census tracts to make informed decisions regarding public policy, business strategy, and community development. Census tracts play a significant role in identifying areas that require attention and intervention to ensure equitable development and informed decision-making.
(c)
Land Use and Land Cover: Land use and land cover are two distinct concepts yet closely related. While land use entails human decision activities that determine how land is utilized, land cover refers to the physical features of the land’s surface including manmade structures and natural vegetation [17]. Therefore, strategic land use decisions can significantly enhance food production in specific areas [18] through optimal land use practices.
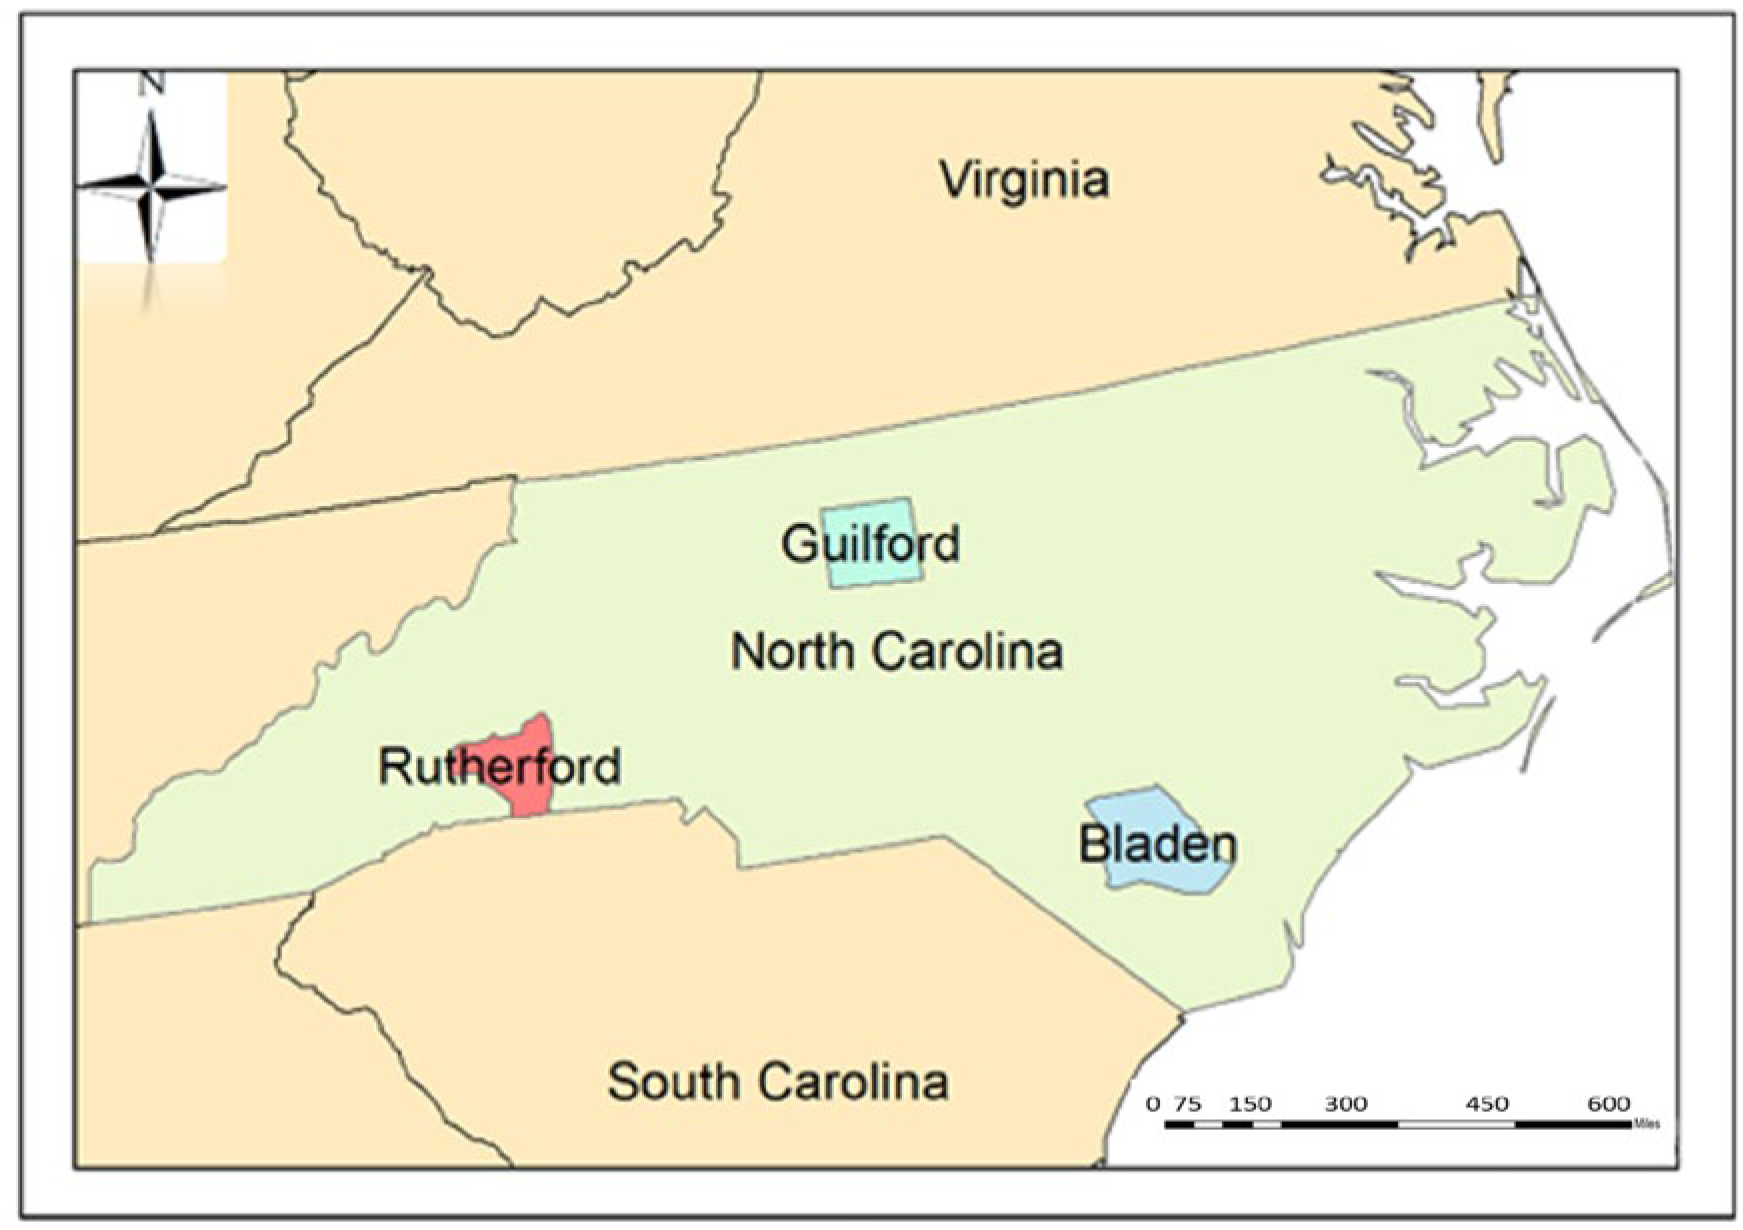
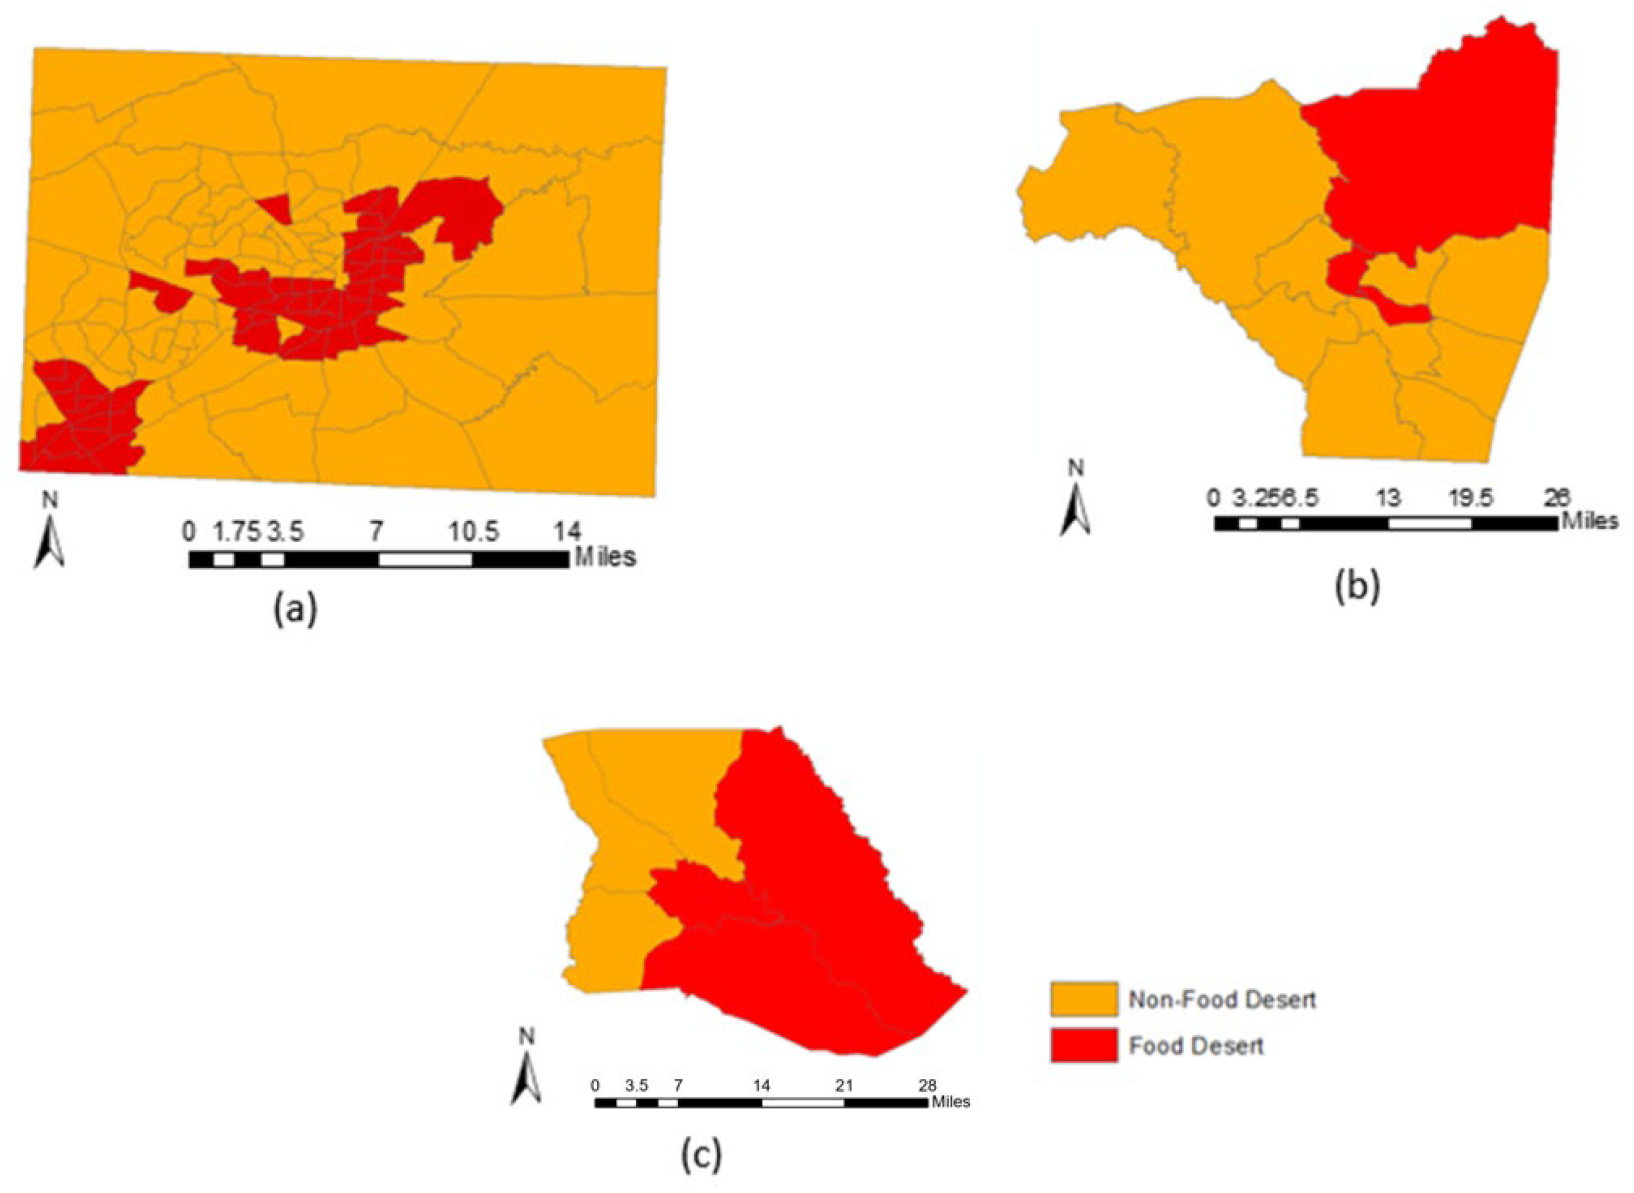
2.2.2. Study Area

The study counties seen in Figure 2 are three distinct agricultural statistical districts in North Carolina; the Southern Coastal (Bladen), Northern Piedmont (Guilford), and the Western Mountain (Rutherford) to illustrate the diversity of natural resources and farmland usage in N.C.
  • Guilford County covers a 645-square-mile area with an estimated population of 542,410 as of 2021 and is the third most populous county in the State (U.S. Census Bureau-QuickFacts, 2021).
  • Bladen County is in the southeastern part, primarily a rural county with approximately 33,000 people. The county’s economy is predominantly agricultural, with peanut production being a significant crop.
  • Rutherford County is in the western part of the State of North Carolina in the United States. It is situated in the foothills of the Appalachian Mountains and covers an area of approximately 566 square miles. The county has a population of approximately 67,000 people, with the largest city and county seat being Rutherfordton.

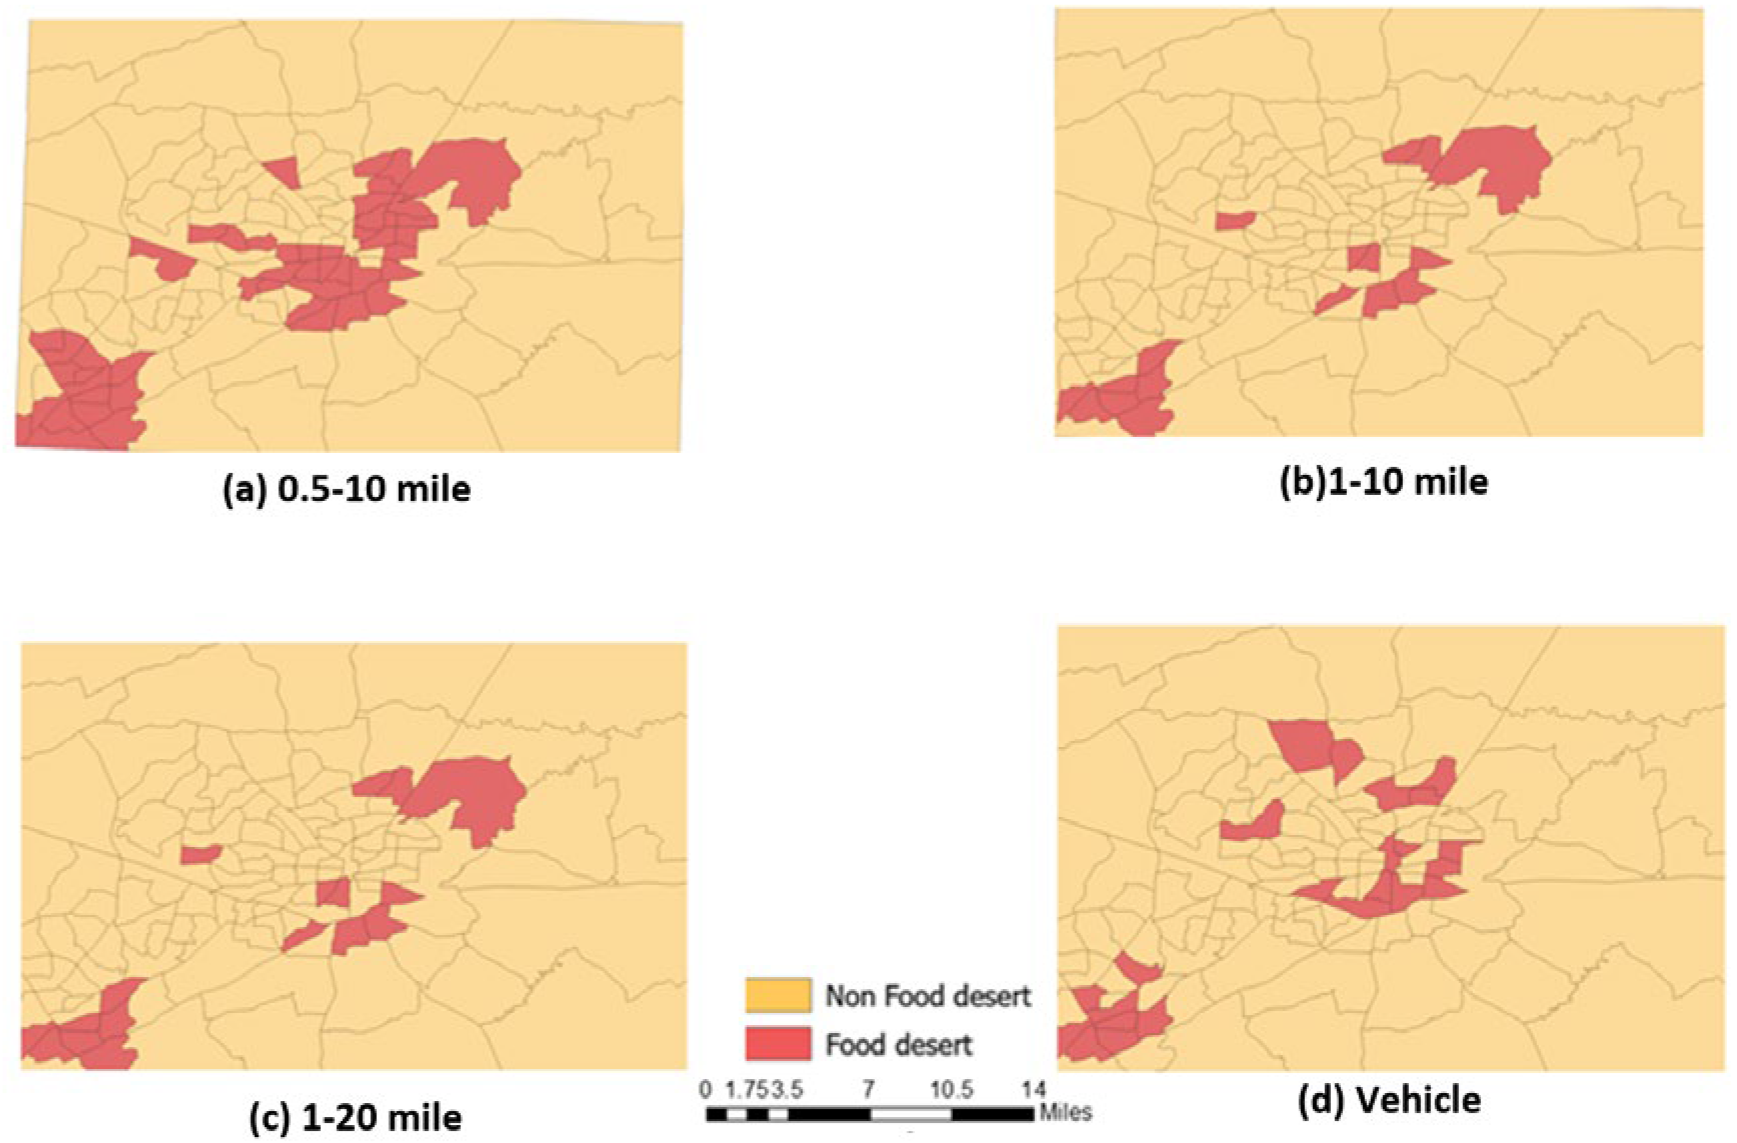
2.2.3. Spatial and Socioeconomic Analysis
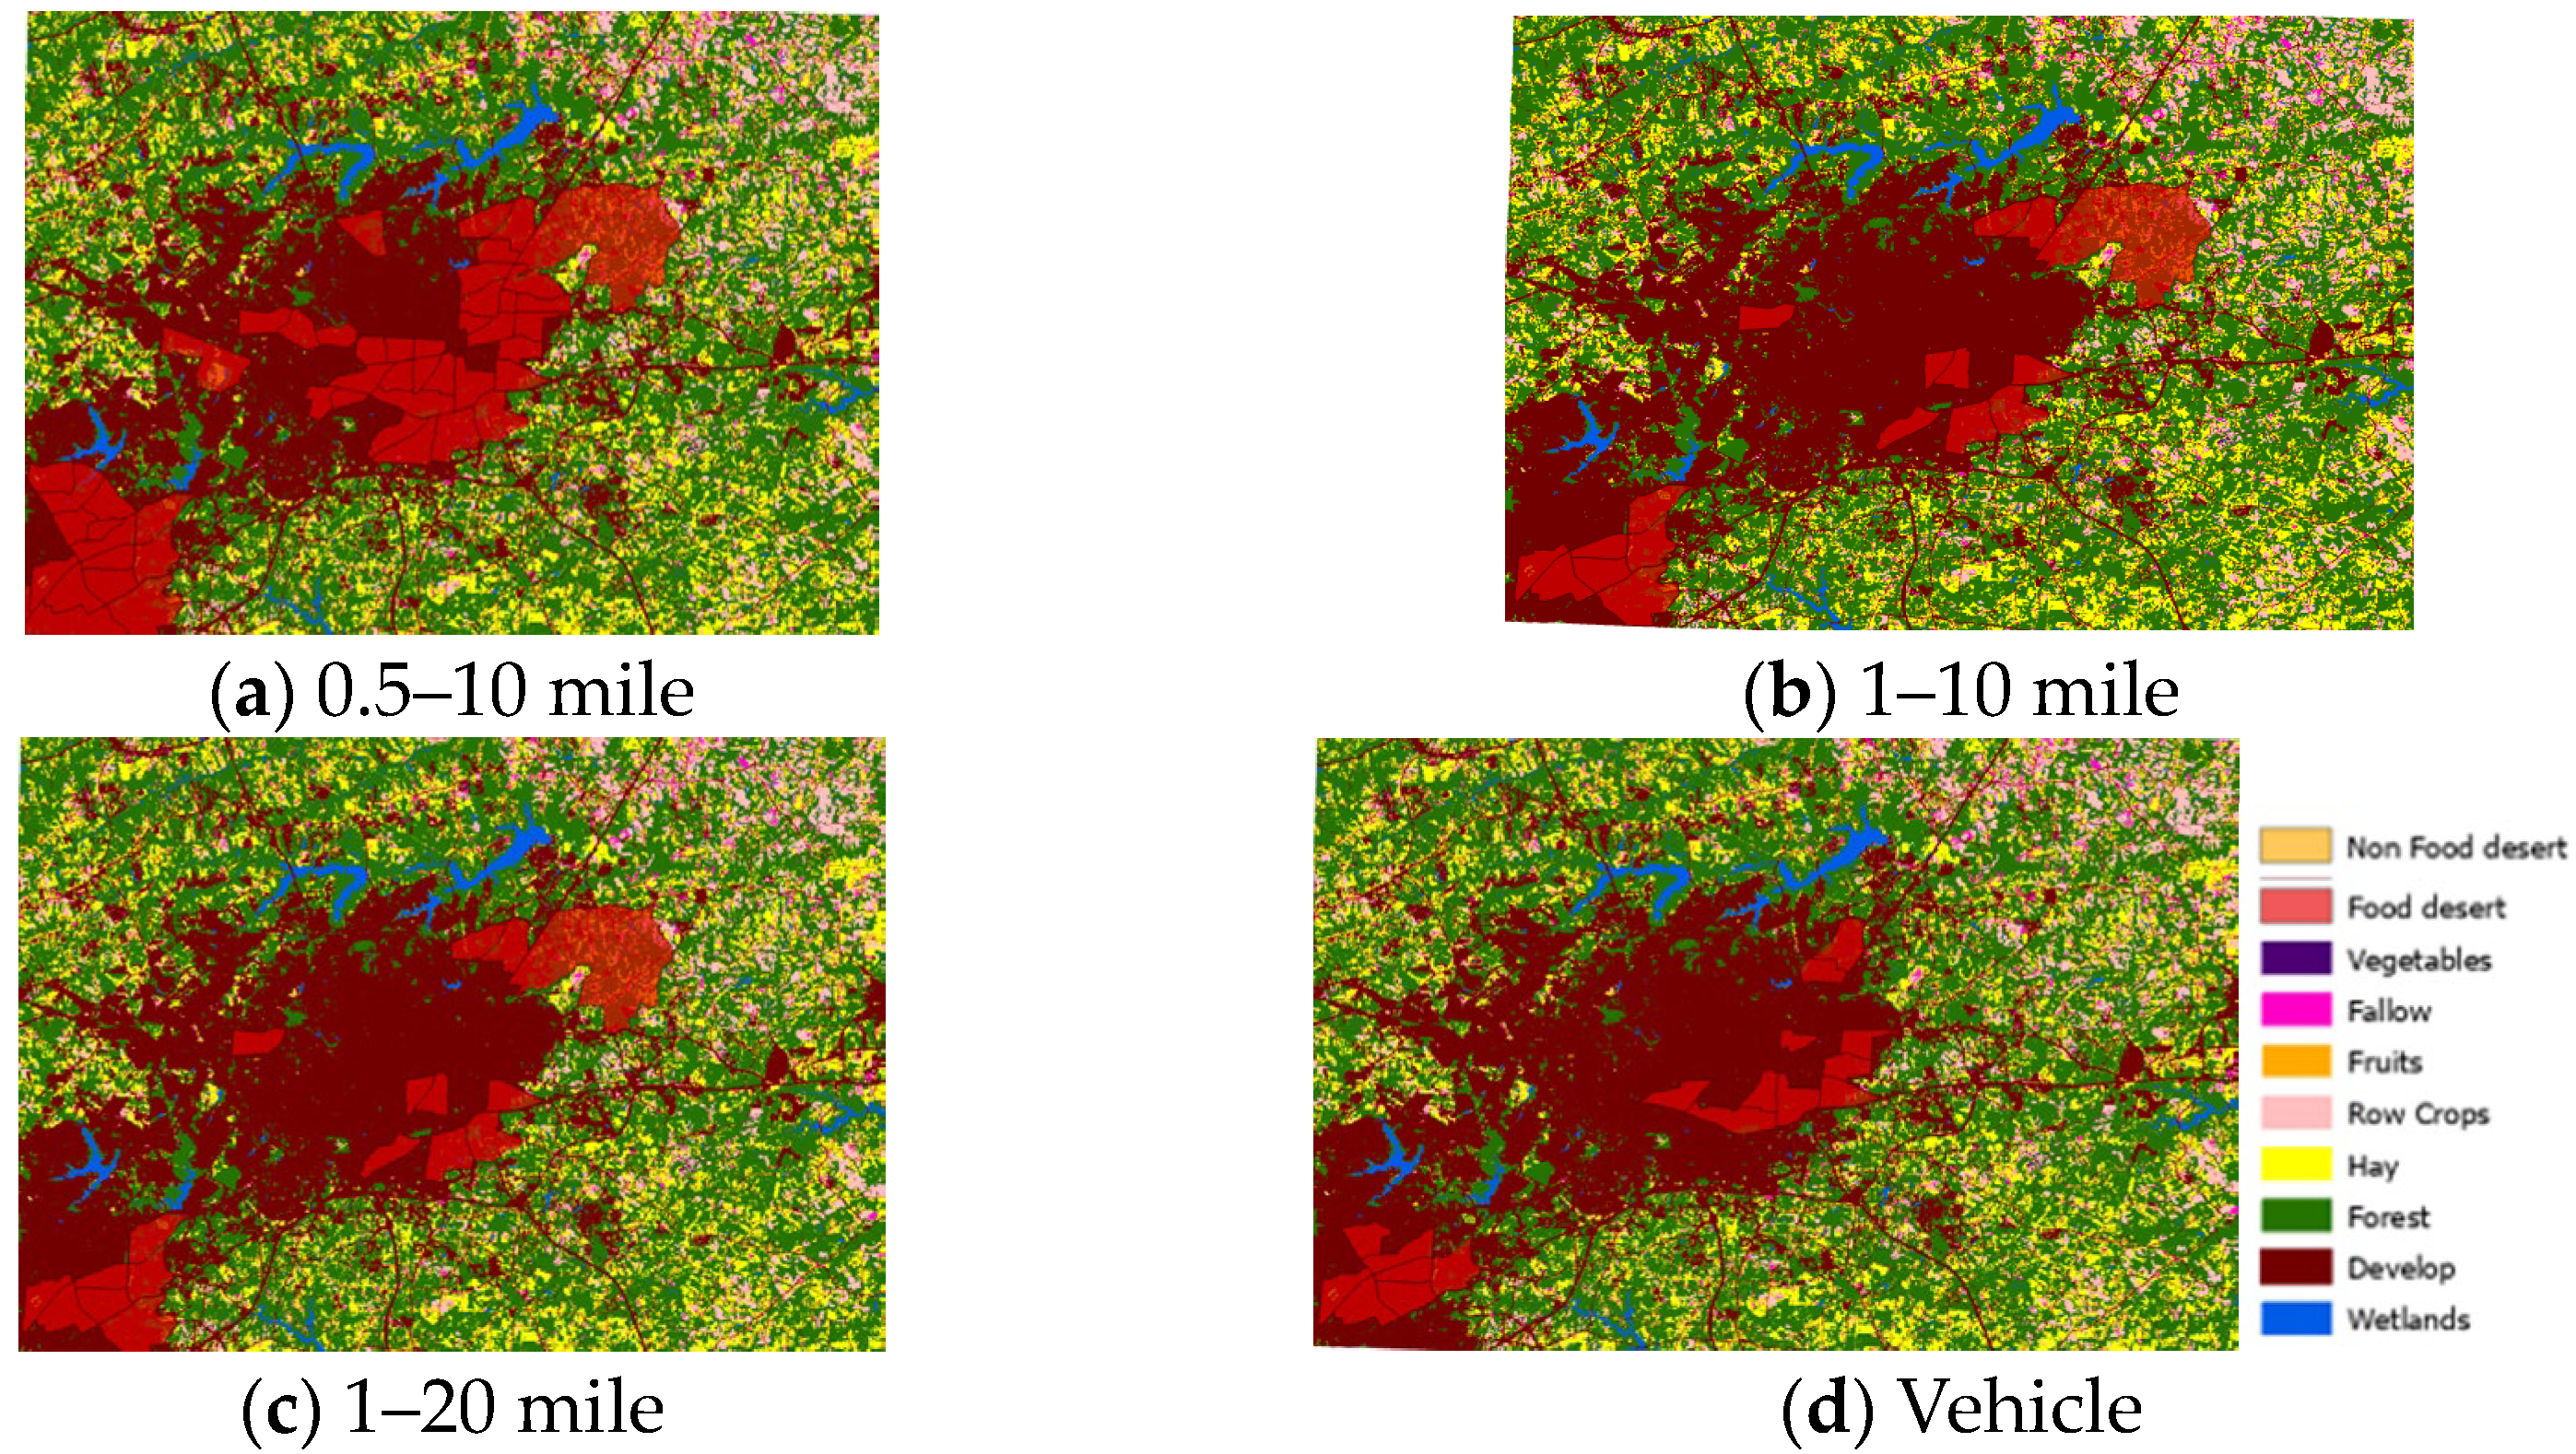
To assess the socioeconomic factors in FDs, many spatial analyses were conducted. The USDA provide FD maps that are polygon features at census tract level based on four different definitions of FD:
(a) 0.5–10: Any low-income census tract where a substantial percentage of the population is more than half a mile(urban) or ten miles (rural) from the nearest grocery store.
(b) 1–10: A low-income census tract with substantial population size in an area more than a mile(urban) or ten miles (rural) away from a supermarket.
(c) 1–20: A low-income census tract with a substantial population size in an area more than a mile(urban) or twenty miles (rural) away from a supermarket.
(d) Vehicle: where thirty-three percent of the population is away from the closest supermarket for more than 20 miles regardless of vehicle access.
On the other hand, the census tract data are tabular data with different attributes such as population size, age, race and ethnicity, income, education, housing, and employment. Hence, the spatial join analysis tool was applied to the census tract data and the FD maps. This created a geospatial layer encompassing all relevant socioeconomic characteristics for the FD areas to assess the relationship between food access and various socioeconomic factors, such as income.
Further, for land use and land cover analysis, Crop Data Layer (CDL) and the National Land Cover Database (NLCD) are two primary datasets in the US. Recent research has shown CDL to have greater precision than the NLCD [19]. As a result, we have chosen to rely on CDL raster-formatted data for subsequent analysis. The data collected were preprocessed to ensure proper GIS projection and format. Again, understanding land users’ spatial and temporal patterns, especially in cultivating vegetables and fruits, is crucial for evaluating relationships with factors such as agricultural productivity and economic policy drivers. Thus, previous studies, including [20,21], have highlighted these factors. Hence, this study utilized reclassified CDL datasets, as provided by [20], which categorize land use into eight broad categories data to allow for a more detailed analysis of land use patterns and their relationships with critical factors. The initial CDL data had 254 individual classes.
Table 1 provides the classification of CDL into various categories to determine potential crop cultivation. A spatial analysis was conducted by utilizing the reclassified land use and FD polygons to obtain the maps.
Following this, the socioeconomic parameters of the FD areas for both years were compared utilizing the Statistical Summary function in ArcGIS. Through this statistical analysis, socioeconomic characteristics in FDs were examined and their spatial correlation was identified. A comprehensive understanding of the data was obtained by identifying patterns, going beyond visual observation on a map, thereby revealing the overall characteristics of the analyzed set of features.

3. Results

This section provides the results for the geospatial model described in Section 2. Figure 3a–c show the unclassified land use for Guilford, Bladen, and Rutherford, respectively, while Figure 3d–f illustrate the reclassified land use layer for the three counties under the eight land use categories: vegetables, fallow, fruits, row crops, hay, forest, developed lands and wetlands.
Figure 4 illustrates the land use characteristics of FD hotspots in Guilford County. The selection of Guilford County was based on its significant developmental usage, particularly for residential and commercial purposes, compared to the other two counties. Figure 4 shows that all FD areas in Guilford County were clustered around developed and barren regions. Overlaying FD maps with land cover data to reveal the spatial relationship between FDs and land cover characteristics for all four FD criteria. Specifically, Figure 4a shows the relationship between FD areas under the half to 10-mile criteria and land cover of Guilford County, where almost all tracts were categorized under the developed or barren land cover class. This observation may indicate one of the adverse effects of urbanization and increased population [22] in the study area, where land once available for agriculture has been converted for residential and commercial development. This conversion can decrease the availability and affordability of fresh and healthy food options, ultimately contributing to the development of FDs.
Figure 5 illustrates the maps under the four USDA FD definitions in Guilford County. The maps were created by spatial joining between the 2019 FD and census tracts.
Figure 5a indicates the FD designations within a half-mile (urban) radius in the urban areas and 10 miles for the rural areas from the nearest grocery store within Guilford County. The study’s results demonstrate that 48 census tracts were identified as FDs based on this FD definition. However, according to Figure 5b,c, only 17 low-income census tracts were designated as FDs where the average distance between residential units and retailers were beyond 1 mile in urban and ten miles in rural areas. Notably, no discrepancy was observed between the two FD definitions (Figure 5b,c) as they identified the same number of FD tracts. Lastly, Figure 5d indicates that 23 tracts within Guilford County were designated as FDs under criterion (d). This study focuses on the three counties of Guilford, Rutherford, and Bladen under criterion (a).
The key findings in this section set the pace for a detailed investigation of the nature of the landscape of the three counties. Figure 6 identifies FDs under the criteria 0.5–10 miles for all three counties, where Figure 6a represents Guilford and Figure 6b,c for Rutherford and Bladen, respectively. In Guilford County, 48 census tracts have been designated as food deserts, accounting for thirty-nine percent of the total tracts. Additionally, approximately fifty percent of the census tracts in Bladen County are classified as food deserts. Additionally, in Rutherford County, an estimated seventeen percent fall within this designation. Rutherford is the least affected of the three counties, with only two census tracts classified as food deserts. Guilford County falls in the middle, followed by Bladen, with the highest proportion of food desert census tracts. Hence, the need for the CDL reclassification utilized and geocoding of the counties.
Guilford County has a large area covered with forest lands and scattered hay portions, as seen in Figure 3d. However, there were no significant designated lands for producing vegetables and fruits. Furthermore, much of Guilford County’s land comprises developed areas, including residential and commercial properties. As the populations of major cities within the county, such as Greensboro and High Point, continue to grow, there is a corresponding need for additional residential and commercial developments to accommodate this expansion. These developments serve as a reflection of Guilford County’s status as a dynamic urban center.
The landscape of Bladen County shows a different outlook. Forest and wetlands represent approximately seventy percent of the county. Row crops and hay production within the county represent the remaining portions of the land. This illustrates that low-population row crop has significant production in Bladen County. Additionally, there are fewer barren lands relative to all three counties.
Specialty row crops such as peanuts are popularly grown in Bladen County. Peanut production in the county has been a staple crop driving the Bladen economy for years. According to the USDA, peanut production in North Carolina reached 167 million pounds in 2019, making it one of the top peanut-producing states in the country. Bladen County is among the top peanut-producing counties in North Carolina.
The county of Rutherford exhibits a distinctive character due to its significant forested area, which comprises approximately seventy-five percent of its total landmass. In addition, the county’s agricultural sector is dominated by hay production, accounting for twelve percent of the total agricultural output. In contrast, the combined output of fruit, row crops, and vegetable production only amounts to approximately one and a half percent, as depicted in Figure 3f.

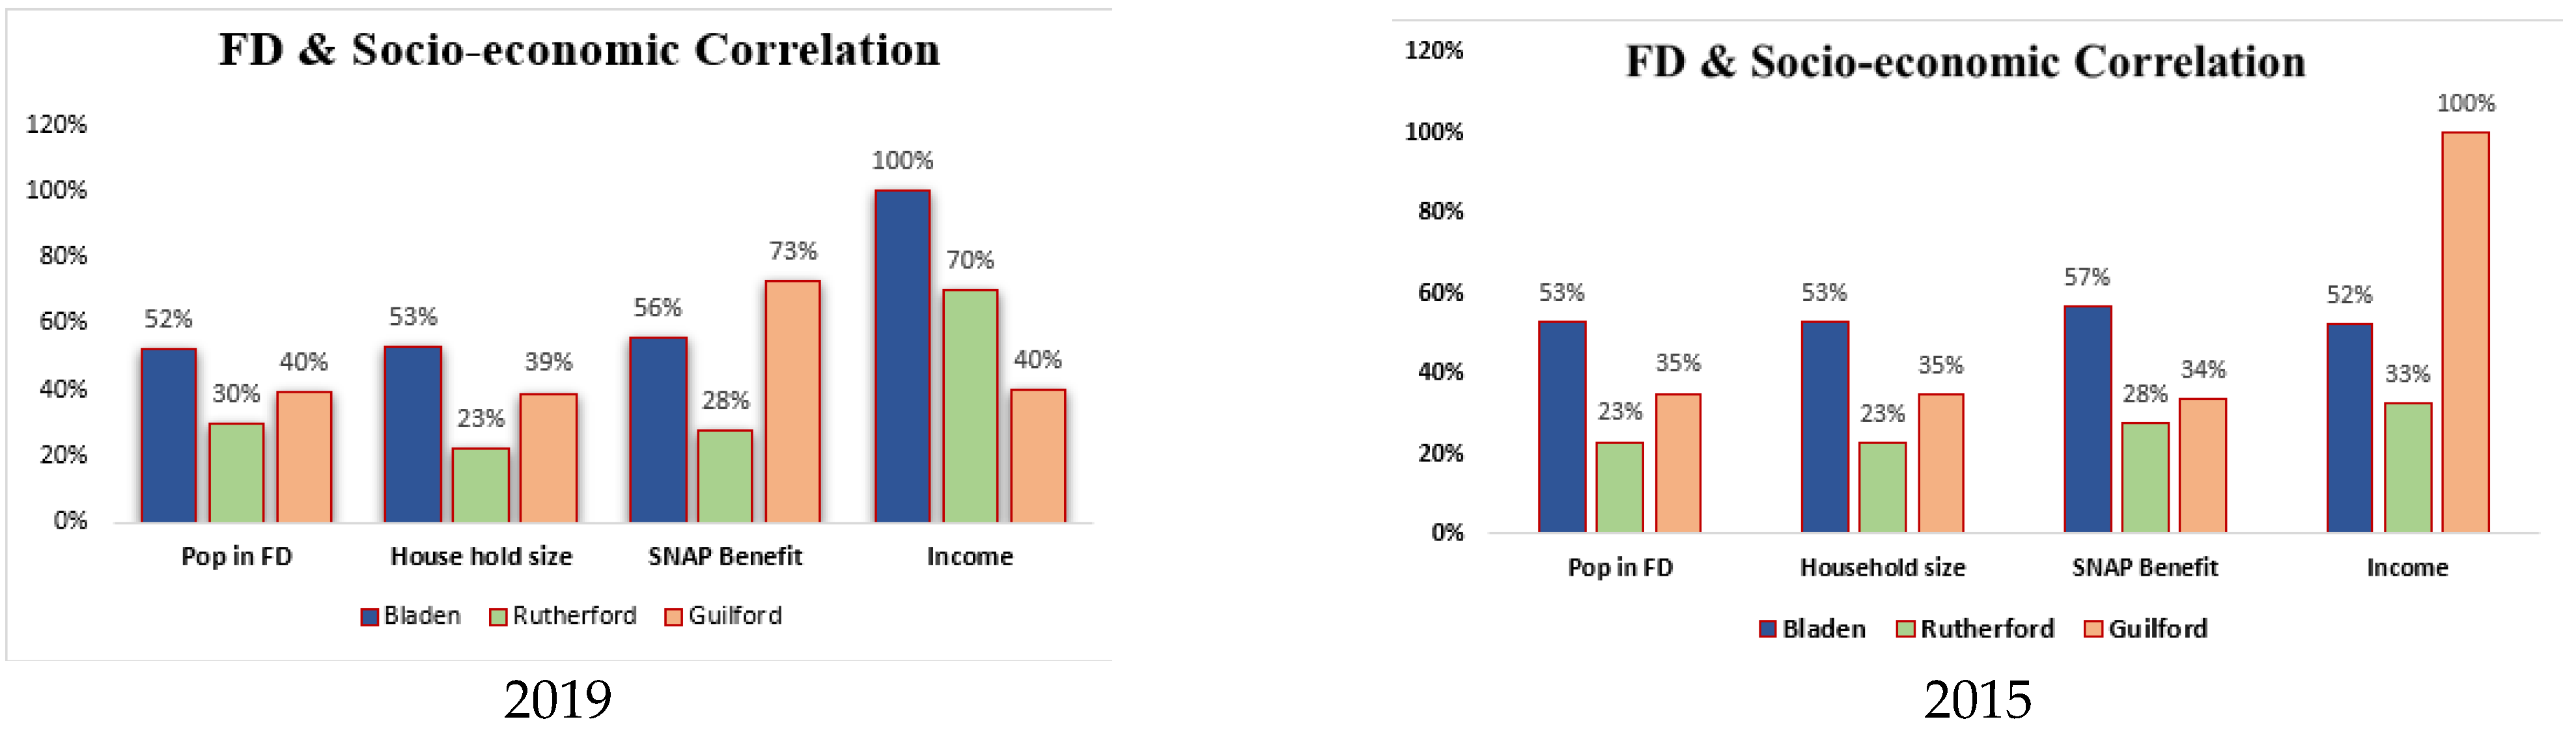
Socioeconomic Characteristics

Food access is an essential aspect highly considered by policy makers, hence the need to understand all characteristics associated with FD designations.
Figure 7 presents a comparative analysis of the following socioeconomic variables across three counties: population, income, and household sizes. The variables chosen for this analysis are some of the most significant determinants of an area’s economic and social characteristics. Their analysis provides insights into the conditions that shape the well-being of communities.
The spatial analysis identifies the presence of FDs, particularly in Guilford, Rutherford, and Bladen counties, with varying severity depending on the definition used. This study finds that low-income households in FD census tracts are disproportionately affected in all three counties, as evidenced by a higher percentage of households with incomes below the poverty level than in non-FD tracts. In Guilford County, the proportion of low-income households decreased over the period. In contrast, in both Bladen and Rutherford Counties, it increased. For example, in 2015, the percentage of low-income households in food desert areas of Bladen County was fifty percent. However, by 2019, this had risen to a hundred percent, indicating that all low-income households in the county were concentrated in FD areas.
This study highlights a trend of increasing population in FD areas from 2015 to 2019, potentially due to urbanization, changes in the local economy, or demographic shifts [23]. Household sizes in FD areas also increased in Guilford County during this period, indicating a likelihood of more individuals being affected by food insecurity in the future. To be more precise, the proportion of households with more members in areas classified as FDs in Guilford County rose from 35% in 2015 to 39% in 2019. This demographic shift may negatively impact food availability and affordability, as larger households typically consume more food and incur higher food-related costs.
Furthermore, this study highlights the importance of SNAP benefits in addressing food insecurity in FD areas. The percentage of households receiving SNAP benefits increased significantly in Guilford County, indicating the effectiveness of this program in supporting low-income families.
This study’s findings highlight the necessity of targeted interventions to tackle food insecurity in North Carolina’s FD areas. These interventions may involve expanding healthy food retail options and providing financial incentives to grocery stores to establish nutritional programs. Addressing the root causes of food insecurity in these areas could enhance the health and well-being of North Carolina’s inhabitants and advance the cause of a more equitable society.

4. Discussion

The results are helpful for policy makers, community organizations, and researchers working to improve food access and health outcomes in underserved communities.
The present study aimed to identify the socioeconomic factors contributing to food desert hotspots in three counties in North Carolina while assessing the spatial distribution of FD areas. The results indicated that a significant portion of all three counties in FD are disproportionately concentrated in low-income and minority communities. The spatial analysis revealed that food deserts are clustered in urban areas, particularly in the central and eastern parts of the State. In contrast, rural areas experience fewer issues related to food access.
This study’s findings align with previous research on FDs [24,25,26], indicating that socioeconomic factors, including income and population, significantly contribute to the spatial distribution of FD areas. The spatial analysis further highlighted the importance of land use patterns in determining the accessibility of healthy food options in North Carolina. Our study’s findings can have significant policy implications, particularly in addressing food insecurity in low-income and minority communities. Policy makers can utilize the result to target interventions for those communities that need them the most, including supporting initiatives such as community gardens, farmers’ markets, and mobile grocery stores. Additionally, efforts to increase the density of supermarkets and improve transportation infrastructure could help increase food access in underserved areas.
This study only considered the spatial distribution of FDs and not examine other factors that may contribute to food access, such as food quality and detailed knowledge of consumers’ tastes and preferences, which are usually dynamic. Future research could use longitudinal data and incorporate additional variables such as tastes and preferences to provide different perspectives on the drivers of food insecurity in North Carolina. Finally, our study contributes to the growing literature on FDs. It offers essential insights into the socioeconomic factors contributing to food insecurity in North Carolina. We believe that by understanding the spatial distribution of FDs and their contributing elements, policy makers can implement effective policies to address food insecurity and promote health equity in underserved communities.

Author Contributions

Conceptualization, methodology design, and supervision, L.H.-B.; data analysis, V.T.; writing—original draft, V.T.; writing—review and editing, L.H.-B. All authors have read and agreed to the published version of the manuscript.

Funding

This material is based on work supported by the National Science Foundation under Grant No. 1824949 and NOAA award #NA21OAR4590358.

Institutional Review Board Statement

Not applicable.

Informed Consent Statement

Not applicable.

Data Availability Statement

Not applicable.

Acknowledgments

The authors would like to acknowledge all expert’s contributions to this paper.

Conflicts of Interest

The authors declare no conflict of interest.

References

  1. Aun, J.J. The Intersection of Food Deserts and Food Assistance Deserts in El Paso County, Texas. Master’s Thesis, The University of Texas at El Paso, El Paso, TX, USA, 2020. [Google Scholar]
  2. Ver Ploeg, M.; Breneman, V.; Dutko, P.; Williams, R.; Snyder, S.; Dicken, C.; Kaufman, P. Access to Affordable and Nutritious Food: Updated Estimates of Distance to Supermarkets Using 2010 Data (No. 1477-2017-3993); AgEcon Search: St. Paul, MN, USA, 2012. [Google Scholar]
  3. Fitzpatrick, K.; Greenhalgh-Stanley, N.; Ploeg, M.V. Food deserts and diet-related health outcomes of the elderly. Food Policy 2019, 87, 101747. [Google Scholar] [CrossRef]
  4. Penne, T.; Goedemé, T. Can low-income households afford a healthy diet? Insufficient income as a driver of food insecurity in Europe. Food Policy 2021, 99, 101978. [Google Scholar] [CrossRef]
  5. Coleman-Jensen, A.; Rabbitt, M.P.; Gregory, C.A.; Singh, A. Statistical Supplement to Household Food Security in the United States in 2021 (No. 1962-2022-1838); US Department of Agriculture: Washington, DC, USA, 2022. [Google Scholar]
  6. Compton, M.T.; Ku, B.S. Prevalence of food insecurity and living in a food desert among individuals with serious mental illnesses in public mental health clinics. Community Ment. Health J. 2023, 59, 357–362. [Google Scholar] [CrossRef] [PubMed]
  7. Casey, A.H.; Pylypiw, N. Running the numbers: Measuring food hardship in North Carolina communities. North Carol. Med. J. 2022, 83, 126–129. [Google Scholar] [CrossRef] [PubMed]
  8. Testa, A.; Jackson, D.B.; Semenza, D.C.; Vaughn, M.G. Food deserts and cardiovascular health among young adults. Public Health Nutr. 2021, 24, 117–124. [Google Scholar] [CrossRef] [PubMed]
  9. Goodman, M.; Thomson, J.; Landry, A. Food environment in the lower Mississippi Delta: Food deserts, food swamps and hot spots. Int. J. Environ. Res. Public Health 2020, 17, 3354. [Google Scholar] [CrossRef] [PubMed]
  10. Rhone, A. Updated Food Access Research Atlas Now Maps Changes in Low-Income and Low-Supermarket Access Areas in 2019. In Amber Waves: The Economics of Food, Farming, Natural Resources, and Rural America, 2021 (1490-2021-1194); AgEcon Search: St. Paul, MN, USA, 2021. [Google Scholar]
  11. Kotval-K, Z.; Khandelwal, S.; Wills, K. Access to foods using Grand Rapids, Michigan, as a case study: Objective versus subjective issues. J. Agric. Food Syst. Community Dev. 2021, 10, 145–159. [Google Scholar]
  12. Buys, D.R.; Rennekamp, R. Cooperative extension as a force for healthy, rural communities: Historical perspectives and future directions. Am. J. Public Health 2020, 110, 1300–1303. [Google Scholar] [CrossRef] [PubMed]
  13. Jones, R.E.; Walton, T.N.; Duluc-Silva, S.; Fly, J.M. Household food insecurity in an urban food desert: A descriptive analysis of an african american community. J. Hunger. Environ. Nutr. 2022, 17, 670–688. [Google Scholar] [CrossRef]
  14. Center for Diseases Control. Food Access Through Land Use Planning and Policies. Available online: https://www.cdc.gov/nccdphp/dnpao/health-equity/health-equity-guide/pdf/health-equity-guide/Health-Equity-Guide-sect-3-4.pdf (accessed on 18 January 2023).
  15. United States Census Bureau. American Survey Community, State Profiles: North Carolina. Available online: www.census.gov/library/stories/state-by-state/north-carolina-population-change-between-census-decade.html (accessed on 2 February 2023).
  16. United States Food Access Research AtlasFARA. Available online: https://www.ers.usda.gov/data-products/food-access-research-atlas/ (accessed on 2 February 2023).
  17. United States Department of Agriculture. Economic Research Services. Land Use and Land Cover Estimates for the US. Available online: https://www.ers.usda.gov/about-ers/partnerships/strengthening-statistics-through-the-icars/land-use-and-land-cover-estimates-for-the-united-states/ (accessed on 2 February 2023).
  18. Gebrehiwot, A.A.; Hashemi-Beni, L.; Kurkalova, L.A.; Liang, C.L.; Jha, M.K. Using ABM to Study the Potential of Land Use Change for Mitigation of Food Deserts. Sustainability 2022, 14, 9715. [Google Scholar] [CrossRef]
  19. Hashemi-Beni, L.; Kurkalova, L.A.; Mulrooney, T.J.; Azubike, C.S. Combining Multiple Geospatial Data for Estimating Aboveground Biomass in North Carolina Forests. Remote Sens. 2021, 13, 2731. [Google Scholar] [CrossRef]
  20. Kurkalova, L.A.; Hashemi Beni, L.; Liang, C.L. Vegetable Production: Land Use Perspective; AgEcon Search: St. Paul, MN, USA, 2021. [Google Scholar]
  21. Dhamankar, S.S.; Hashemi-Beni, L.; Kurkalova, L.A.; Liang, C.L.; Mulrooney, T.; Jha, M.; Monty, G.; Miao, H. Study of Active Farmland Use To Support Agent-Based Modeling Of Food Deserts. Int. Arch. Photogramm. Remote Sens. Spat. Inf. Sci. 2020, XLIV-M-2-2, 9–13. [Google Scholar] [CrossRef]
  22. Barcus, H.; Lanegran, D.A. The Changing Rural Periphery: Contested Landscape, Agricultural Preservation, and New Rural Residents in Dakota County, Minnesota, USA. In Rural Transformations; Routledge: Oxfordshire, UK, 2022; pp. 91–112. [Google Scholar]
  23. Sigalo, N.; St Jean, B.; Frias-Martinez, V. Using Social Media to Predict Food Deserts in the United States: Infodemiology Study of Tweets. JMIR Public Health Surveill. 2022, 8, e34285. [Google Scholar] [CrossRef] [PubMed]
  24. McLoughlin, G.M.; McCarthy, J.A.; McGuirt, J.T.; Singleton, C.R.; Dunn, C.G.; Gadhoke, P. Addressing food insecurity through a health equity lens: A case study of large urban school districts during the COVID-19 pandemic. J. Urban Health 2020, 97, 759–775. [Google Scholar] [CrossRef] [PubMed]
  25. Karpyn, A.E.; Riser, D.; Tracy, T.; Wang, R.; Shen, Y.E. The changing landscape of food deserts. UNSCN Nutr. 2019, 44, 46. [Google Scholar] [PubMed]
  26. Dhamankar, S.S.; Hashemi-Beni, L.; Kurkalova, L.A.; Liang, C.L.; Mulrooney, T.; Jha, M.; Miao, H. Study of Active Farmland Use to Support Agent-Based Modeling of Food Deserts; The International Archives of the Photogrammetry Remote Sensing and Spatial Information Sciences: Beijing, China, 2020; Volume 44. [Google Scholar]
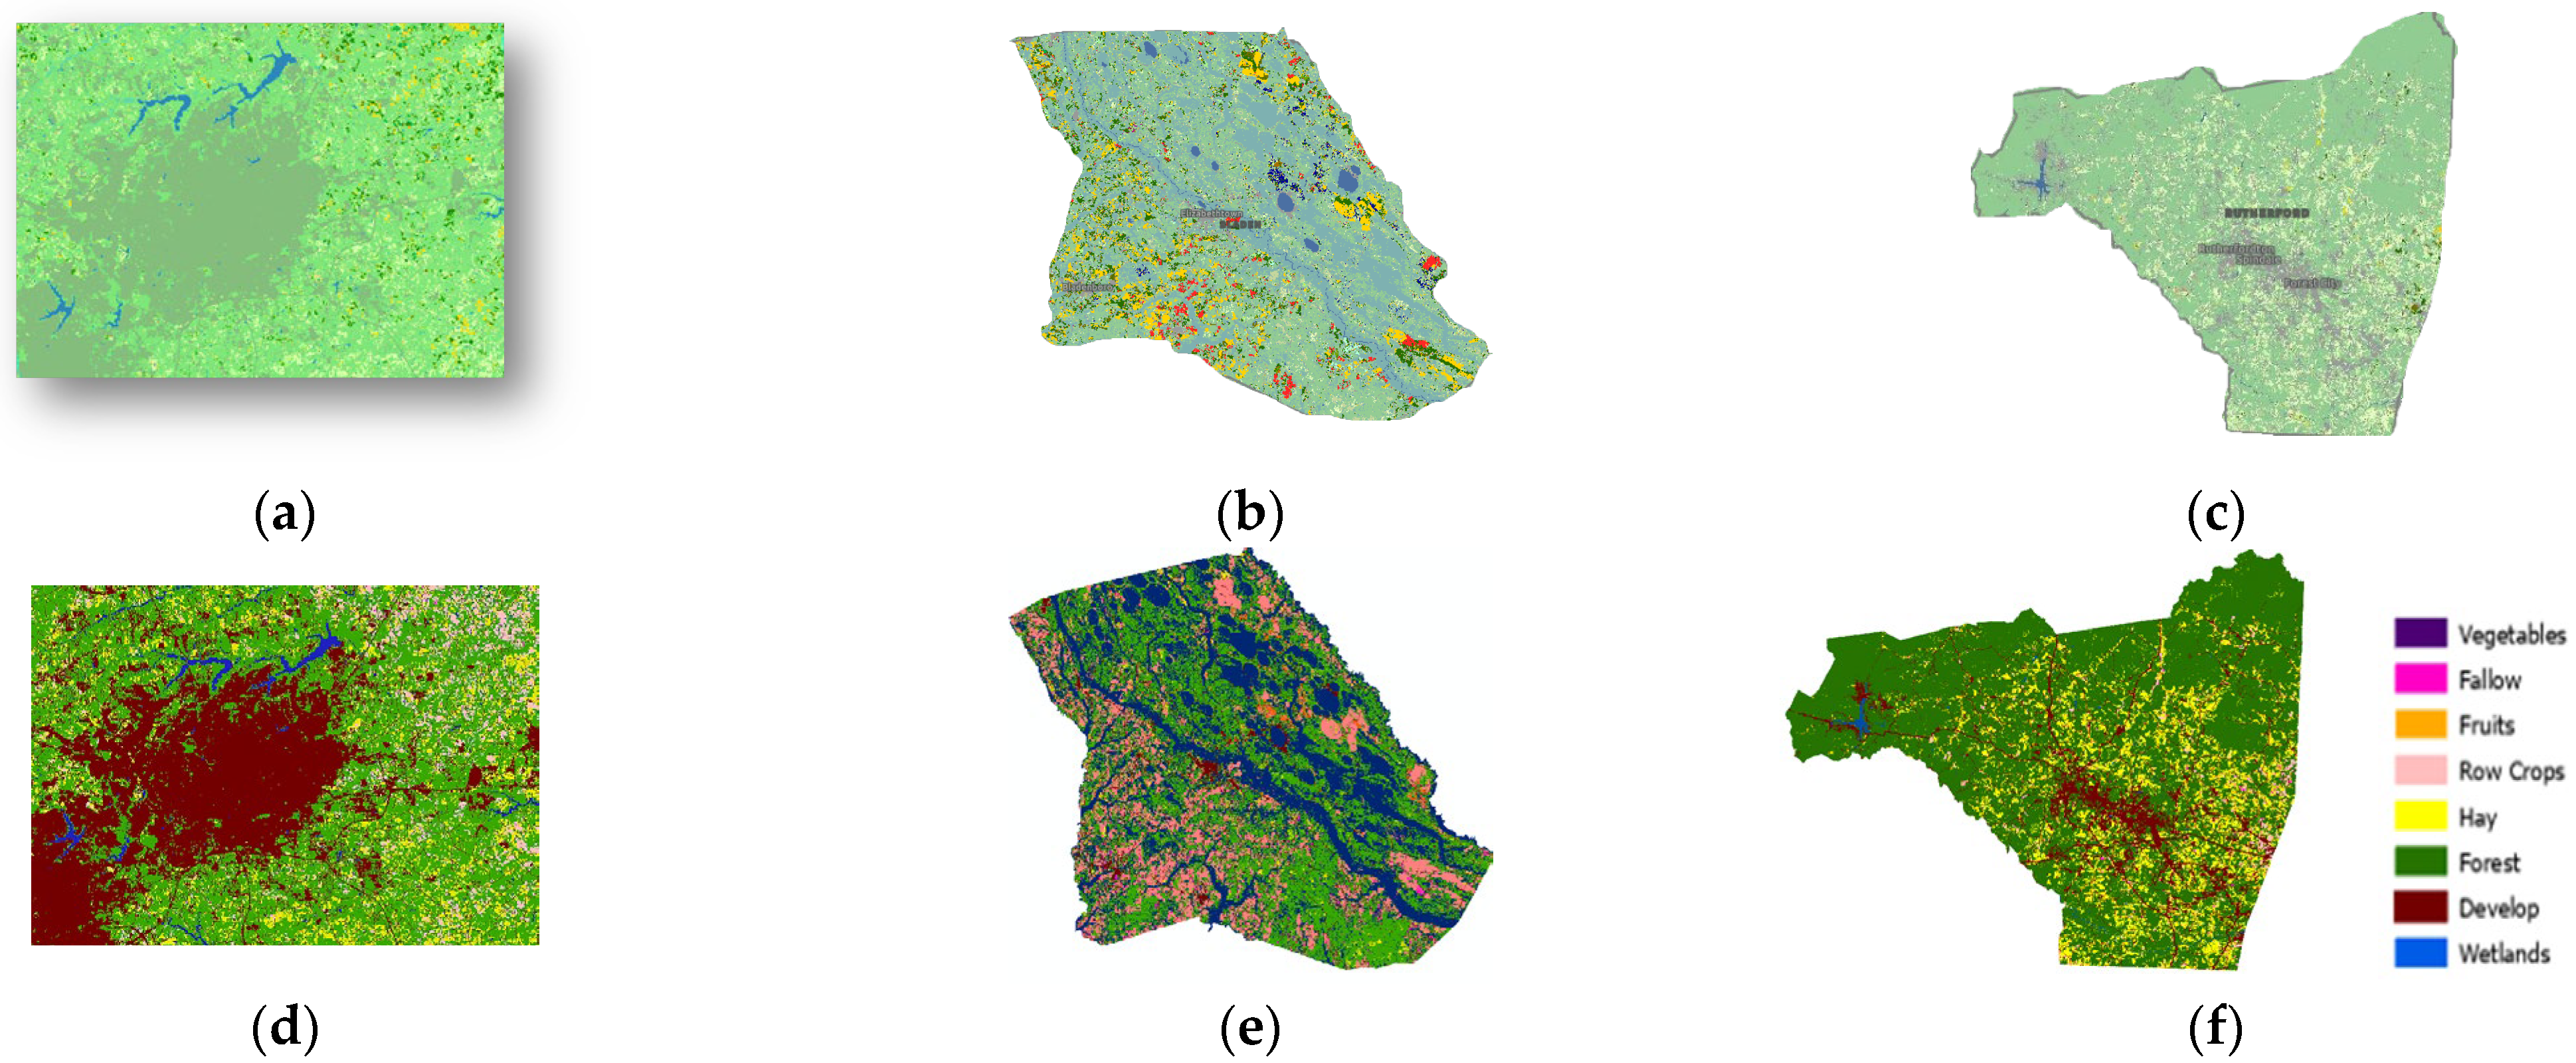
Figure 1. Conceptual framework.
Sustainability 15 07848 g001
Figure 2. Study areas. Bladen, Guilford, and Rutherford, North Carolina, USA.
Sustainability 15 07848 g002
Figure 3. (i) Unclassified land use data for Guilford (a), Bladen (b), and Rutherford (c). (ii) CDL reclassification for all three counties: Guilford County (d), Bladen County (e), and Rutherford County (f).
Sustainability 15 07848 g003
Figure 4. Overlay of FD polygons on reclassified CDL for Guilford County.
Sustainability 15 07848 g004
Figure 5. FD maps with four definitions for Guilford County.
Sustainability 15 07848 g005
Figure 6. FD for all three counties in 0.5–10 miles (a) Guilford (b) Rutherford (c) Bladen.
Sustainability 15 07848 g006
Figure 7. Socioeconomic analysis of FD areas in Bladen, Rutherford, Guilford.
Sustainability 15 07848 g007
Table 1. Land Use and Land Cover Reclassification.
Old ClassificationNew ClassificationType
12; 43; 46–50; 53; 54; 57; 206–209; 213; 214; 216; 219; 222; 229; 243; 245–2481vegetables, potatoes, and melons (VMP)
612fallow/idle
55; 67–69; 74; 77; 218; 221; 242; 2503fruits, nuts, and berries (F.N.B)
1–6; 10; 11; 21; 23–32; 34; 39; 41; 42; 44; 60; 205; 224–226; 228; 235–241; 2544row crop(field crops)
36; 37; 58; 1765hay, grass, or pasture (Hay and forage crops)
13; 59; 63; 70; 71; 141–143; 1526cultivated Christmas tree (CCT), nursery greenhouse floriculture (NGF), and forests
121–124; 1317developed or barren
87; 92; 111; 190; 1958wetlands, aquaculture, water
Disclaimer/Publisher’s Note: The statements, opinions and data contained in all publications are solely those of the individual author(s) and contributor(s) and not of MDPI and/or the editor(s). MDPI and/or the editor(s) disclaim responsibility for any injury to people or property resulting from any ideas, methods, instructions or products referred to in the content.

