Article

Water Use Efficiency and Productivity of Irrigated Rice Cultivation in Nigeria: An Application of the Stochastic Frontier Approach

1
Department of Agricultural Economics and Extension, Faculty of Agriculture, Federal University Dutse, Dutse 720223, Nigeria
2
Institute of Agricultural and Resource Economics, University of Agriculture, Faisalabad, Faisalabad 38000, Punjab, Pakistan
3
Faisalabad Business School, National Textile University Faisalabad, Faisalabad 37610, Punjab, Pakistan
4
Department of Finance, Accounting and Economics, University of Pitesti, Targu din Vale, No. 1, 110040 Pitesti, Romania
5
Institute for Doctoral and Post-Doctoral Studies, University “Lucian Blaga”, Bd. Victoriei, No. 10, 550024 Sibiu, Romania
6
Department of Agronomy, Faculty of Agriculture and Biotechnology, Bydgoszcz University of Science and Technology, Al. Prof. S. Kaliskiego 7, 85-796 Bydgoszcz, Poland
7
Faculty of Economics, Széchenyi István University, 9026 Győr, Hungary
*
Authors to whom correspondence should be addressed.
Sustainability 2023, 15(10), 7824; https://doi.org/10.3390/su15107824
Submission received: 3 March 2023 / Revised: 9 April 2023 / Accepted: 14 April 2023 / Published: 10 May 2023

Abstract

:
In the face of declining water resources and low agricultural water productivity, it is vital to increase agricultural production efficiency and efficiency of water usage. The efficacy of irrigating rice fields in Nigeria is evaluated here using a stochastic frontier analysis. This is a parametric frontier that is assumed to have half-normal distribution, allowing the model to be separated from normal errors in a composite error model. Samples of 382 surveys were used in the study; out of the total number, 361 surveys were retrieved and used for the analysis. The analytical tools used in the study are: gross margin, water productivity analysis, and stochastic frontier approach. The results indicate an average yield of 4.69 and 4.94 tons/hectare, and net farm income of $415 and $364 for the farmers using canal irrigation and farmers using tube wells, respectively. The results also showed physical and economic water productivity of 0.51 kg/m3 and $0.11/m3 for canal water users, and 0.568 kg/m3 and $0.10/m3 for tube well users. The canal water users had a mean irrigation water use efficiency of 0.76, compared to 0.70 for the tube well users. The study recommends that effective extension services and their coverage be enhanced to provide adequate training to rice farmers on water use efficiency and the transfer of innovations and farming technologies to farmers.

1. Introduction

The current global water challenge is of concern in ensuring food security and sustainability. Agriculture is one of the primary consumers of water withdrawals globally, accounting for over 70% [1]. Due to competing water needs by different sectors of the economy, it has become a scarce resource in many countries [2]. Countries with abundant water have now entered the category of water stress [3]. To feed a growing global population, particularly in developing nations, would require more irrigated land and more efficient use of existing resources [4]. Africa has an irrigation potential of 204 million hectares, however, only 13 million hectares are currently equipped for irrigation [5]. Compared to 37% in Asia, and 14% in Latin America, only 6% of Africa’s cultivable land is irrigated [6], with more than two-thirds of this land located in Egypt, Madagascar, Morocco, South Africa, and Sudan. Rapid population growth and poor agricultural productivity have renewed calls for more irrigation development and resource use efficiency in Africa [7,8].
Low input use efficiency and small landholdings between 0.5 to 2.5 ha have characterized the farming system [9]. As a result, water and labor productivity are low [10]. Nigeria is Africa’s second-largest rice producer [11], and biggest in West Africa [12]. However, rising demand has outpaced local production, making the country the second-biggest rice importer after China [13]. Although the government has been implementing several development programs to increase rice productivity and production, less work has been devoted to research and training to improve farming households’ efficiency [14]. The average paddy production in rainfed, and irrigated agriculture is 2.0 and 3.5 MT/ha, respectively [15]. This low productivity is mainly due to low-tech agricultural equipment and low technical efficiency [16]. According to [17,18], Nigeria’s future food self-sufficiency can only be fulfilled by expanding irrigated land and improving resource use efficiency.
Rice has become Nigeria’s most important agricultural crop [19]. This is evidenced by the country’s annual consumption, which has increased from less than 1.0 million metric tons (MT) in the 1960s to more than 6.9 million MT in 2019 [20]. The country’s yearly rice intake per capita is 46 kilograms [21]. Nonetheless, during the previous two decades, consumption has expanded at a rate close to four times that of the global consumption growth [22]. Rice accounted for 10% and 6.6% of overall consumer spending, respectively [23]. In 2017, the total annual consumption was 6.4 million tons, accounting for over 20% of total consumption in Africa [22]. Although irrigated rice ecosystems account for 54% of worldwide cultivated rice acreage, and 75% of global rice output, they account for just 17% of farmed land in Nigeria [24].
Irrigation Water Usage Efficiency (IWUE) is a concept introduced by [25]. Since then, several studies have been undertaken to determine the efficacy of irrigation water utilized in various regions of the world [26,27,28,29,30,31,32]. The notion of efficiency analysis is a single-factor, input-oriented calculation of Technical Efficiency (TE), a fundamental aspect of production economics [26]. Due to increasing water shortages and the need to produce more food, water use efficiency and water productivity have captured the attention of the world’s foremost experts [33,34,35]. Apart from increasing planted land, raising the paddy yield may be done by substantially using inputs and advanced technology, or enhancing farmers’ resource use efficiency. While increasing rice yield through improved technology and input use is a positive strategy, it requires more significant input expenditure, which can be a hurdle for smallholder farmers [36,37]. Nigeria’s rice output is expected to reach 5 million tons in 2021, a 58% increase over 2013, but significantly below the local demand of 7 million tons. The average yield per hectare is only 2 tons, less than half of the global average, and the majority of the rise in output is attributed to increased planted area, rather than productivity gains (Figure 1). It is better to increase rice output by improving technological efficiency, especially in Sub-Saharan Africa, where funding is low and acquiring more input is difficult. Following on from the prior study, this study aims to evaluate rice farmers’ IWUE and water productivity in the KRIP.
Rice cultivation in Nigeria is characterized by low productivity; Nigeria’s average rice yield (2.0 t ha−1), and average water productivity (WP) of 0. 35 kg m3, are not comparable to the world average’s paddy output of 4.3 t ha−1 and WP of 0.58–1.23 kg m3 [38]. Various studies have studied the efficiency of paddy production in Nigeria [9,16,39]. However, there has been no study on IWUE in rice production. In seeking to address the research gap above, the study intends to compute irrigation water efficiency and water productivity in rice farming between farmers using canal water and those using tube wells, and also to identify the determinants of IWUE. Using a stochastic frontier approach, researchers used 384 paddy farms to evaluate irrigation water efficiency. The results of this research could be used by policymakers and agricultural extension workers in Nigeria to provide recommendations for increasing the efficacy of irrigation water used in rice cultivation.
What follows is a breakdown of the article’s remaining content. This is followed by a discussion of the conceptual framework and an overview of how the concept of water production and irrigation water efficiency was developed. The information and key points of the study areas are shown in the third section. Last, but not least, certain policy ramifications are discussed and summarized.

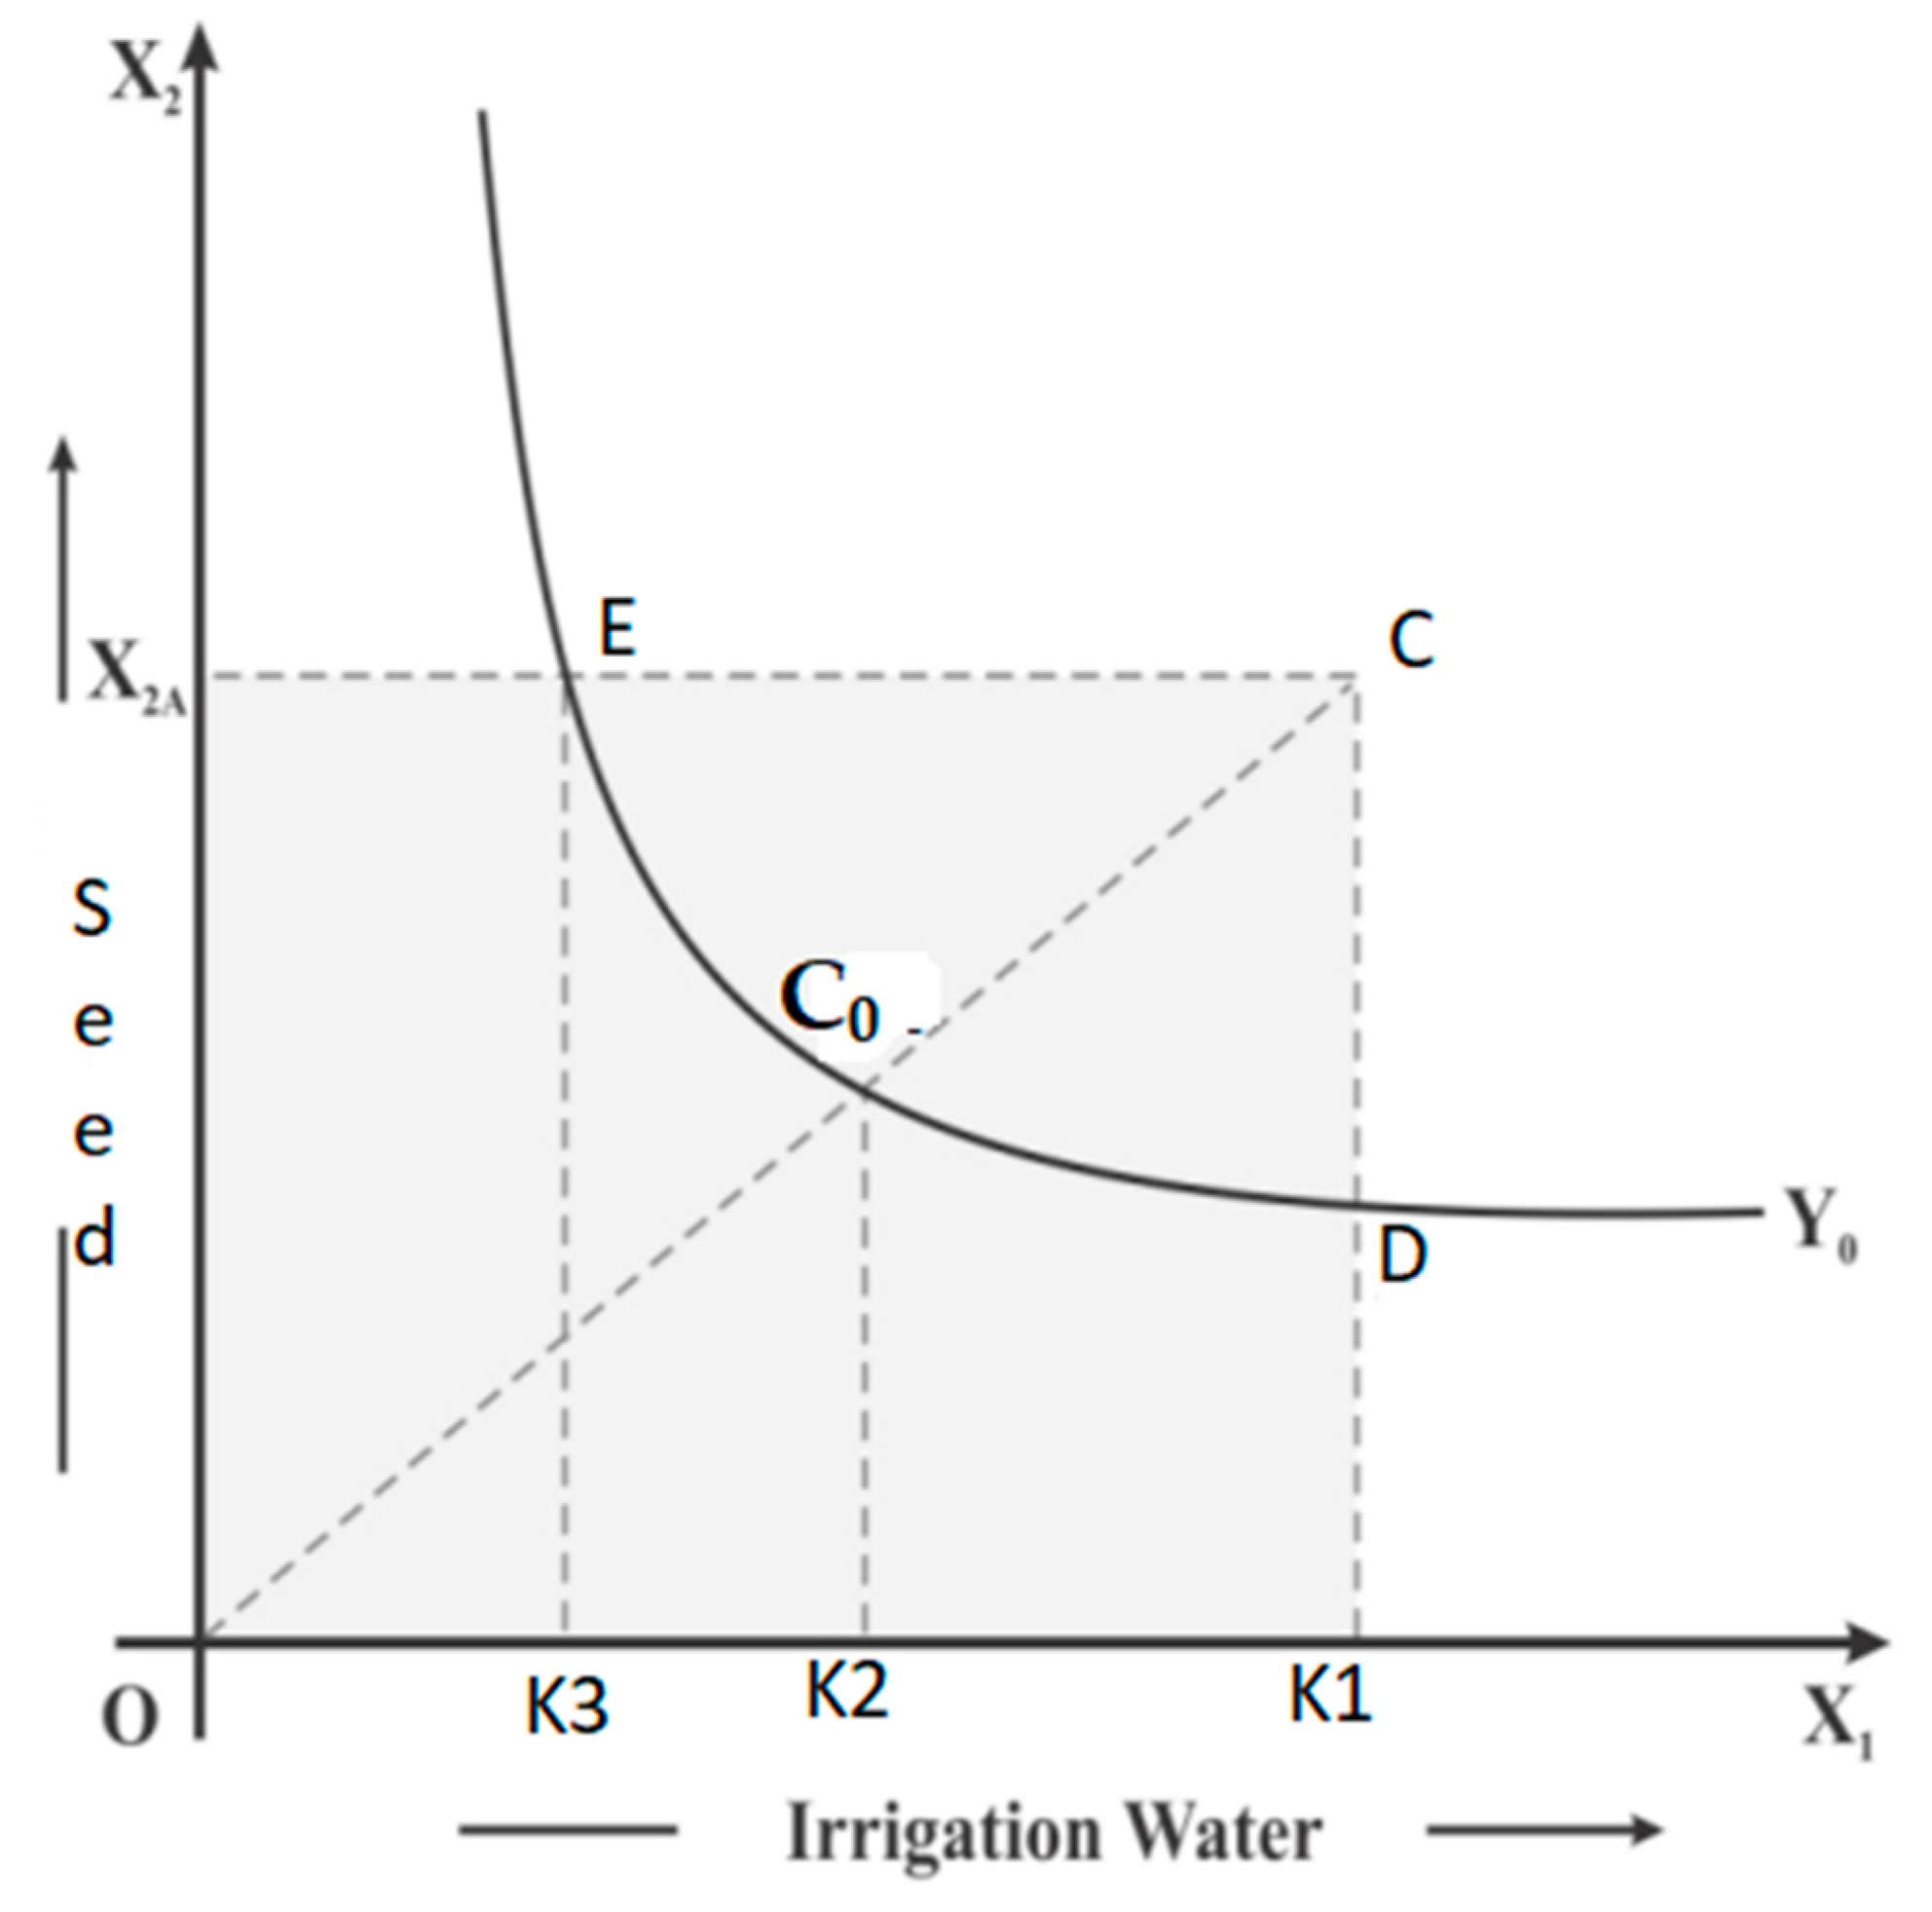
2. Conceptual Framework

IWUE refers to a rise in the efficiency with which finite irrigation water resources are used [40]. For irrigated agriculture, the IWUE can be calculated as the ratio of yield to administered water. Farmers can increase IWUE by enhancing crop management. Improving the resource’s beneficial use is the most effective method for improving water use efficiency [41,42]. Socioeconomic, institutional, and improved agronomic practices are the key determinants of improving the beneficial use of irrigation water (Figure 1). It is critical to use water resources responsibly and to improve IWUE. Physical water productivity (PWP, kg m3), increasing income based on irrigation water usage, and economical water productivity (EWP, US$ m3) are therefore critical to the long-term viability of irrigated agriculture and water use [43]. Increasing PWP in irrigated agriculture minimizes the demand for extra water, a risky solution to rising water scarcity [42,44].
Moreover, IWUE, water productivity, yield, and net farm incomes were evaluated by the use of different indicators, including socioeconomic, institutional, and farmer management practices (Figure 2).
The interaction between socio-economic indicators, institutional, and crop management practices affect IWUE at the farm level. For example, in rice production, improved cultivars can achieve a higher yield per acre than local cultivars, but the latter also have more labor demands for other cultural practices [45]. In comparison to manual weeding, the usage of herbicides can result in higher yields and water productivity, because of the decreased labor needs. Water adequacy, dependability, equity, and efficiency affect water productivity [46]. Maikasuwa and Ala [47], also found that education effectively influences small-scale farmers’ decisions on efficient water use. Contrary to this, [29], concluded that the educational level of respondents does not improve IWUE. These examples show how farm performance is affected by the interconnections between management techniques, socio-economic factors, and institutional issues.

3. Methodology

3.1. Study Area

There are more people living in Nigeria than in any other country on the African continent, making it the seventh most populated country in the world [48]. It was projected that there were 203 million people living in the nation as of the year, 2019, with 51.4% of them residing in rural regions, and with a population density of 221 persons per square kilometer [49]. The number of people living in poverty and uncertainty about their food supply is particularly high in Nigeria [50,51,52]. The Federal Government of Nigeria is the owner of the Hadejia-Jama’are River Basin Development Authority (HJRBDA), which is responsible for the administration of the Kano River Irrigation Project (KRIP). Kano State is confined by latitudes 10°3′ N to 12°4′ N of the equator, and longitudes 7°4′ E to 9°3′ E of the prime meridian [53]. The state has four (4) distinct seasons: Rani (warm and dry), Damina (wet and warm), Kaka (cold and dry), and Bazara (hot and dry) are Kano’s four diverse seasons. The average annual rainfall is 884 mm, but it differs greatly by region, from 600 mm in the north to 1100 mm in the south. August is the wettest month, with the most rainstorms and sediment deposition, while the average annual temperature varies from 26 °C to 32 °C, with a high diurnal temperature of 13.1 °C, and a relative humidity ranging from 17% to 90% [53].
As indicated in Figure 3, the project utilizes Tiga Dam to provide irrigation water to three local government areas in Kano state: Kura, Bunkure, and Garun Malam. The study area is located between 11°38′59″ and 11°37′53″ north latitude, and 8°25′28″ and 8°27′26″ east longitude [21].
The weather of the area is marked by fluctuations in both temperature and humidity that are extensive in scope and occur at a rather quick pace [54]. Humidity, at times, could rise to 100% in an area considered naturally dry. The daily lowest and most extreme temperatures are 14 °C and 35 °C, respectively [21].

Sampling Procedure and Sample Size

Farmers who use canals’ water and those that use tube wells to water their farms are the respondents who took part in the research. A multi-stage sampling procedure (MSP) was employed for the sample selection. At the beginning, all three local government areas (LGAs) of the canal irrigation command area (Kura, Bunkure, and Garun Malam) were chosen for the field study. The second phase of the sample selection was done at the irrigation community level. Twenty-four (24) communities were chosen, 12 from the irrigation command area, and 12 from the non-command site (where farmers use tube wells). The twenty-four communities were chosen purposively, due to high rice production in the communities.
Phase three of the fieldwork involved the actual survey, whereby detailed data was collected. Due to uneven population, this study conducted a proportionate random sampling of 217 canal water users and 165 tube well users. Out of the total number of 382, only 361 surveys were retrieved and used for the analysis.
Yamane’s formula was used for sample size calculation:
n = N 1 + N e 2
where, N = total population; n = representative sample size; and e = error margin (0.05).
A semi-structured questionnaire and physical water measurement were used to collect input and output data, and quantity of water applied to each rice field selected in the study area. Trained enumerators and a supervisor were used for the data administration and water measurement.

3.2. Analytical Tools

Various statistical and econometric methods were used to examine and synthesize the acquired data (stochastic frontier model, water productivity, and net farm income). Data analysis and summarization were performed using descriptive statistics. To further investigate the efficiency and factors that influence rice farmers’ irrigation water use, an econometric model was developed in Frontier 4.11. To gather information, we employed an interview guide. In the course of the interview, we were able to gather data on a number of inputs and outputs. The inputs are estimated as labor use, including hired (permanent and casual) and family labor in person-days; pesticide and herbicide in liter hectare−1; fertilizer used in kg hectare−1; and surface and groundwater use for beneficiaries and non-beneficiaries in m3 acre−1. We measured the output produced in kg acre−1, and calculated irrigation water volume, employing an approximate estimate model, as employed by [55].
This technique involved using a 22-L plastic bucket for collecting the water that flowed through the siphons. The time required to fill the bucket was timed using a stopwatch. To ensure uniformity, the bucket was set in a tiny dugout, with a surface area roughly matching that of the irrigated patches. Daily hours of water application were multiplied by the flow rate. By multiplying the daily measured quantities by the frequency of water application during the water application period, the total amounts of water applied by the farmers could be determined. The average amount of water used during an irrigation season per acre was estimated by taking the ratio of total water use in cubic meters (m3) by the total farm area in acres.
This formula obtained the total water application for the cropping season:
X w = G r · D h · F w
where,
  • X w = Approximate amount of water applied for the cropping season in M 3
  • G r = Discharge rate liter per second
  • D h = Farmer daily hours of water application
  • F w = Frequency of water application
The actual amount of water applied per hectare was:
G r · D h · F w size   o f   t h e   f a r m   i n   h e c t a r
The discharge rate was estimated by applying Michael’s [56] formula:
G r = V T
where,
  • G r = Discharge rate litres per second
  • V = volume of the container in liters
  • T = time taken in seconds to fill the container
The Stochastic Frontier Analysis (SFA) models take into account the possibility of output disruption by arbitrary shocks that are beyond the control of the producers. As a result, in these models, it is possible to separate the impact of technical efficiency fluctuation from the impact of random shocks on the output. Aigner et al. [57], introduced this model. An input-focused single-factor technical efficiency metric is irrigation water use efficiency [32]. The idea of input-specific technical efficiency or IWUE, in the case of this study, is illustrated in Figure 4.
For example, three farms, C, D and E, use two inputs (X1 irrigation water, and X2 seed to produce Y0 output). Farm C is said to be inefficient, because it is away from the frontier. Now, let the inefficient farm, Y0, produce an output, using X2A amount of seed, and K1 quantity of water. The radiated contraction K1 and K2 produces a projected point, C0, on the frontier, which is technically efficient. The technical efficiency of farm C is given by the ratio TEc = OC0/OC, and the irrigation water use efficiency is obtained by the given the ratio K2/K1. The IWUE measure determines both the lowest possible water use K2, and the determined potential saving in water use K1–K2, without reduction in the prevailing output level Y 0 .
Estimation of TE and IWUE
y i = exp   ( x i β + v i μ i = exp x i β + v i e x p ( μ i )
or,
I n y i = x i β i + v i μ i
where,
  • y i = Vector representing produced quantities by the production unit
  • x i = Input used
  • β i = Vector of co-efficient
The v i and μ i are vectors that represent distinct error components.
The MLS technique offers a quick check for the detection of technical inefficiencies in data. Similarly, if μ i = 0, then ε i = 0 . Therefore, the error term is symmetric, and there is no proof of technological inefficiency in the data. If μ i > 0 , however, there is an indication of technical inefficiencies in the data, as the distribution of ε i = v i μ i becomes negatively symmetric. The efficiency metric described does not provide an assessment of the efficient use of individual inputs, such as irrigation water, in this case. As shown in Figure 4 conceptually measuring IWUE necessitates an estimate of the unknown quantity K2. It is easy to see that K 2 = K 1 I W U E by applying the formula IWUE = K2/K1. The outcome can be written as follows, by replacing K2 in Equation (4):
l n y i = f X i , K i E , β + v i μ i   where ,   K i E = K 2
Equating Equation (4) with Equation (5) and employing the estimated parameter β yields the IWUE.
W i = f X i , Y i β   exp   ( ε i V i μ i )
where,
  • W i = quantity of irrigation water used (i = … … … N)
  • y i = is the amount of output produced by the farms
  • X i = is the other production input used
  • β = is the unknown coefficient to be an estimate
  • ε i = is the composite error term,
  • V i ~ N 0 , δ 2   and   μ i 0   a   non     n e g a t i v e   e r r o r   t e r m   d i s t r i b u t e d   a s   N + ( 0 , δ 2 )

3.2.1. The Inefficiency Model

The inefficiency of IWUE was modeled in terms of the factors that are presumed to affect the farmers’ efficiency of irrigation water use. The determinants of IWU efficiency, (μi), are defined by:
μ = δ0 + δ1Z1+ δ2Z2 + δ3Z3 + δ4Z4 + δ5Z5 + δ6Z6 + δ7Z7 + δ8Z8
where, μ is a non-negative random term representing inefficiency; the IWU δ0 is a constant; δ1–δ9 are parameters to be estimated; and Z1–Z8 are farm-specific and farmer-specific variables, as stated below:
Z1 = Farmer’s age (years)
Z2 = Education of the respondents (years)
Z3 = Experience in farming (years)
Z4 = Family size (number)
Z5 = Marital status (1 for married, 0 for single)
Z6 = Gender (Male = 1, Female = 0)
Z7 = Contact to extension agents (1 = contact, 0 = no contact)
Z8 = Access to credit
Z9 = Annual income (Naira)
Along with the variance parameters δ2 and γ, δ0 and δ1–δ9 are undetermined variables that must be calculated. Here, we derive a relationship between the random error variance δv2, the inefficiency effect variance δu2, and the model variance as a whole:
δ 2 = δ v 2 + δ u 2
and,
γ = δ u 2 / δ 2
Diagnostic statistics, such as the Gamma (γ) and the ( δ 2 ) coefficients, reveal whether or not the stochastic frontier function is useful, and whether or not the assumptions about the error term’s distribution are reasonable. Gamma (γ) demonstrates that the distributional shape proposed for the composite error term is correct, and that the model is well-fitting. It indicates that the primary sources of random mistakes are not to be found in the production and cost functions.

3.2.2. Physical Water Productivity

Increasing water productivity has been argued by many researchers [58,59,60,61] as pre condition for reducing global food insecurity and poverty among farming household. Water productivity measures how much food can be harvested for a given quantity of irrigation water [62]. Physical or technical water productivity measures the yield of a crop in relation to the amount of water used for irrigation. Technical water productivity (kg/m3) is calculated by dividing yield (kg/ha) by consumptive water use (m3/ha), as stated by [63].
PWP = f x 1
where, f = output produced in kg, and x = quantity of water applied in m3.
The ratio of the gross value of the product to the volume of irrigation water used is known as economic water productivity [58,64]. It also relates to agricultural water use’s economic benefits and expenses [61]. It can be stated in several ways, including net profit per water unit [65]. Ronald and Marlow [64] define economic water use efficiency as the value of the product generated per unit of water consumed.
Mathematically,
EWP = W x 1
where, EWP = economic water productivity, W = value of the product produced in kg, and x = unit of water consumed in m3, while a return to investments show the returns per unit of cost of irrigation water (unitless).

3.3. Validity and Reliability of the Instrument

The study used a survey method, and trained enumerators were used to administer the questionnaire. The enumerators were rigorously monitored during the survey to ensure that respondents’ responses were accurate. Before data administration, the questionnaire was pre-tested, and adjustments were made in line with the study objectives. Moreover, a reliability analysis was conducted. A Cronbach’s alpha of 0.67 was obtained, which is appropriate for sociological research, according to [66], who believe that Cronbach’s alpha over 0.6 is appropriate.

4. Results

4.1. Cost and Return Analysis of Rice Production in KRIP

Table 1 presents the estimated analysis of the cost and return of rice production in the study area. The results show that the average per-acre cost of production was $484.44 and $547.61 for canal water users and tube well users, respectively. For the canal water users, the input used constitutes 29% of the production cost, labor constitutes 53%, while fixed cost constitutes the remaining 18% of the production cost. Similarly, for the tube well users, the input used constitutes 37% of the total cost, labor constitutes 45%, and fixed cost constitutes the remaining 18%. The gross margin (GM) and net farm income (NFI) obtained by the canal water users and tube wells users per acre were $502.68, $415.45, and $462.73, $364.83, respectively. These indicated that rice production was profitable in the study area. For the benefit-cost ratio, the proportion of unity indicates breakeven, less than unity indicates loss, and greater than unity indicates the profitability of the enterprises. The benefit-cost ratio is used in different analyses to compare profitability between enterprises or groups [67]. For this study, the result indicated ratios of 1.85 and 1.67 for the beneficiaries and non-beneficiaries, respectively, consistent with the conclusion of [39,68] in their analysis of rice profitability in Ebonyi state, Nigeria.

4.2. Estimation of Physical and Economic Water Productivity

Kijne et al. [69] define water productivity (WP) as an indicator of the efficiency with which agricultural systems transform water into food. Therefore, agricultural water productivity measures the output of a system in relation to the amount of water it uses. In terms of time and place, water productivity can be defined and assessed for the entire system, or for individual components [70].
Improving agricultural WP is a severe challenge of food production and safeguarding sustainable livelihoods [69]. The results of water productivity are presented in Table 2; the results show that the average water productivity of canal water users was 0.514 kg/m3, while that of tube well users was 0.542 kg/m3. This finding was lower than the average range, 0.60–1.60 kg/m3, found in other studies [71], but closely similar (0.56 kg/m3) obtained by [32]. The analysis further shows the average economic water productivity of 0.11 dollar/M3 and 0.10 dollar/M3, respectively, for canal water users and tube well farmers.
The economic water productivity was further confirmed by the return per water cost, which was 79 and 5.68, respectively, for the canal irrigation farmers and tube well farmers, meaning that, for every dollar spent on the water, canal water users had a return of 79 dollars, compared to tube well farmers, who had a return of 5.5 per dollar invested. This result was not surprising, because tube well water users spent 12% of the total cost of their production to purchase fuel for powering generators, which was just 0.08% for the canal users as water charges per production cycle.

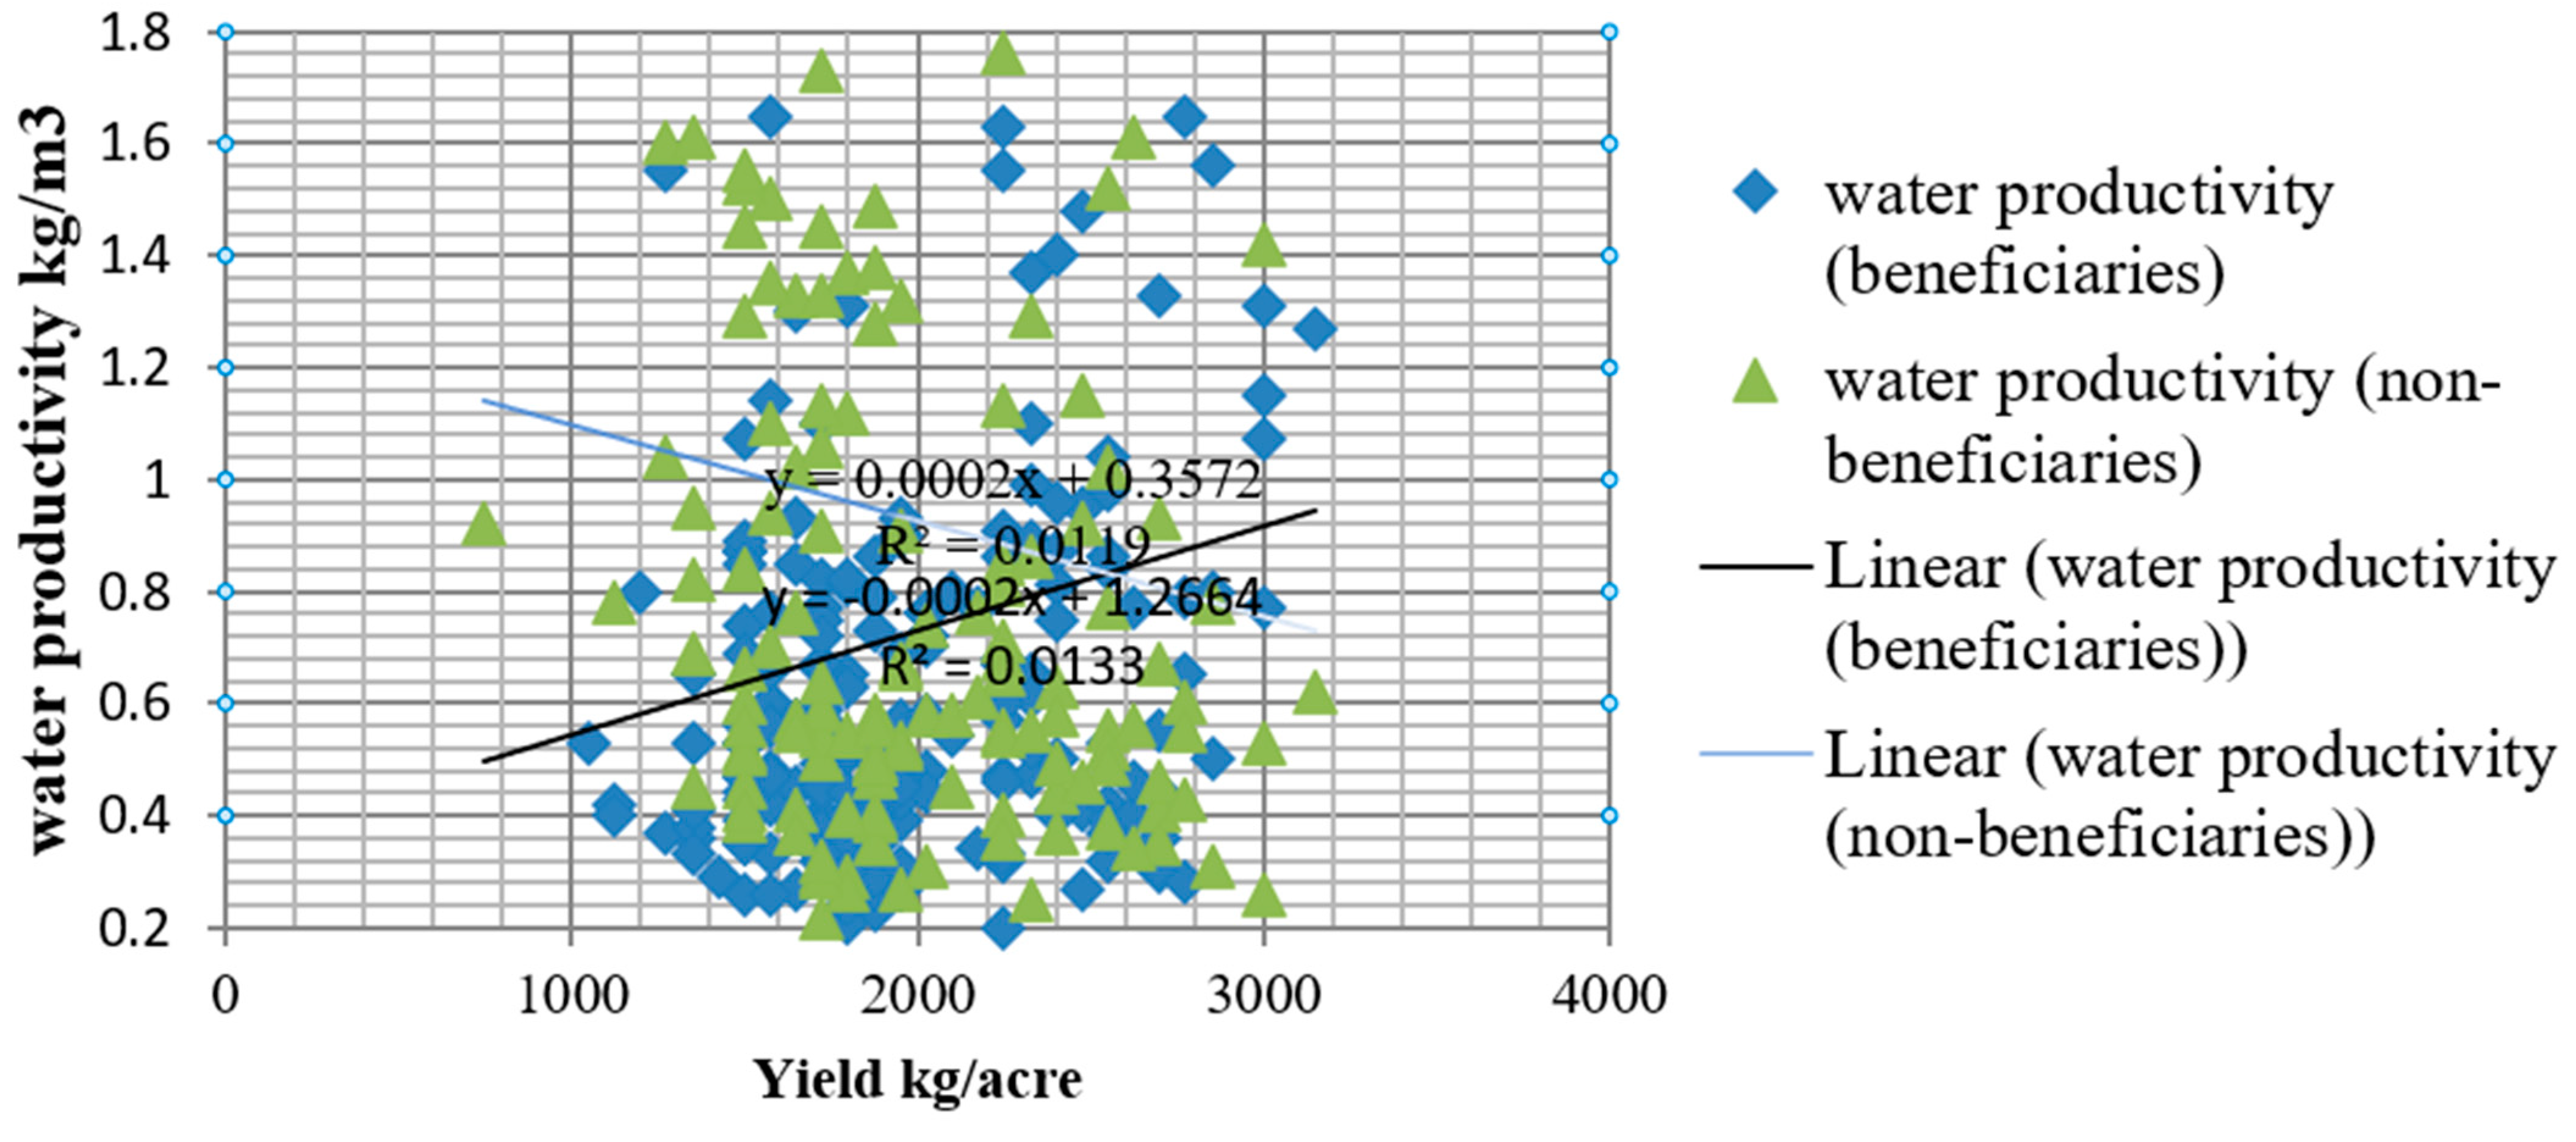
4.3. Scattered Plot between Canal Users and Tube Well Users

The scattered plot in Figure 5 indicated that the maximum water productivity of the canal water users was 1.17 kg/m3, while the minimum was 0.72 kg/m3, with a mean water productivity of 0.51 kg/m3. The yield parameter indicated the lowest yield of 787 kg, and the maximum of 3150 kg. For the tube well water users, the statistics showed a minimum, or lowest, water productivity of 0.49 kg/m3, and a maximum of 0.96 kg/m3, with a mean productivity of 0.586 kg/m3. Among sample farmers, the results of the analysis found a minimum yield of 760 kg/acre, and a maximum of 3225 kg/acre. The scattered plot also shows an equilibrium point of 0.84 kg/m3. At this point, both the canal water users and tube well water users could realize up to 2600 kg of paddy per acre.

4.4. Score Distribution of Irrigation Water Use Efficiency (IWUE)

The degree of IWUE is the fraction of the lowest possible to investigational IWU, restrictive on detected levels of the target output and input bundles. As a result, addressing irrigation water consumption efficiency at the crop level could help guide irrigation decisions on farms. Table 3 shows a gap that needs improvement in irrigation water use efficiency between canal water users and tube well water users. The average IWUE score for canal water users and tube well users was 76% and 70%, respectively. In other words, the findings showed that the former could save 24%, while the latter could save up to 30% of the current irrigation water usage, without reducing the present output levels.
The results (Table 3) indicated that 18.4% of the canal water users were operating within efficiency score intervals between 0.30 and 0.69. Moreover, 77% of them were operating at an efficiency score between 0.70 and 0.89. The remaining 4.6% were within an efficiency score of 0.90–0.99. Similarly, for the tube well users, 4.6% were operating within the efficiency score of <30%, 15.8% were within the efficiency score of <60, 78.3% were within the score of between 0.60–0.89, while only 1.3% was above 90%.

4.5. Determinants of Irrigation Water Use Efficiency (Canal Water Users)

Table 4 presents the results of the estimated determinants of IWUE for rice production in the study area. The estimated coefficient (1.77) for the quantity of seed used was positive and statistically significant. This implies holding other variables constant; there could be a 1.77 increase in the IWUE for every 1% increase in the seed used. The estimated coefficient (1.52) for the herbicide used was positive and significant, suggesting that every 1% increase in the use of herbicide could lead to a 1.52% increase in IWUE. The fertilizers’ coefficient (NPK, Urea) was negative, but statistically insignificant. The coefficient of output obtained (−6.0261) was negative and statistically significant. At the 1% probability level, the positive value of the depreciation coefficient for fixed assets was statistically significant.
Part B of Table 4, which presented the determinants of the inefficiency in the irrigation water use, indicates that there was a statistically significant relationship between farming experience, family size, and extension visit for various combinations of risk factors. There was a statistically negligible negative correlation between farmer age and water efficiency (−0.078). It follows that, as one ages, their ability to conserve water dwindles. The findings provide credence to the claim that aging farmers are less productive. This may occur because farmers lose efficiency with age, and because younger farmers are more likely to embrace and adopt innovative farming practices. Consequently, this finding is consistent with [72,73]. At the 5% confidence level, the coefficient of farming experience was 0.139, suggesting that more experienced farmers were more productive. This is because farmers gain wisdom from their past failures as they gain expertise. The coefficient of extension service is a dummy variable; 1 for access to extension service, and 0 otherwise. Therefore, the negative coefficient of (−2.16) means that farmers with no access to extension services lose efficiency of 2.16%. Alternatively, a 1% increase in extension contact could increase water use efficiency by 2.16%. Education was not statistically significant; this is in line with [74], who found that education does not improve irrigation water use efficiency.
The variance of inefficiency term of the composite error term (σ2) indicates a good fit, and the correctness of the specified distributional assumption of the composite error term is found significant. Gamma, ( γ = σ 2 u / ( σ 2 u + σ 2 v ) ) which shows the ratio of the deviation from frontier caused by inefficiency is found to be 89 and 87%, respectively, and is significant for both canal water users and tube well farmers.
The need to improve IWUE stemmed from rising demands for water from households and businesses [75,76]. As presented in Table 4, the quantities of NPK and Urea fertilizers, fuel use, and capital asset depreciation were all statistically significant variables influencing IWUE. The coefficient (1.6) of fertilizer (NPK) was positive and significant (5% level) while controlling for other factors. Multiple studies concluded that higher soil nitrogen levels improved water use efficiency by offsetting the inevitable production decline caused by evaporation and transpiration [77,78,79]. Depreciation of fixed assets also had a positive coefficient that was significant at the 5% level of statistical testing. Thus, it may be concluded that farmers who have access to capital employ that money more effectively. The inefficiency model found that, among tube well water users, neither level of education nor household size significantly affected the efficiency with which irrigation water was used. However, there were statistically significant relationships between age, gender of the household head, access to credit, extension services, and annual income.
At the 5% level of significance, the coefficients for age, farming experience, extension contact, access to credit, and annual income were all negative. It was highlighted how each of these factors had a unique coefficient that could be used to lessen water waste. Positive and statistically significant (at the 5% level) coefficients were found for both the gender of the household head and marital status dummy variables. While having a woman as the head of the household can boost efficiency by 0.747%, having a man as the head of the household can reduce IWUE by 2.73%, and the coefficient of extension services was negative and statistically significant, indicating that inefficiency in water use decreased with increasing extension contact. This agrees with the findings of [30], who found that farmers who had greater contact with extension service personnel also had greater productivity.

5. Discussion of Major Findings

The results in (Table 1) indicate that labor accounts for the largest proportion of production costs. This analysis validated the claim made by [80,81] that agriculture in developing nations is labor-intensive. Rice production is profitable in the area of study, as indicated by the net farm income; however, canal users obtained greater profits than tube well water users. This finding is consistent with that of [82], who reported that canal water users have a higher return, due to the inexpensive price of irrigation water. Table 2 demonstrates that users of tube well water have higher water productivity than their counterparts.
The results had two implications. In comparison, the tube well users were more curious to utilize water more productively because of the cost incurred to access the resource. Secondly, the canal water users got more return per m3 of water applied, because they paid less to access the resources. Moreover, the efficiency score indicated that canal water users’ mean efficiency score was slightly higher than that of tube well users. From the results in Table 3, we can observe that the irrigation water use can be reduced by 24% for canal water users and 30% for tube well users, without reduction in the current yield, or the yield can be increased while maintaining the current irrigation water used. Rice farmers in the study area used a flood irrigation system. Flood irrigation, on the other hand, is one of the most important issues restricting irrigation water use efficiency (Kang et al., 2017). Low irrigation water use efficiency, according to [40,83] is linked to poor timing and an uneven distribution of water applications. However, improved agronomic practices, and technical, managerial, and institutional advancements can have a positive impact on water use efficiencies [84,85].
Similarly, [41,86,87] suggested irrigation scheduling based on the crop response at each growing stage as vital for increasing IWUE. Others, such as [88], prioritized deficit irrigation. Table 4 shows the determinant of IWUE and the inefficiency model estimated by Frontier version 4.1. Results of the determinants of irrigation water use efficiency for canal water users indicated that seed used, herbicide, and depreciation on capital asset were positive and statistically significant at a 5% probability level. This indicates that each of these variables could increase irrigation water use efficiency by its corresponding coefficient. This is consistent with the findings of Obianefo et al. [89], who found that seed, agrochemical, and capital assets were significant to the production frontier. The coefficient of the output obtained was negative and significant at a 1% probability level. These results show that water efficiency decreases with an increase in the output produced; in other words, a 1% increase in the output produced reduces water use efficiency by almost 6%. This is not surprising, due to the flood irrigation system practiced in the study area. Some studies [90,91] found an inverse relationship between flood irrigation and irrigation efficiency. For tube well users, depreciation on capital assets and NPK fertilizer applied were found to be positive and significant at a 1% probability level. Many studies [92,93,94] opined that the soil nitrogen level was correlated positively to water use efficiency by enhancing the increase in yield against evapotranspiration. Urea fertilizer applied and farm sizes were negative and statistically significant, indicating over-utilization of these resources.
In the water use inefficiency model, nine influencing factors of IWUE were considered in the present study. However, four variables were found to be significant: the age of the head of the household, farming experience, family size, and extension visit. The coefficient of age, family size, and extension contact were negative, suggesting that each of these variables could reduce inefficiency by its corresponding coefficient. Ng’ombe [95]; Obianefo et al. [96] revealed that gender, farming experience, and interaction with extension agents were among the socioeconomic variables that influenced technical inefficiency. The positive sign of years of experience was probably because, as years of experience increase, age also increases, and farmers are more likely to become conservatives, unwilling to accept modern farming practices. This result is consistent with that of [97], who reported that technical efficiency decreases with increased farming experience. Equally, the finding was contrary to that of [98] who found that water efficiency increases with increasing farming experience. Education had no statistical significance, and was consistent with the findings of [29], who concluded that education does not enhance the efficiency of water use.

6. Conclusions and Policy Recommendations

Water resource management remains a critical component of achieving one of the 2030 sustainable development goals that is “ending extreme poverty, hunger, and ensuring environmental sustainability”. Water scarcity has become a growing social and economic concern for policymakers and other sectors competing for water resources. The study was conducted to assess rice farmers’ water use efficiency and productivity in the KRIP, Nigeria. The study used primary data using questionnaires and physical water measurements. Stochastic frontier, net farm income, and water productivity measures were used for the analysis.
The result show that the average per-acre cost of production was $484.44 for canal water users, and $547.61 for tube well users, respectively. The net farm incomes (NFI) obtained by the canal water users and tube well users per acre were $415.45, and $364.83, respectively. The average water productivity of canal water users was 0.514 kg/m3, while that of tube well users was 0.542 kg/m3. The analysis further shows an average economic water productivity of 0.11 dollar/m3, and 0.10 dollar/m3 for canal water users and tube well water users, respectively. The mean efficiency scores were 76% and 70% for the canal water users and tube well water users, respectively. Farming experience, family size, and extension visits were the socioeconomic drivers of water use efficiency that were statistically significant. Rice growers (canal water users) have relatively good water use efficiency in the project area. From the analysis, it could be observed that there were no significant differences between most of the indicators. However, on the basis profit realized per acre, the results showed that canal water users realized a profit 14% higher than their counterpart. Similarly, there is ample potential to increase water use efficiency for both categories of farmers. Rice farmers in the study area should focus on policies to boost operations through better cultural techniques. Farmers should be educated and mobilized on the necessity of efficient water usage amid global water stress. Water prices need to be revisited to ensure that the project’s operation and maintenance costs are covered. Desirable water prices may lead to good project maintenance, while also teaching farmers that water is no longer a free resource, but rather an economic input such as any other. Similarly, different technological innovations, such as deficit irrigation, should be practiced to manage irrigation water use, while maintaining, or even improving, the current output level.

7. Limitations

To start with, due to time and financial limitations, the survey data was only gathered in one project area. As a result, just 382 farmers make up the limited dataset used in this study. Second, there are issues with sample choice and representation. The respondents for the study were chosen using a multi-stage sample selection process; however, because the method cannot be totally random at all steps, sample selection bias may exist. The choice of 57% canal water users and 43% tube well users may not mirror the accurate proportion in the population. Thirdly, there might be some errors in the way the quantity of the irrigation water use was estimated, since the management of the canal irrigation does not measure the exact water diverted to the field canal, and the farmers using tube wells do not possess meters to observe the actual groundwater use levels.

Author Contributions

Conceptualization, A.H.W. and A.A.; Methodology, A.H.W. and M.U.; Formal Analysis, M.U., K.M. and S.A.B.; Data Curation, A.H.W.; Writing—Original Draft Preparation, A.H.W. and A.A.; Writing—Review & Editing, M.R., P.P. and L.V.; Supervision, A.A. All authors have read and agreed to the published version of the manuscript.

Funding

This research received no external funding.

Institutional Review Board Statement

Not applicable.

Informed Consent Statement

Informed consent was obtained from all the participants in the study.

Data Availability Statement

Data may be available upon reasonable request from A.A.H.

Acknowledgments

A.H.W. acknowledged the moral and financial support of the Federal Republic of Nigeria, under the umbrella of Tertiary Education Trust Fund (TETFund) scholarship for sponsoring Ph.D. at the University of Agriculture Faisalabad, Pakistan.

Conflicts of Interest

The authors declare no conflict of interest.

References

  1. Christiaensen, L.; Zachariah, R.; Edward Taylor, J. The Future of Work in Agriculture: Some Reflections; World Bank Policy Research Working Paper 9193; World Bank: Washington, DC, USA, 2020. [Google Scholar]
  2. Zikos, D.; Hagedorn, K. Competition for Water Resources from the European Perspective. In Competition for Water Resources; Elsevier: Amsterdam, The Netherlands, 2017; pp. 19–35. [Google Scholar]
  3. Mancosu, N.; Snyder, R.L.; Kyriakakis, G.; Spano, D. Water Scarcity and Future Challenges for Food Production. Water 2015, 7, 975–992. [Google Scholar] [CrossRef] [Green Version]
  4. Gebrehiwot, K.A.; Gebrewahid, M.G. The Need for Agricultural Water Management in Sub-Saharan Africa. J. Water Resour. Prot. 2016, 8, 835–843. [Google Scholar] [CrossRef] [Green Version]
  5. AGRA. Irrigation Doubles African Food Production. 2019. Available online: https://agra.org/irrigation-doubles-african-food-production/ (accessed on 30 March 2023).
  6. You, L.; Ringler, C.; Wood-Sichra, U.; Robertson, R.; Wood, S.; Zhu, T.; Sun, Y. What is the irrigation potential for Africa? A combined biophysical and socioeconomic approach. Food Policy 2011, 36, 770–782. [Google Scholar] [CrossRef] [Green Version]
  7. Kadigi, R.M.; Tesfay, G.; Bizoza, A.; Zinabou, G.; Zilberman, D. Irrigation and water use efficiency in Sub-Saharan Africa. Gates Open Res. 2019, 3, 587. [Google Scholar] [CrossRef]
  8. Spiertz, H. Challenges for Crop Production Research in Improving Land Use, Productivity and Sustainability. Sustainability 2013, 5, 1632–1644. [Google Scholar] [CrossRef] [Green Version]
  9. Takeshima, H.; Bakare, O.S. Chapter 3. Production Systems: Biophysical and Economic Environment and Constraints. In The Nigerian Rice Economy; University of Pennsylvania Press: Philadelphia, PA, USA, 2016. [Google Scholar] [CrossRef]
  10. Delvaux, P.A.G.; Paloma, S.G.Y. Access to common resources and food security: Evidence from National Surveys in Nigeria. Food Secur. 2018, 10, 121–140. [Google Scholar] [CrossRef] [Green Version]
  11. Philip, D.; Jayeoba, O.O.; Ndripaya, Y.D.; Fatunbi, A.O. Innovation opportunities in the rice value chain in Nigeria. FARA Res. Rep. 2018, 2, 1–48. [Google Scholar]
  12. Nigatu, G.; Hansen, J.; Childs, N.; Seeley, R. Sub-Saharan Africa Is Projected to Be the Leader in Global Rice Imports. Amber Waves 2017. [Google Scholar] [CrossRef]
  13. Abbas, A.M.; Agada, I.G.; Kolade, O. Impacts of rice importation on Nigeria’s economy. J. Sci. Agric. 2018, 2, 71–75. [Google Scholar] [CrossRef] [Green Version]
  14. Okeke, A.M.; Mbanasor, J.A.; Nto, P.O. Comparative Analysis of the Technical Efficiency of Beneficiary and Non-Beneficiary Rice Farmers of the Anchor Borrowers’ Programme in Benue State, Nigeria. Greener J. Agric. Sci. 2019, 9, 155–162. [Google Scholar] [CrossRef]
  15. Kamai, N.; Omoigui, O.L.; Kamara, A.Y.; Ekeleme, F. Guide to rice production in Northern Nigeria; IITA: Ibadan, Nigeria, 2020; p. 27. [Google Scholar]
  16. Osabuohien, E.S.; Okorie, U.E.; Osabohien, R.A. Rice Production and Processing in Ogun State, Nigeria: Qualitative Insights from Farmers’ Association. In Food Systems Sustainability and Environmental Policies in Modern Economies; IGI Global: Hershey, PA, USA, 2018; pp. 188–215. [Google Scholar]
  17. Ndikumana, L.; Verick, S. The Linkages Between FDI and Domestic Investment: Unravelling the Developmental Impact of Foreign Investment in Sub-Saharan Africa. Dev. Policy Rev. 2008, 26, 713–726. [Google Scholar] [CrossRef] [Green Version]
  18. Birendra, K.; Schultz, B.; Prasad, K. Impact of irrigation management practices on land and its productivity in addressing hunger and poverty. J. Develop. Innov. 2017, 1, 15–28. [Google Scholar]
  19. Terwase, I.T.; Madu, A.Y. The impact of rice production, consumption and importation in Nigeria: The political economy perspectives. Int. J. Sustain. Dev. World Policy 2014, 3, 90. [Google Scholar]
  20. Obayelu, A.E.; Wintola, A.O.; Oluwalana, E.O.A. Households’ Rice Demand Response to Changes in Price, Income and Coping Strategies during Food Inflation in Nigeria: Evidence from Oyo State. Ital. Rev. Agric. Econ. 2022, 77, 61–75. [Google Scholar]
  21. Yusuf, B.L.; Mustapha, A.; Yusuf, M.A.; Ahmed, M. Soil salinity assessment using geostatistical models in some parts of Kano River Irrigation Project Phase I (KRPI). Model. Earth Syst. Environ. 2020, 6, 2225–2234. [Google Scholar] [CrossRef]
  22. Ekundayo, B.P. Rice Production, Imports And Economic Growth In Nigeria: An Application Of Autoregressive Distributed Lag. Int. J. Adv. Econ. 2023, 5, 48–56. [Google Scholar] [CrossRef]
  23. Johnson, M.E.; Takeshima, H.; Gyimah-Brempong, K.; Kuku-Shittu, O.X. Policy Options for Accelerated Growth and Competitiveness of the Domestic Rice Economy in Nigeria; International Food Policy Research Institute(IFPRI): Washington, DC, USA, 2013. [Google Scholar]
  24. Adekoyeni, O.O.; Fagbemi, S.A.; Ismaila, A.R. Ofada Rice Identity, Physical Qualities and Processing Technology Options for Upgrading: A Review. Annu. Res. Rev. Biol. 2018, 23, 1–9. [Google Scholar] [CrossRef]
  25. Briggs, L.J.; Shantz, H.L. The Water Requirement of Plants. Plant World 1913, 17, 76–78. [Google Scholar]
  26. Karagiannis, G.; Tzouvelekas, V.; Xepapadeas, A. Measuring Irrigation Water Efficiency with a Stochastic Production Frontier. Environ. Resour. Econ. 2003, 26, 57–72. [Google Scholar] [CrossRef]
  27. Dhehibi, B.; Lachaal, L.; Elloumi, M.; Messaoud, E.B. Measuring irrigation water use efficiency using stochastic production frontier: An application on citrus producing farms in Tunisia. Afr. J. Agric. Resour. Econom. 2007, 1, 1–15. [Google Scholar]
  28. Lilienfeld, A.; Asmild, M. Estimation of excess water use in irrigated agriculture: A Data Envelopment Analysis approach. Agric. Water Manag. 2007, 94, 73–82. [Google Scholar] [CrossRef]
  29. Speelman, S.; D’haese, M.; Buysse, J.; D’haese, L. A measure for the efficiency of water use and its determinants, a case study of small-scale irrigation schemes in North-West Province, South Africa. Agric. Syst. 2008, 98, 31–39. [Google Scholar] [CrossRef]
  30. Frija, A.; Chebil, A.; Speelman, S.; Buysse, J.; Van Huylenbroeck, G. Water use and technical efficiencies in horticultural greenhouses in Tunisia. Agric. Water Manag. 2009, 96, 1509–1516. [Google Scholar] [CrossRef]
  31. Chemak, F.; Boussemart, J.-P.; Jacquet, F. Farming system performance and water use efficiency in the Tunisian semi-arid region: Data envelopment analysis approach. Int. Trans. Oper. Res. 2010, 17, 381–396. [Google Scholar] [CrossRef]
  32. Watto, M.A.; Mugera, A.W. Measuring groundwater irrigation efficiency in Pakistan: A DEA approach using the sub-vector and slack-based models. In Proceedings of the Australian Agricultural and Resource Economics Society, Sydney, Australia, 5–8 February 2013. [Google Scholar]
  33. Clemmens, A.J.; Molden, D.J. Water uses and productivity of irrigation systems. Irrig. Sci. 2007, 25, 247–261. [Google Scholar] [CrossRef]
  34. Hsiao, T.C.; Steduto, P.; Fereres, E. A systematic and quantitative approach to improve water use efficiency in agriculture. Irrig. Sci. 2007, 25, 209–231. [Google Scholar] [CrossRef]
  35. Gao, Y.; Duan, A.; Sun, J.; Li, F.; Liu, Z.; Liu, H.; Liu, Z. Crop coefficient and water-use efficiency of winter wheat/spring maize strip intercropping. Field Crops Res. 2009, 111, 65–73. [Google Scholar] [CrossRef]
  36. Ali, S.; Li, D.; Congbin, F.; Khan, F. Twenty first century climatic and hydrological changes over Upper Indus Basin of Himalayan region of Pakistan. Environ. Res. Lett. 2015, 10, 014007. [Google Scholar] [CrossRef]
  37. Tomar, S.S.; Singh, Y.P.; Naresh, R.K.; Mrunalin, K.; Gurjar, R.S.; Yadav, R.; Sharma, D. Water-use Efficiency and the Effect of Water Deficits under Different Planting Techniques on Productivity and Profitability of Chickpea (Cicer arietinum L.) in Typic Ustochrept Soil of Morena Region of M.P. Int. J. Curr. Microbiol. Appl. Sci. 2020, 1, 709–719. [Google Scholar] [CrossRef]
  38. Bastiaanssen, W.G.; Steduto, P. The water productivity score (WPS) at global and regional level: Methodology and first results from remote sensing measurements of wheat, rice and maize. Sci. Total Environ. 2017, 575, 595–611. [Google Scholar] [CrossRef]
  39. Nwahia, O.C. Analysis of The Cost and Economic Returns in Rice Production in Ebonyi State, Nigeria. Indones. J. Agric. Res. 2020, 3, 205–214. [Google Scholar] [CrossRef]
  40. Koech, R.; Langat, P. Improving irrigation water use efficiency: A review of advances, challenges and opportunities in the Australian context. Water 2018, 10, 1771. [Google Scholar] [CrossRef] [Green Version]
  41. Pereira, L.; Gonçalves, J.; Dong, B.; Mao, Z.; Fang, S. Assessing basin irrigation and scheduling strategies for saving irrigation water and controlling salinity in the upper Yellow River Basin, China. Agric. Water Manag. 2007, 93, 109–122. [Google Scholar] [CrossRef]
  42. Çetin, O.; Kara, A. Assesment of water productivity using different drip irrigation systems for cotton. Agric. Water Manag. 2019, 223, 105693. [Google Scholar] [CrossRef]
  43. Cetin, O.; Akinci, C. Water and economic productivity using different planting and irrigation methods under dry and wet seasons for wheat. Int. J. Agric. Sust. 2022, 20, 844–856. [Google Scholar] [CrossRef]
  44. Nangia, V.; Yadava, N.D. Improving water productivity in dry areas. Ann. Arid. Zone 2016, 55, 63–66. [Google Scholar]
  45. Silva, J.V.; Reidsma, P.; Velasco, M.L.; Laborte, A.G.; van Ittersum, M.K. Intensification of rice-based farming systems in Central Luzon, Philippines: Constraints at field, farm and regional levels. Agric. Syst. 2018, 165, 55–70. [Google Scholar] [CrossRef]
  46. Yapa, L.G.D.S.; Rainis, R.; Abdullah, A.L.; Hemakumara, G.P.T.S. Head-tail disparity in irrigation management in Sri Lanka: A review of empirical evidence. Malays. J. Soc. Space 2020, 16, 45–55. [Google Scholar]
  47. Maikasuwa, M.A.; Ala, A.L. Determination of profitability and resource-use efficiency of yam production by women in Bosso local government area of Niger State, Nigeria. Eur. Sci. J. 2013, 9, 196–205. [Google Scholar]
  48. Adekola, P.O.; Allen, A.A.; Olawole-Isaac, A.; Akanbi, M.A.; Adewumi, O. Unemployment in Nigeria; A Challenge of Demographic Change? Int. J. Sci. Res. Multidiscip. Stud. 2016, 2, 1–9. [Google Scholar]
  49. Adelowokan, O.A.; Maku, O.E.; Babasanya, A.O.; Adesola, B. Unemployment, poverty and economic growth in Nigeria. J. Econ. Manag. 2019, 35, 5–17. [Google Scholar] [CrossRef]
  50. Adebayo, P.F.; Ojo, E.O. Food security in Nigeria: An overview. Eur. J. Sustain. Dev. 2012, 1, 199. [Google Scholar] [CrossRef] [Green Version]
  51. McGuire, S. WHO, World Food Programme, and International Fund for Agricultural Development. 2012. The State of Food Insecurity in the World 2012. Economic growth is necessary but not sufficient to accelerate reduction of hunger and malnutrition. Adv. Nutr. Int. Rev. J. 2013, 4, 126–127. [Google Scholar] [CrossRef] [Green Version]
  52. Otaha, I. Food Insecurity in Nigeria: Way Forward. Afr. Res. Rev. 2013, 7, 26. [Google Scholar] [CrossRef]
  53. Mohammed, M.U.; Abdulhamid, A.; Badamasi, M.M.; Ahmed, M. Rainfall dynamics and climate change in Kano, Nigeria. J. Sci. Res. Rep. 2015, 7, 386–395. [Google Scholar] [CrossRef]
  54. Maina, M.M.; Amin, M.S.M.; Aimrun, W.; Sani, I. Soil salinity assessment of Kadawa irrigation of the Kano River Irrigation Project (KRIP). J. Food Agric. Environ. 2012, 10, 1028–1034. [Google Scholar]
  55. Sangari, D. An Evaluation of Water and Land Uses in the Kano River Project, Phase I, Kano State. J. Appl. Sci. Environ. Manag. 2010, 11, 2. [Google Scholar] [CrossRef] [Green Version]
  56. Michael, A.M. Irrigation Theory and Practice; Vikas Publishing House: New Delhi, India, 1981. [Google Scholar]
  57. Aigner, D.; Lovell, C.K.; Schmidt, P. Formulation and estimation of stochastic frontier production function models. J. Econom. 1977, 6, 21–37. [Google Scholar] [CrossRef]
  58. Molden, D.; Oweis, T.; Steduto, P.; Bindraban, P.; Hanjra, M.A.; Kijne, J. Improving agricultural water productivity: Between optimism and caution. Agric. Water Manag. 2010, 97, 528–535. [Google Scholar] [CrossRef]
  59. Cai, X.; Hejazi, M.I.; Wang, D. Value of Probabilistic Weather Forecasts: Assessment by Real-Time Optimization of Irrigation Scheduling. J. Water Resour. Plan. Manag. 2011, 137, 391–403. [Google Scholar] [CrossRef]
  60. Mao, L.; Zhang, L.; Li, W.; van der Werf, W.; Sun, J.; Spiertz, J.H.J.; Li, L. Yield advantage and water saving in maize/pea intercrop. Field Crops Res. 2012, 138, 11–20. [Google Scholar] [CrossRef]
  61. Brauman, K.; Siebert, S.; Foley, J.A. Improvements in crop water productivity increase water sustainability and food security—A global analysis. Environ. Res. Lett. 2013, 8, 024030. [Google Scholar] [CrossRef]
  62. Wallace, J. Increasing agricultural water use efficiency to meet future food production. Agric. Ecosyst. Environ. 2000, 82, 105–119. [Google Scholar] [CrossRef]
  63. Tantawy, M.M.; Ouda, S.A.; Khalil, F.A. Irrigation optimization for different sesame varieties grown under water stress conditions. J. Appl. Sci. Res. 2007, 3, 7–12. [Google Scholar]
  64. Ronald, L.; Marlow, P. Agriculture Water Use Efficiency in The United States. National Water Management Engineer; Natural Resources Conservation Service USDA: Washington, DC, USA, 1999.
  65. Batchelor, C. Improving water use efficiency as part of integrated catchment management. Agric. Water Manag. 1999, 40, 249–263. [Google Scholar] [CrossRef]
  66. Chan, L.L.; Idris, N. Validity and reliability of the instrument using exploratory factor analysis and Cronbach’s alpha. Int. J. Acad. Res. Bus. Soc. Sci. 2017, 7, 400–410. [Google Scholar]
  67. Shah, M.A.; Farooq, M.; Hussain, M. Productivity and profitability of cotton–wheat system as influenced by relay intercropping of insect resistant transgenic cotton in bed planted wheat. Eur. J. Agron. 2016, 75, 33–41. [Google Scholar] [CrossRef]
  68. Ben-Chendo, G.; Lawal, N.; Osuji, M. Cost and returns of paddy rice production in Kaduna State. Eur. J. Agric. For. Res. 2017, 5, 41–48. [Google Scholar]
  69. Kijne, J.W.; Barker, R.; Molden, D.J. Water Productivity in Agriculture: Limits and Opportunities for Improvement; International Water Management Institute: Colombo, Sri Lanka, 2003. [Google Scholar]
  70. Cook, S.; Gichuki, F.; Turral, H. Agricultural Water Productivity: Issues, Concepts and Approaches; CGIAR: Montpellier, France, 2006. [Google Scholar]
  71. Cai, X.; McKinney, D.C.; Rosegrant, M.W. Sustainability analysis for irrigation water management in the Aral Sea region. Agric. Syst. 2003, 76, 1043–1066. [Google Scholar] [CrossRef] [Green Version]
  72. Akanni, K.A.; Dada, A.O. Analysis of labour-use patterns among small-holder cocoa farmers in South Western Nigeria. J. Agric. Sci. Technol. B 2012, 2, 107–113. [Google Scholar]
  73. Anyiro, C.O.; Emerole, C.O.; Osondu, C.K.; Udah, S.C.; Ugorji, S.E. Labour-use efficiency by small-holder yam farmers in Abia State Nigeria: A labour-use requirement frontier approach. Int. J. Food Agric. Econ. 2013, 1, 151–163. [Google Scholar]
  74. Veettil, P.C.; Speelman, S.; van Huylenbroeck, G. Estimating the Impact of Water Pricing on Water Use Efficiency in Semi-arid Cropping System: An Application of Probabilistically Constrained Nonparametric Efficiency Analysis. Water Resour. Manag. 2012, 27, 55–73. [Google Scholar] [CrossRef]
  75. Hanjra, M.A.; Gichuki, F. Investments in agricultural water management for poverty reduction in Africa: Case studies of Limpopo, Nile, and Volta river basins. Nat. Resour. Forum 2008, 32, 185–202. [Google Scholar] [CrossRef]
  76. Sharma, B.; Molden, D.; Cook, S. Water Use Efficiency in Agriculture: Measurement, Current Situation and Trends. In Managing Water and Fertiliser for Sustainable Agricultural Intensification; International Fertiliser Association: Paris, France, 2015; pp. 39–64. [Google Scholar]
  77. Prihar, S.; Ghildyal, B.; Painuli, D.; Sur, H. Physical properties of mineral soils affecting rice-based cropping systems. Soil Phys. Rice 1985, 1, 57–70. [Google Scholar]
  78. Heitholt, J.J. Water use efficiency and dry matter distribution in nitrogen-and water-stressed winter wheat. Agron. J. 1989, 81, 464–469. [Google Scholar] [CrossRef]
  79. Schmidhalter, U.; Studer, C. Water use efficiency as influenced by plant mineral nutrition. In Proceedings of the 1st Sino-German Workshop “Impact of Plant Nutrition on Sustainable Agricultural Production”, Kiel, Germany, 22–23 January 1998. [Google Scholar]
  80. Chidiebere-Mark, N.; Ohajianya, D.; Obasi, P.; Onyeagocha, S. Profitability of rice production in different production systems in Ebonyi State, Nigeria. Open Agric. 2019, 4, 237–246. [Google Scholar] [CrossRef]
  81. Bwala, M.A.; John, A.U. Profitability analysis of paddy production: A case of agricultural zone 1, Niger State Nigeria. J. Bangladesh Agric. Univ. 2018, 16, 88–92. [Google Scholar] [CrossRef] [Green Version]
  82. Arun, G.; Singh, D.R.; Kumar, S.; Kumar, A. Canal irrigation management through water users associations and its impact on efficiency, equity and reliability in water use in Tamil Nadu. Agric. Econ. Res. Rev. 2012, 25, 409–419. [Google Scholar]
  83. Darko, R.O.; Shouqi, Y.; Junping, L.; Haofang, Y.; Xingye, Z. Overview of advances in improving uniformity and water use efficiency of sprinkler irrigation. Int. J. Agric. Biol. Eng. 2017, 10, 1–15. [Google Scholar]
  84. Cosgrove, W.J.; Loucks, D.P. Water management: Current and future challenges and research directions. Water Resour. Res. 2015, 51, 4823–4839. [Google Scholar] [CrossRef] [Green Version]
  85. Aslam, M. Agricultural productivity current scenario, constraints and future prospects in Pakistan. Sarhad J. Agric. 2016, 32, 289–303. [Google Scholar] [CrossRef]
  86. Kaneko, S.; Tanaka, K.; Toyota, T.; Managi, S. Water efficiency of agricultural production in China: Regional comparison from 1999 to 2002. Int. J. Agric. Resour. Gov. Ecol. 2004, 3, 231. [Google Scholar] [CrossRef]
  87. Yao, X.; Feng, W.; Zhang, X.; Wang, W.; Zhang, C.; You, S. Measurement and decomposition of industrial green total factor water efficiency in China. J. Clean. Prod. 2018, 198, 1144–1156. [Google Scholar] [CrossRef]
  88. Fang, Q.X.; Ma, L.; Nielsen, D.C.; Trout, T.J.; Ahuja, L. Quantifying Corn Yield and Water Use Efficiency under Growth Stage-Based Deficit Irrigation Conditions. Pract. Appl. Agric. Syst. Model. Optim. Use Ltd. Water 2015, 1, 1–24. [Google Scholar] [CrossRef]
  89. Obianefo, C.A.; Nwigwe, C.A.; Meludu, T.N.; Anyasie, I.C. Technical efficiency of rice farmers in Anambra State value chain development programme. J. Dev. Agric. Econ. 2020, 12, 67–74. [Google Scholar] [CrossRef]
  90. Kifle, M.; Gebretsadikan, T.G. Yield and water use efficiency of furrow irrigated potato under regulated deficit irrigation, Atsibi-Wemberta, North Ethiopia. Agric. Water Manag. 2016, 170, 133–139. [Google Scholar] [CrossRef]
  91. Yu, L.; Zhao, X.; Gao, X.; Siddique, K.H. Improving/maintaining water-use efficiency and yield of wheat by deficit irrigation: A global meta-analysis. Agric. Water Manag. 2020, 228, 105906. [Google Scholar] [CrossRef]
  92. Zhong, Y.; Wang, X.; Yang, J.; Zhao, X.; Ye, X. Exploring a suitable nitrogen fertilizer rate to reduce greenhouse gas emissions and ensure rice yields in paddy fields. Sci. Total Environ. 2016, 565, 420–426. [Google Scholar] [CrossRef]
  93. Djaman, K.; Mel, V.C.; Diop, L.; Sow, A.; El-Namaky, R.; Manneh, B.; Irmak, S. Effects of alternate wetting and drying irrigation regime and nitrogen fertilizer on yield and nitrogen use efficiency of irrigated rice in the Sahel. Water 2018, 10, 711. [Google Scholar] [CrossRef] [Green Version]
  94. Saito, K.; Vandamme, E.; Johnson, J.M.; Tanaka, A.; Senthilkumar, K.; Dieng, I.; Wopereis, M.C. Yield-limiting macronutrients for rice in sub-Saharan Africa. Geoderma 2019, 338, 546–554. [Google Scholar] [CrossRef]
  95. Ng’ombe, J.N. Technical efficiency of smallholder maize production in Zambia: A stochastic meta-frontier approach. Agrekon 2017, 56, 347–365. [Google Scholar] [CrossRef]
  96. Obianefo, C.A.; Ng’ombe, J.N.; Mzyece, A.; Masasi, B.; Obiekwe, N.J.; Anumudu, O.O. Technical Efficiency and Technological Gaps of Rice Production in Anambra State, Nigeria. Agriculture 2021, 11, 1240. [Google Scholar] [CrossRef]
  97. Umar, W.; Ayub, M.A.; Rehman, M.Z.U.; Ahmad, H.R.; Farooqi, Z.U.R.; Shahzad, A.; Rehman, U.; Mustafa, A.; Nadeem, M. Nitrogen and phosphorus use efficiency in agroecosystems. Resour. Use Effic. Agric. 2020, 213–257. [Google Scholar] [CrossRef]
  98. Latif, M.S.; Khan, N.; Khan, F.U. Analyzing The Gap Between Recommended And Adopted Practices Of Potato Production Technology In District Okara, Punjab. Gomal Univ. J. Res. 2017, 33, 36–46. [Google Scholar]
Figure 1. Rice production, consumption, importation, and area harvested (1960–2021).
Sustainability 15 07824 g001
Figure 2. Conceptual framework of the study.
Sustainability 15 07824 g002
Figure 3. Map of the study area. Source: Adapted from: [21].
Sustainability 15 07824 g003
Figure 4. Graphical representation of irrigation water use efficiency.
Sustainability 15 07824 g004
Figure 5. Scattered pot of the average water productivity of the canal water users (beneficiaries) and tube well users (non-beneficiaries). Source: Author’s Computation.
Sustainability 15 07824 g005
Table 1. Cost and return analysis per acre of rice between canal water users and tube well users.
VariablesCanal Water UsersTube Well Farmers
* Cost ($/acre)% to TCCost ($)% to TC
Seed9.082%9.632%
NPK44.029%28.645%
Urea51.1111%73.1913%
Herbicide10.532%11.432%
Pesticide9.992%4.351%
Cost of fuel (acre)0.000%66.3212%
Water charges5.261%0.000%
Cost of bags (acre)8.302%8.722%
Labor cost
Land clearing9.532%9.922%
Ploughing/Ridging24.175%19.143%
Seedbed18.794%16.873%
Planting27.206%14.243%
1st and 2nd weeding54.3411%47.129%
1st and 2nd fertilization8.032%5.951%
Agro-chemical spraying4.261%5.231%
Harvesting/threshing48.2110%60.2611%
Winnowing/bagging10.692%11.042%
Irrigation labor cost39.648%41.288%
Transportation cost16.173%16.583%
TVC399.3282%449.9182%
Depreciation8.172%38.697%
Rent on land78.9516%59.2111%
Total cost486.44100547.81100
Revenue
Average yield (kg/acre)1970.12 2084.11
Average price/kg of paddy ($)0.46 0.44
Total farm income ($/acre)902.14 912.64
Gross margin (TR-TVC)502.68 462.73
Net farm income (GM-FC)415.56 364.83
BCR (TFI/TC)1.85 1.67
* Exchange rate ($1USD = N380).
Table 2. Economic and physical water productivity.
IndicatorUnitCanal Water UsersTube Well Users
Yield(Kg acre−1)1970.192084.11
Net farm income(Dollar acre−1)415.56364.83
Water applied(M3 acre−1)3830.613554.92
Water cost(Dollar acre−1)5.2666.32
PWP(Kg−1M30.5140.586
EWP(Dollar m−3)0.110.10
Return per m3 water cost 795.50
Table 3. Distribution of irrigation water use efficiency in rice production between canal water users and tube well farmers.
RangeCanal Water UsersTube Well Water Users
FrequencyPercentageFrequencyPercentage
>300074.6
0.30–0.3932.032.0
0.40–0.4921.363.9
0.50–0.5974.6159.9
0.60–0.691610.52516.4
0.70–0.804630.34630.3
0.80–0.897146.74831.6
0.90–0.9974.621.3
Mean0.76 0.70
Minimum0.30 0.07
Maximum0.91 0.90
Standard Deviation0.141 0.17
Table 4. Determinants of irrigation water use efficiency between canal water users and tube well users.
Canal Water UsersTube Well Water Users
VariablesΒStandard Errort-RatioΒStd. Errort-Ratio
Constant−0.46811.1088−0.4222−1.11841.7303−0.6464
Output produced(kg)−6.02610.0718−83.887 ***0.52120.17990.2897
Seed (kg)1.77160.138712.7714 ***−0.01410.0786−0.1799
NPK (kg)−0.03230.0986−0.32791.61570.19058.4813 ***
Urea (kg)−0.02990.1072−0.2793−0.90810.1089−8.3377 ***
Herbicide (liter)1.52430.097815.5865 ***−0.05730.0977−0.5867
Pesticide (liter)−3.41430.1208−2.8255 ***−0.29360.1800−1.6315
Labor (man-days)0.01480.09810.15080.41780.41561.0051
Depreciation1.84430.22788.0978 ***0.78440.20123.8986 ***
Farm size (acre)−0.00790.0696−0.1133−0.60420.2674−2.2597 **
Inefficiency Model
Constant−0.25202.4897−1.01234.73904.20801.1262
Age (years)−0.07820.0347−2.3009 **−1.79660.1606−11.185 ***
Education0.00300.02600.1144−0.15030.1800−0.8350
Farming experience0.13980.06952.0118 **−0.11860.0276−4.3028 ***
Family size0.10560.0518−2.0408 **−0.17180.1532−1.1216
Marital status−0.39410.9001−0.43792.73720.258310.5964 ***
Gender of the Household head 0.90621.15920.78170.74740.10537.1011 ***
Extension visit−2.16861.0835−2.002 **−7.28710.7904−9.2200 ***
Access to credit0.66150.40421.6364−0.76180.1065−7.1508 ***
Annual income (N)0.17470.18500.9446−2.57930.3119−8.2702 ***
Sigma square1.14430.37923.0180 ***2.21760.181712.2040 ***
Gamma0.88860.042920.729 ***0.87340.09738.9780 ***
Likelihood function−193.57 −191.05
LR test331.01 31.5
*** Significant at 1, ** significant at 5%.
Disclaimer/Publisher’s Note: The statements, opinions and data contained in all publications are solely those of the individual author(s) and contributor(s) and not of MDPI and/or the editor(s). MDPI and/or the editor(s) disclaim responsibility for any injury to people or property resulting from any ideas, methods, instructions or products referred to in the content.

