1. Introduction
Environmental pollution caused by human activity has been a primary concern for flora, fauna, and human health, especially in urban areas [
1]. The increase in the concentration of nitrogen oxides, ozone, and other elements requires the development of technology and techniques to reduce the influence on the environment. The use of cementitious photocatalytic composites provides a passive solution to the issue [
2,
3]. It contributes to air purification by lowering harmful NO
X and SO
X concentrations through photocatalytic reactions powered by sun radiation. According to the IUPAC (International Union of Pure and Applied Chemistry) definition, photocatalysis is a catalytic reaction based on light absorption by a photocatalyst [
4]. The basic process in heterogeneous photocatalysis is the activation of a semiconductor, i.e., a photocatalyst, by irradiation. Semiconductors contain a band gap with energy E
g that separates the valence band from the conduction band. The photocatalysis process begins with energy absorption equal to or greater than E
g. Then, an h
+ hole is formed due to the transition of the e
− electron from the valence band to the conduction band. The resulting hole is a strong oxidant, while the electron is a reducing agent [
5].
Acid rain and photochemical smog are severe problems for large urban agglomerations, as they can threaten human health and negatively affect plant metabolism [
6]. Photocatalysts break down harmful chemicals such as nitrogen oxides. The process begins with the absorption of a quantum of solar radiation, which determines the formation of O
2 peroxide, which forms OH hydroxyl groups in contact with water [
7]. Thanks to this, oxidation reactions of harmful compounds take place. In cementitious materials, the resulting nitrate anions NO
3− then react with the calcium to form a water-soluble salt—calcium nitrate—which is washed away by precipitation [
8].
The most popular photocatalyst used in the photocatalytic cementitious materials discussed in this paper is titanium (IV) oxide. The first application of “titanium white” was as a dye, due to its strong brightening properties. However, the destructive effect of this additive on some organic dyes was noticed. At the end of the 1920s, this anomaly began to be studied, and theories related to the photocatalytic process were created [
9]. Many semiconductors, e.g., ZnO, SnO
2, and ZnS, are tested for suitability in the photocatalytic process. However, titanium (IV) oxide is the most frequently described because of its high stability, availability, and non-toxicity [
1]. It is obtained primarily from naturally occurring anatase (TiO
2), rutile (TiO
2), and ilmenite (FeTiO
3).
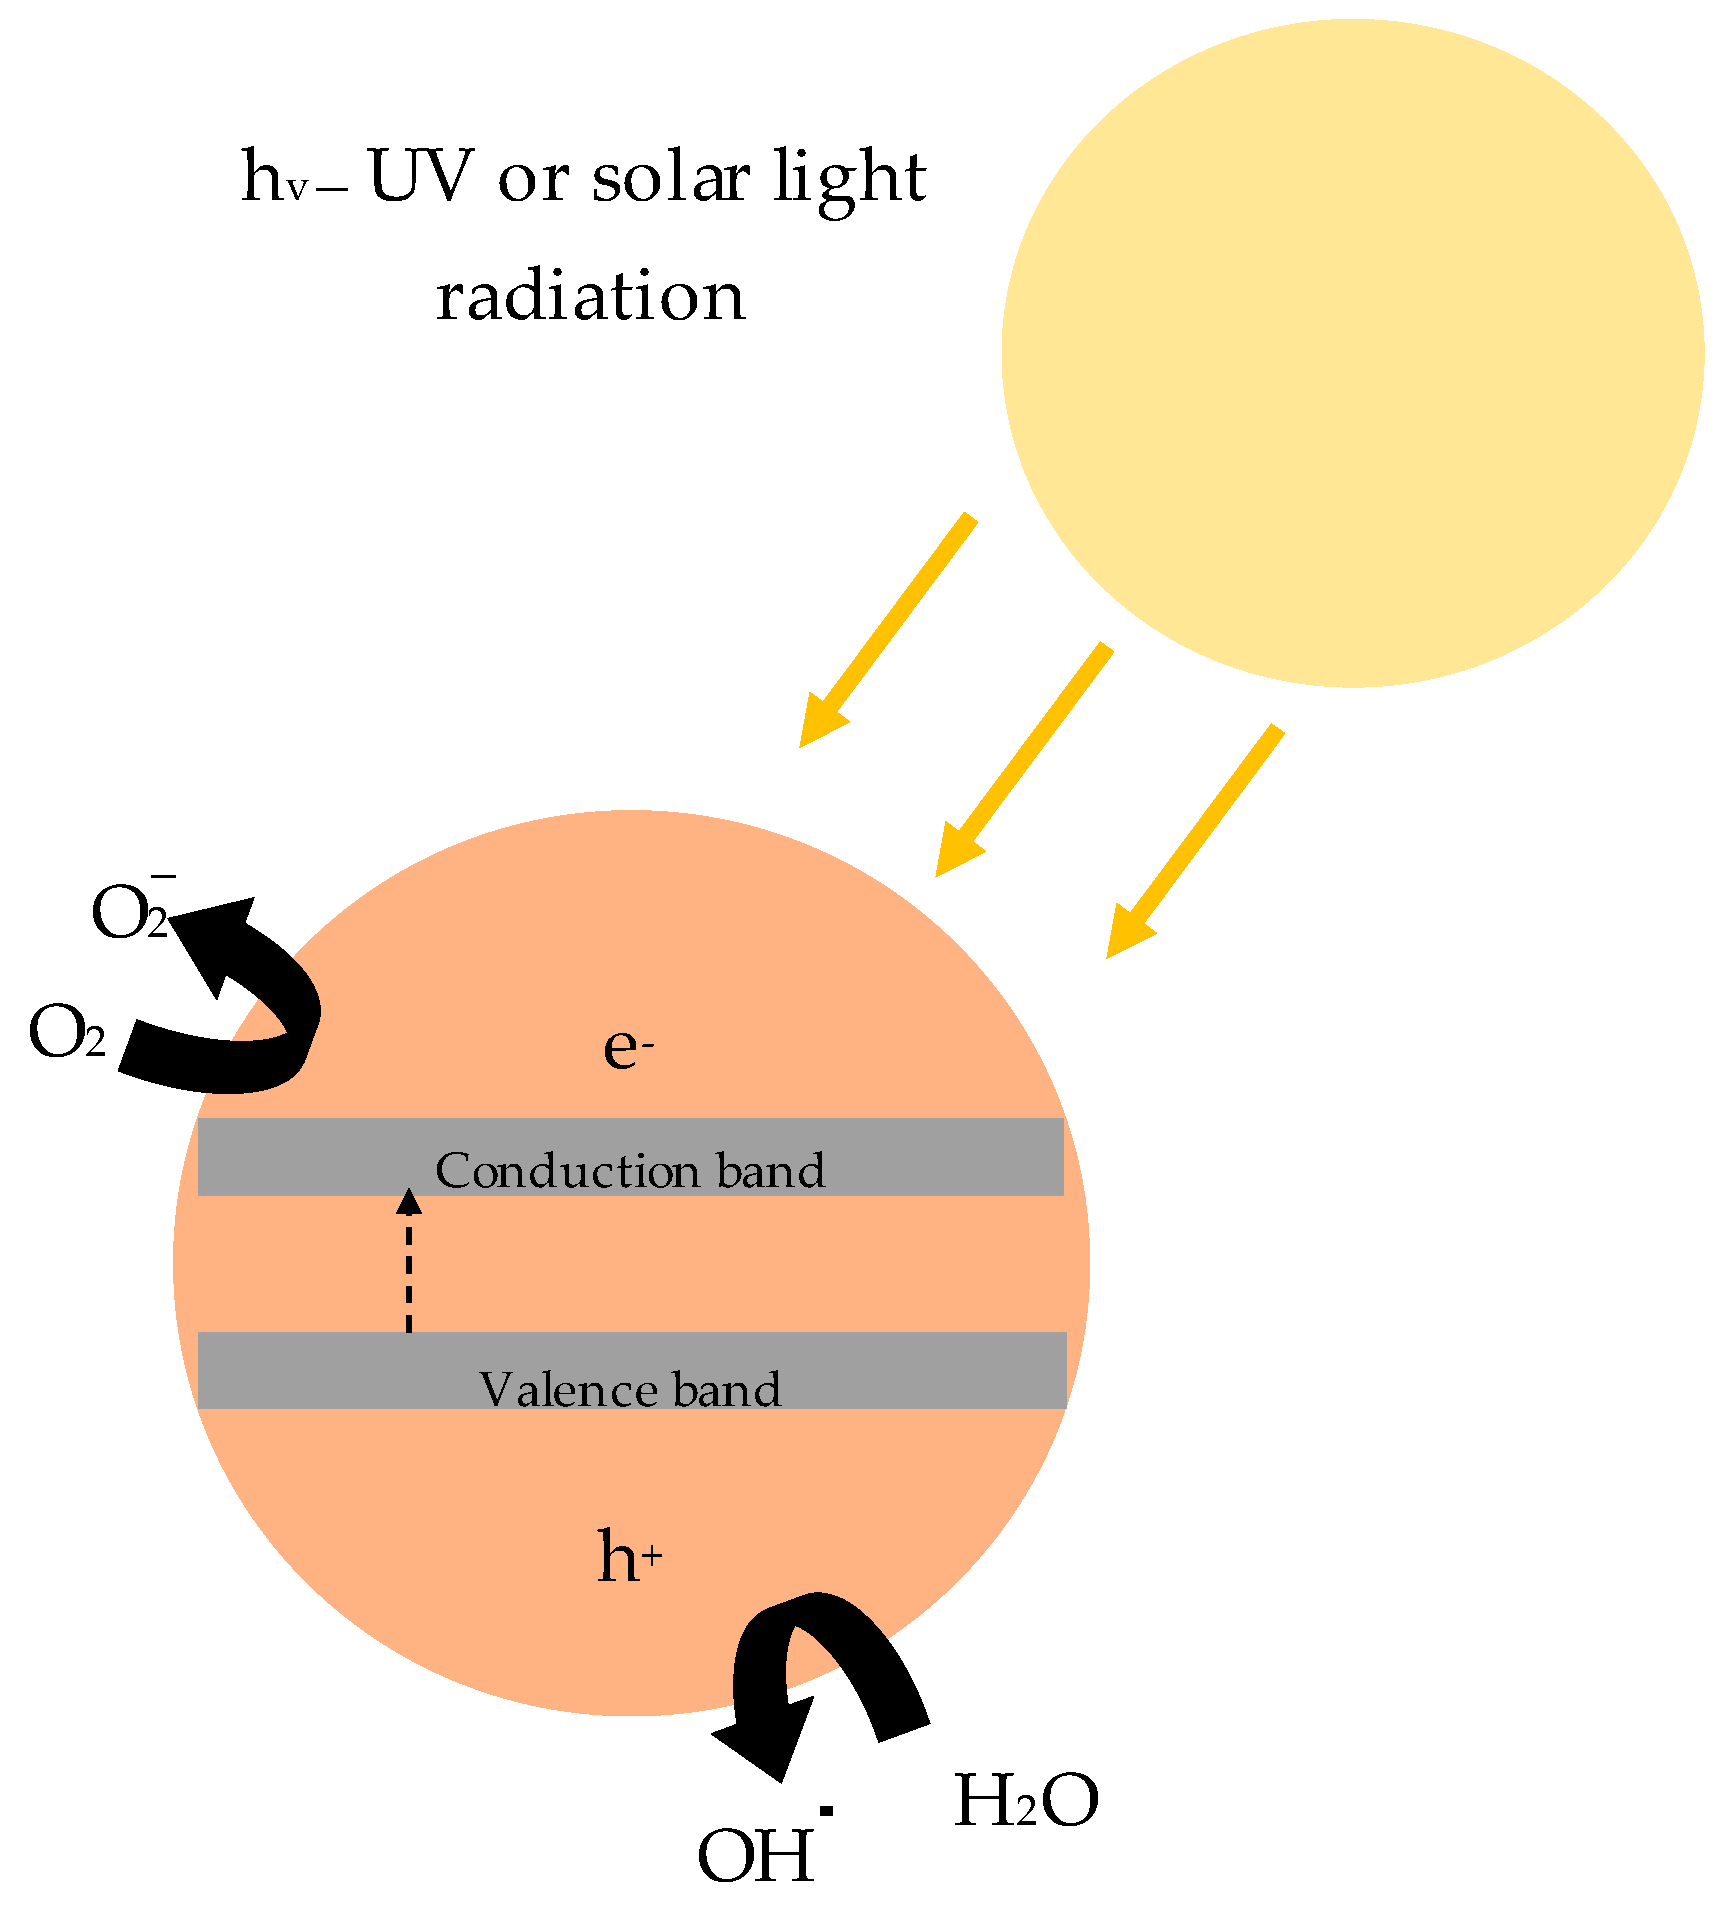
In a photocatalytic reaction, a photocatalyst (semiconductor such as titanium dioxide) is irradiated. Due to energy introduction, electrons (e
−) from the semiconductor shift from the valence band (vb) to the conduction band (cb), leading to the formation of electron holes h+ (Equation (1)). The resulting pairs of charges initiate a reduction–oxidation process (
Figure 1). As this reaction mainly occurs in the air environment, in the presence of adsorbed oxygen and water (strong oxidants), it is possible to decompose a wide range of air pollutants due to the formation of hydroxyl radicals (OH
.) and superoxide radicals (
(Equations (2) and (3)) [
5].
Cementitious composites can be characterized by various properties, depending on the components used for their production [
10,
11]. Using photocatalysts in cementitious materials presents a new approach to improving air quality in urban areas. Most surfaces in cities are made with different cementitious materials (mainly concretes and mortars), and most pollutants are produced in their direct proximity due to human activity [
12]. The placement of a passive system purifying the surrounding air built into those surfaces presents a solution worth considering. Photocatalytic mortars, or more widely, photocatalytic cementitious materials, represent a group of building materials that contribute to improving air quality in urban areas. Sustainability can be understood in several ways, one of them being the counteraction to the negative influence of human activity on the environment. The composites in question have two functions—to act as a construction material (for roads, pavements, etc.) and, while doing so, to passively purify the air from harmful pollutants. Any research that covers methods or materials that contribute to a lesser impact of human activity on the surroundings could and should be considered a part of sustainable development.
The efficiency of photocatalytic reactions in cementitious materials depends on several variables, which can be divided into internal and external [
13]. Toxic oxides are present in the air surrounding photocatalytic material, so parameters describing air’s properties significantly impact the efficiency of photocatalytic reaction (mainly temperature, humidity, and air velocity). The internal factors, namely the properties of any given photocatalytic material—its chemical composition and morphology—and the interaction between titanium dioxide and other components of cementitious material also influence the intensity of the considered reactions [
14].
In this paper, the authors decided to investigate the influence of the composition of a cementitious photocatalytic mortar on the intensity of photocatalytic reactions. As is well known, mortars consist of several different components—water, binder, and aggregate. In regular cementitious materials, changing the mass ratios between them results in a change in both mechanical properties and the overall durability of the material [
15,
16]. Titanium dioxide interacts with other components of the mix upon its addition to the material [
17]. It has been observed that due to its grain size, when added in high concentrations, TiO
2 has an influence on the compressive strength of the hardened material [
18]. It has also been observed that the efficiency of purifying the air from the aforementioned pollutants differs significantly in the case of TiO
2 powder and cementitious materials containing it—titanium oxide both agglomerates in the cement matrix and acts as nuclei for the products of cement hydration, reducing its exposure to sun radiation, and in consequence, on the surface of which photocatalytic reaction can occur [
19]. Therefore, the composition of any cementitious mortar considered to be a TiO
2 carrier has an impact on its properties regarding photocatalytic reactions.
In the performed experiments, the influence of seven material variables on the mechanical and photocatalytic properties of cementitious mortars was investigated. The Plackett-Burman method (a screening design of an experiment, where an influence of several variables can be determined using a limited number of experiments; in the conducted study, the impact of seven variables was investigated with just 11 series of samples) was used, and the seven variables were defined –TiO2 total mass, the mass ratio between two different photocatalysts (VLA, Visible Light Active and UV-A only, UV Light Active), the mass ratio between binder to aggregate, the mass ratio between water to cement, nanoparticulate silica mass content, replacement of cement with quartz powder, and the mass ratio between two aggregates of different granulation. In total, 11 cementitious mortar series were prepared and tested for consistency, mechanical properties including tensile and compressive strength, efficiency in purifying the air from NOx pollutants, and efficiency in self-cleaning measured via two different tests (degradation of rhodamine under UVA radiation and the reduction in contact angle after exposure to UVA radiation).
2. Materials and Methods
A Plackett-Burman experimental design was prepared to investigate the influence of several material variables on selected properties of cementitious mortars. It is a screening design used to efficiently screen the impact of numerous variables on the chosen properties of any material. The prepared design considered seven variables on three levels (low, high, and average) and is presented in
Table 1. A mass ratio of binder (cement and quartz powder—b) to sand (s) aggregate was considered in the range of 0.5 to 0.8 (b/s ratio in
Table 1). A water-to-cement ratio was adopted from 0.35 to 0.43 (w/c ratio in
Table 1). Nanoparticulate silica content was designed in a range from 10 to 40 kg/m
3. Quartz powder content was described as a mass percentage of cement being replaced within the range of 5 to 15%. The influence of aggregate granulation was also included via the mass ratio between two aggregates of different granulation—0.5/1.2 and 0.1/0.5—within the range of 0.25 and 1. The influence of TiO
2 on selected properties was included via two last variables, the total mass content of titanium dioxide in the composite (5–20 kg/m
3) and the mass proportion between two types of photocatalyst being used in this study—TiO
2 (A) and TiO
2 (B)—within the range of 0.25 to 1.
2.1. Materials
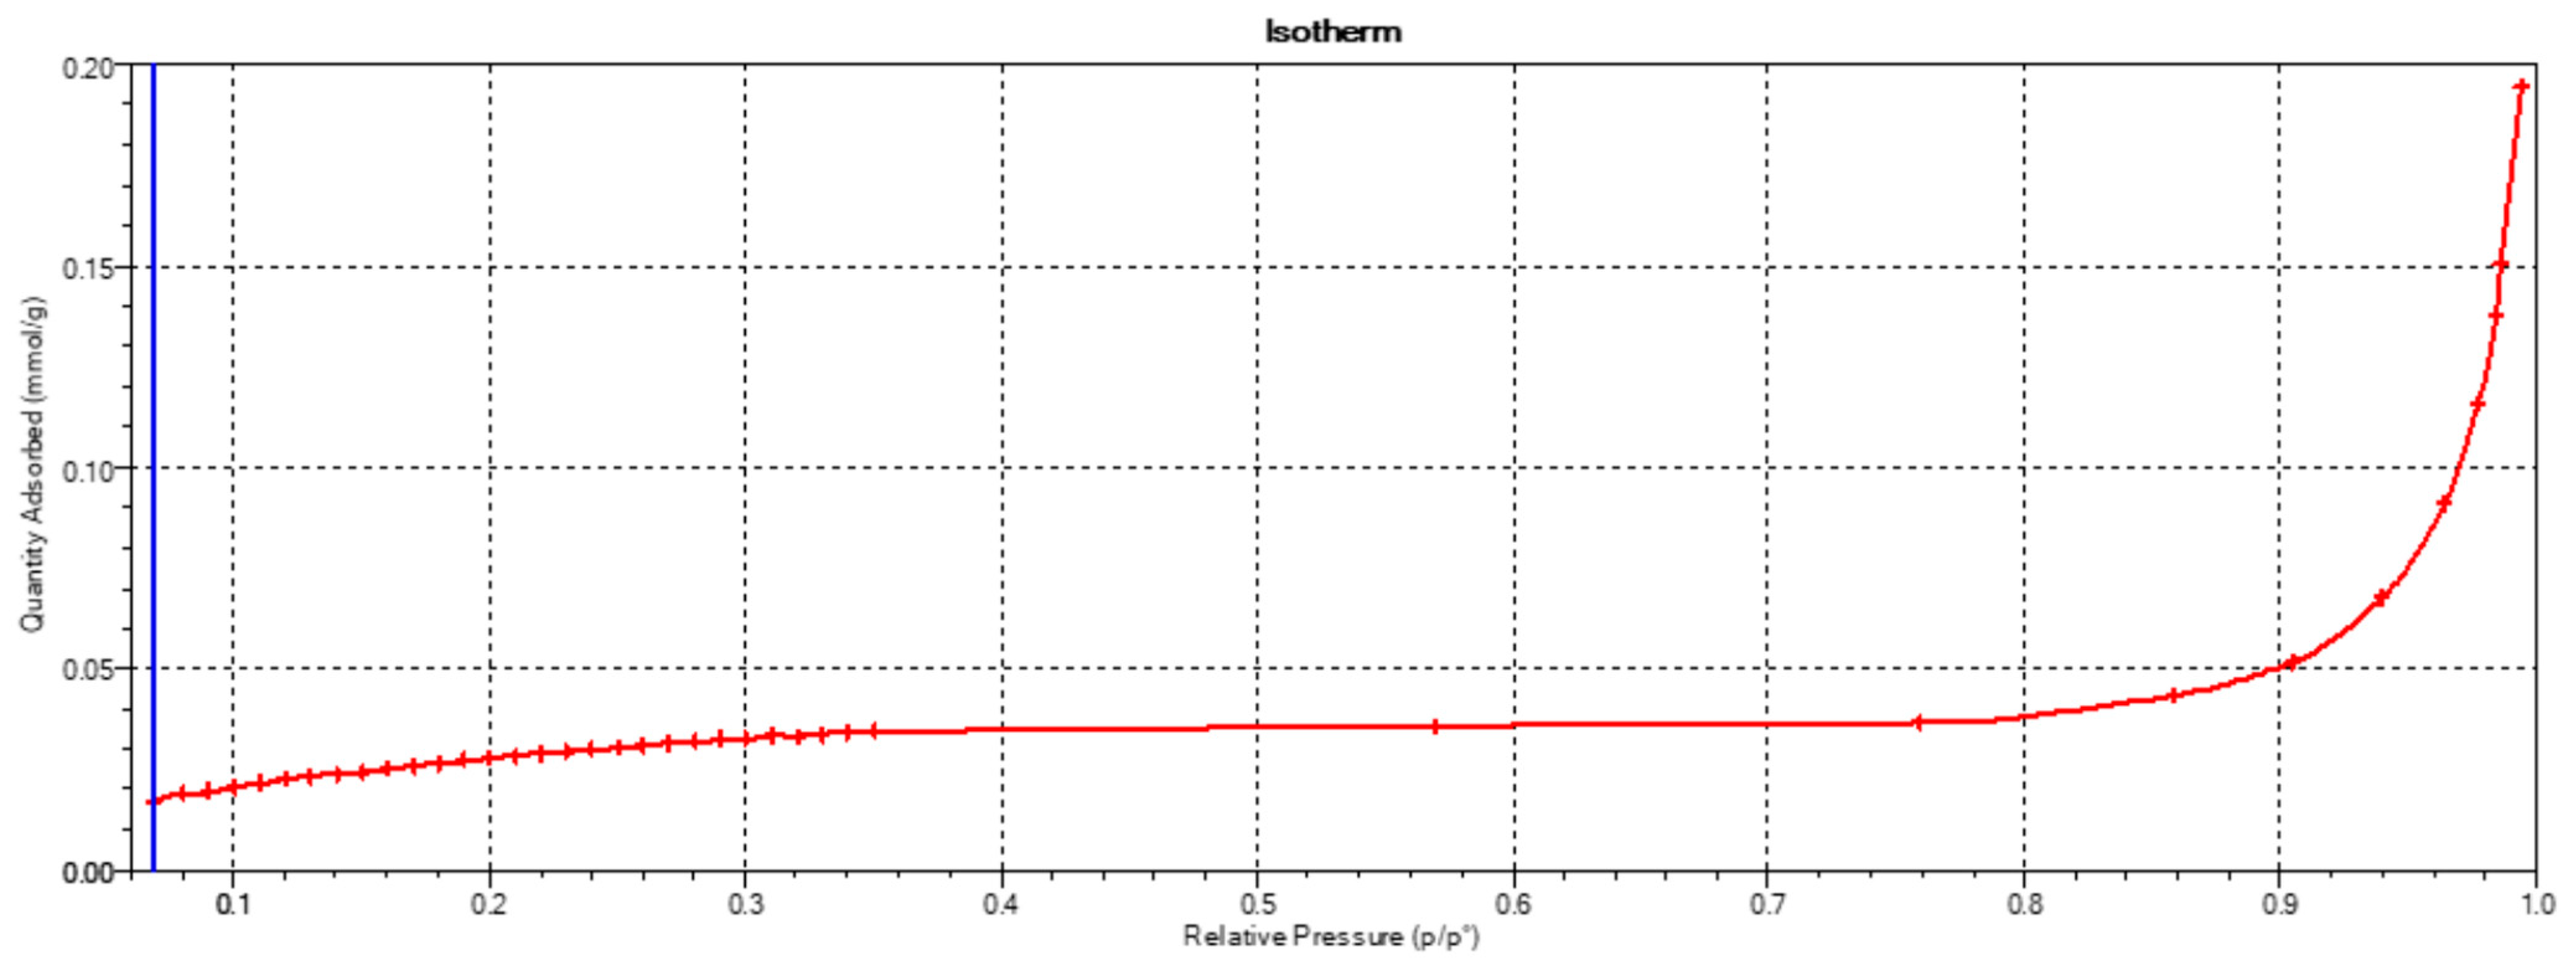
The cement used in this study, CEM II/A-S 52.5R (Ożarów, Poland), met the requirements of EN 197-1 [
20]. Its specific surface area was measured via the BET method and was 2.59 m
2/g, with its adsorption isotherm as specified in
Figure 2.
The chemical composition of cement was investigated via the XRF method. The samples were dried to dryness at 105 °C. Then, they were poured into previously assembled special measuring cups. Samples prepared this way were placed in the XRF apparatus and measured. Losses on ignition (LOI) were determined. Material samples were dried to a constant weight and then subjected to the calcination process at 975 °C for 15 min. After cooling to room temperature, the samples were weighed. The percentage loss of the initial mass was the loss of ignition, which was included in the chemical composition results and is presented in
Table 2.
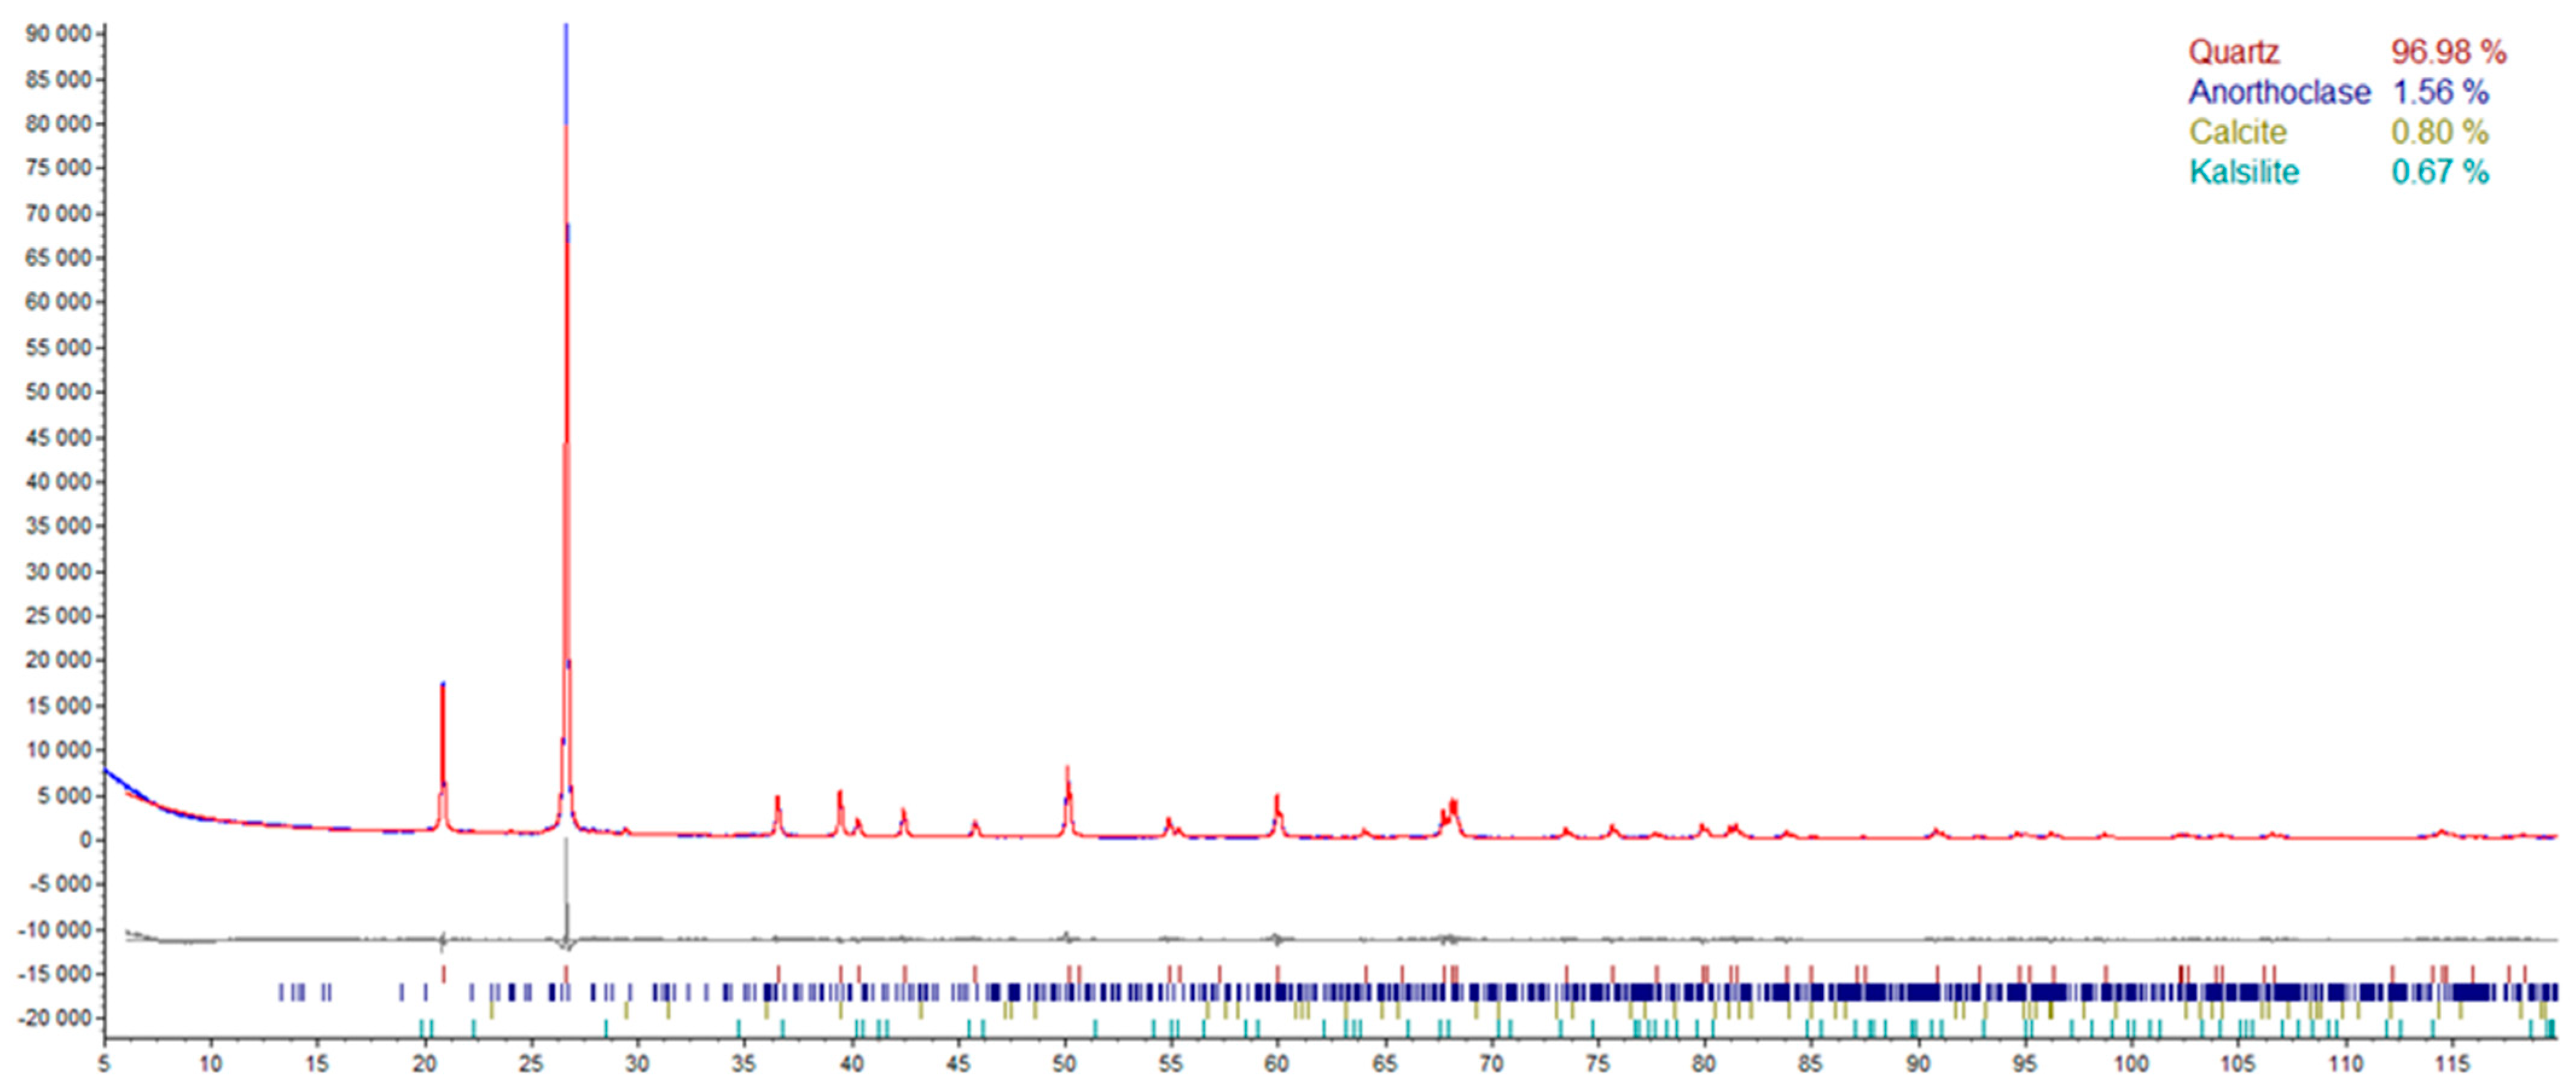
The phase composition of cement was investigated via the XRD method. Cement samples, as in the case of XRF analysis, were dried. Then, they were placed in special steel holders and properly smoothed (a prerequisite for proper XRD measurement). The sample prepared in this way was placed in the measuring magazine and then in the diffractometer. The measurement was carried out in the range of 5–65° 2θ, with a single step of 0.02° 2θ lasting 5 s (
Figure 3).
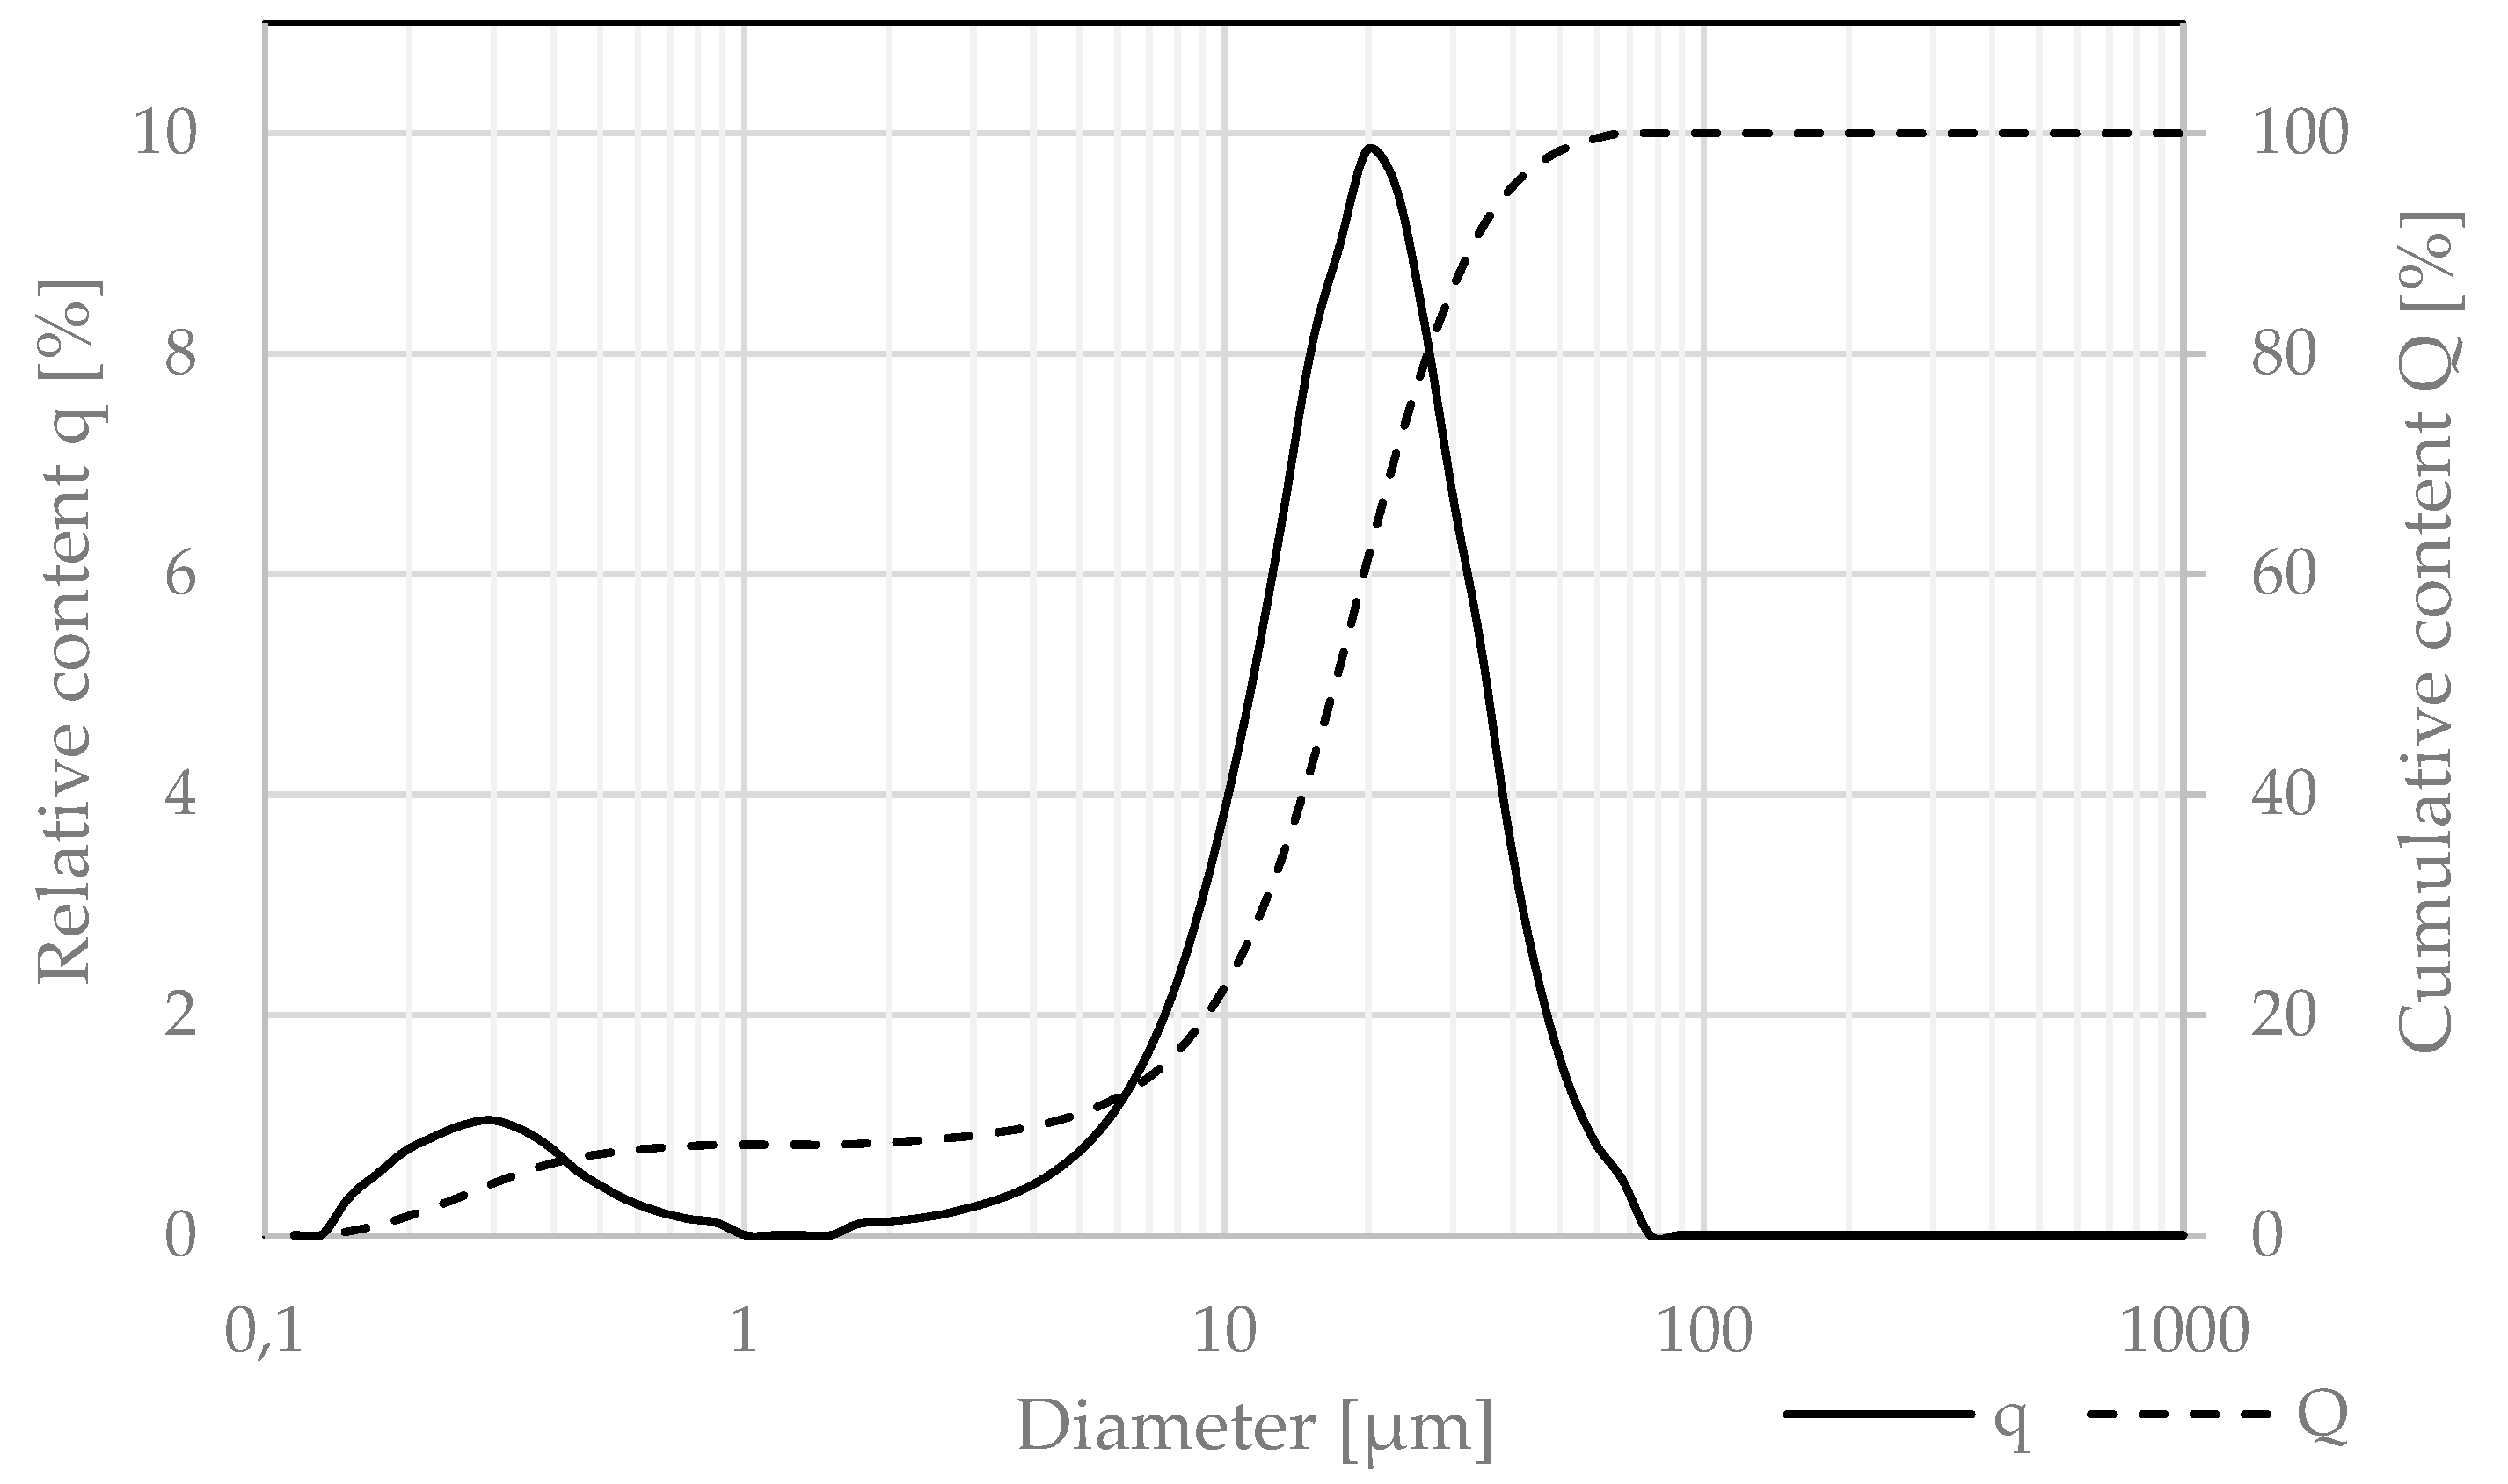
The granulation of cement was measured via the laser diffraction technique and is presented in
Figure 4. The particle size distribution (PSD) measurements were performed by the laser scattering method using the laser analyzer Horiba LA-300. The test involved passing laser beams through an isopropyl alcohol containing cement particles dispersed by ultrasounds and determining the particle size (in the range of 0.01–600 μm).
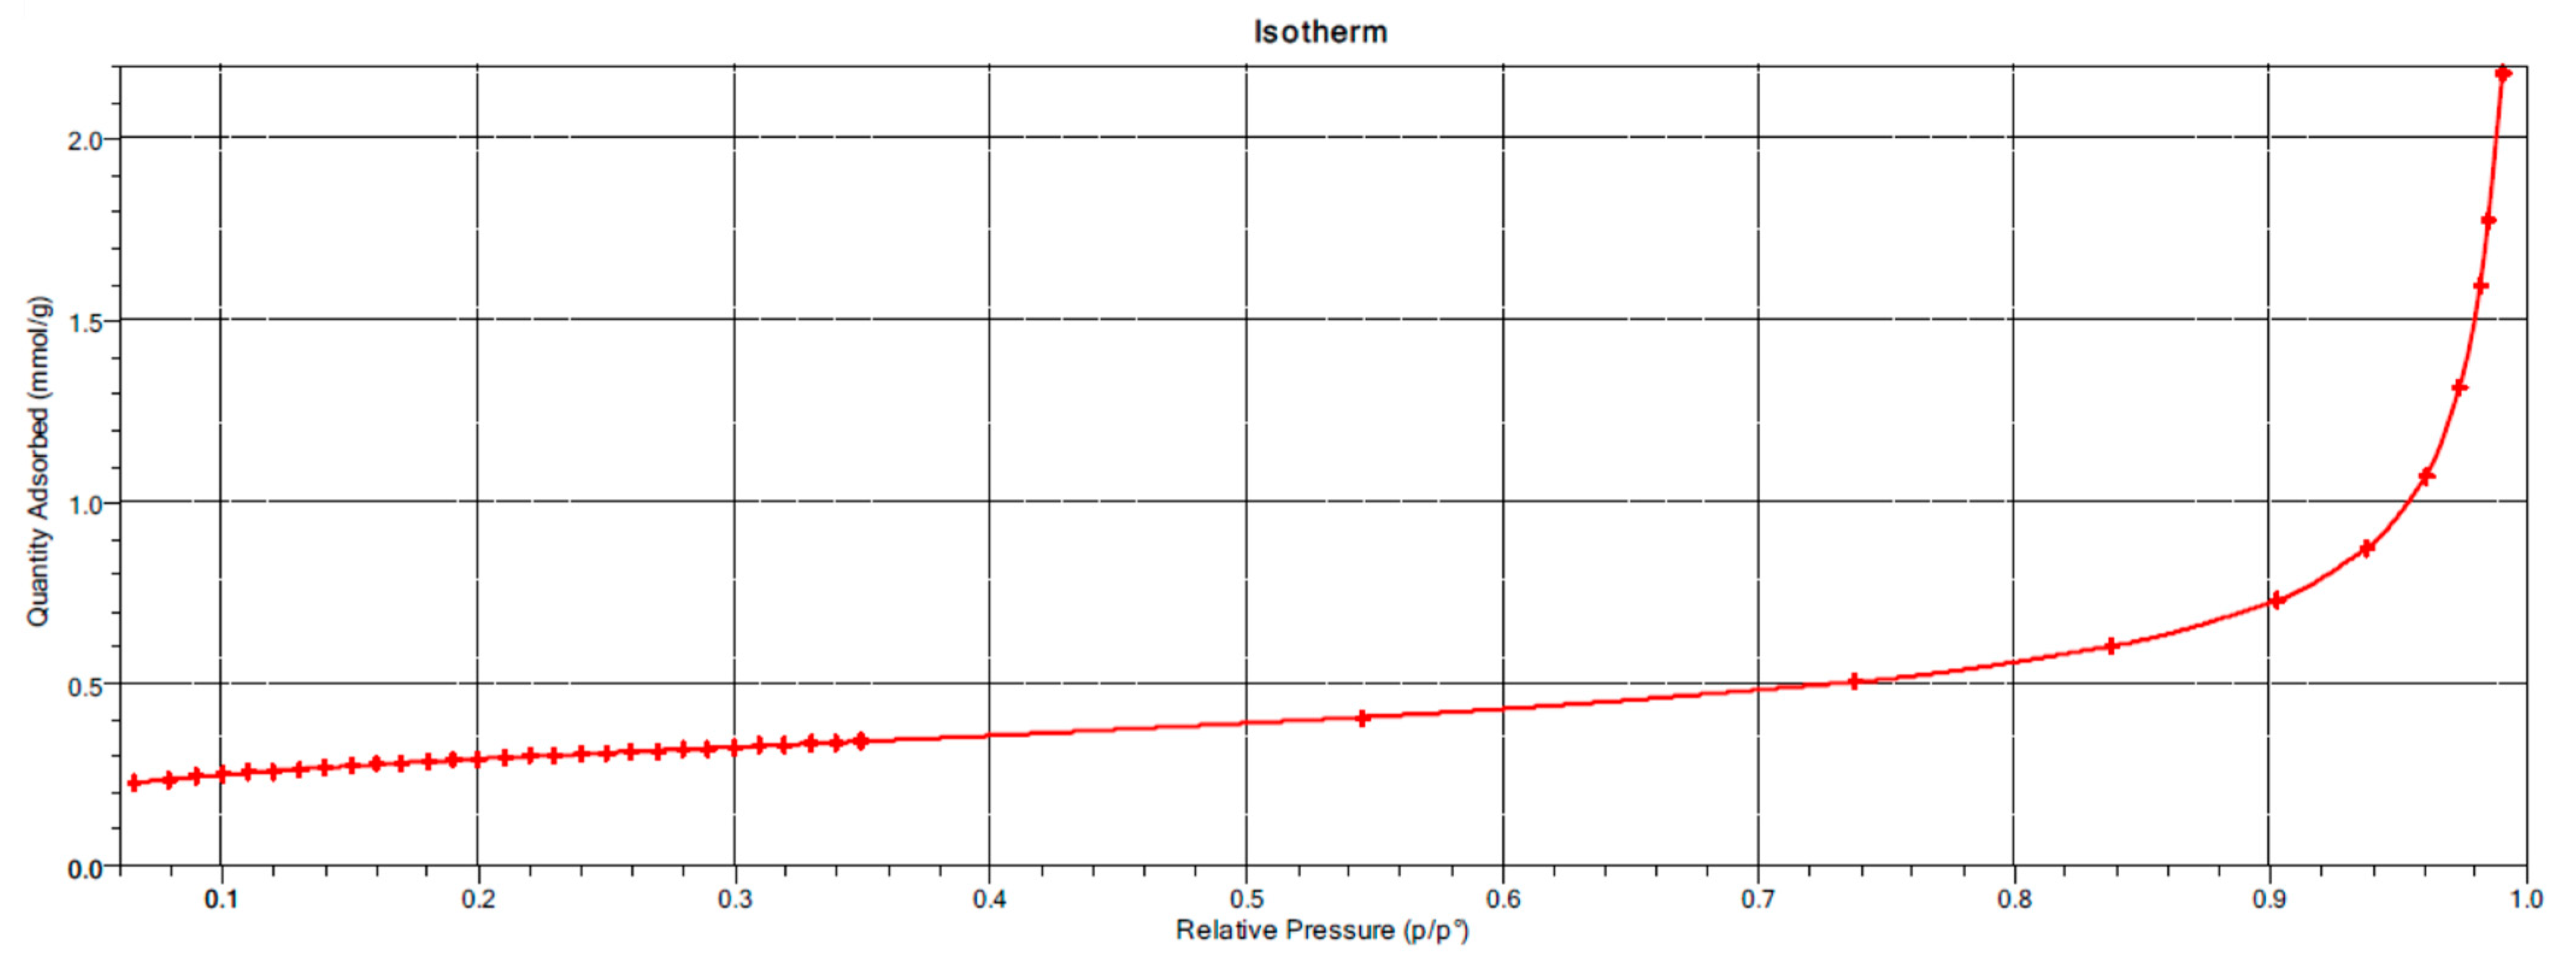
The nanoparticulate silica used in the study (Łaziska, Poland) met the requirements of EN 13263-1 [
21]. Its specific surface area was measured via the BET method and was 23.86 m
2/g, with its adsorption isotherm as shown in
Figure 5.
The chemical composition of nanoparticulate silica was investigated via the XRF method, with the same test procedure as for the cement. The results are presented in
Table 3.
The analysis of the nanoparticulate silica activity index was carried out as per EN 13263-1 [
21]. The results of the 28-day average compressive strength of the modified cementitious mortar (90% cement and 10% silica) and the results of the reference cementitious mortar are presented in
Table 4.
The phase composition of nanoparticulate silica was investigated via the XRD method with the same test procedure as in the case of cement. The results are presented in
Figure 6.
The granulation of nanoparticulate silica was measured via the laser diffraction technique and presented in
Figure 7, using the same test procedures as for the cement.
The quartz powder used in this study met the requirements of ISO/DIS 3262-13 [
22]. Its granulation was measured via the laser diffraction technique and is presented in
Figure 8, using the same test procedures as for the cement.
The study used two types of fire-dried quartz sand aggregates of different granulations: 0.1/0.5 and 0.5/1.2 (Corrado, Poland), which met the requirements of EN 13139 [
23].
Table 5 lists their properties.
This study used two types of titanium dioxide: TiO
2 (A)—K7000 (Leverkusen, Germany) and TiO
2 (B)—P25 (Shanghai, PRC), with properties in the powder state as described in [
5]. The content of individual crystalline phases, the size of crystallites in tested samples, and the specific surface area of used materials are presented in
Table 6.
The chemical composition of titanium dioxides was investigated via the XRF method, with the same test procedure as for the cement. The results are presented in
Table 7. The morphology of grains of both TiO
2 (A) and (B) is shown on SEM images in
Figure 9 and
Figure 10.
The selected photocatalytic materials were introduced into the cementitious mortar as a dispersion made of a portion of mixing water and a PCE superplasticizer (polycarboxylate ether-based superplasticizer, referred to as SP), with of an electrostatic and steric mechanism of action and maximum suggested by the manufactured mass content at 3%m.c (Myślenice, Poland). As titanium dioxide agglomerates in dry conditions, it was decided to use a sonicator to reduce the average TiO2 grain size. Using a cavitation head, approx. 25 kJ of energy was introduced into every 250 mL of dispersion during a seven-minute cycle, consisting of 10 s steps (7 s of sonication followed by 3 s of pause).
The water used in this study met the requirements of EN 1008 [
24]. An additional mass of superplasticizer was added to cementitious mortars to modify their rheological properties. It met the EN 934-2 standard [
25] requirement and was characterized by electrostatic and steric mechanisms of action. In each prepared cementitious mortar, the total mass of the superplasticizer was set to 1% of the cement mass.
All described components were used to prepare cementitious mortars for the designed experiment plan. The composition of each of the prepared cementitious mortars is presented in
Table 8.
2.2. Methods
Designed cementitious mortars were prepared according to the mixing procedure described in EN 196-1 [
26]. Before molding, the consistency of cementitious mortars was tested following the modified procedure based on EN 1015-3 [
27]. A cone filled with fresh cementitious mortar was placed on the moistened plate, then removed to measure the flow diameter after one minute. The time for the fresh mortar to flow to the limit of 20 cm was also measured during the test to determine its viscosity. The VSI (Visual Stability Index) criteria according to ACI 237R-07 [
28] were used to assess the degree of segregation.
After examining the consistency, samples were molded and stored for 24 h in a curing chamber (temperature 20 ± 2 °C, relative humidity RH ≥ 95%). After 24 h samples were demolded and cured in the curing chamber until further testing.
Tensile and compressive strength after seven days was tested according to the EN 196-1 [
26] standard using three prism-shaped specimens with dimensions of 40 mm × 40 mm × 160 mm (with the latter halves of those prisms remaining after the three-point bending test).
The contact angle test was performed based on the BS ISO 27448 [
29] standard on specimens with dimensions of 40 mm × 140 mm × 160 mm after 28 days of curing to investigate the self-cleaning properties of photocatalytic cementitious mortars. Before the test, samples were pretreated by dipping the tested surface in an n-heptane solution and drying at 70°C for 15 min afterward. Samples were then set aside for 30 min to cool to room temperature. Next, the initial contact angle of distilled water was measured five times in different locations on a tested surface via a goniometer. Afterward, samples were placed in an irradiation chamber, where they were irradiated with UVA radiation (Philips BLB 8W fluorescent lamps) with an irradiation of 10 W/m
2 (
Figure 11).
The contact angle was then measured after 72, 74, and 76 h of sample exposure to UV-A radiation in five different locations on the tested surface. The test result was a percentage difference in the average initial contact angle and the average value of consecutive measurements after exposing the tested surface to UV-A radiation.
The self-cleaning properties of photocatalytic cementitious mortars were also tested via a rhodamine test based on UNI 11259 [
30]. The test monitored the colorimetric changes of rhodamine drops on photocatalytic material subjected to UV radiation. On the tested surface, four spots were marked with a solution of rhodamine with water at a concentration of 0.1 g/1000 g. Each drop had a volume of 0.5 milliliters, following the UNI 11259 standard [
30], and was measured with a single-channel automatic pipette. The samples were stored in the dark for 24 h until the drops were absorbed. After the drops were absorbed, an initial measurement was made using a spectrophotometer of the NS 810 series (
Figure 12). Spectrophotometry is a technique to measure light absorption. It uses a light beam that passes through the sample, which absorbs or transmits light over a specific wavelength depending on its color. Data from the test can be used to determine sample color using various color spaces—in the case of the conducted research, the CIE Lab color scale.
Two readings were taken for each droplet, i.e., for each surface, a total of 8 readings per sample. The factor tested was the change in the a* parameter, i.e., a component of the CIE L*a*b* color model: L* for lightness and a* and b* for the color opponents green-red and blue-yellow, respectively. The values of these three variables are usually absolute, with the L* value representing the darkest black at L* = 0 and the brightest white at L* = 100. On the other hand, the a* value represents red and green opponents at positive and negative values, respectively, and the b* value represents yellow and blue opponents at positive and negative values, respectively. The a* parameter indicates the intensity of the red color imparted to the samples by rhodamine staining. Its value is expected to decrease with time of exposure of photocatalytic material to UV-A radiation. After the initial measurement, samples were exposed to four hours of UV-A irradiation (Philips BLB 8 W fluorescent lamps) of 4 W/m
2 following UNI 11259 [
30]. The same irradiation chamber was used as in the case of the contact angle test. However, the distance between UV-A lamps and the tested samples’ upper surface was changed to acquire the required irradiation.
To determine the self-cleaning properties of photocatalytic cementitious mortars, it was investigated whether the measurement results followed the assumptions of UNI 11259 (Equations (4) and (5)) [
30]. To characterize any surface with self-cleaning properties, the change in a* parameter after 4 h under UV-A radiation should be greater than 20% (R
4) and greater than 50% after 24 h (R
24). The a*(x) describes the reading on a* parameter with a spectrophotometer after irradiating samples for x hours in an irradiation chamber.
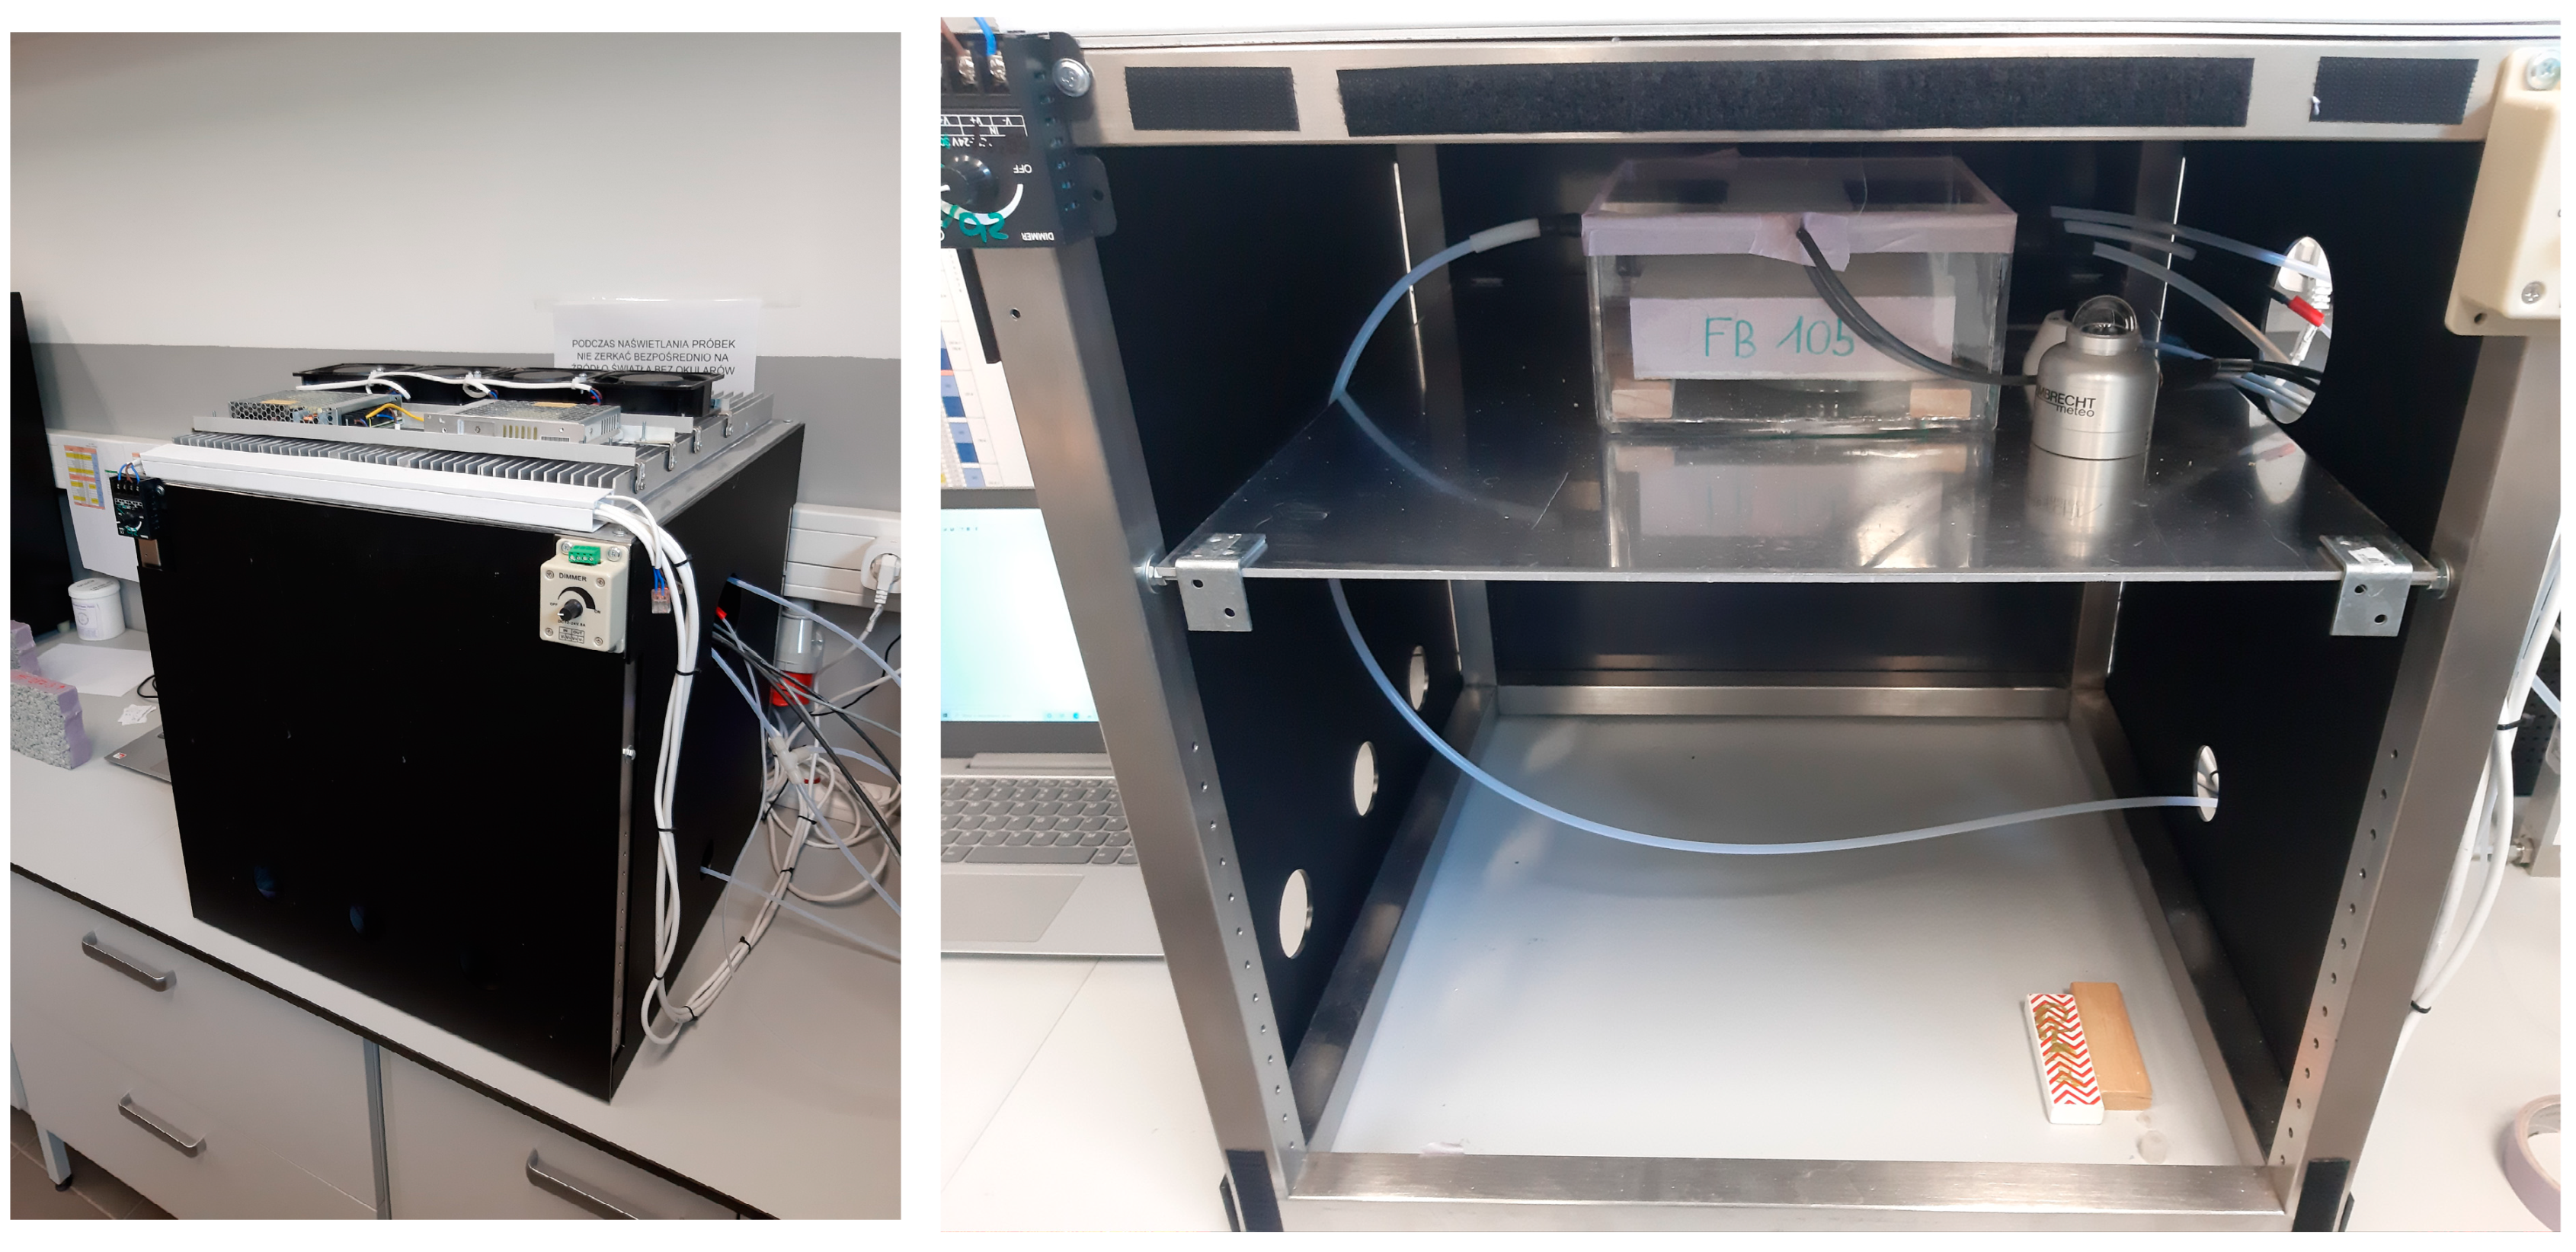
The effectiveness of air purification from gaseous pollutants—nitrogen oxides—was carried out following the procedure developed as part of the project “Technology for the production of innovative self-cleaning prefabricated facade and surface elements that improve air quality”, TECHMATSTRATEG-III/0013/2019. The test subject was photocatalytic cementitious mortar samples with dimensions of 40 mm × 140 mm × 160 mm. After demolding, the samples were cured for 28 days in a curing chamber. Before the test, the tested surface was cleaned of contamination. In the first step, the surface of the test sample was sprinkled with distilled water and scrubbed. Then, the sample was dried at 60 °C for two hours and placed in the irradiation chamber for 16 h with the test surface facing the light source, where the surface organic impurities were burned in UV-A radiation with an irradiance of 10 W/m
2. In the last step, the tested surface of the sample was cleaned again with distilled water to remove impurities burnt out in the previous step and dried again at 60 °C for 2 h. The effectiveness of cleaning the air from gas pollutants was tested at the earliest two hours after the last drying cycle of the sample. Cleaned of impurities, the sample was placed in the glass reaction chamber, with the tested surface facing the light source. The glass reaction chamber was tightly closed and sealed (
Figure 13). UV-A LED strips (360 ± 5 nm, 14.4 W/m) were used as a UV-A light source, and Sun-Like™ TRI-R™ LED strips (5000 K) were used as a visible light source. The UV-A and UV-B irradiation of the visible light source on the sample’s surface was 0.0 W/m
2, and the global irradiation was 150 W/m
2. The UV-B irradiation of the UV-A light source on the sample’s surface was 0.0 W/m
2, and the global irradiation was 1.2 W/m
2. UV-A and UV-B irradiations were measured using Delta Ohm pyranometers: UV-A (315–400 nm) and UV-B (280–315 nm). The global irradiation was measured using a Lambrecht METEO pyranometer in the range of 285–3000 nm. The temperature in the glass reaction chamber during the experiment was kept at a value of 25 ± 3 °C, and relative humidity at a value of 40 ± 5%. The gas flow was kept at a constant value of 2 L/min.
The quantification of the results (the concentration of NO and NOx) was conducted using the Teledyne API T200 chemiluminescence detection analyzer (San Diego, CA, USA). The analyzer was characterized by a lower detectable limit of 0.2 ppb (maximal 20,000 ppb), with the precision of analysis listed as 0.5% of reading value, and the zero noise below 0.1 ppb, with expanded relative uncertainty of 9% (taking into consideration all elements of analytical setup).
The study consisted of several stages (
Figure 14), i.e.,
Filling the reaction chamber with nitrogen oxides to achieve its concentration of 100 +/− 5 ppb;
Irradiation of the sample with UV-A light with an irradiance of 0.2 W/m2 and measurement of the concentration of nitrogen oxides while maintaining the gas flow from the first step;
Measurement of the concentration of nitrogen oxides after switching off the light source, while maintaining the gas flow from step one;
Emptying the reaction chamber of nitrogen oxides;
Filling the reaction chamber with nitrogen oxides to achieve its concentration of 100 +/− 5 ppb;
Irradiation of the sample with visible light with an irradiance of 150 W/m2 and measurement of the concentration of nitrogen oxides, while maintaining the gas flow from the first step;
Measurement of the concentration of nitrogen oxides after switching off the light source, while maintaining the gas flow from step one;
Emptying the chamber of nitrogen oxides;
Filling the reaction chamber with nitrogen oxides to achieve its concentration of 100 +/− 5 ppb;
Irradiation of the sample with UV-A light with an irradiance of 0.2 W/m2 and visible light with an irradiance of 150 W/m2 and measurement of the concentration of nitrogen oxides, while maintaining the gas flow from the first step;
Measurement of the concentration of nitrogen oxides after switching off the light source, while maintaining the gas flow from step one;
Emptying the chamber of nitrogen oxides.
The nitrogen oxide concentration was approximately 100 ppb to model the actual NOx concentration in the urban environment. UV-A and visible light irradiance were chosen as 0.2 and 150 W/m2 to model the actual summer solar radiation conditions in the Polish territory (UV index of 8–9 and visible light irradiation of 1000 W/m2–150 W/m2 were the maximal settings of the testing apparatus).
3. Results
The results of the consistency tests of prepared photocatalytic cementitious mortars are presented in
Table 9. It was found that prepared cementitious mortars differed in rheological properties in a selected range of variables. Depending on the mortar composition, its free flow varied significantly, within the range of 160 to 375 mm (the mass amount of superplasticizer was the same in all prepared series). In only two prepared series, visual signs of segregation were observed. The time required for the sample to flow to 200 mm was comparable between most prepared cementitious mortars, except for mortar 8, which was characterized by too high viscosity to reach the flow of 200 mm.
Mechanical strength tests after seven days of curing also showed significant differences (
Figure 15). The tensile strength for all series was in the range of 6.19 MPa (mortar 11) to 8.15 MPa (mortar 4). For compressive strength, the difference between different series was more significant—the mortar with the lowest compressive strength was mortar 11 (55.77 MPa), and the highest was mortar 3 (77.7 MPa).
The results of the self-cleaning tests via the rhodamine test are presented in
Figure 16. For the surface of the material to be described as self-cleaning, the reduction in parameter a should be at least 20% after four hours of irradiating in UV-A light of a given irradiation and at least 50% after 24 h. In the case of the prepared photocatalytic cementitious mortars, the R4 value varied significantly, ranging from −1.49% for mortar 7 to −30.88% for mortar 1. Out of the 11 prepared series, only six were characterized with an R4 parameter greater than −20%. The R24 value also varied significantly, ranging from −7.31% for mortar 7 to −58.23% for mortar 9. Out of the 11 prepared mortars, only three were characterized with an R24 parameter greater than 50%. Based on the experiment, out of the 11 prepared mortars, only three surfaces could be described as self-cleaning ones.
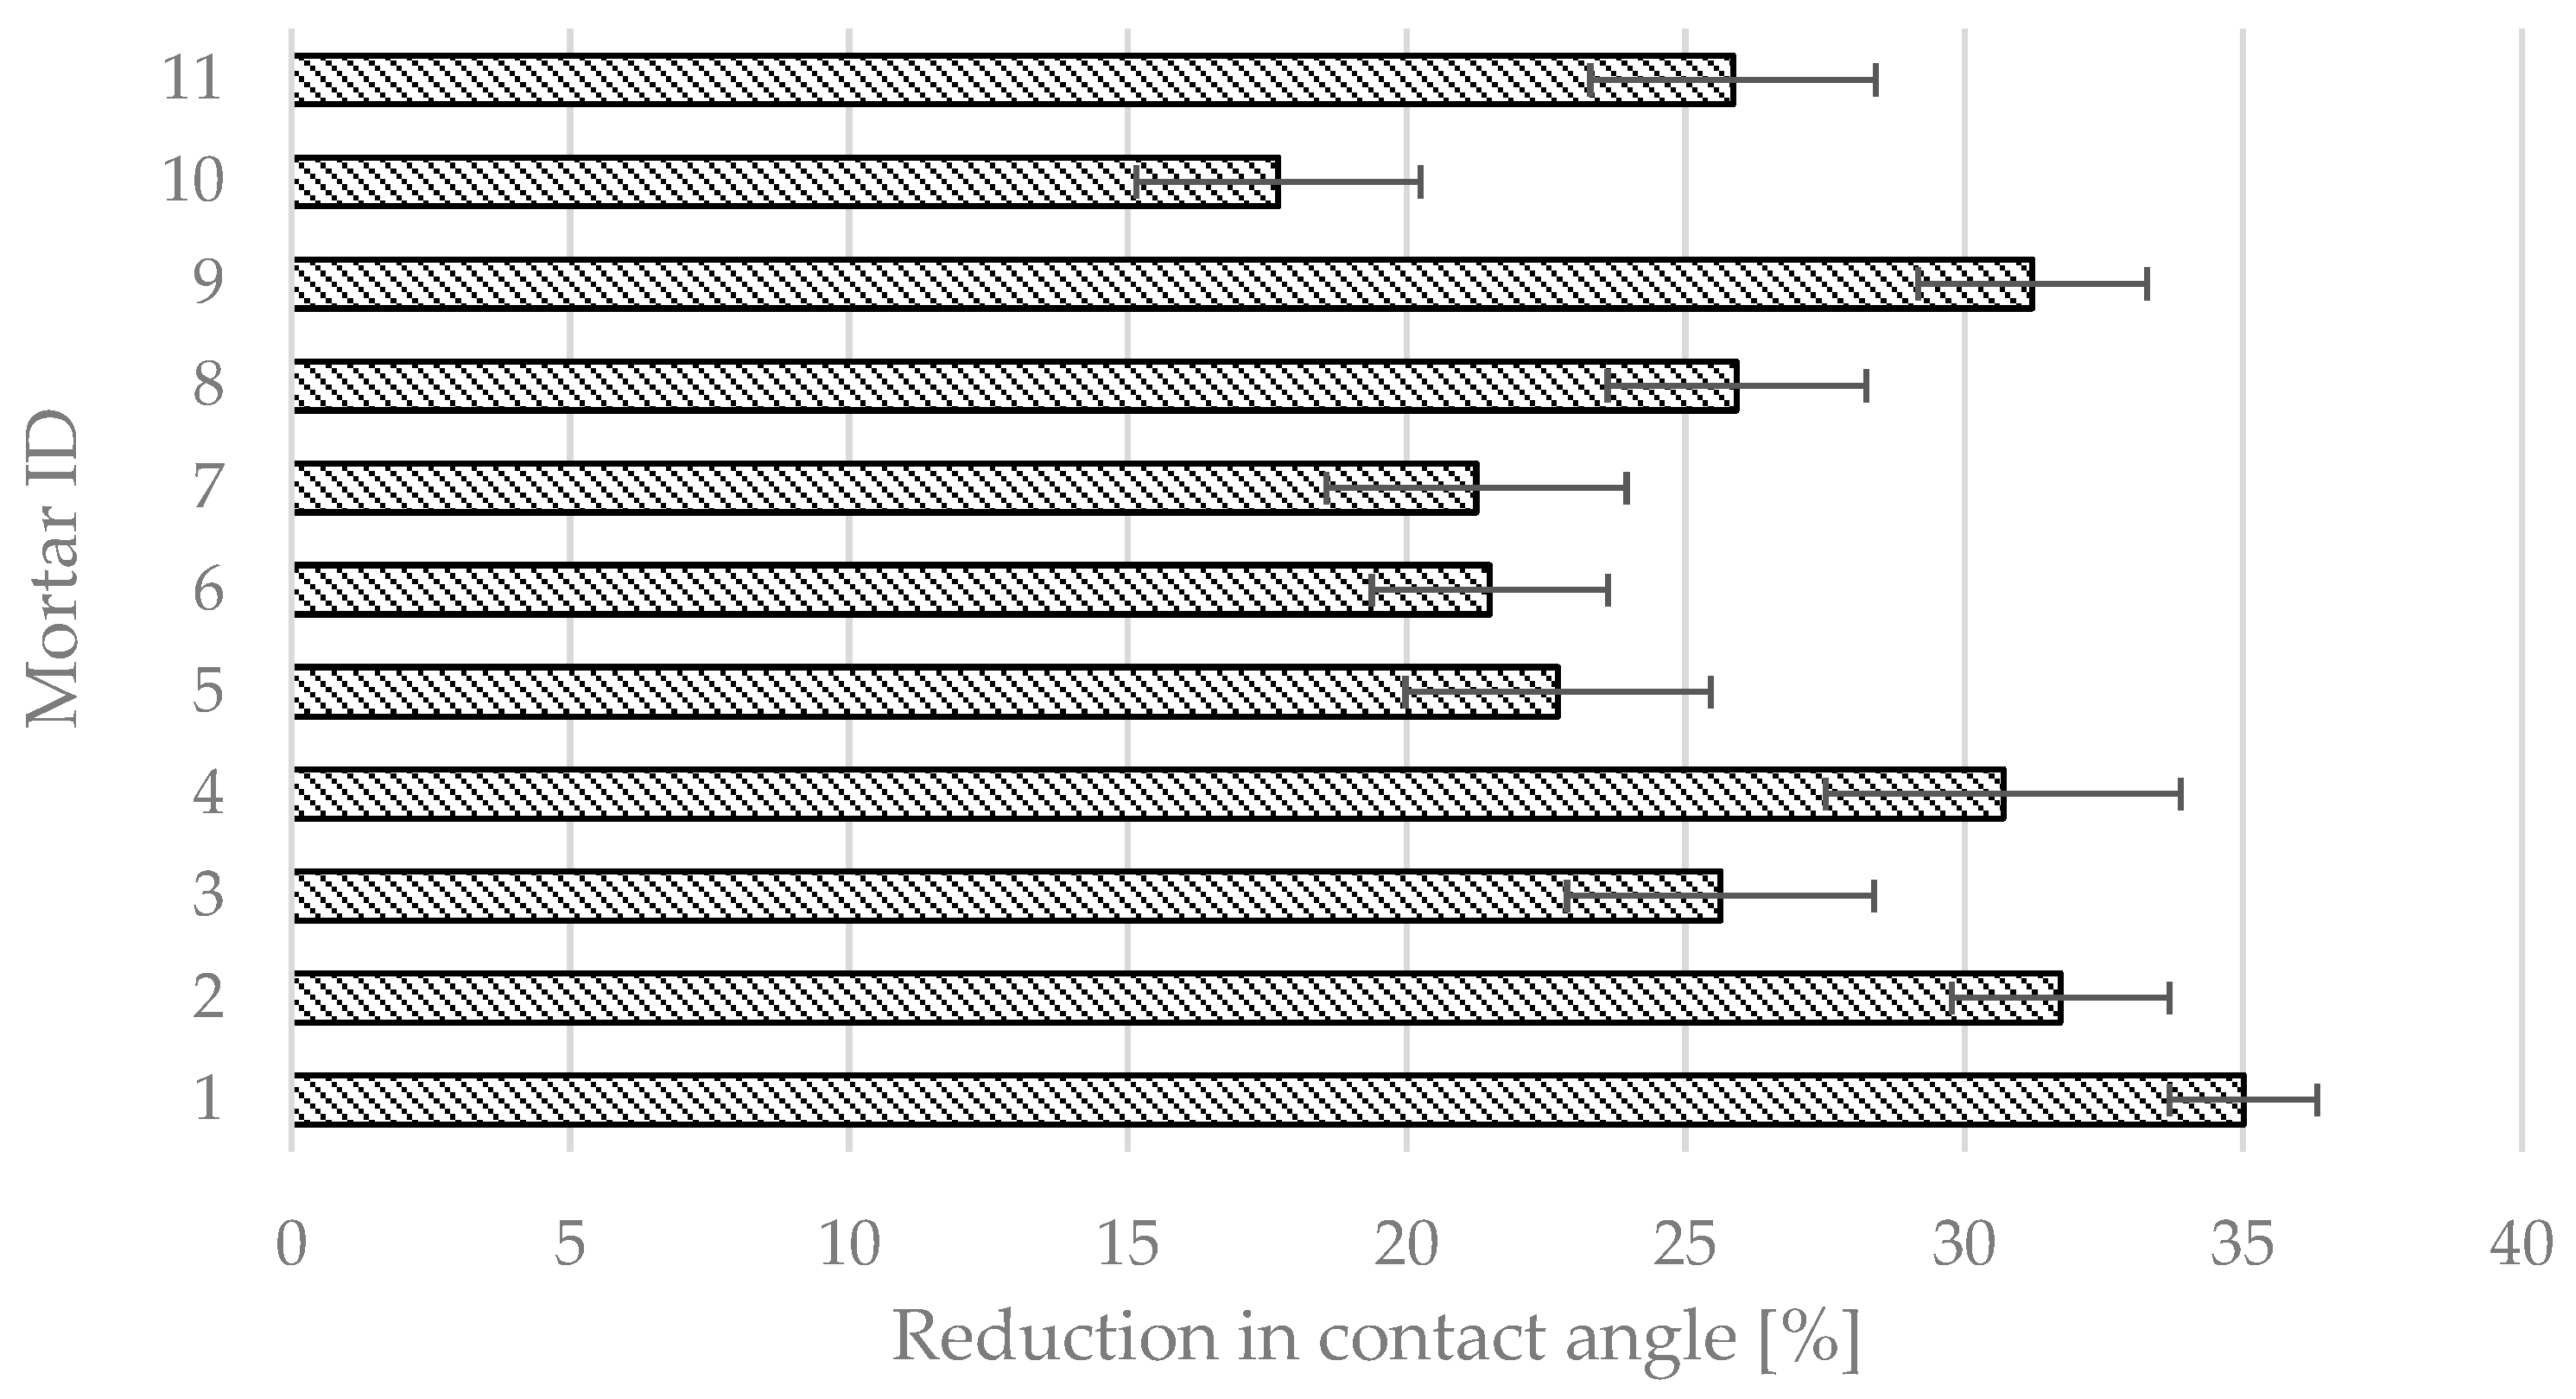
The results of self-cleaning tests via the contact angle test are presented in
Figure 17. The limit value for this test is not specified in BS ISO 27448 [
28]. In the case of the prepared photocatalytic cementitious mortars, the change in contact angle caused by UV-A irradiation varied significantly, ranging from −17.7% for mortar 10 to −35.0% for mortar 1. Out of the 11 prepared mortars, only seven were characterized by a reduction in contact angle greater than 25%.
Figure 18 presents the actual data that was analyzed to calculate the contact angle in any test measurement.
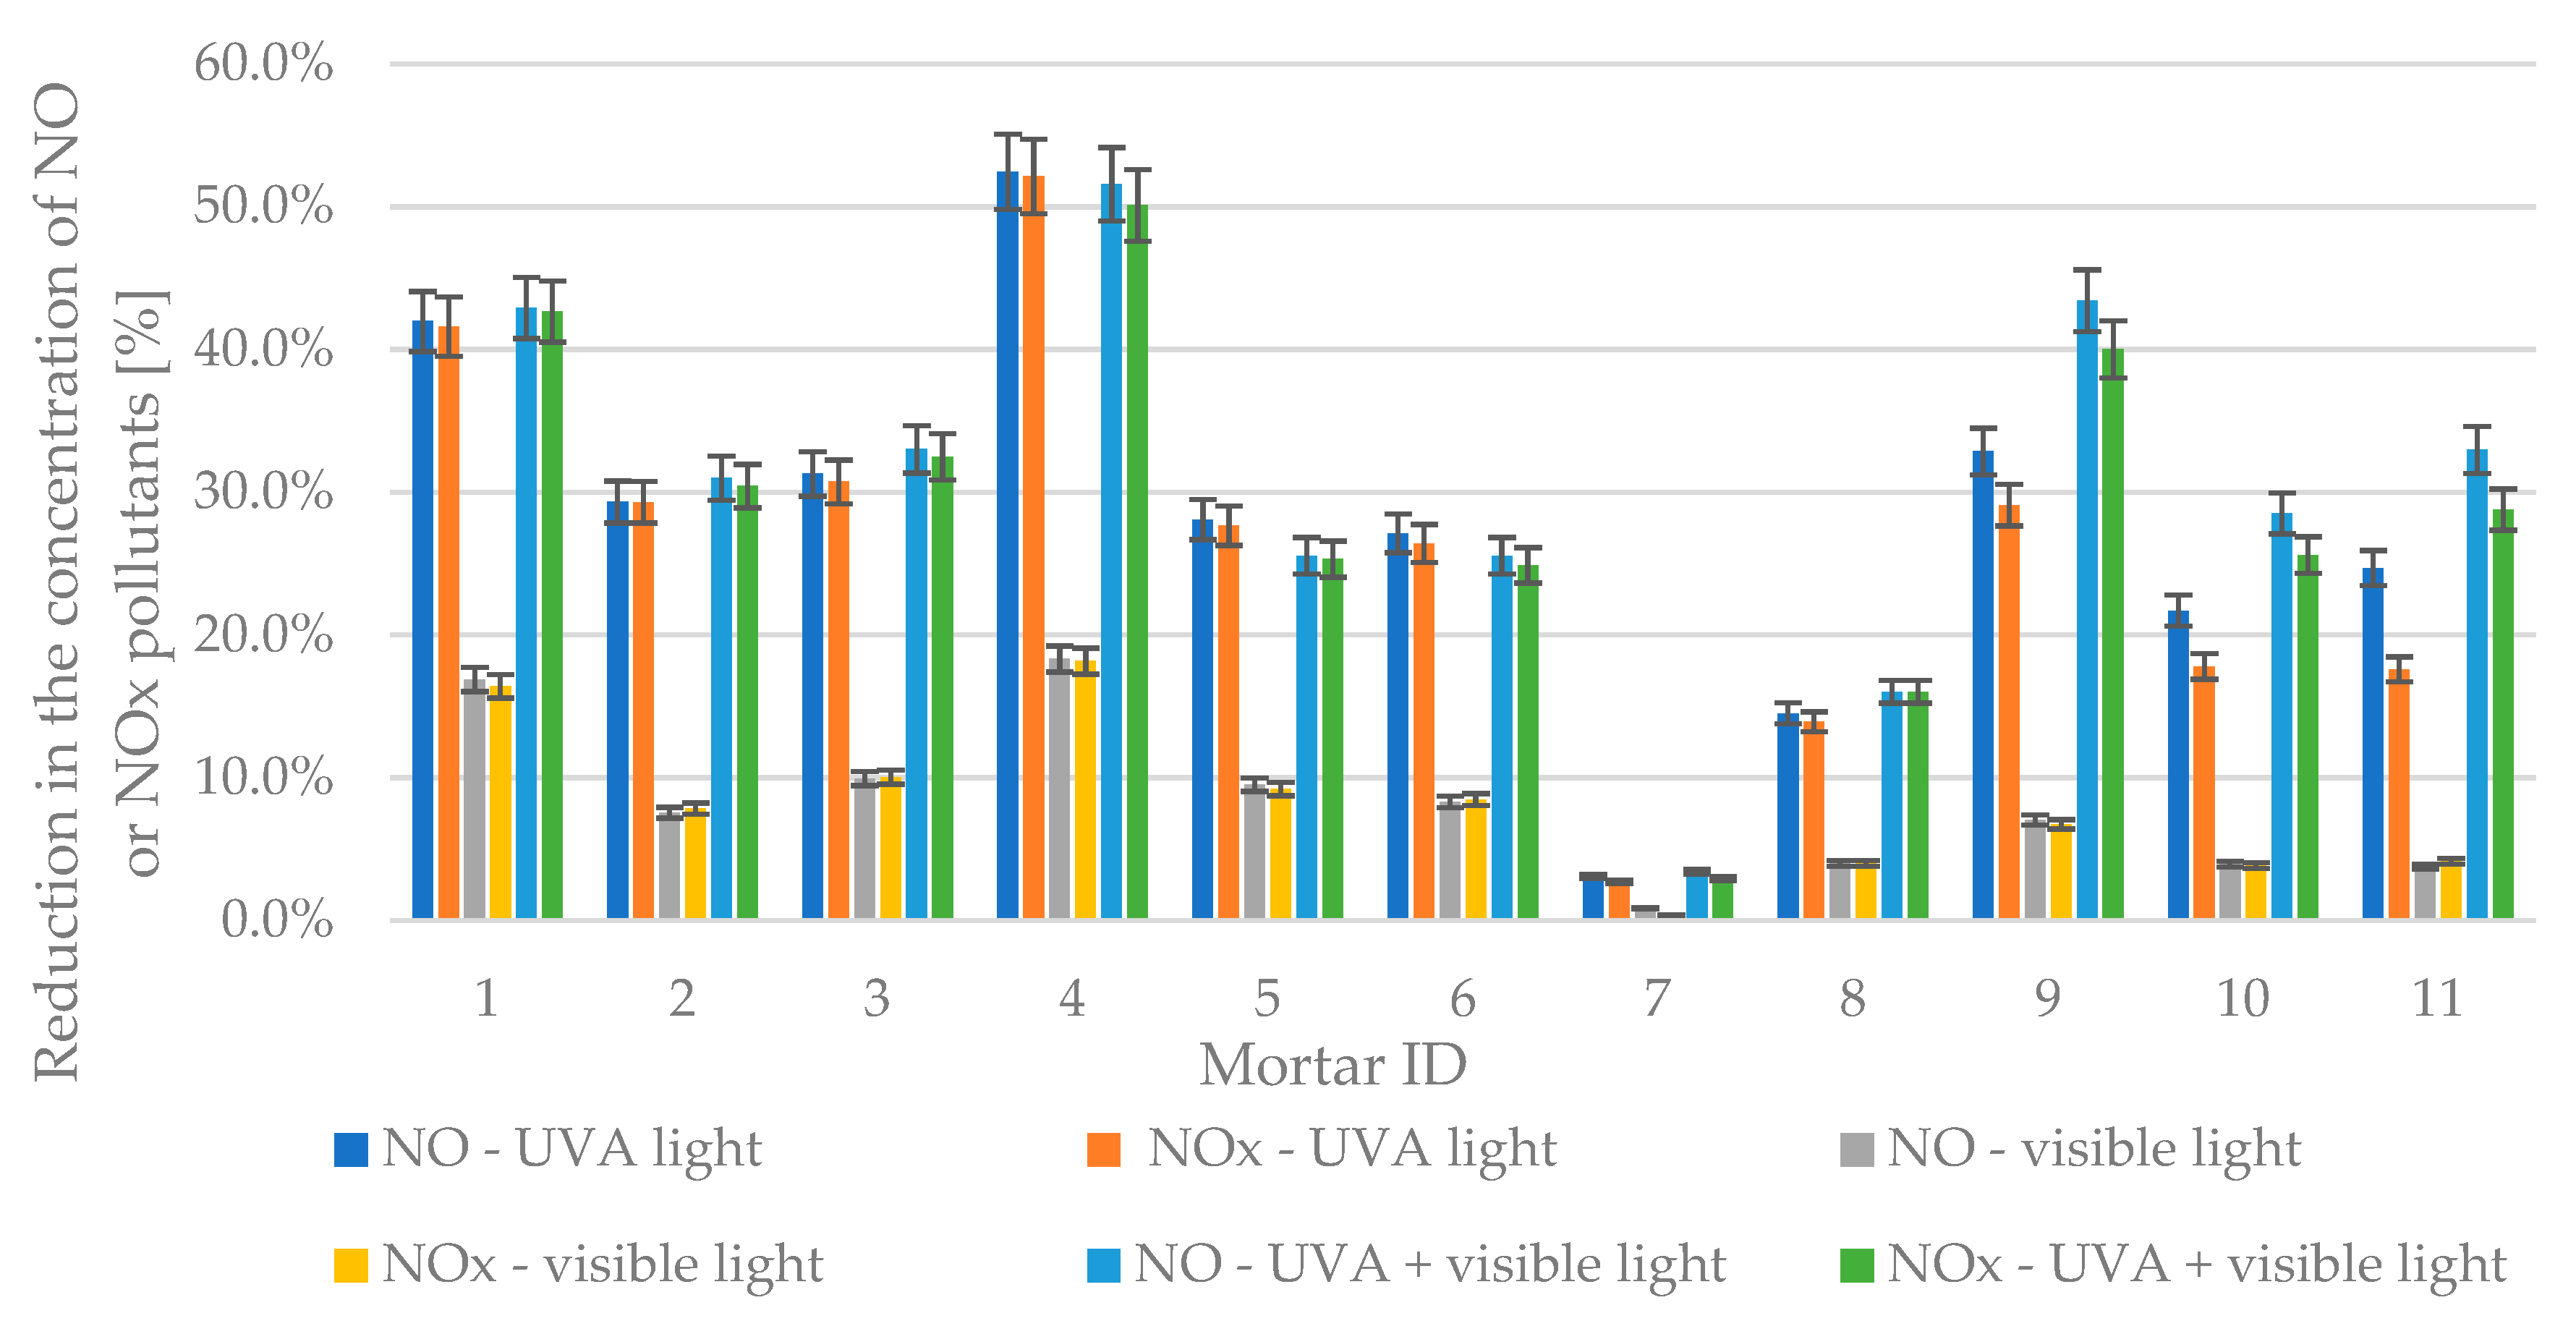
The test results of the effectiveness of air purification from gaseous pollutants—nitrogen oxides—are presented in
Figure 19. The result of any given test regarding air purification efficiency was a relative reduction in the concentration of both NO and NO
x under different irradiation conditions compared to its initial concentration with UV-A or visible light lamps turned off.
In the case of the prepared photocatalytic cementitious mortars, the reduction in concentrations of both NO and NOx varied significantly between different series and in various types of radiation present (UV-A, Visible, or both). The lowest reduction in all irradiation environments was observed for mortar 7—for UVA reductions were 3.1% and 2.7% for NO and NOx respectively, for TRI-R reductions in pollutant concentrations were 0.9% and 0.4% for NO and NOx respectively, and for combined UVA and visible light reductions were 3.4% and 3.0% for NO and NOx, respectively. The highest reductions in nitrogen oxides were observed for mortar 4—for UVA reductions were 52.4% and 52.1% for NO and NOx, respectively, for TRI-R reductions in pollutants concentrations were 18.3% and 18.2% for NO and NOx, respectively, and for combined UVA and TRI-R reductions were 51.6% and 50.1% for NO and NOx, respectively.
4. Discussion
The prepared research plan aimed to investigate the influence of selected material variables on the properties of photocatalytic cementitious mortars. Several variables were considered, representing the components of regular mortars and photocatalytic additives. It was found that each of the assumed variables, in the assumed range of variability, significantly influenced at least one of the tested properties of photocatalytic materials (
Table 10). The analysis of obtained test results was conducted via screening design using the Plackett–Burman method, a bivalent elimination plan with a triply repeated central point, where each of the considered variables has an average value from an assumed range of variability. In this type of statistical plan, statistically significant variables for tested properties can be identified with a reduced number of required samples. In the conducted research, seven different variables were considered. A photocatalyst must be included in its composition to obtain a cementitious material with photocatalytic properties [
31]. As it represents an additional component of the mix, it is proper to assume it will also influence other material properties [
32].
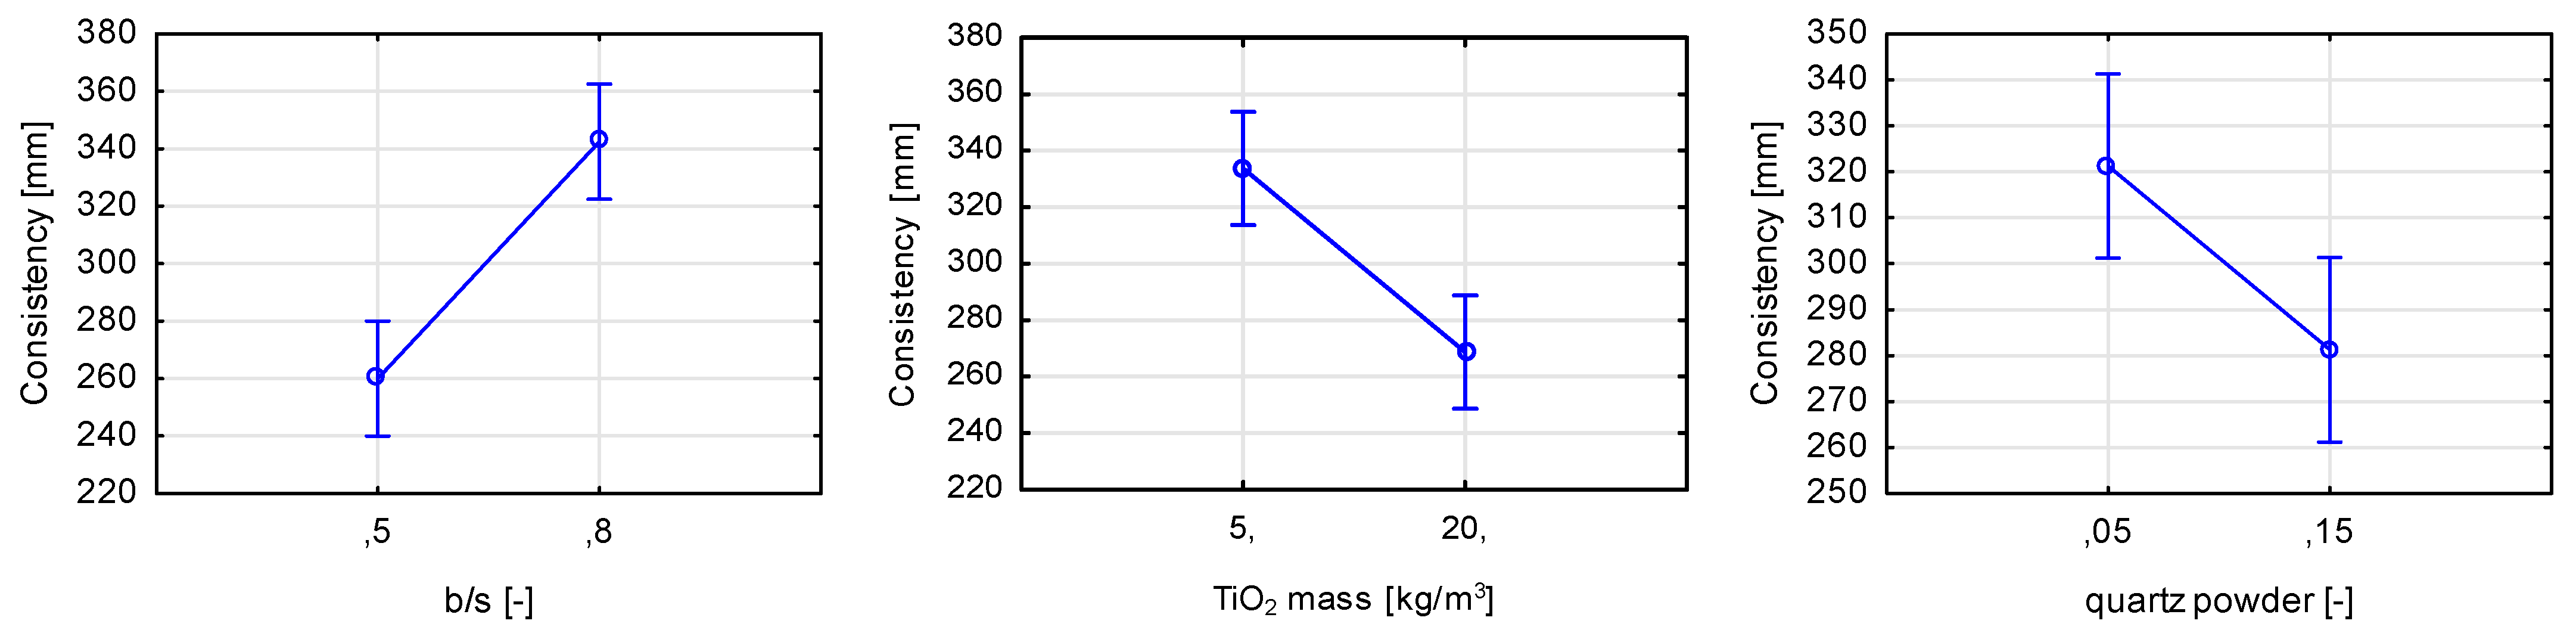
Although the total mass of titanium dioxides in the performed study was 5 to 20 kg/m
3, even such a small content compared to the mass content of other components had a thickening effect on the consistency of fresh mortar (
Figure 20). It was found that consistency-wise, the increase in the ratio between the binder (cement+quartz powder to sands) had a fluidizing effect on fresh mortar. This observation is logical, as the superplasticizer (SP) content depended on the mass of cement in the mix—with an increase in the b/s ratio, the mass of cement increased and, therefore, the SP mass amount. On the other hand, by increasing the b/s ratio, the amount of cement paste within the mortar increases, and the amount of sand aggregate decreases; this dependence also contributes to an increase in mortar fluidity. Additionally, with an increase of quartz powder replacing cement, the thickening effect on mortar’s consistency was observed, linked with an increased water demand of fine aggregate. The observation regarding titanium dioxide content regarding rheological properties of cementitious materials was compliant with the scientific literature on the subject [
33]. TiO
2 is characterized by fine granulation, depending on the efficiency of the breakdown of agglomerates with, for example, ultrasounds—in extreme conditions, its granulation could be reduced to crystallite size (10–100 nm). By introducing such a fine component into the mix, its rheology is going to be impacted.
The segregation of individual components of fresh mortar is closely linked with its rheological properties [
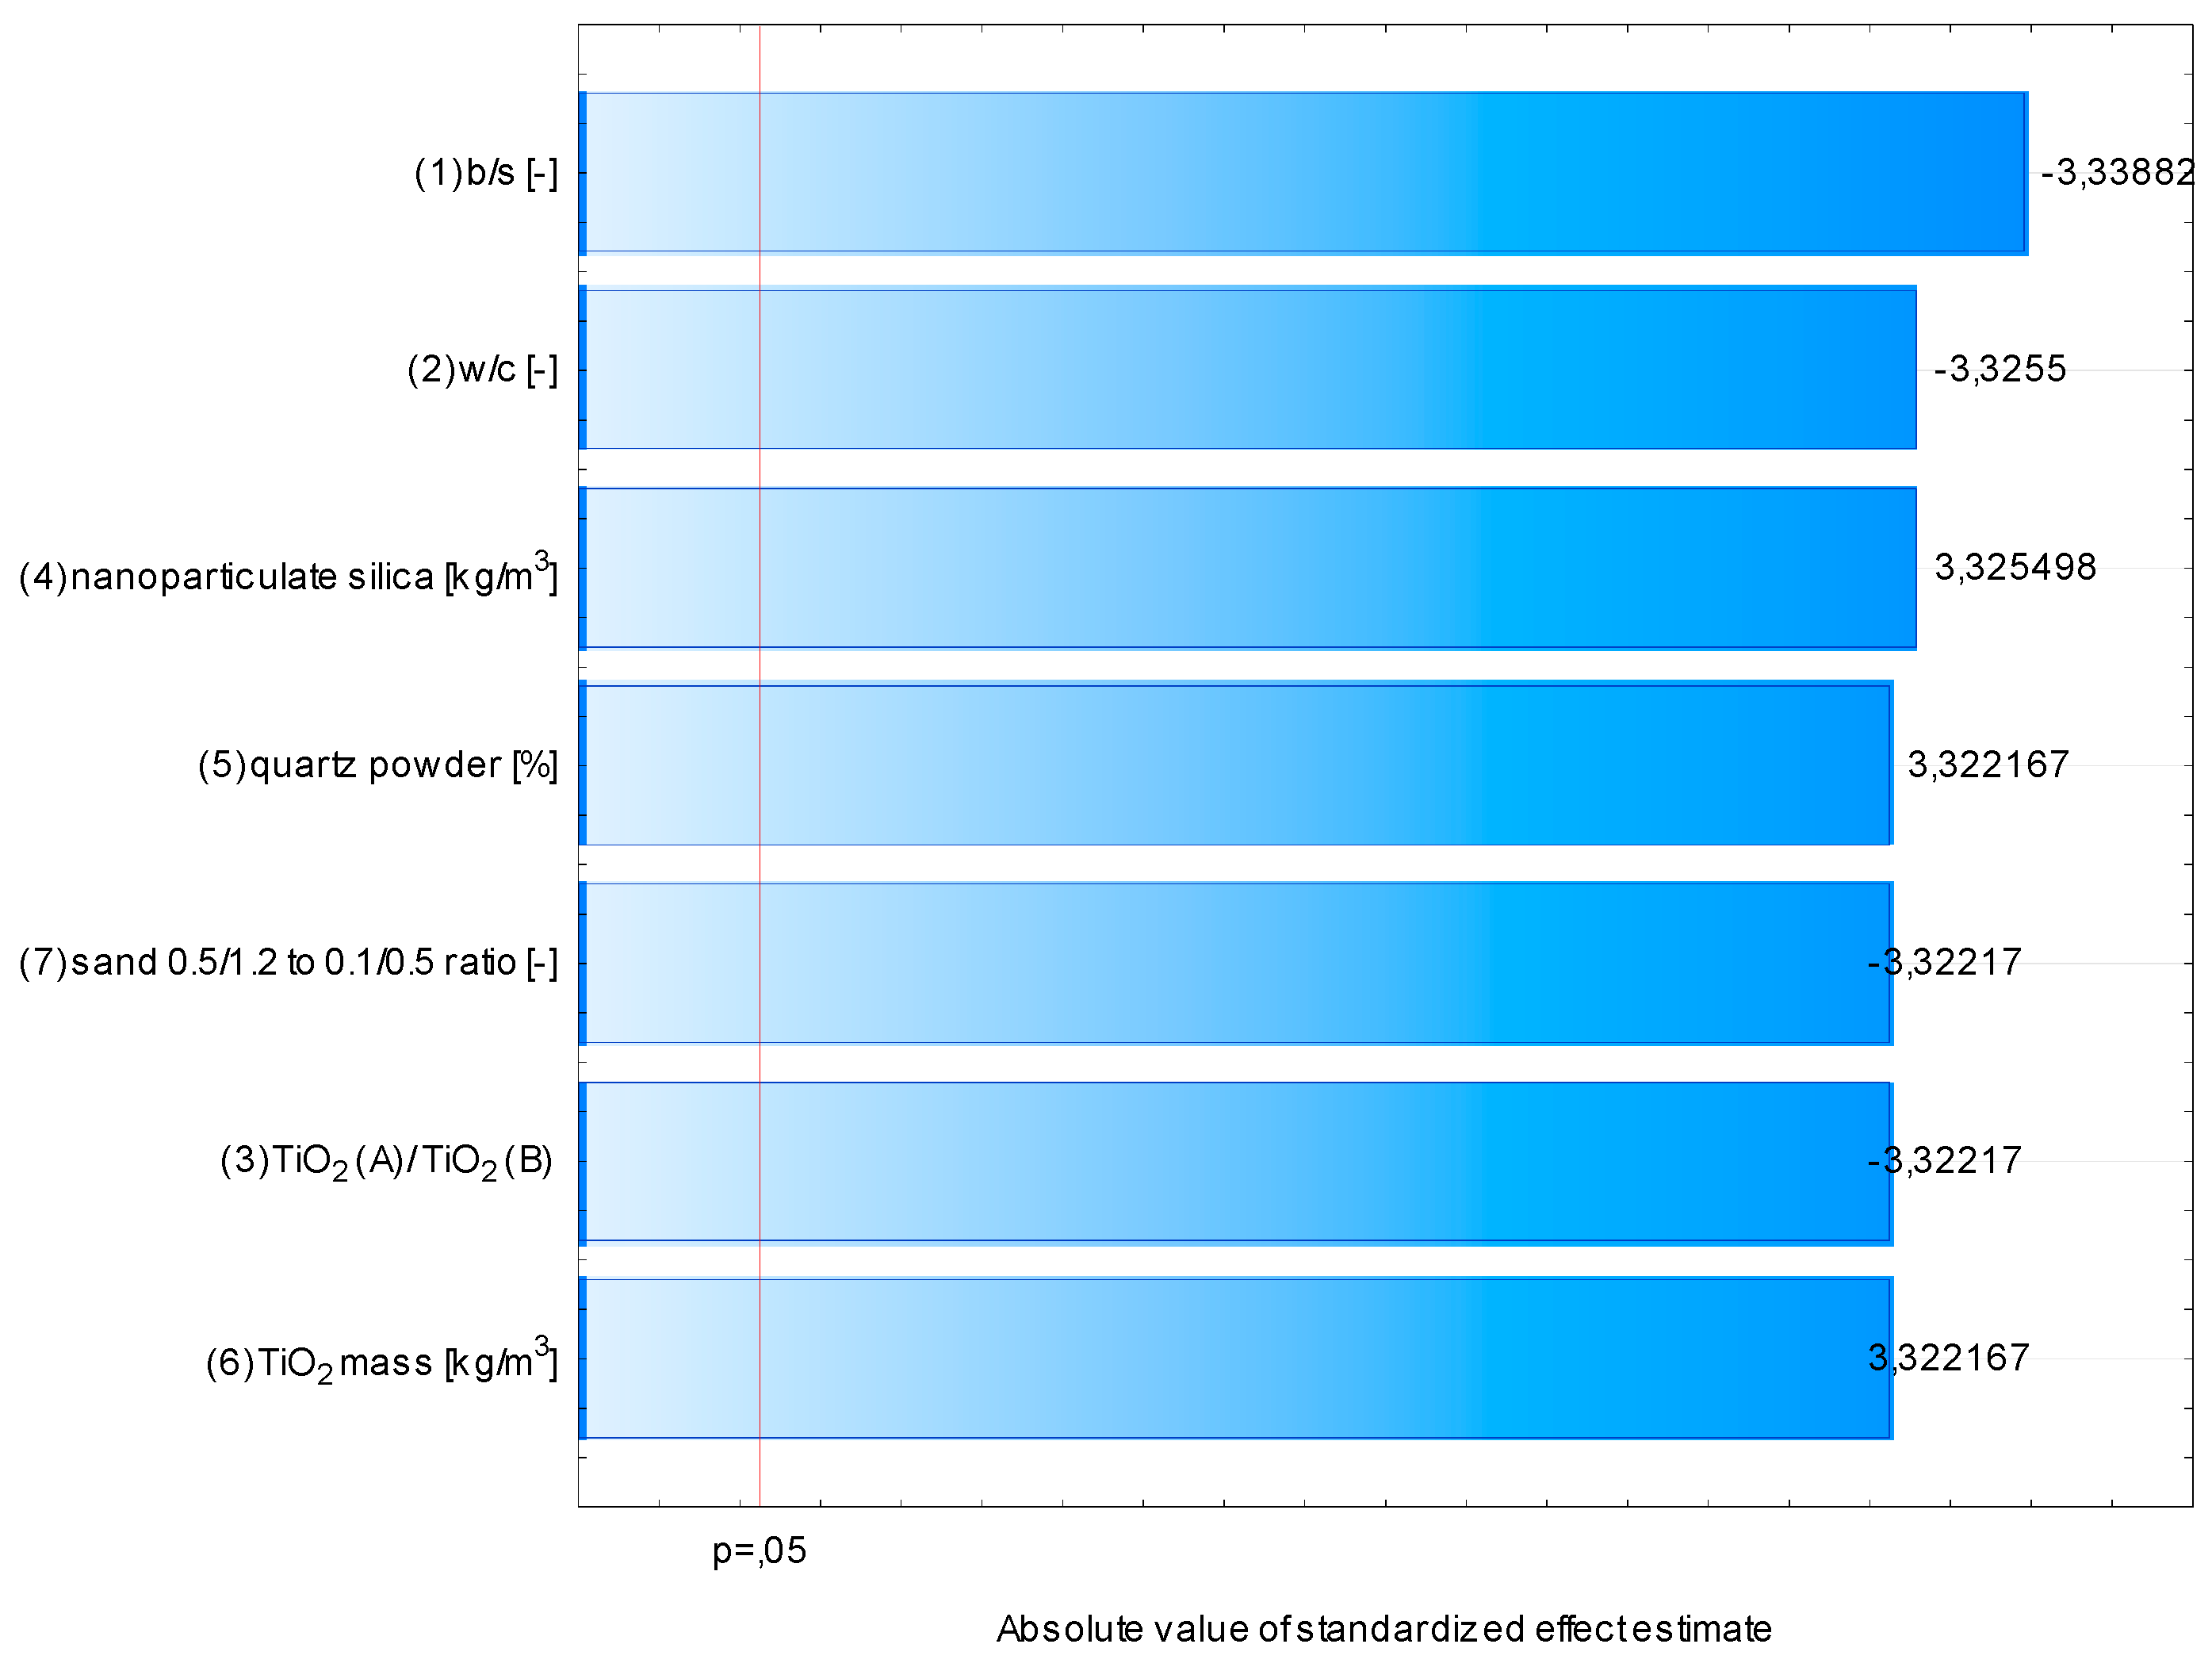
34]. If the yield stress of fresh mortar is high, it is characterized by low consistency. In addition, as its plastic viscosity increases, the time required to reach a specific flow increases. In the conducted study, the time required for the fresh mortar to flow to a diameter of 200 mm was measured—an indirect study on the influence of selected variables on the viscosity of fresh mortars. All assumed variables in the assumed range of variability had a statistically significant effect on the rheological properties of fresh mortars (
Figure 21). In this graph, the effect ratings obtained by the ANOVA procedure are ordered from the highest absolute value to the lowest. The value of each effect is represented by a bar and a line that indicates how large the effect should be to be statistically significant (in the conducted research, the
p-value was chosen at a standard value of 0.05).
An increase in TiO
2, nanoparticulate silica, and quartz powder content caused an increase in the viscosity of fresh mortars. On the other hand, an increase in b/s, w/c, and sand ratio had the opposite effect. The thickening effect was due to an increase in fine grains in the mortar, regardless of their material origin [
35]. In the case of variables contributing to an increase in fluidity, the change was caused by either the increase in cement paste content of low viscosity (due to its modification with SP), an increase in water content (fluid of low viscosity), or an increase in the content of coarser-grained sand aggregate (0.5/1.2). The VSI (Visual Stability Index) value for all prepared mortars was investigated as part of the research. This method assumes grading the visual quality of a fresh mortar on a scale of 0 to 3, where 0 is no segregation and 3 is extreme segregation of fresh mortar. It was found that three out of seven considered variables influenced this property (
Figure 22). However, out of the 11 prepared mortars, only two were characterized with a VSI higher than 0.
In the assumed range of variability, TiO
2 mass content did not influence the mechanical properties of hardened mortars after seven days of curing. The significant variables in the case of compressive strength were the water-to-cement ratio and binder-to-sand ratio, and in the case of tensile strength, the water-to-cement ratio and ratio between two used sands (
Figure 23). For compressive strength, an increase in the b/s ratio also increased the strength of the material. For tensile strength, an increase in the content of coarser sand aggregate contributed to an increase in strength.
Overall, TiO
2 addition influenced the properties of fresh mortar; however, it did not significantly contribute to any changes regarding the mechanical properties of the composite. In scientific literature, it is reported that a higher mass amount of TiO
2 in the cementitious composite can act as an ultra-fine aggregate, increasing the material’s mechanical properties [
18,
36].
The most critical information from the conducted research was that TiO2 mass is not the only and not the most statistically significant variable concerning the air purification from nitrogen oxides and the self-cleaning properties of tested cementitious materials. TiO2 content was the second or third most significant variable in the considered range of variability, depending on the tested property. In each case, the increase in its mass content was equivalent to a rise in photocatalytic efficiency, either measured by air purification tests or self-cleaning ones.
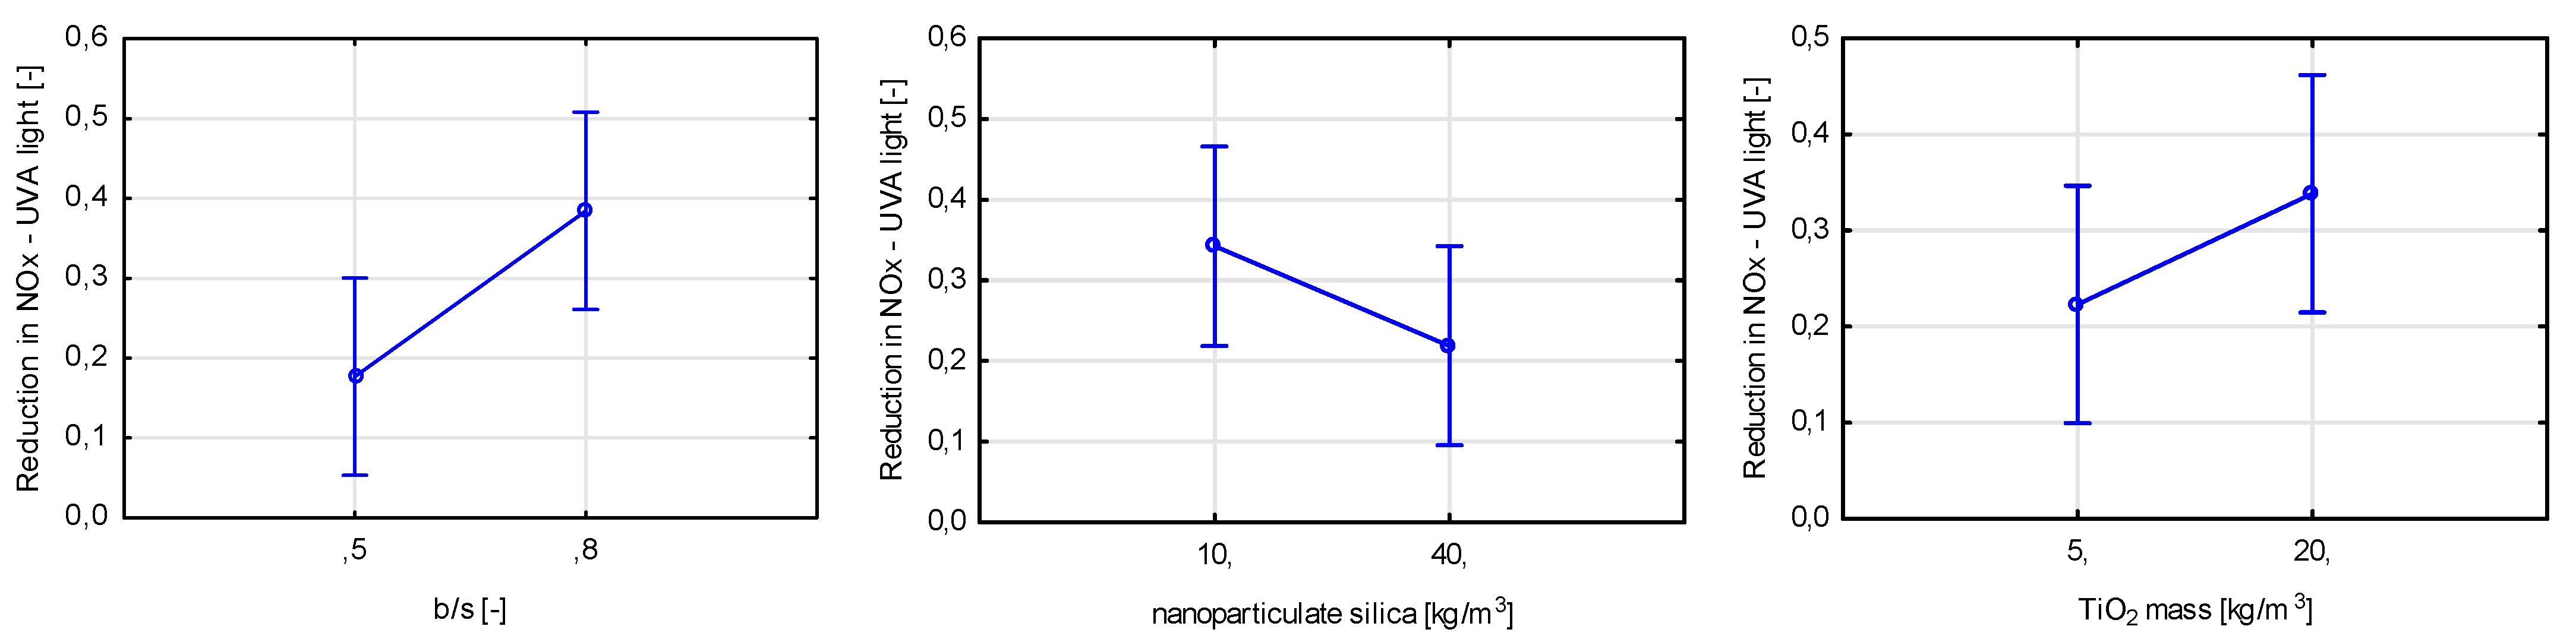
For all air purification tests, regardless of the type of nitrogen oxide content being measured (NO or NO
x), three variables proved to be statistically significant. Binder-to-sand ratio proved to be the most significant, contributing in each test to an increase in the efficiency of air purification (
Figure 24 and
Figure 25).
It is well-established that incorporating photocatalytic materials in the composition of cementitious materials is the sole reason for the material to gain photocatalytic properties [
8,
19,
30]. However, the remaining components of the mix impact the distribution of TiO
2 within the cement matrix. From the conducted research, a conclusion can be drawn that in the selected range of variability of mass content of titanium dioxide in the mortar, the composition of mortar significantly impacts the properties regarding air purification. With an increase in the binder-to-cement ratio of the material, the volume in which TiO
2 has distributed increases, reducing its chance to agglomerate and increasing the surface on which photocatalytic reactions can occur (
Figure 26). In addition, TiO
2 particles can act as crystallization nuclei for hydration products. With an increase in the b/s ratio of the mortar, the phenomenon of self-drying of the cement matrix is intensified, limiting its hydration degree and the number of TiO
2 particles being wholly covered with hydration products.
The effect of nanoparticulate silica was opposite to that of the b/s ratio, as it is a component of the mix added to increase the tightness of the material and acts as an ultra-fine filling material, reducing the exposure of titanium dioxide to sun radiation. Interestingly, changes in the water-to-cement ratio did not contribute to the difference in the efficiency in purifying the air from NO and NOx, suggesting that either its variability was chosen in too narrow a scope or that the porosity of the cement matrix has a negligible effect on the intensity of photocatalytic reactions.
The rhodamine test also singled out three variables having a significant influence on the self-cleaning properties of the material (
Figure 27). The total mass content of titanium dioxide was the most statistically significant, followed by the binder-to-sand ratio and the water-to-cement ratio. Contrary to air purification tests, an increase in the porosity of the cement matrix caused by an increase in the water-to-cement ratio led to an increase in the self-cleaning properties of prepared mortars. A drop of rhodamine solution or water is placed directly on the tested surface in both the rhodamine test and the contact angle test. Properties of that surface influence the initial size of the contact plane between the object whose properties are tested (contact angle for the drop of water, change in color for rhodamine). In the case of air purification tests, the influence of surface properties is slimmer and comes down to the surface covered in TiO
2, as gaseous pollutants need to be in contact with the photocatalyst physically.
The binder-to-sand ratio also influenced the material’s ability to self-clean tested via the rhodamine test. As shown before, an increase in its value contributes to an increase in the composite’s ability to purify the air from pollutants. It is safe to assume that due to better dispersion of titanium dioxide within the cement matrix in the case of increasing b/s ratio value, better exposure of TiO2 grains to the radiation source was obtained, increasing materials’ self-cleaning properties.
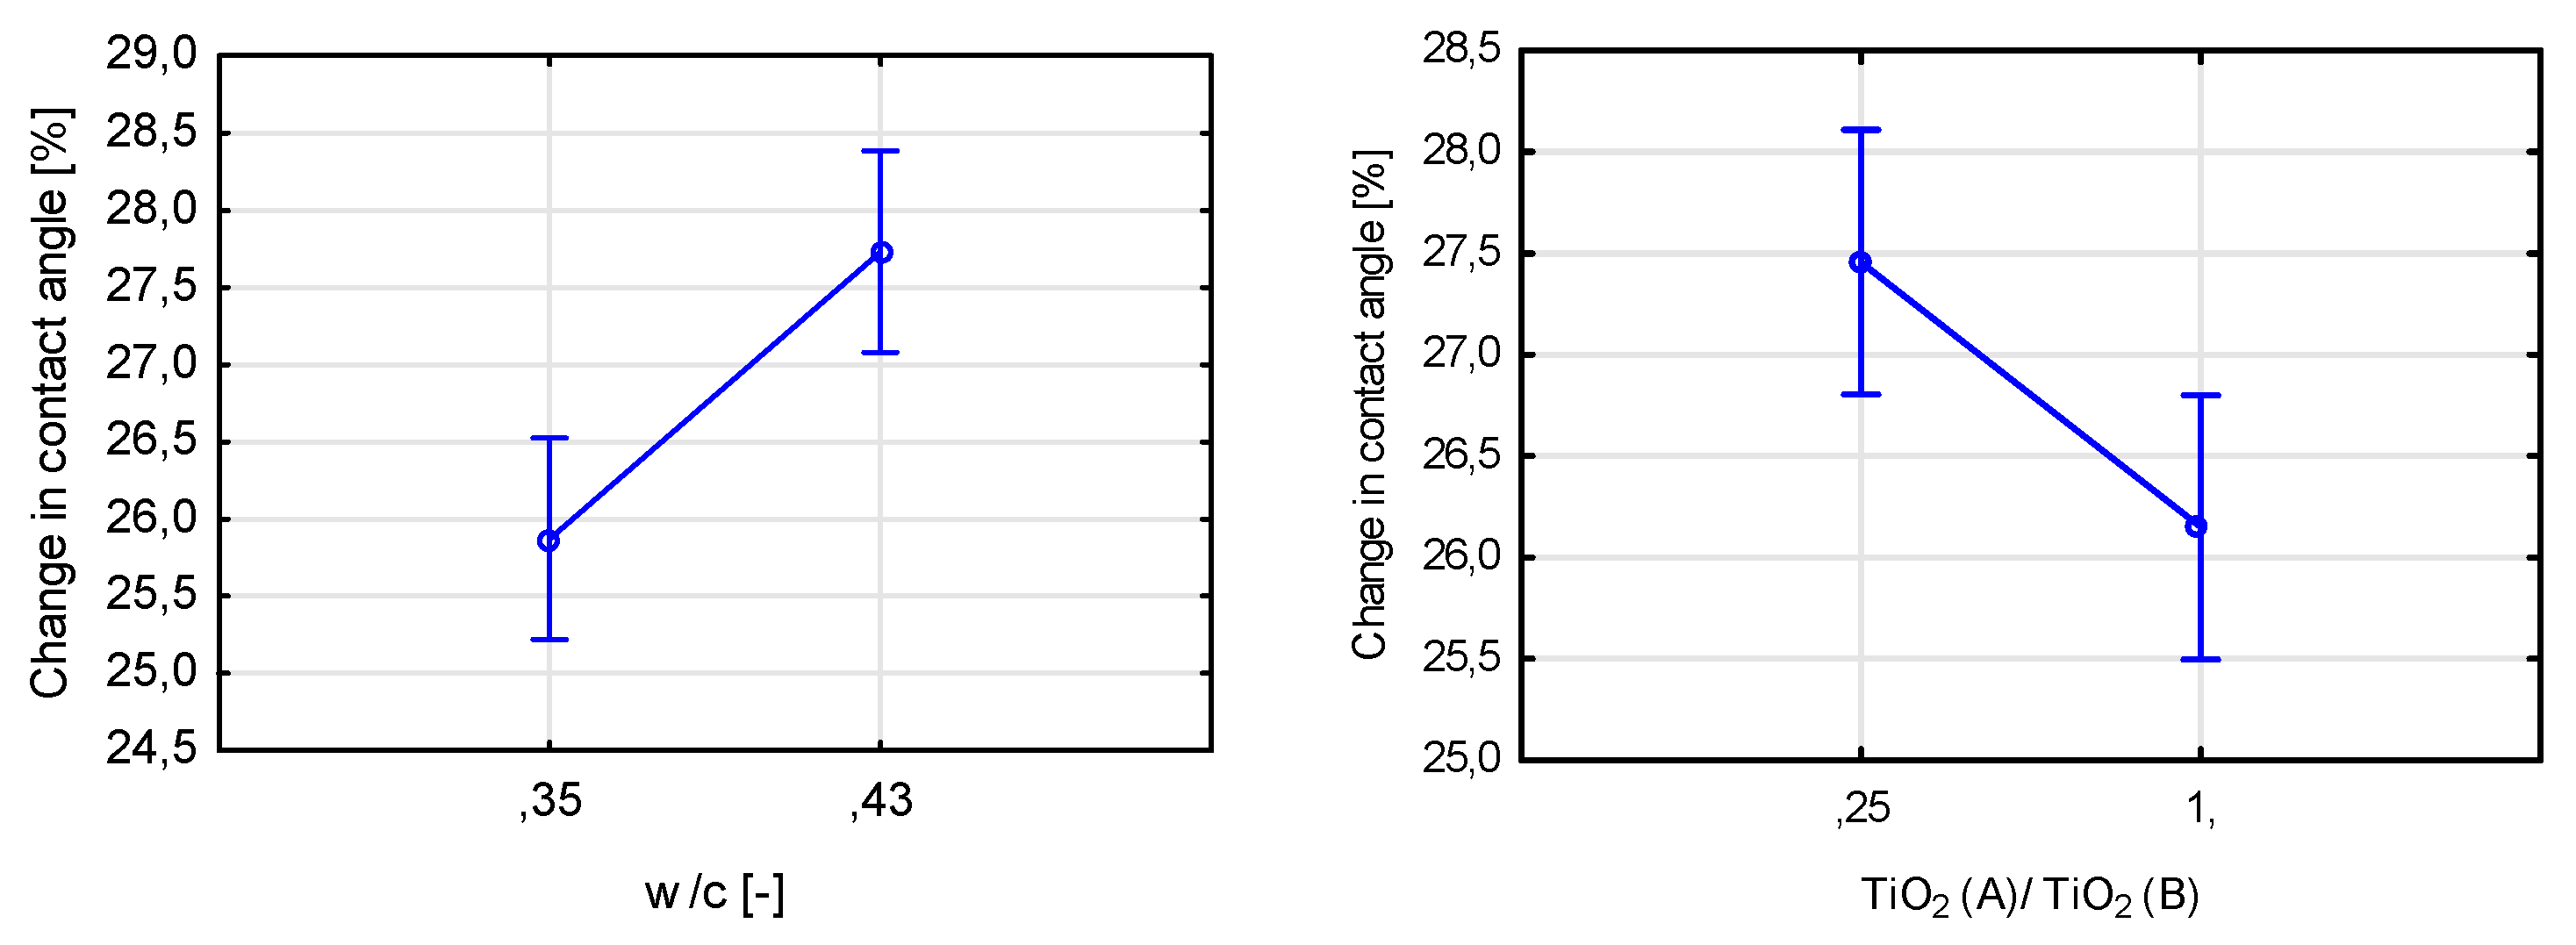
Finally, the final self-cleaning test concerning the change in the contact angle between a drop of distilled water and the tested surface showed a statistically significant influence of five assumed variables (
Figure 28). The most significant of them was the binder-to-sand ratio, followed by TiO
2 content and nanoparticulate silica mass content. All of the significant variables influenced the contact angle reduction after exposure to UVA radiation, except the ratio between the two photocatalysts used in the study. As in the rhodamine test, the properties of the tested surface, except the TiO
2 content, influenced the course of the test.
Out of the seven included variables, three did not influence the air purification and self-cleaning properties of photocatalytic mortars—the replacement level of cement with quartz sand, the sand ratio, and the mass ratio between two photocatalysts. In the case of quartz powder, the range of variability was probably too narrow. Even if that was the case, the information that part of cement can be replaced with a material with a significantly lower carbon footprint without compromising its photocatalytic properties presents a vital conclusion from the performed research. The assumed variability of mass ratio between two sands of different granulations was wide; however, it did not affect the photocatalytic properties of prepared mortars. This phenomenon could be related to the amount of cement paste in the prepared mortars, represented by the binder-to-sand ratio. The ratio between cement and fine aggregate in regular cement mortars is usually 0.33 to 0.5. In that case, the aggregate can impact the properties of the surface of the material, for example, its roughness. In the conducted study, the cement paste volume proved to be high enough compared to the volume of aggregate to mitigate its influence on surface properties completely.
The lack of influence of the type of photocatalyst on the properties of photocatalytic mortars, despite the differences in their properties (mainly specific surface and crystallite size), was probably caused by the susceptibility of a TiO
2 of a higher specific surface area to agglomerate (TiO
2 (A)). Usually, the higher the surface area, the higher the risk of agglomeration of any material [
36,
37]. In the performed research, it is probable that TiO
2 (A), a photocatalyst of a higher potential in air purification, had reduced to a level comparable with TiO
2 (B). It could be argued that using photocatalysts of high specific surfaces could prove ineffective in cementitious composites; however, such a claim requires further studies on the subject.


