Article

Relationship of Meteorological Data with Heat Stress Effect on Dairy Cows of Smallholder Farmers

by
Md. Delowar Hossain
1,
Md. Abdus Salam
2,
Shabbir Ahmed
3,
Mst. Umme Habiba
3,
Shahrina Akhtar
4,
Md. Mazharul Islam
5,
S. A. Masudul Hoque
5,
Abu Sadeque Md. Selim
1 and
Md. Morshedur Rahman
3,*
1
Department of Animal Science and Nutrition, Faculty of Veterinary Medicine and Animal Science, Bangabandhu Sheikh Mujibur Rahman Agricultural University, Gazipur 1706, Bangladesh
2
Agricultural Economics and Rural Sociology Division, Bangladesh Agricultural Research Council, Dhaka 1215, Bangladesh
3
Department of Dairy and Poultry Science, Faculty of Veterinary Medicine and Animal Science, Bangabandhu Sheikh Mujibur Rahman Agricultural University, Gazipur 1706, Bangladesh
4
Krishi Gobeshona Foundation, Dhaka 1215, Bangladesh
5
Department of Animal Breeding and Genetics, Faculty of Veterinary Medicine and Animal Science, Bangabandhu Sheikh Mujibur Rahman Agricultural University, Gazipur 1706, Bangladesh
*
Author to whom correspondence should be addressed.
Sustainability 2023, 15(1), 85; https://doi.org/10.3390/su15010085
Submission received: 11 November 2022 / Revised: 8 December 2022 / Accepted: 13 December 2022 / Published: 21 December 2022
(This article belongs to the Section Air, Climate Change and Sustainability)

Abstract

:
Global warming has been increasing heat stress threat in animals, which can be monitored via the Temperature Humidity Index (THI). The present study describes the THI pattern and the relationship between THI and the production performances of dairy cows in a selected area of Bangladesh. The THI value was calculated using weather station data gathered over 35 years. Based on the THI pattern, January and June were identified as the coolest and hottest months, respectively. Consequently, the production performances of 10 crossbred cows with homogenous characteristics were monitored every January and June for a 5-year period. The average THIMEAN was found to be 17% higher in June when compared to January; with this increment of THIMEAN, average milk production was decreased by 24.4% (p < 0.05). The milk fat and protein content were also reduced (p < 0.05) by 14.5 and 15.2%, respectively, suggesting a negative correlation. However, ash content increased by 15.3%, which indicates a positive correlation. In addition, multiple regression analysis revealed that, with each point increase in THIMEAN and rectal temperature, there was a decrease in milk yield of 0.04 and 1.17 kg ECM, respectively. In contrary, each point increase in THIMEAN resulted in 0.059 °C increase of rectal temperature. Taken together, THIMEAN calculated using meteorological station data has a distinct relationship with the production performances of lactating crossbred dairy cows.

1. Introduction

Dairy cattle are an essential component of animal agriculture. Dairying is a very common income source in rural and peri-urban areas of Bangladesh. About 24.55 million cattle and 11.99 million tons per year of milk production was estimated during the fiscal year of 2020–2021 [1]. Of the total cattle population, about 6.0 million are dairy cattle, of which about 10–15% are crossbred cows and the remaining 85–90% indigenous [2]. Around 70% of Bangladesh’s dairy farmers are smallholders who produce 70–80% of the country’s total milk [3]. These smallholder dairy farmers rear their cattle by the semi-intensive system, where cattle are exposed to hot and humid environments for long periods. This affects the heat dissipation capacity of lactating cows and leads to heat stress. A number of physiological changes, such as elevated body temperature, respiratory rate, heart rate and rectal temperature, occur in the animal body due to heat stress. These changes adversely affect animal feed intake, production, and reproductive efficiency [4]. Consequently, cows develop many physiological mechanisms to cope with this stress. Heat-stressed cows may trigger their thermoregulatory system to cool down the body, which affects feed conversion efficiency and leads to reduced milk production [5]. Heat stress has a detrimental effect on milk quantity and quality during the early lactation stage, particularly the first 60 days of lactation. High-yielding breeds are reported to be more susceptible than low-yielding breeds [5]. Heat stress is a major economic burden in many milk-producing regions of the globe, especially in hot climates or during summer months, as it adversely affects performance and productivity of dairy cattle [6,7].
Climate plays a pivotal role in dairy cattle production. In recent decades, global warming, resulting in elevated temperatures, has become a threat for the planet, including live animals. Elevated temperatures have negative effects, such as thermal stress, on cattle. Understanding the adverse effect of heat stress and taking proper adaptation strategies is a major challenge. The severity of heat stress on dairy cattle can be quantified using a Temperature Humidity Index (THI). The THI is widely used to assess the effects of heat stress on dairy cows in hot regions around the world [8]. The ambient temperature and relative humidity of the environment are used to calculate THI. Various formula, combining different environmental factors, have been developed to measure the intensity of heat stress [9]. The data required to measure THI at the farm level-in particular, at smallholder dairy farms-are not available. However, meteorological data from nearby weather stations are easily accessible.
Weather stations record different climate variables, such as temperature, humidity, wind speed, dew point, precipitation, etc., at different time intervals and provide continuous data over several years [10]. These data could be used for calculating the THI, which, in turn, is useful to assess heat stress effects on dairy farms. The threshold THI level at which dairy cattle production is adversely affected has been identified using weather station data, and the proposed THI as an indicator of heat stress [11]. However, to the best of our knowledge, association between THI, calculated using publicly available meteorological records, and milk production has not yet been carried out in Bangladesh. Understanding of heat stress effects on milk production and gross milk composition using publicly available weather station data can provide an opportunity to develop future adaptation strategies against heat stress on dairy cattle performance. This will certainly increase milk production in Bangladesh, and farmers will benefit. Considering the above, the objective of this study was to predict the intensity of heat stress in terms of THI over a 35-year period, to investigate the changes in rectal temperature (RT), milk production and composition of dairy cows in relation to THI (estimated using meteorological data) in a selected area of Bangladesh over 5 years.

2. Materials and Methods

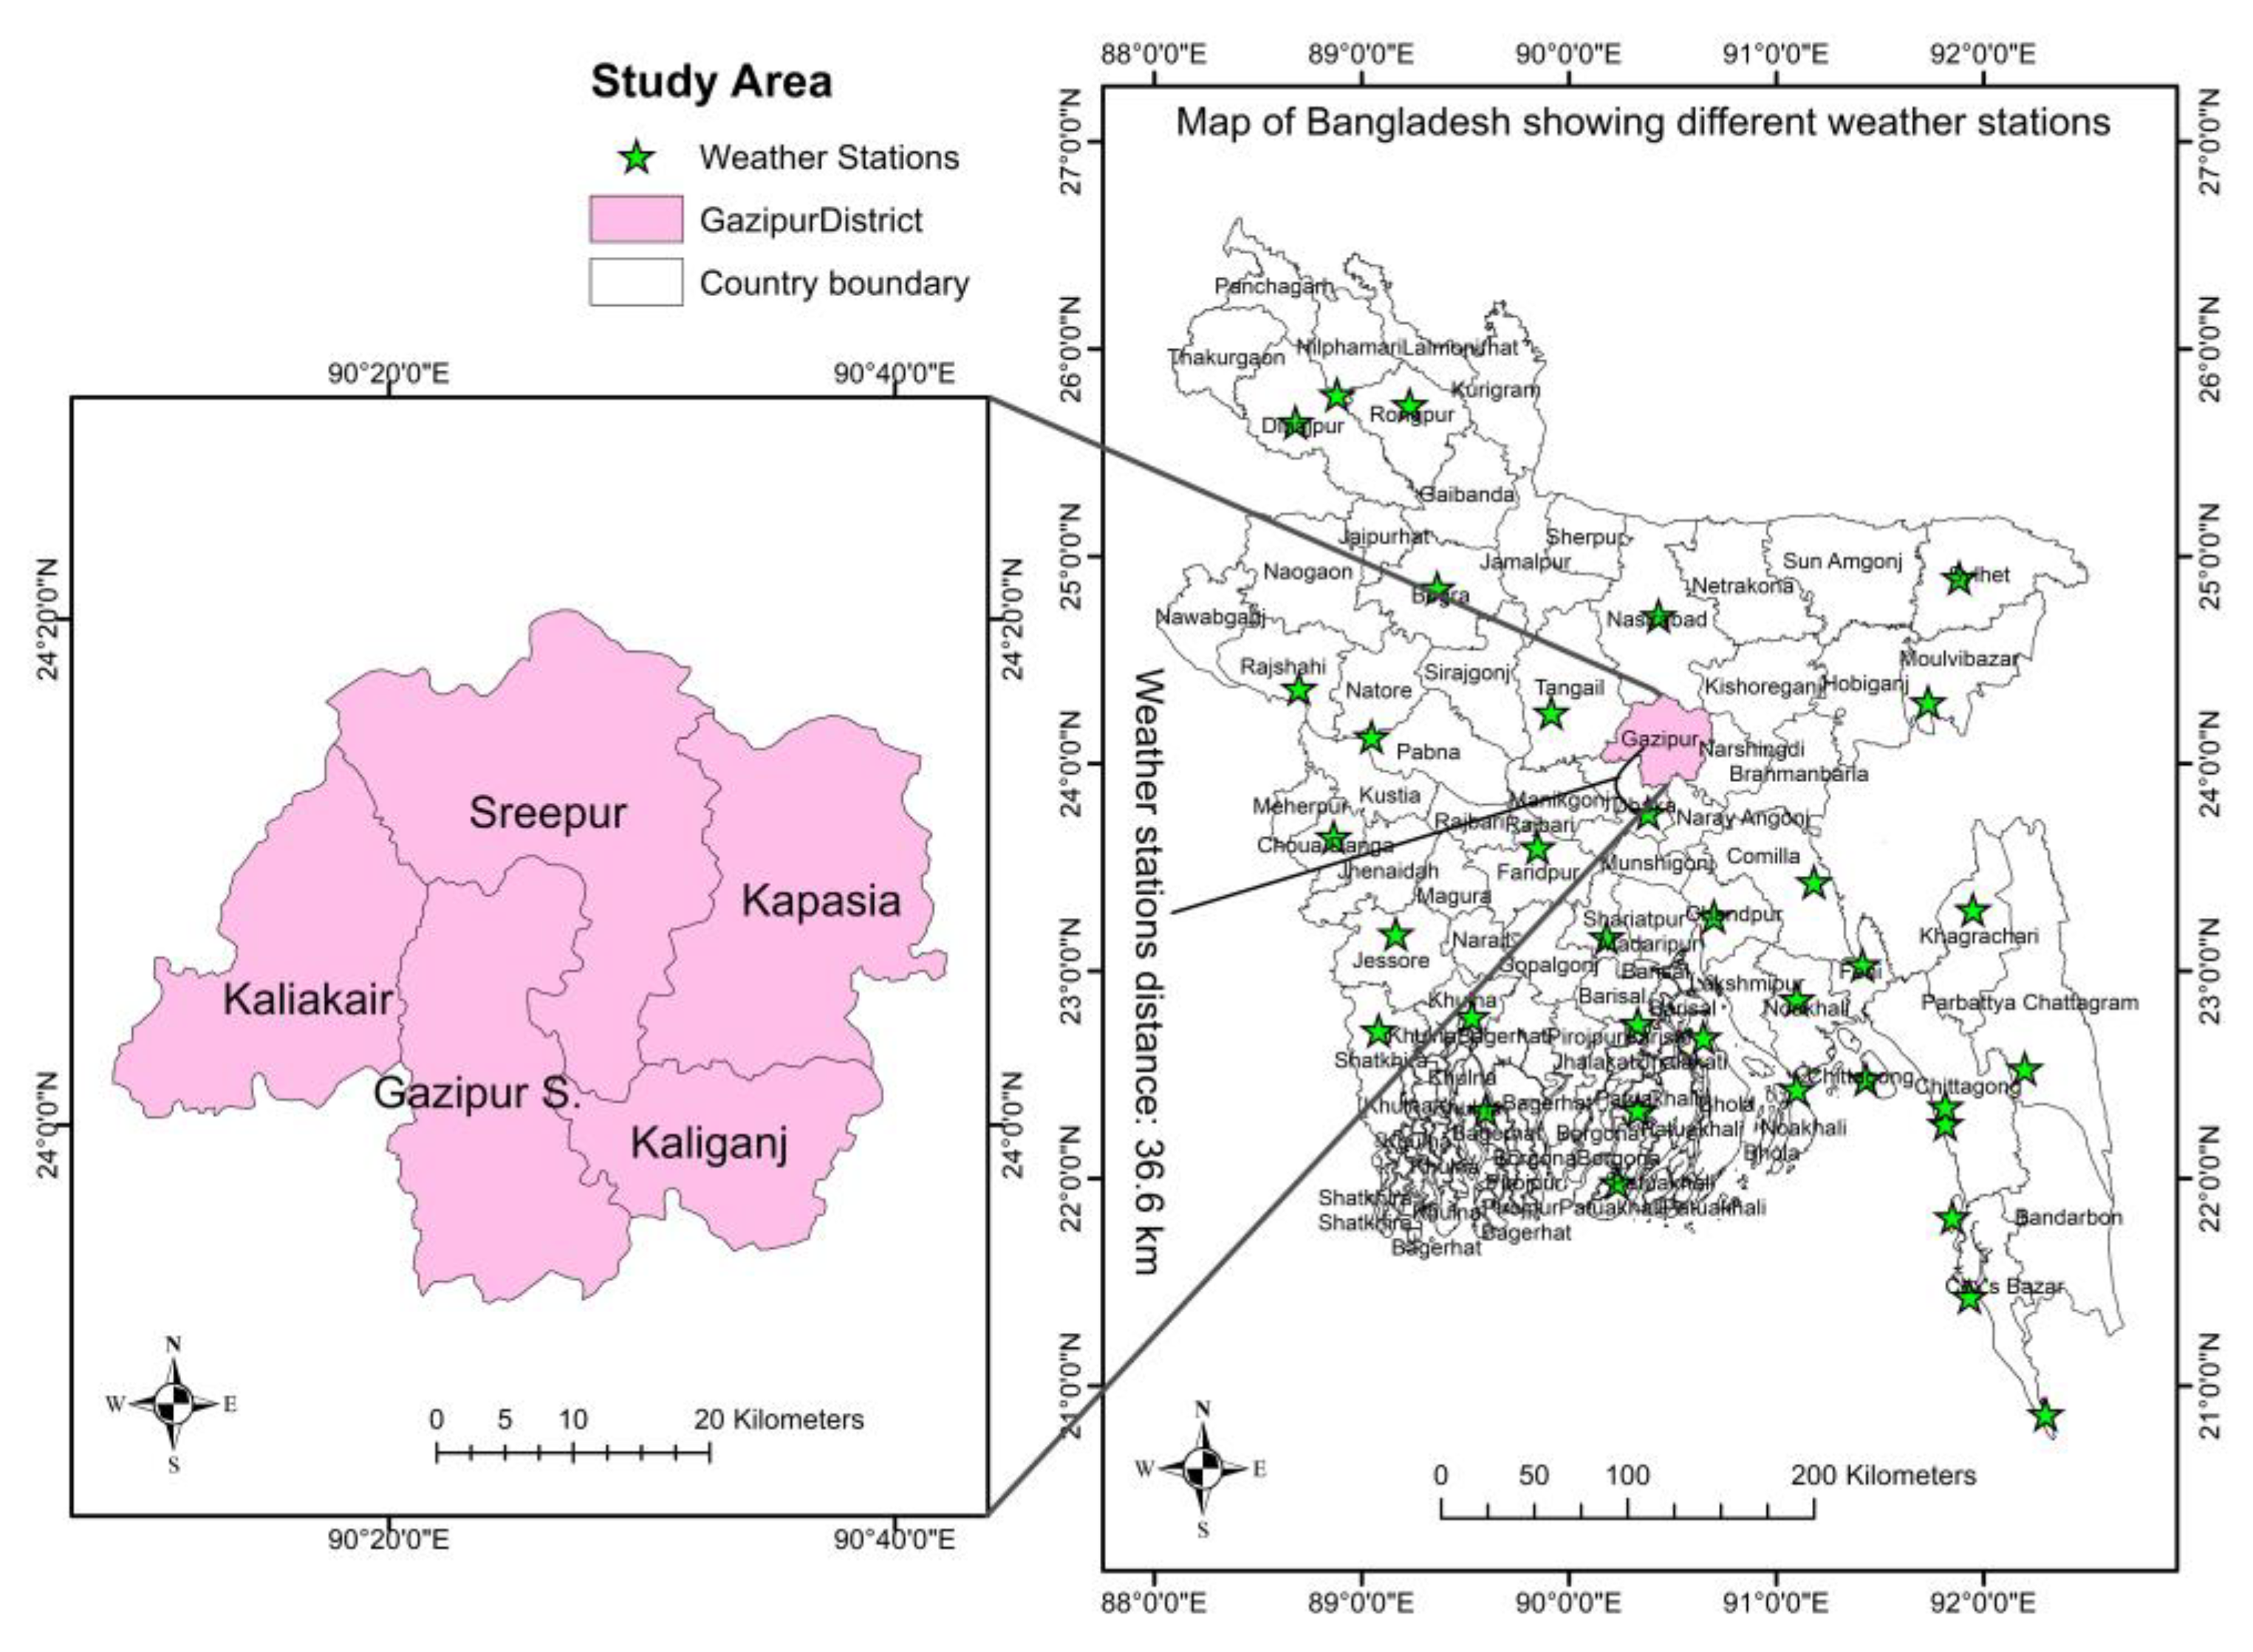
2.1. Study Area and Selection of Experimental Animals

The experiment was conducted in the hottest (June) and coolest (January) months of the Gazipur district (25°15′0.00″ N, 89°30′0.00″ E), as shown in Figure 1, over a period of 5 years (from 2016 to 2020). The Gazipur district is located at an elevation of 14 m above sea level. It has a tropical wet and dry or savanna climate. The district’s average yearly temperature is 28.95 °C, which is 1.2% higher than other Bangladesh averages. Gazipur typically receives about 71.24 mm of precipitation and has 115.47 rainy days (31.64% of the time) annually. At each time point of the experiment (January and June of each year), 10 crossbred dairy cows from smallholder dairy farmers (possessing 2 to 5 cows) were selected. To ensure the homogeneity among the experimental animals, there were three selection criteria, such as parity (2nd or 3rd), lactation stage (1.5 to 3.0 months after calving), and milk yield (average of 7–8 L/day). The information relevant to selection criteria were evaluated based on owners’ information and phenotypic characteristics. Thus, the total number of animals over the 5-year study period was 100.

2.2. Calculation of THI from Meteorological Data

Meteorological data (air temperature and relative humidity at 3-h intervals) from 1986 to 2020 were collected from the Bangladesh Metrological Department (BMD). Of the 35 BMD weather stations throughout the country, the closest weather station (Dhaka) is 36.6 km away from the study area (Figure 1). Based on the distance, the weather station located at Dhaka was preferable for calculating THI in the Gazipur district. Since the weather station records temperature and humidity data at 3-h intervals, the THI value at each recording point for the period of 35 years was first calculated. Then, the three categories of THI, THIMAX, THIMEAN and THIMIN were determined in consideration of the daily maximum, mean and minimum THI values generated from the 3-hourly recorded temperature and humidity data, respectively. All categories of THI were calculated using the formula from Kibler (cited in Yousef, [12]), where THI = (dry-bulb temperature) + (0.36 × dew point temperature) + 41.2 (temperatures in degrees Celsius). Dew point temperature (Td) was calculated using the following equation of dry-bulb temperature and the relative humidity:
Td = T 100 - RH 5
where T is dry-bulb temperature and RH is relative humidity.
The monthly average THIMAX, THIMEAN and THIMIN value of each year was calculated from the corresponding daily THI values. To identify the hottest and coolest month of the year, the monthly average THIMEAN values over the 35-year period was considered. Based on the outcomes, the periodic variation for the hottest and coolest month was examined, considering 3-hourly calculated THI values of each day over the period of 35 years.

2.3. Sampling Procedure and Chemical Analysis

From 2016 to 2020, 10 lactating dairy cows fulfilling the selection criteria were designated for recording of their milk yield, collection of milk and measurement of RT once in a week during the month of January and June throughout the entire study period. Generally, milking is performed twice a day (morning and afternoon) by the smallholder dairy farmers. Therefore, the milk yield from each individual cow was recorded in the morning and afternoon once a week. The milk yield was expressed as kg ECM (energy-corrected milk) using the formula ECM = (milk production × (0.383 × %fat + 0.242 × %protein + 0.7832)/3.1138, as developed by IFCN (International Farm Comparison Network). In order to analyze milk composition, individual milk samples (a daily composite sample from the morning and afternoon milking) were collected on the same day of milk yield recording. After collection, milk samples were immediately transported to the laboratory, maintaining cold chain and stored at 4 °C for the analysis of fat, protein and ash contents. Fat and protein content of milk samples were determined by the Gerber and Kjeldahl method, respectively, as per the procedure described by Aggarwala and Sharma [13]. Ash contents of milk samples were determined using the protocol described in AOAC [14]. The RT was measured at 12:00 H using a medical digital thermometer.

2.4. Statistical Analysis

The THI value was calculated by writing R language on RStudio platform (version 4.2.2). The THI values generated from the R platform were then inserted into an Excel sheet (Excel 2016, Microsoft, Redmond, Washington, DC, USA) and were analyzed with the add-in statistical package, as per the requirement of the study. The distribution of THI value and skewness through displaying quartiles, median and mean were visualized by constructing a boxplot. The correlation between variables and t test were also performed. All significance tests were two-tailed, and p < 0.05 was considered significant.
Multiple linear regression is a powerful tool to estimate the relationship between two or more independent variables and one dependent variable. The following multiple regression, from which was specified in linear function and used to fit the regression between milk production (MP), RT and THIMEAN by ordinary least squares method. The assumption of multiple regression was fulfilled to estimate the unbiased parameters of the regression. The multiple regression was as follows:
Model   1 :   M P T t = β 1 + β 2 R T T t + β 3 T H I T t
where, β 1 = intercept, β 2 ,   β 3 = coefficient for R T T t and T H I T t , respectively, and T is the number of treatment and t is time period.
Similarly simple linear regression was applied to fit the regression between RT and THIMEAN as below:
Model   2 :   R T t = β 1 + β 2 T H I t
where, β 1 = intercept, β 2 = coefficient for T H I t and t is time period.

3. Results

3.1. Profile of Selected Animals

The genotype and phenotype distribution of the 100 crossbred dairy cows selected for the entire study has been shown in Table 1. Most of the selected animals were in 3rd parity (57%). The average milk production and lactation stage was 7.6 ± 0.3 L per cow and 53.9 ± 2.3 days, respectively. The selected animals were comprised six genotypes. The highest percentage (45%) belonged to 1/2 Holstein-Friesian (HF) 1/2 Local, followed by 3/4 Jersey 1/4 Local (20%), 3/4 HF 1/4 Local (15%), 1/2 HF 1/2 Sindhi (10%), 3/4 Shahiwal 1/4 Local (5%). Genotypes of only 5% of animals were unknown (5%). All the experimental cows were under the subsistence farming system.

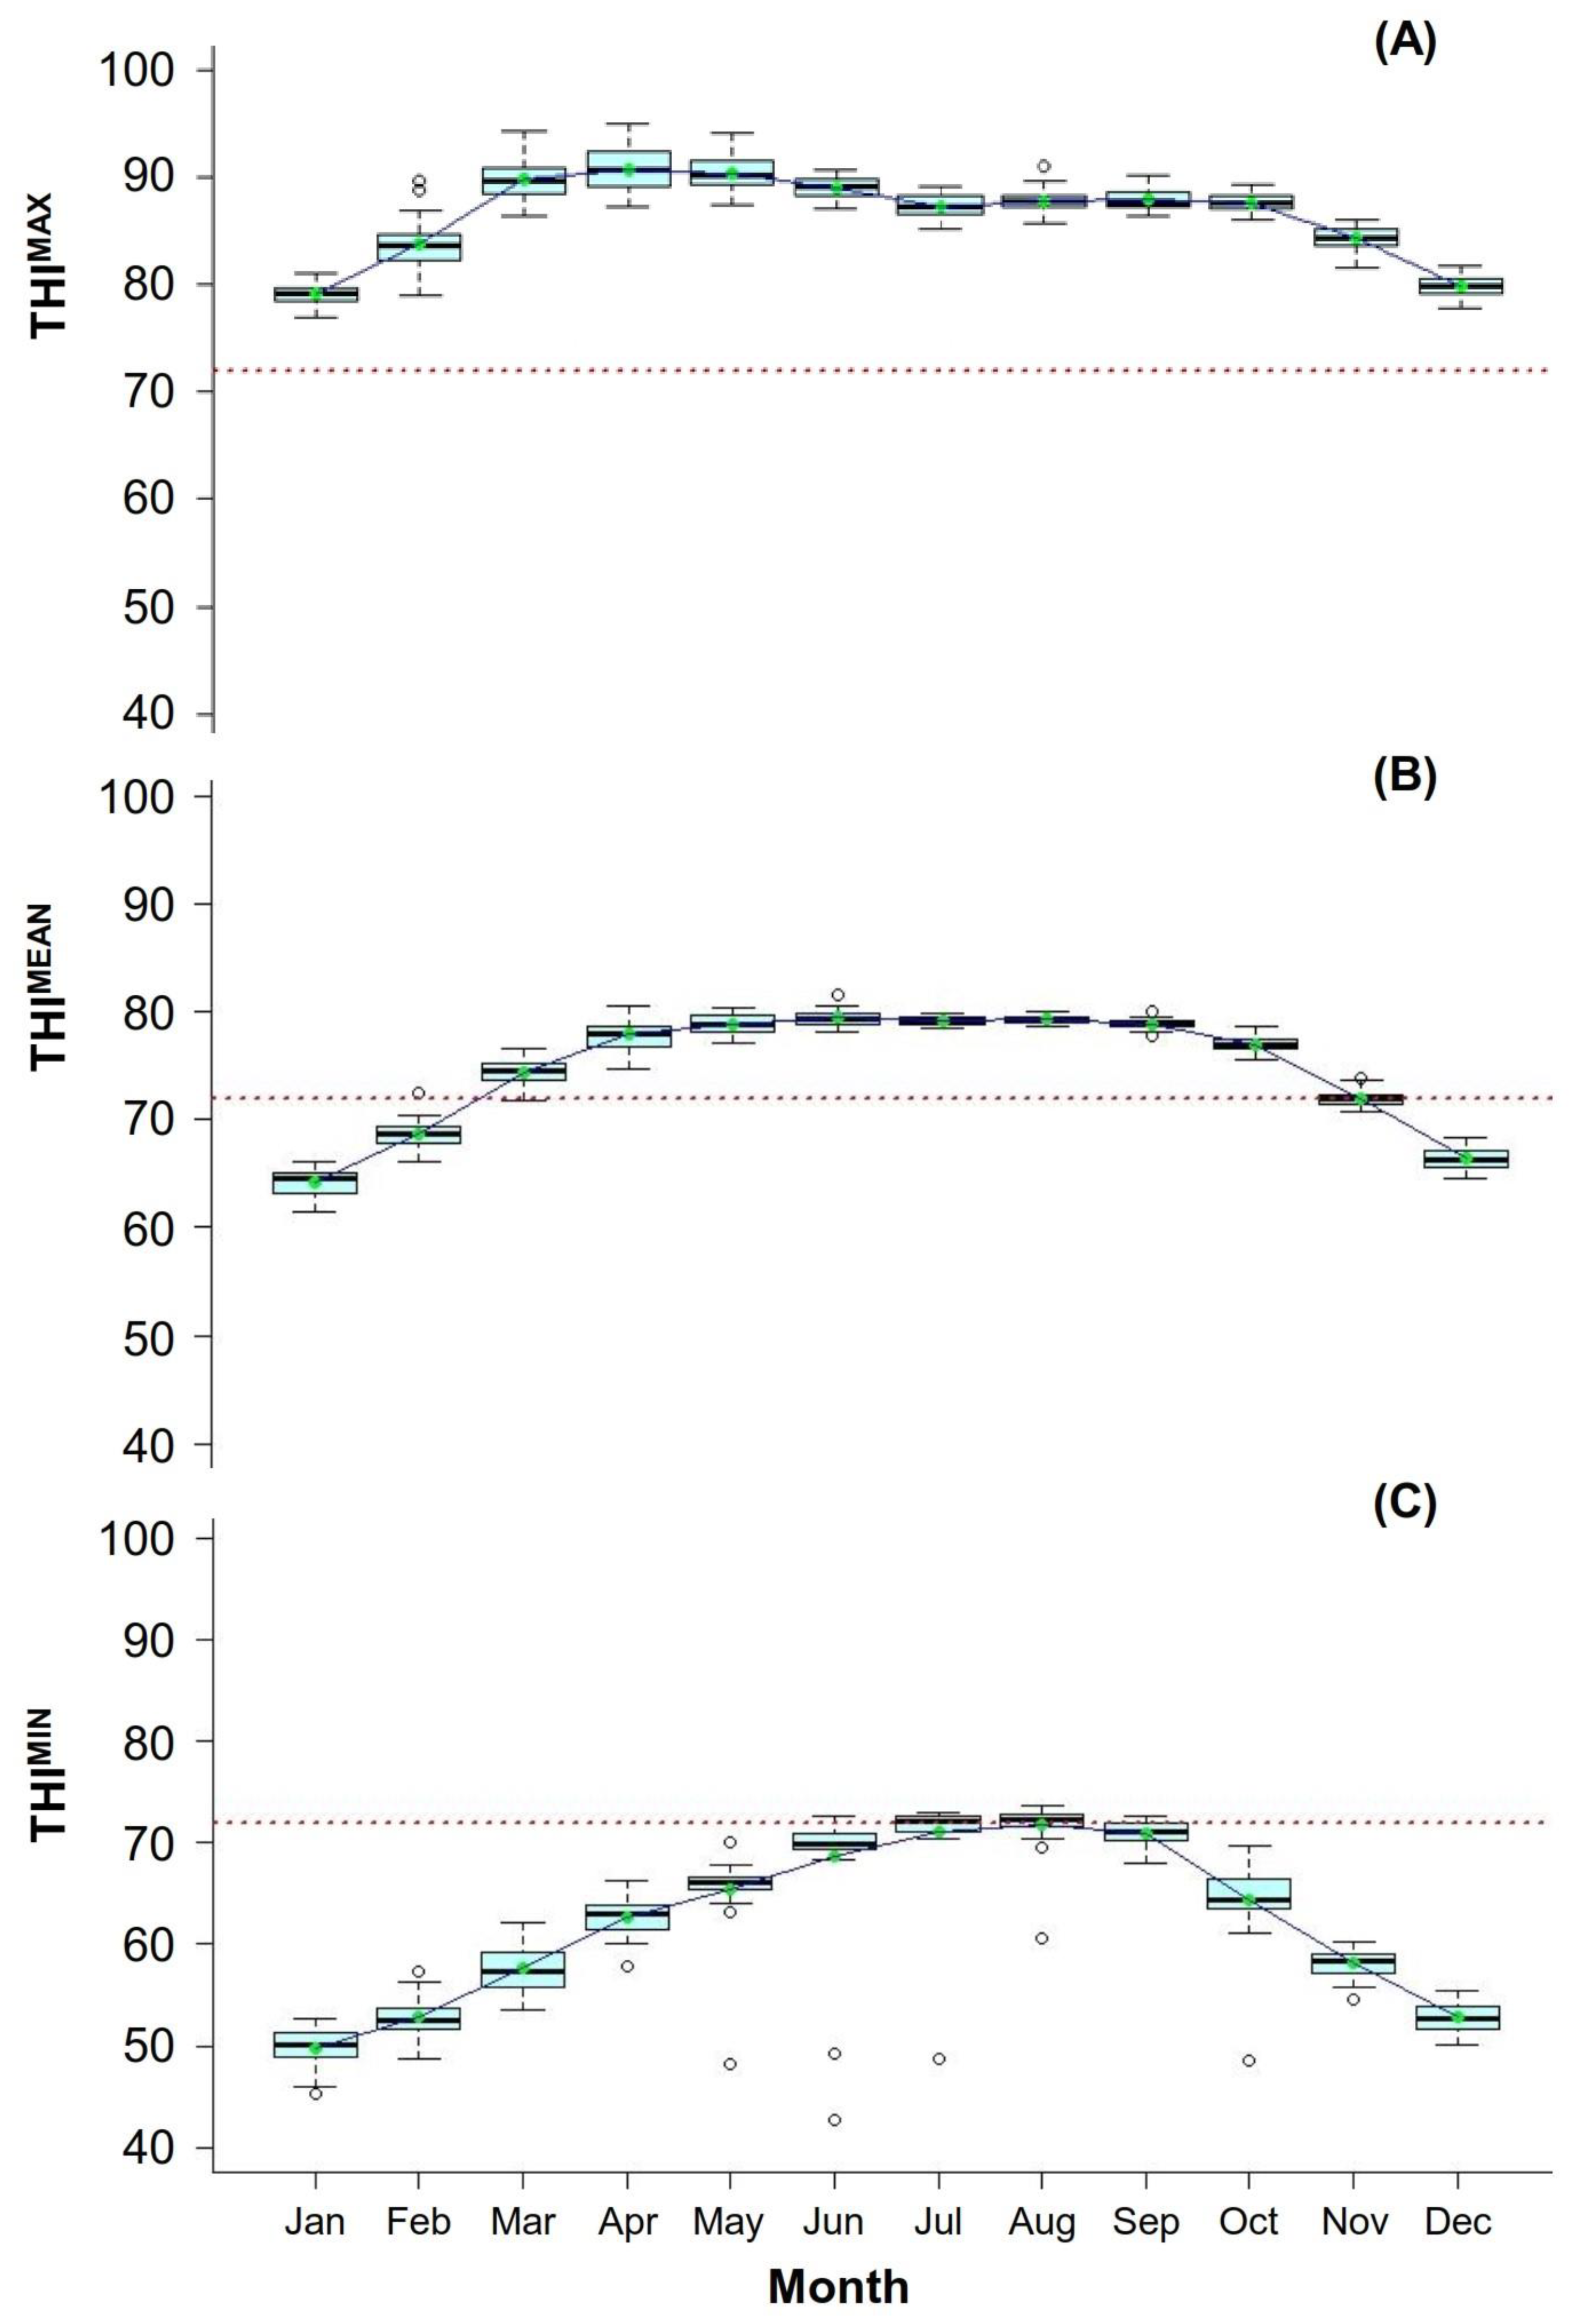
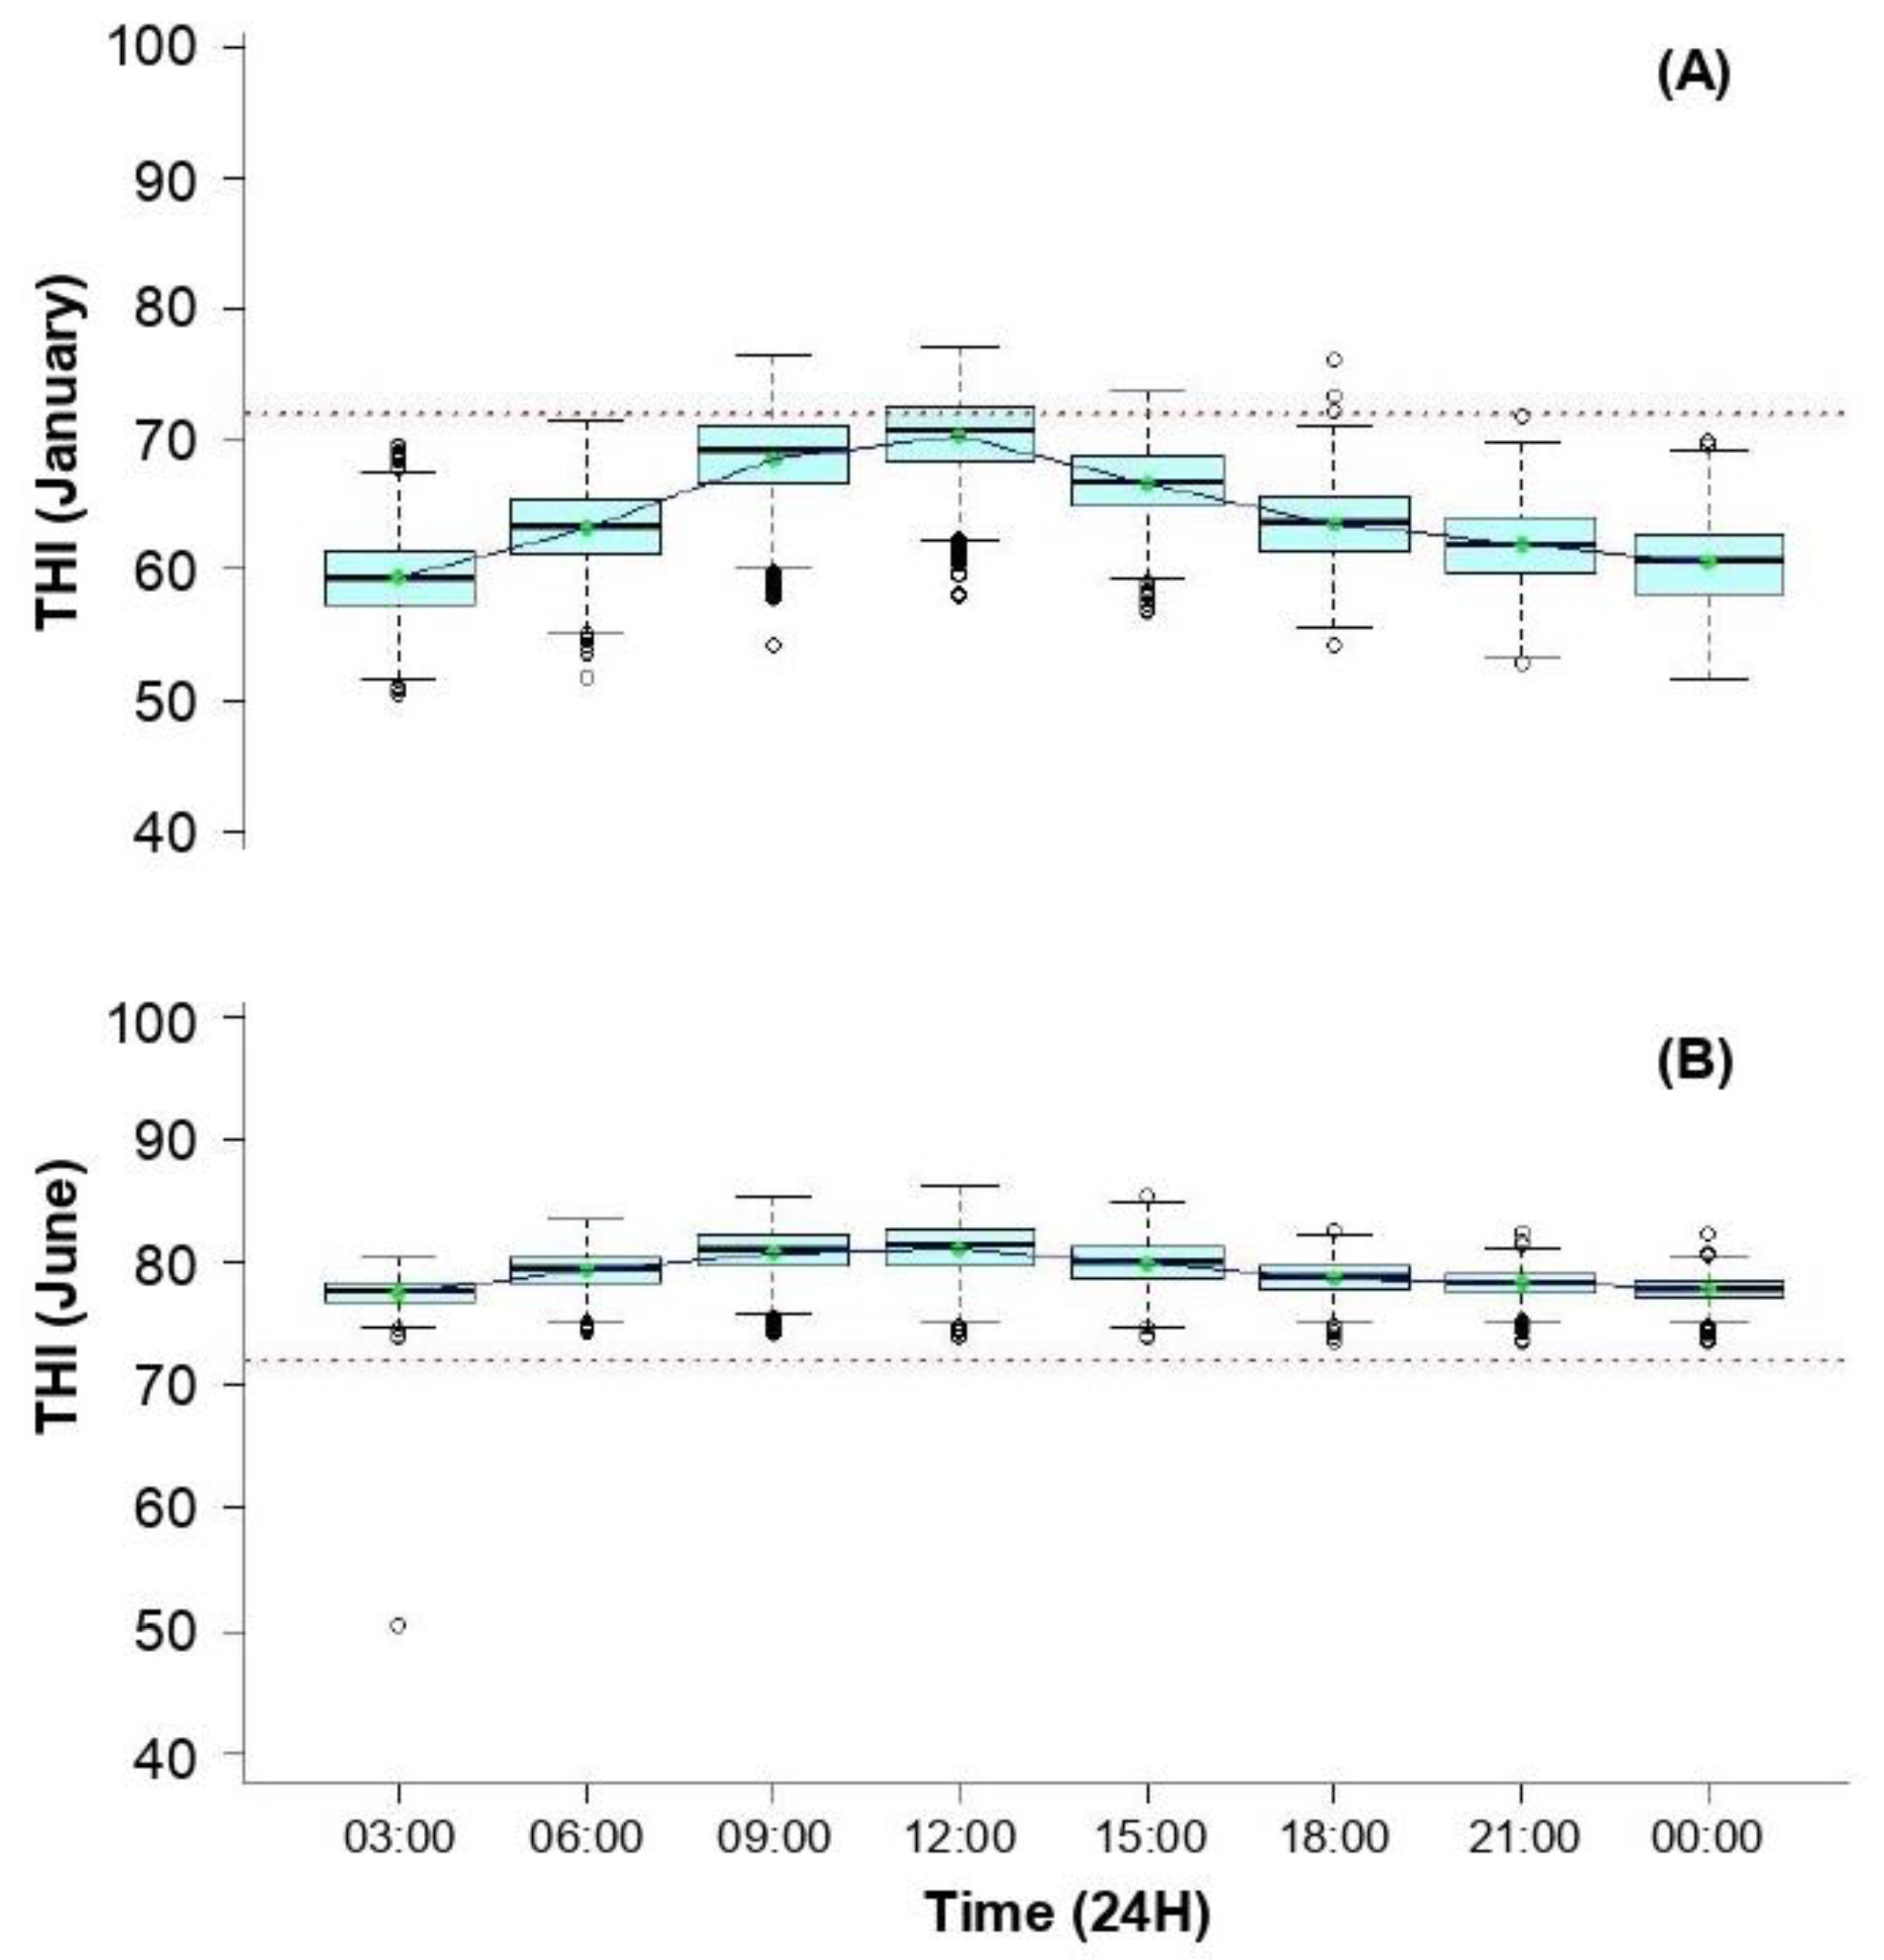
3.2. Temporal and Periodic Variations of THI

The dynamics of three categories of THI values, THIMAX, THIMEAN and THIMIN, in different months over a period of 35 years (1986–2020) has been shown in Figure 2. The majority of researchers indicate 72 as the upper critical THI value for dairy cattle [8,9,15]. In the present study, dairy cows are predicted to face severe heat stress throughout the year when THIMAX was considered. The THIMAX values of each month exceeded the upper critical THI value, ranging from 76.97 to 94.97. However, the highest THIMAX value was observed in the months of March, April and May, with a range from 86.48 to 94.97 (Figure 2A). In contrary, the THIMEAN values during the months of April to October surpassed the upper critical THI value, with a range of 74.65 to 81.52. As shown in Figure 2B, THIMEAN values in the months of June, July and August was very close, which leads to comparison of the average THIMEAN value of these months. The average THIMEAN value in the months of June, July and August was 79.47 ± 0.73, 79.16 ± 0.36 and 79.34 ± 0.36, respectively. In addition, the THIMEAN value ranged from 78.17 to 81.52 in June, 78.53 to 79.95 in July and 78.61 to 80.03 in August. Thus, the month June was identified as the hottest month in terms of THIMEAN value. Analogously, the average THIMEAN value in the month of January and December was 64.24 ± 1.16 and 66.44 ± 0.95, respectively, which suggests that January is the coolest month (Figure 2C). As expected, dairy cows are supposed to be in comfort zone throughout the year in which THIMIN values were considered. The THIMIN values of each month ranged from 42.66 to 73.61. The highest (71.71 ± 2.28) and lowest (49.68 ± 2.06) average THIMIN value was observed in the month of August and January, respectively (Figure 2C).
The periodic variation of the hottest (June) and coolest (January) month for the 35-year period has been portrayed in Figure 3. During the month of January, the highest (70.23 ± 3.26) average THI value was observed at 12:00 H and the lowest value (59.38 ± 3.15) was at 03:00 H (Figure 3A). The difference of THI value between these two time points was 10.85, indicating that dairy cows get the opportunity to dissipate heat from the body. In contrary, during the month of June, the highest (81.05 ± 2.30) average THI value was observed at 12:00 H and the lowest value (77.49 ± 1.38) at 03:00 H (Figure 3B). The difference in THI value between these two time points was very low (3.56), suggesting that dairy cows do not have enough space for heat dissipation. It is noteworthy that the highest THI values were always observed at 12:00 H in both January and June, suggesting a critical time period for dairy cows in the study area.

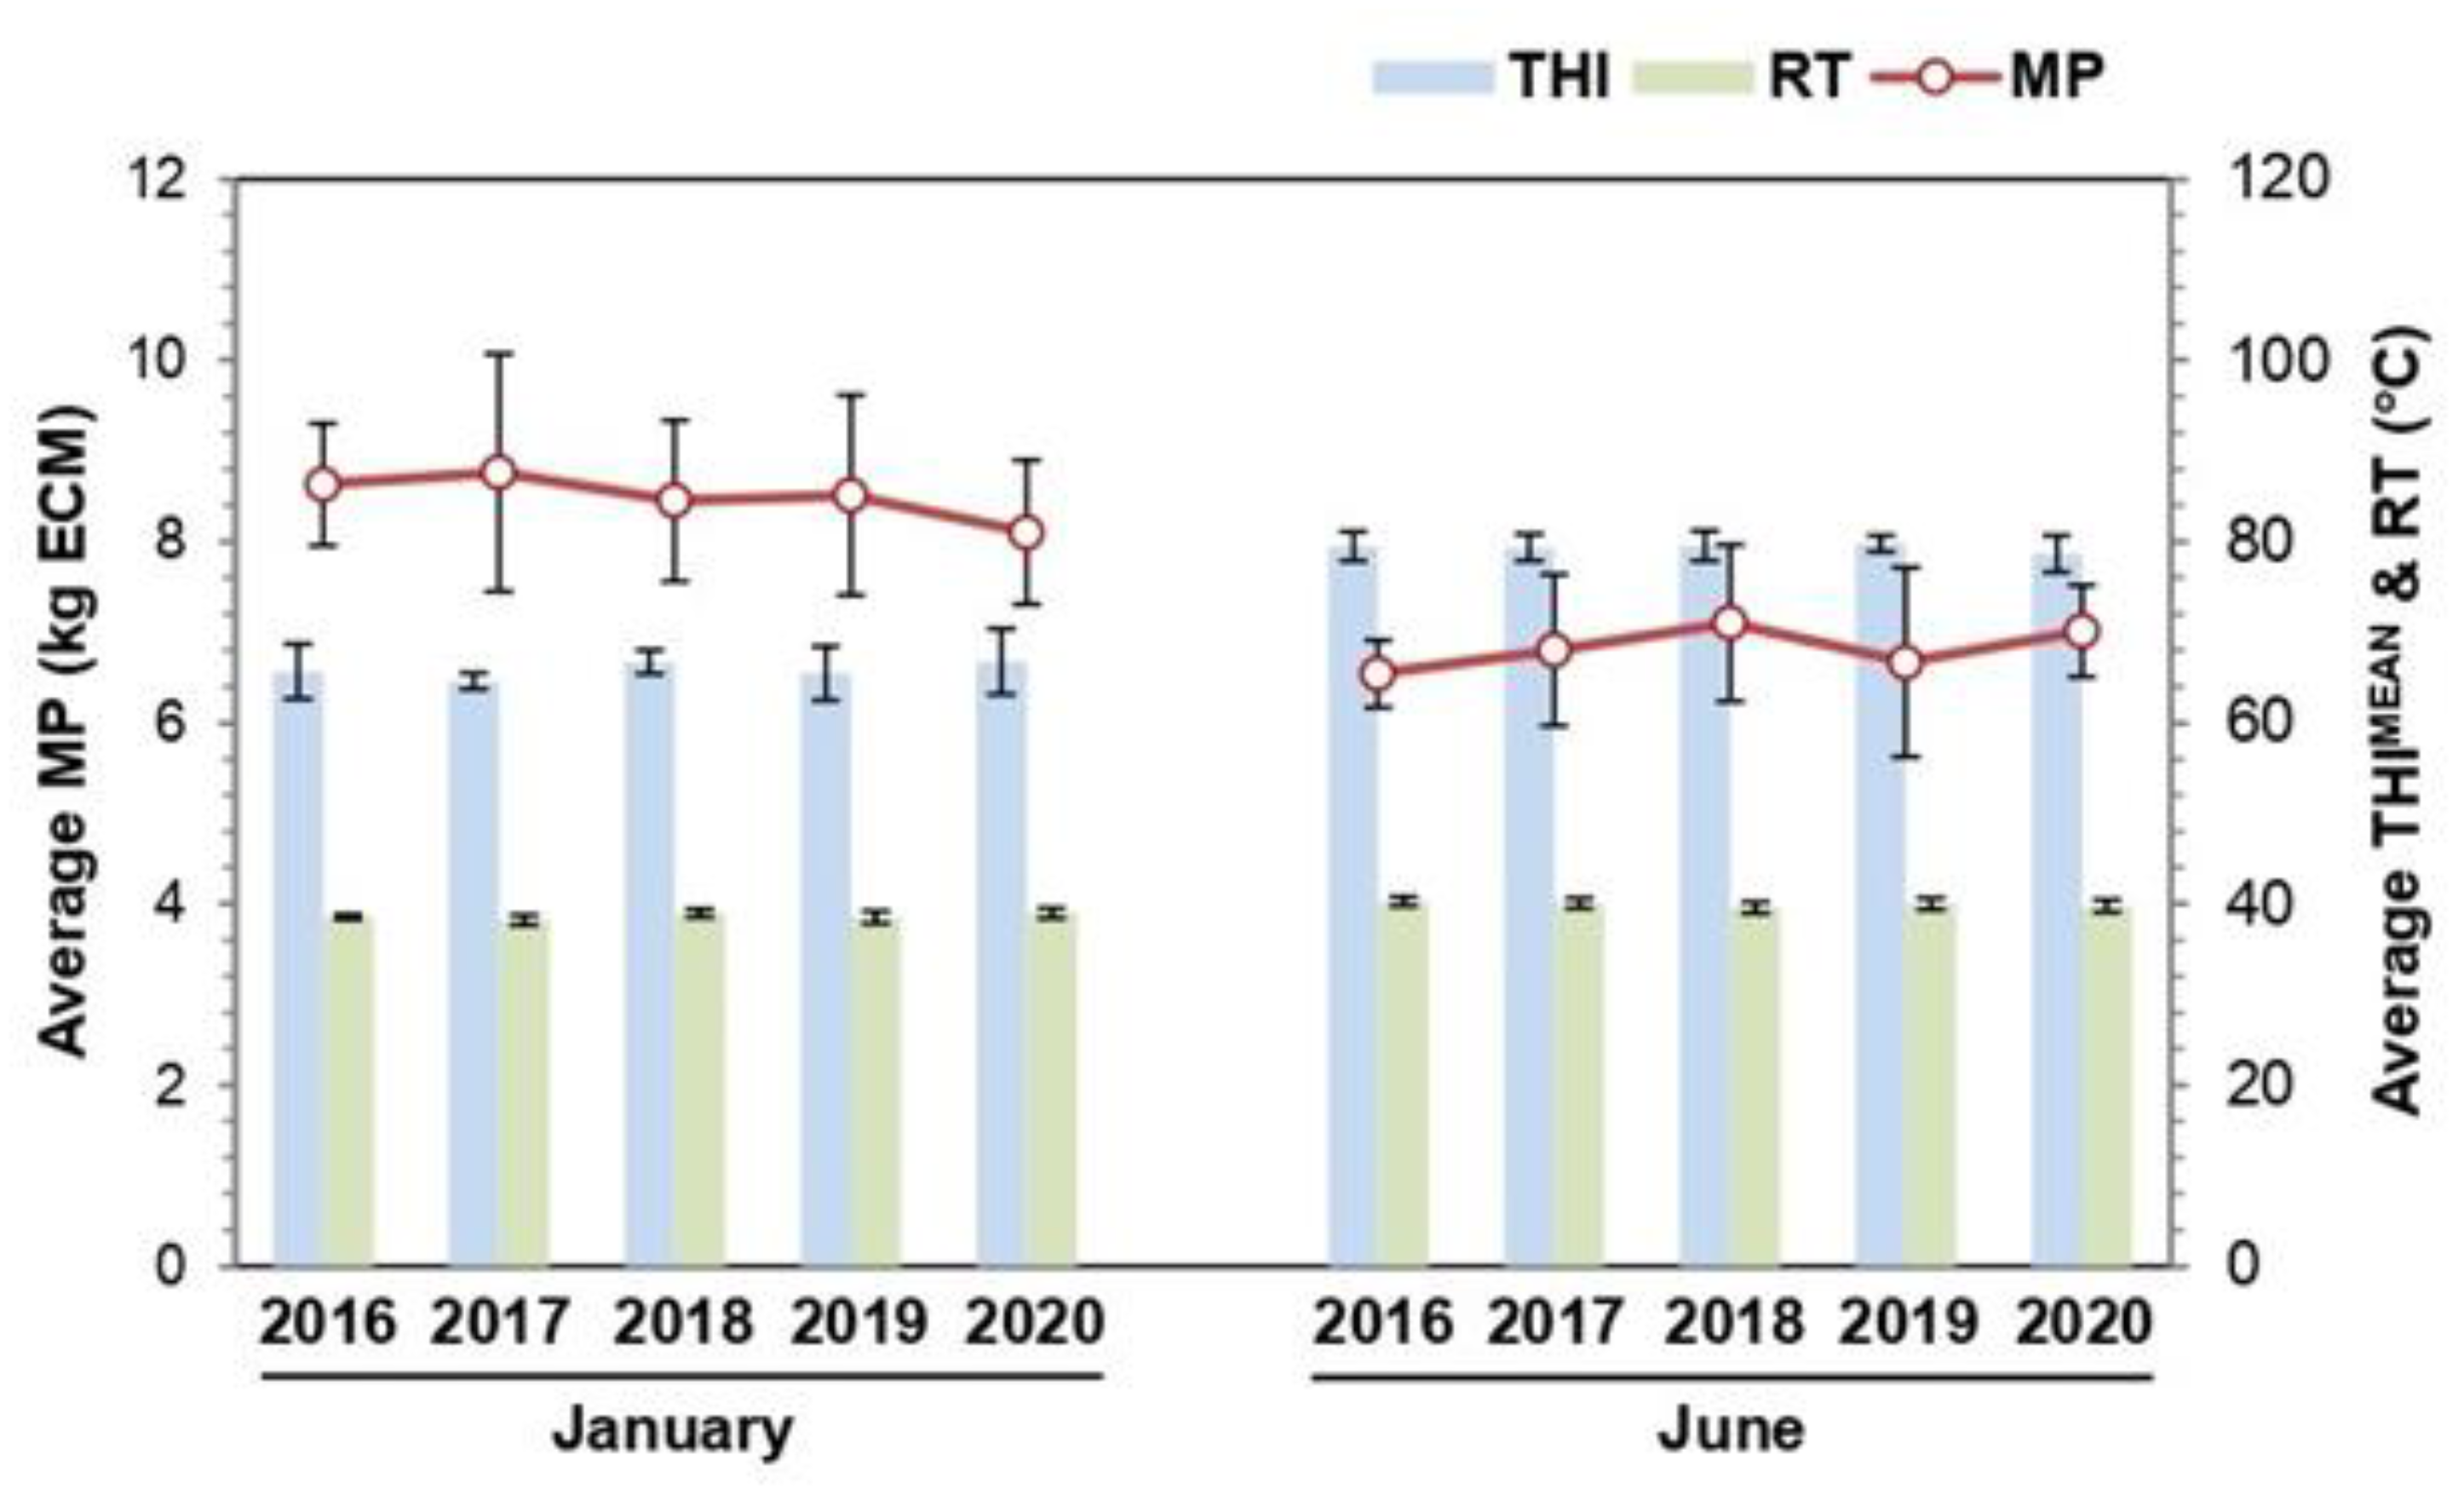
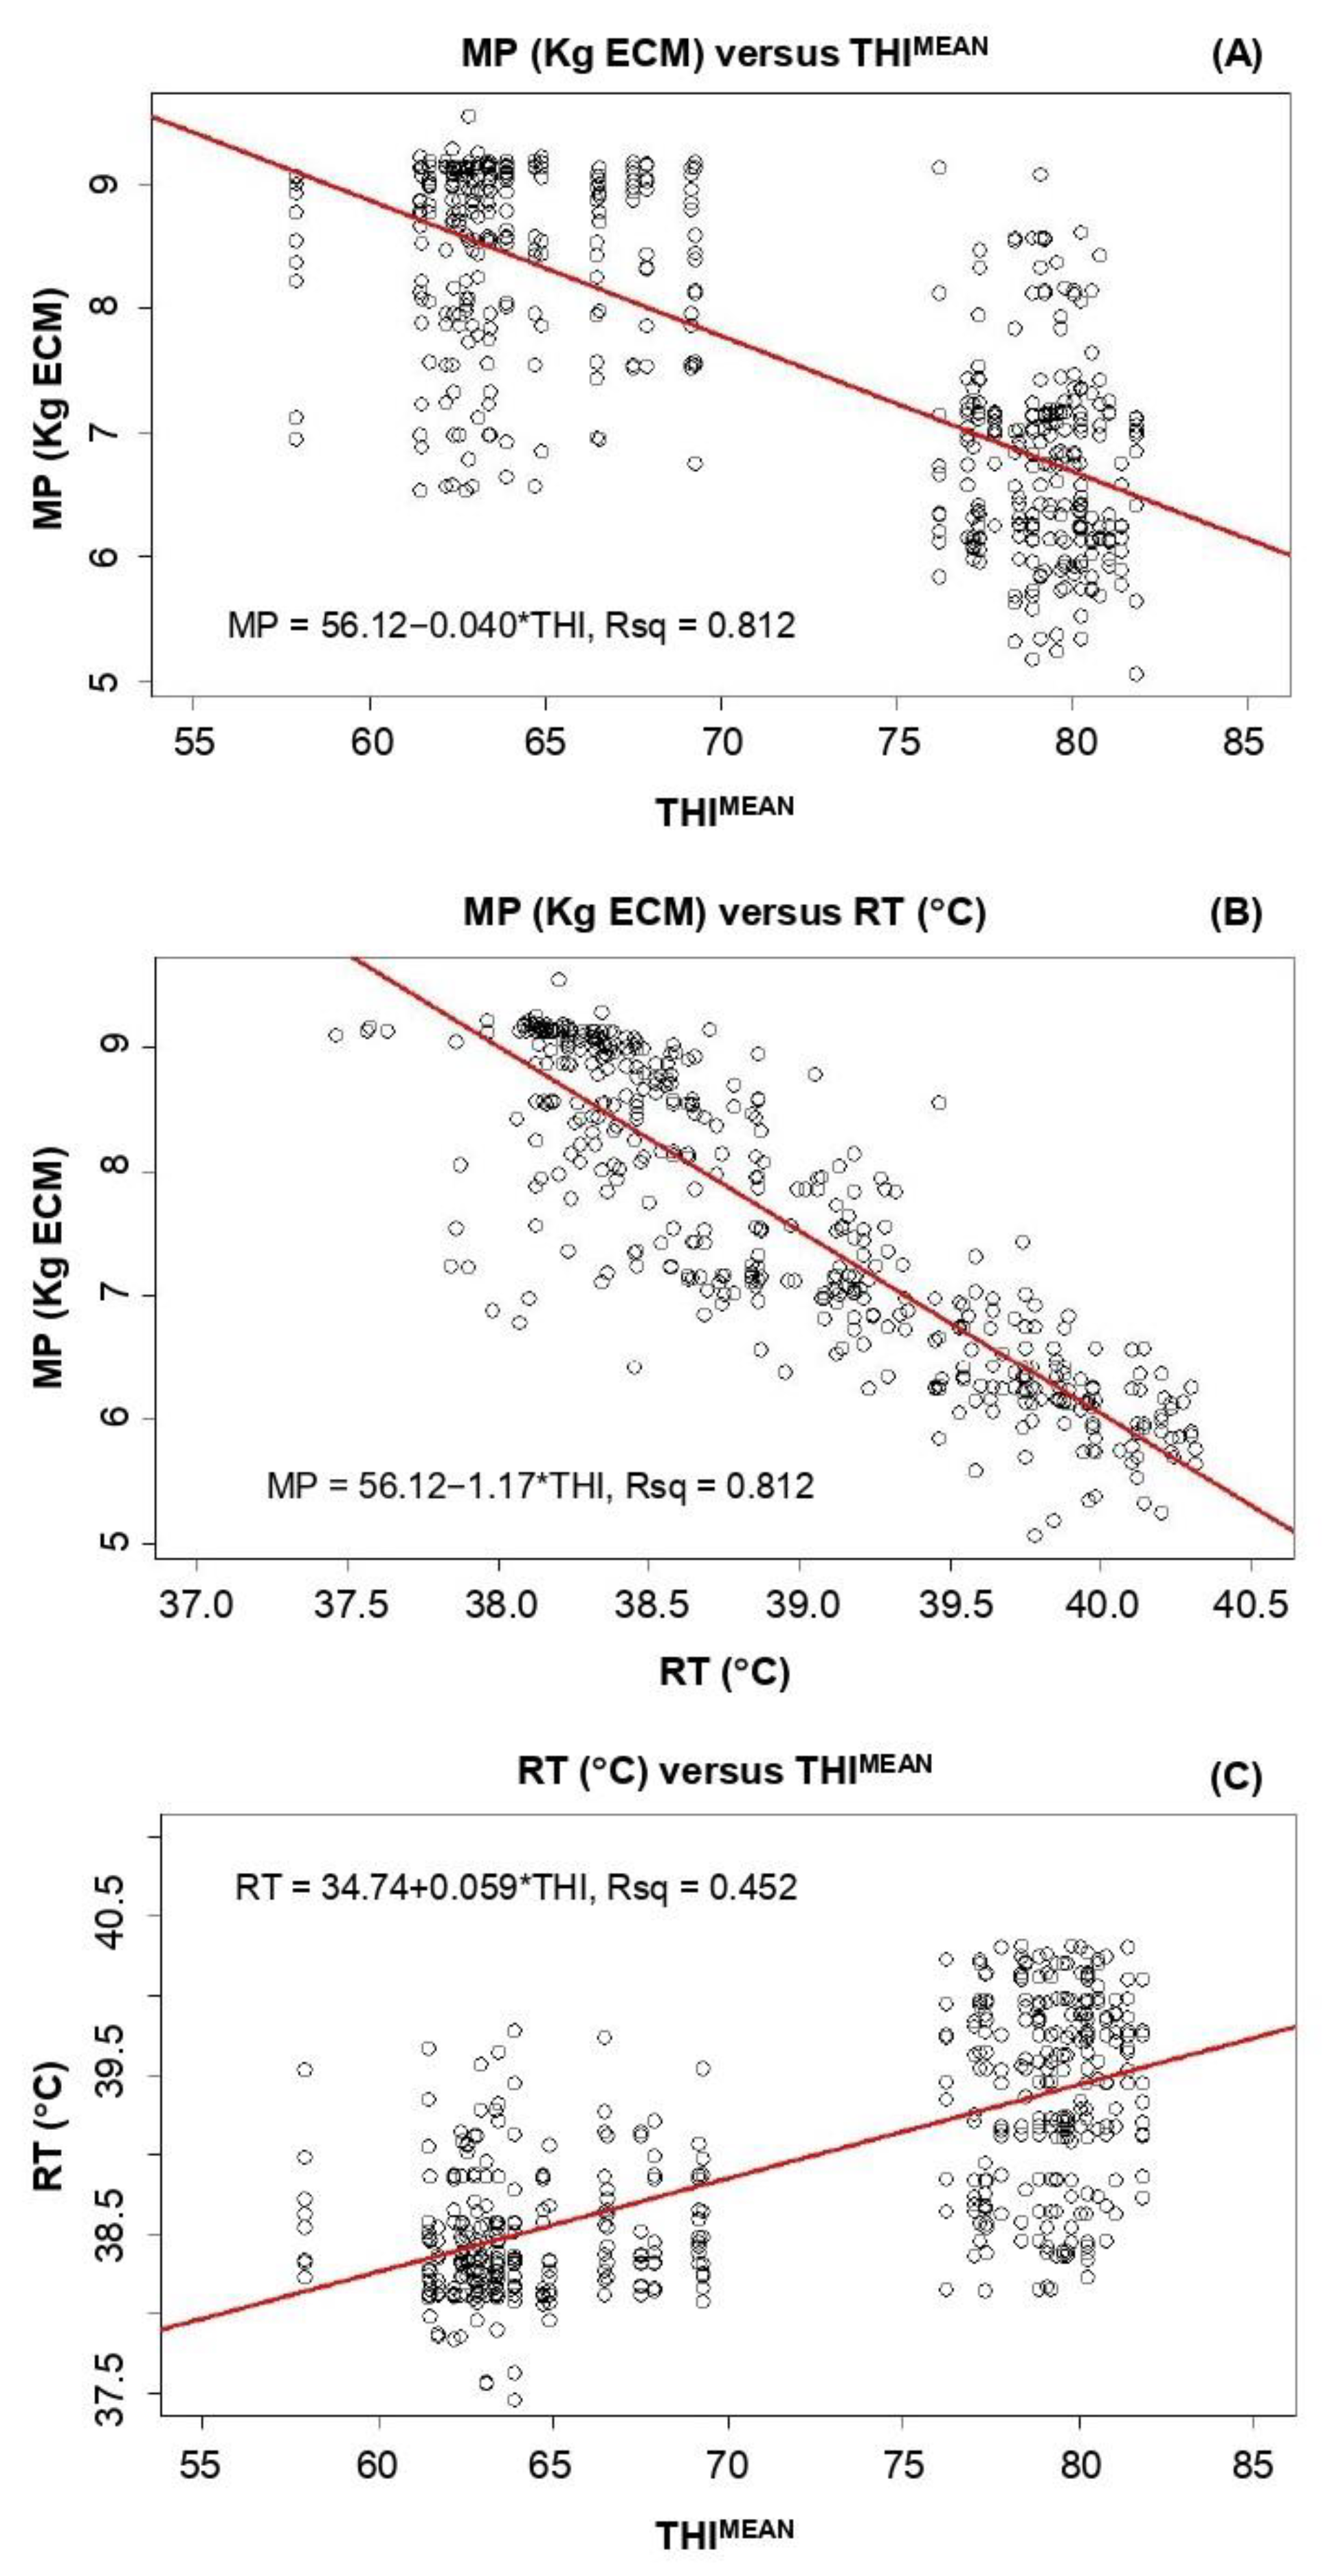
3.3. Relationship of THI with Milk Production and Rectal Temperature

The relation between THIMEAN, milk production and rectal temperature of crossbred dairy cattle in the month of January and June from 2016 to 2020 was demonstrated in Figure 4. During the 5-year period, the average THIMEAN value was 17% (0.83 times) higher in June (79.3) than in January (65.8). With the increase of THIMEAN value, average milk production/cow/day was decreased 1.2-fold, corresponding to 24.4% in the month of June (6.8 kg ECM) when compared to January (8.5 kg ECM). In contrary, the average rectal temperature was 3.3% (0.97 times) higher in June (40 °C) than in January (38.7 °C), suggesting rectal temperature is upregulated with the increase of THIMEAN (Figure 4). It is noteworthy that the relationship trend among THIMEAN, milk production and RT was almost similar in the month of January and June during the 5-year study period. The data clearly suggest that THIMEAN has a positive relationship with RT, but a negative relationship with milk production.

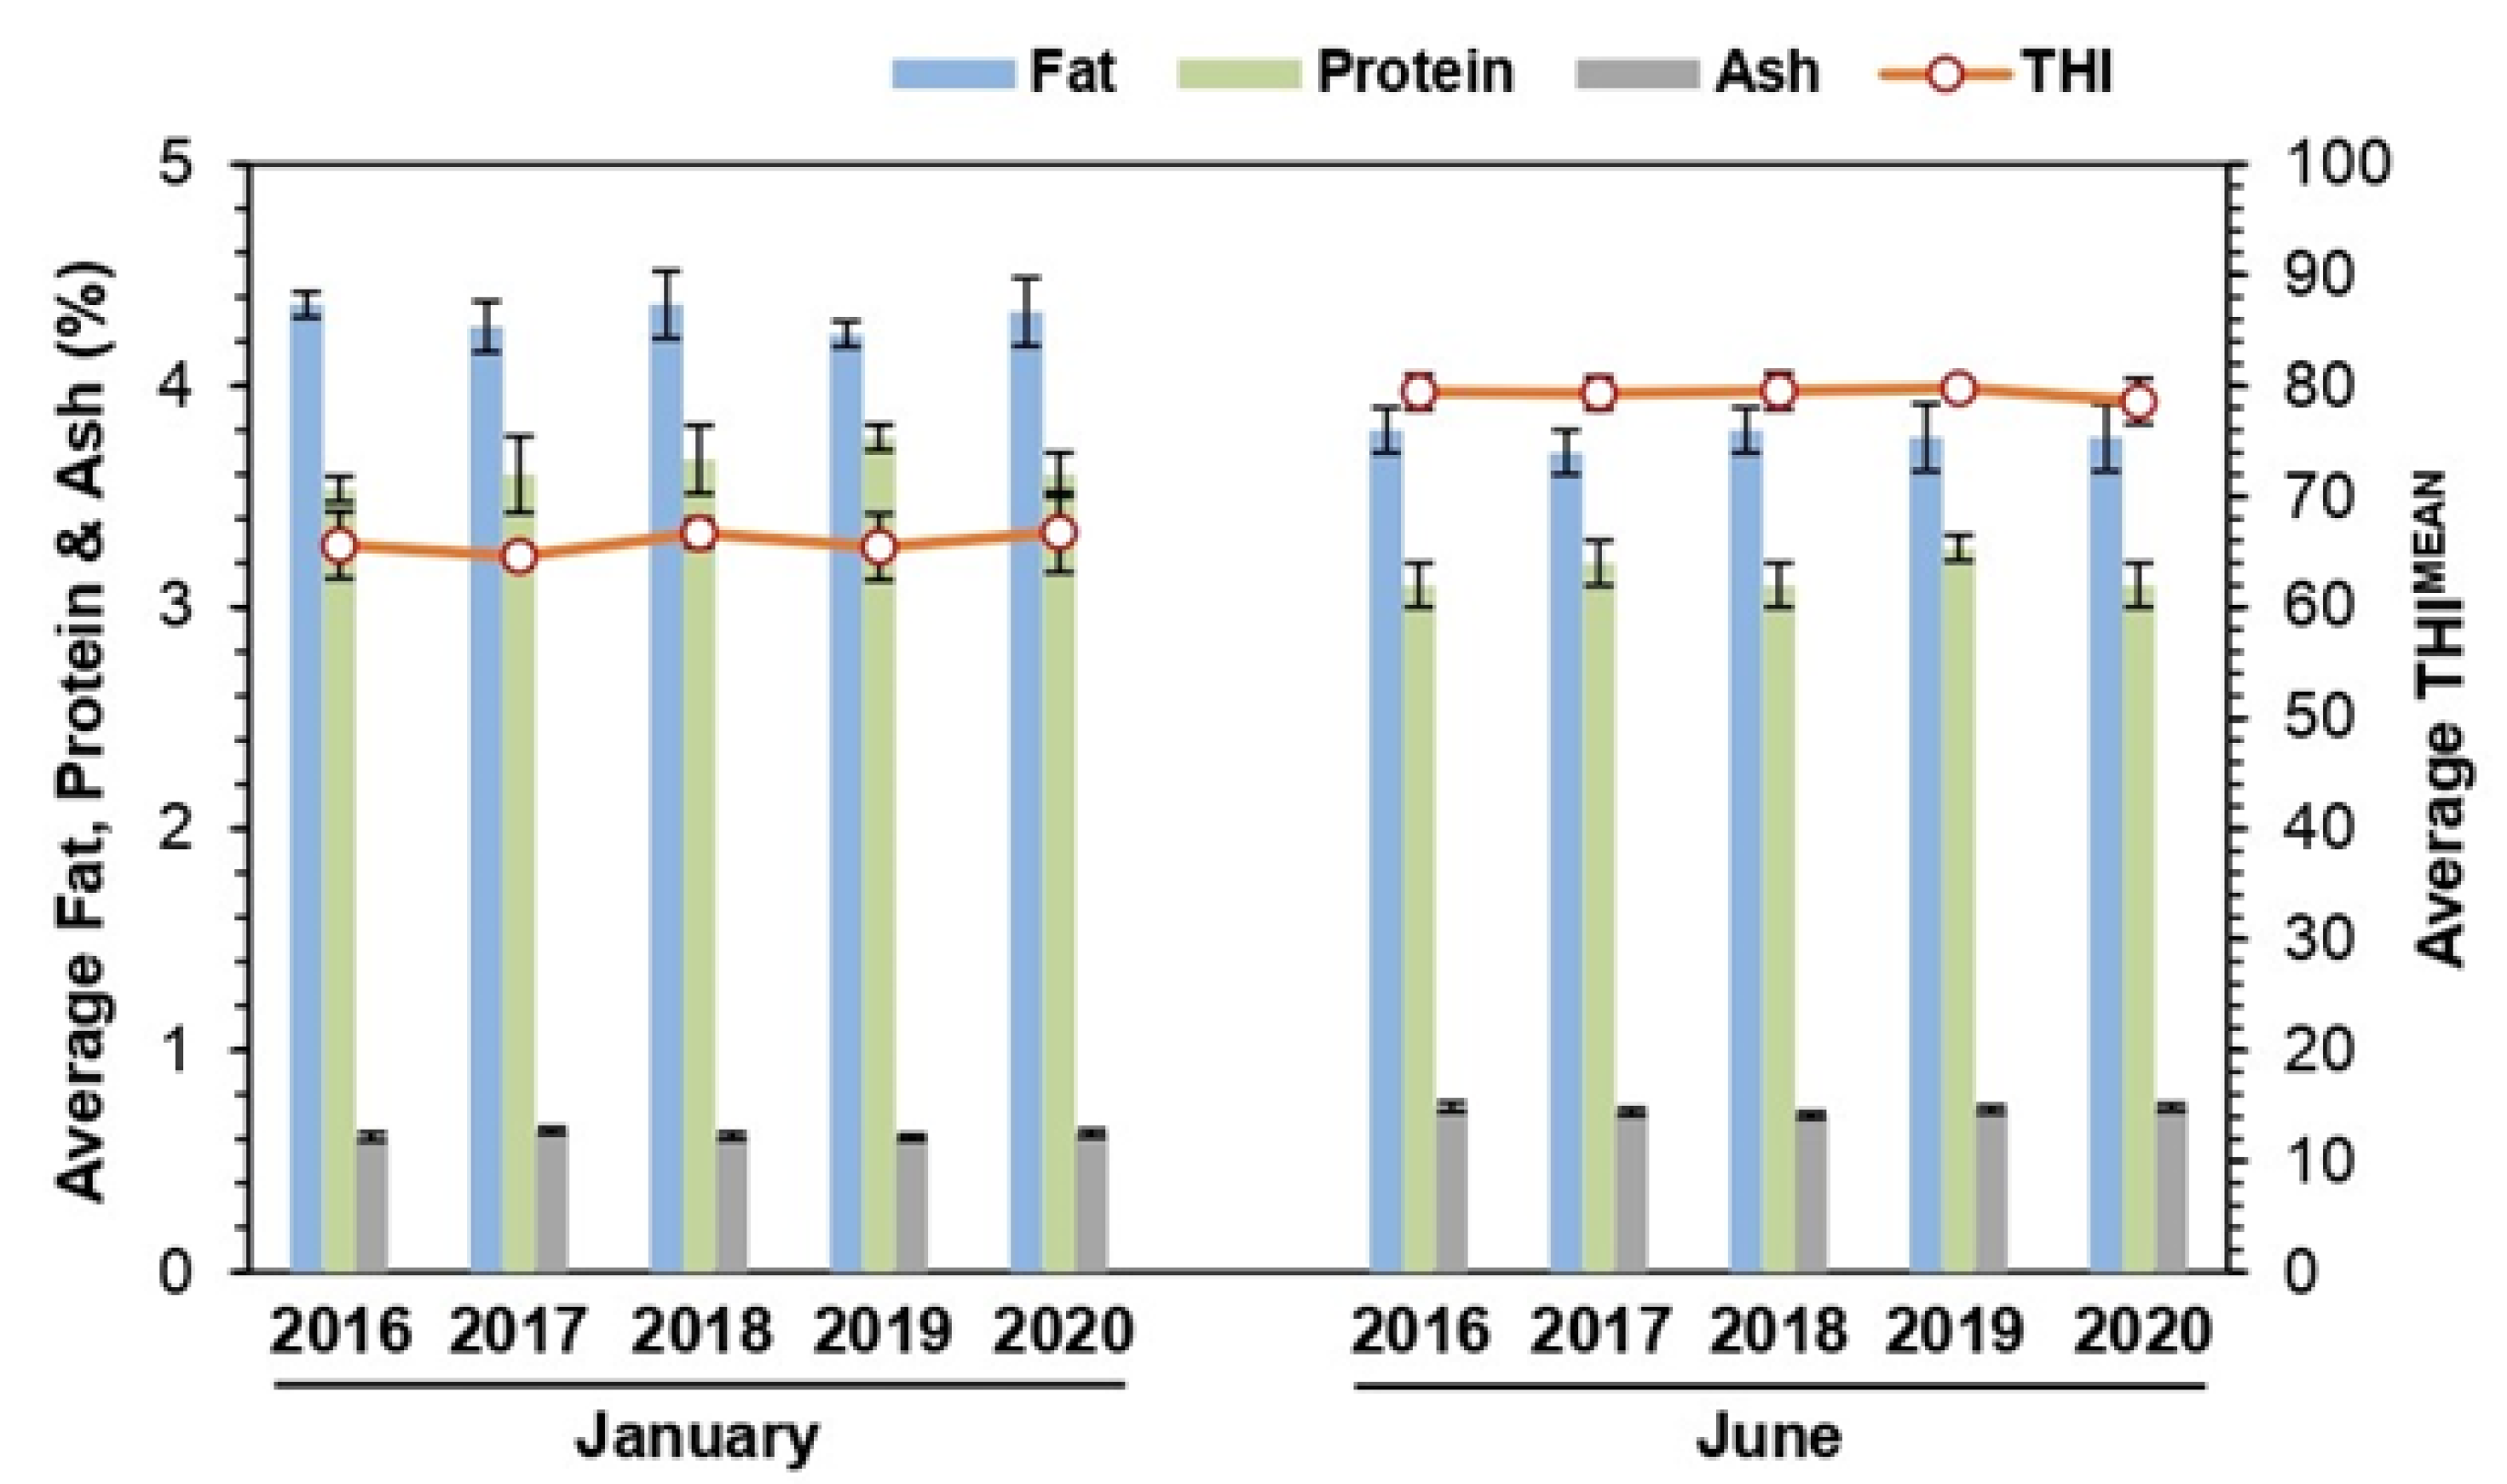
3.4. Relationship of THI with Milk Composition

The gross composition of milk (fat, protein, and ash) and their association with THIMEAN value for the 5-year study period has been depicted in Figure 5. The average percentage of fat, protein, and ash content in milk collected during the entire study period were 4.3, 3.6 and 0.6 in January and 3.8, 3.2 and 0.7 in June, respectively, representing a reduction of 14.5% fat and 15.2% protein, and the increment of 15.3% ash content. The changes of fat, protein, and ash content of milk with the shifting of THIMEAN value between the hottest (June) and coolest month (January) was found to be statistically significant (p < 0.05).

3.5. Multiple Regression Analysis among Milk Production, Rectal Temperature and THI

The regression correlation among THIMEAN, milk production and RT of dairy cows is illustrated in Figure 6. The regression indicates that, for each point increase in THIMEAN and RT, there was a decrease in milk yield of 0.04 and 1.17 kg ECM, respectively. The regressions of milk yield on THIMEAN and RT were significant (p < 0.01), with an Rsq value of 0.812 (Figure 6A,B). The regression also indicates that, for each point increase in THIMEAN, there was an increase in RT. The value of this relationship for predictive purposes is relatively low, as depicted by an Rsq value of 0.452 (Figure 6C). The result suggests a negative correlation between milk production and THIMEAN. Milk production and RT also had a negative correlation, but there was a positive correlation between RT and THIMEAN, which was found statistically significant (p < 0.01).

4. Discussion

THI is considered as the best indicator to measure heat stress in lactating dairy cows [16]. Ambient temperature and humidity jointly regulate the THI value. A case study showed that the highest average THI value was observed in the month of July in a selected area of Bangladesh [17]. Another study in Bangladesh considered the dairy farms’ THI and revealed the highest THI in the month of May [18]. In a recent report, it is revealed that monthly mean THI values were the highest in July and the lowest in January for all regions of mainland China. The THI was derived from climate data (from 1987 to 2016) at 839 meteorological stations [19]. Our study shows that the average THIMEAN values in the months of June, July, and August were very close; however, the highest THIMEAN value was recorded in June (Figure 2B). These differences may be due to different study areas and the formula used for calculating the THI value.
It is reported that heat stress in dairy cows commences when THI value surpasses 72 [15]. Several studies have shown that milk yield markedly declines with the increase of THI. According to Bouraoui et al. [20], milk production decreased by 21% with a 12.8% increment of THI value (from 68 to 78), suggesting a negative correlation between THI and milk yield. Spiers et al. [21] reported that a THI value beyond 69 reduced 0.41 kg/cow/day milk yield for each unit increase of THI. Another study revealed that milk yield was reduced by 0.2 kg for each unit increase in THI surpassing 72 [22]. In the case of temperate dairy breeds, a noticeable decline of milk yield was observed at around 76–78 mean THI value. For each unit increase of THI, the milk yield was decreased by 0.26 kg/day [23]. Further, a 36% decline in milk production was observed for every 1°C increment of air temperature above the thermal neutral zone [24]. Sacido et al. [25] and Segnalini et al. [26] stated that milk production decreased by 10–30% when dairy cows are under heat stress conditions. Analogously, Zheng et al. [27] suggested a significant reduction in milk production due to heat stress. A remarkable reduction in milk yield, 33% at 35 °C and 50% at 40 °C, was reported by Kadzere et al. [28]. In the present study, milk production decreased 1.2-fold (24.4%) with the increase of THIMEAN value (Figure 4). Thus, our present findings are in agreement with these published results. It has been suggested that the reduction of milk yield is the cumulative effect of feed intake, metabolism, and the physiology of dairy cattle, which are changed during the heat stress period [29]. It is also reported that the reduced feed intake creates a negative energy balance, which acts as a barrier to the synthesis of milk [30]. It should be noted that other factors, such as genetic merit, calving season, disease and parasite infestation, housing conditions, scarcity of green forage, feed quality, nutrient assimilation, utilization, and rumen functions, also affect milk production. However, feed intake and other factors have not been considered in the present study, due to the unavailability of data.
The best method to measure the body temperature of cows is RT. It is often used as a sensitive index to determine the thermal equilibrium of a cow [31] and also to examine the effect of the thermal environment on growth, lactation, and reproduction in dairy cows [32]. A study by Xue et al. [33] showed that a 37.5% increment of THI value (from 45 to 72) results in an 1.8% increase of RT (from 37.8 °C to 38.5 °C). However, only an 8.7% increment of THI (from 72 to 79) results in a 2.2% increase (from 38.5 °C to 39.35 °C), suggesting that a THI value higher than 72 is more significantly detrimental. In the present study, when the average THIMEAN value increased from 65.8 in January to 79.3 in June, the average RT increases from 38.7 to 40 °C, representing increases in THIMEAN and RT of 17% and 3.3%, respectively (Figure 4). Our findings are closely related to the study carried out by Xue et al. [33]. According to Xu et al. [34], RT had a significant effect on milk yield. They suggested that the average daily milk yield decreased 1.26 kg with per unit increase of RT. Our finding is comparable to Xu et al.’s [34] results, where milk production decreased 1.17 kg ECM for each unit increment of RT (Figure 6B). Liu et al. [35] showed that RT was significantly upregulated during heat stress periods and that, for each unit increase in the THI value, the RT of dairy cows increased by 0.1062 °C, 0.0739 °C, and 0.0847 °C during early, mid and late lactation, respectively. Although cows included in our study were in early lactation, the RT increases 0.059 °C for each unit increment of THIMEAN (Figure 6C). The differences in genetic merit could be the reason for such a low reduction of RT when compared to another study [35].
Milk production, along with quality, is affected by a hot and humid environment. In the current study, with the increase of THIMEAN value, both the protein and fat content of milk decreased significantly (Figure 5). Our findings are in agreement with several studies which have been reported previously. Rodriquez et al. [36] and Knapp and Grummer [37] reported a decrease in milk protein with increased THI. Bouraoui et al. [20] observed lower fat and protein content in milk during the summer season, when THI value surpasses 72. A significant reduction in fat and protein percentage of milk due to heat stress has been revealed by Zheng et al. [27]. Sacido et al. [25] and Segnalini et al. [26] found a significant decrease in milk fat and protein content with the increase of THI. Ozrenk and Inci [38] also reported that cow milk contains higher percentages of fat, protein, and total solids during winter when compared to the summer season. The lower feed intake, due to heat stress, has been proposed as one of the key players regulating the fat and protein content of milk. Decrease in feed intake-in particular, forage-hinders the normal rumen functions, which, in turn, affect the fat composition in milk [20,39].
The ash content of milk follows the opposite trend of fat and protein content. The average ash content was increased from 0.62% in January to 0.73% in June during the 5-year study period (Figure 5). Our findings are in agreement with Chanda et al. [18], who reported higher mineral content in the milk of HF crossbred cows of Bangladesh under heat stress conditions. In contrary, Reyad et al. [17] revealed that, with the increase of THI, the mineral content in milk of HF crossbred cows is decreased. Likewise, Marinai et al. [40] reported a lower content of milk ash during summer. These two findings contrast our present study. A recent review stated that limited information is available on the mineral content of milk when a cow stays under heat stress conditions [41]. The increase of mineral content in milk during a higher THI period could be due to the reduction of milk yield.

5. Conclusions

Our results demonstrate that the THI value, calculated from meteorological station data, has a distinct relationship with the production performances of lactating crossbred dairy cows. Therefore, this could be a useful approach for assessing the effect of heat stress on dairy cattle production performances. Based on 35 years of meteorological data in the study area, June and January were demonstrated to be the hottest and coolest months, respectively. Likewise, it would be possible to predict the thermo-comfort zone for dairy cattle in Bangladesh at the spatial and temporal levels. As air temperatures have been rising due to global warming, prediction of dairy cattle performances using environmental parameters could be a sustainable adaptation strategy for enabling farmers to combat climate change.

Author Contributions

Conceptualization, M.M.R. and A.S.M.S.; methodology, M.M.R. and A.S.M.S.; formal analysis, M.D.H., M.A.S., S.A. (Shahrina Akhtar) and S.A.M.H.; investigation, M.D.H., M.U.H., S.A. (Shabbir Ahmed) and M.M.I.; writing—original draft preparation, M.M.R. and M.D.H.; writing—review and editing, M.M.R., A.S.M.S. and S.A.M.H.; supervision, M.M.R.; project administration, M.M.R. and M.D.H.; funding acquisition, M.M.R. and M.D.H. All authors have read and agreed to the published version of the manuscript.

Funding

The authors would like to gratefully acknowledge the financial support from the Research Management Wing (UGC/RMC/44) of Bangabandhu Sheikh Mujibur Rahman Agricultural University, Bangladesh (to M.D.H.) and CRP-II, Krishi Gobeshona Foundation, Bangladesh (to M.M.R.).

Institutional Review Board Statement

The animal study protocol was approved by the Animal Research Ethics Committee of Bangabandhu Sheikh Mujibur Rahman Agricultural University (Ref. No. FVMAS/AREC/2022/01).

Informed Consent Statement

Not applicable.

Data Availability Statement

Not applicable.

Conflicts of Interest

The authors declare no conflict of interest.

References

  1. BBS. Statistical Year Book Bangladesh; Bangladesh Bureau of Statistics (BBS), Statistics Division, Ministry of Planning, Government of the People Republic of Bangladesh: Dhaka, Bangladesh, 2021; ISBN 9789844750470. [Google Scholar]
  2. Datta, A.K.; Haider, M.Z.; Ghosh, S.K. Economic Analysis of Dairy Farming in Bangladesh. Trop. Anim. Health Prod. 2019, 51, 55–64. [Google Scholar] [CrossRef] [PubMed]
  3. Uddin, M.M.; Sultana, M.N.; Ndambi, O.A.; Alqaisi, O.; Hemme, T.; Peters, K.J. Milk Production Trends and Dairy Development in Bangladesh. Outlook Agric. 2011, 40, 263–271. [Google Scholar] [CrossRef]
  4. Das, R.; Sailo, L.; Verma, N.; Bharti, P.; Saikia, J.; Imtiwati; Kumar, R. Impact of Heat Stress on Health and Performance of Dairy Animals: A Review. Vet. World 2016, 9, 260–268. [Google Scholar] [CrossRef] [PubMed] [Green Version]
  5. Pragna, P.; Archana, P.R.; Aleena, J.; Sejian, V.; Krishnan, G.; Bagath, M.; Manimaran, A.; Beena, V.; Kurien, E.K.; Varma, G.; et al. Heat Stress and Dairy Cow: Impact on Both Milk Yield and Composition. Int. J. Dairy Sci. 2017, 12, 1–11. [Google Scholar] [CrossRef] [Green Version]
  6. St-Pierre, N.R.; Cobanov, B.; Schnitkey, G. Economic Losses from Heat Stress by US Livestock Industries1. J. Dairy Sci. 2003, 86, E52–E77. [Google Scholar] [CrossRef] [Green Version]
  7. Atrian, P.; Shahryar, H.A. Heat Stress in Dairy Cows (A Review). Res. Zool. 2012, 2, 31–37. [Google Scholar] [CrossRef]
  8. Ravagnolo, O.; Misztal, I.; Hoogenboom, G. Genetic Component of Heat Stress in Dairy Cattle, Development of Heat Index Function. J. Dairy Sci. 2000, 83, 2120–2125. [Google Scholar] [CrossRef] [PubMed]
  9. Bohmanova, J.; Misztal, I.; Cole, J.B. Temperature-Humidity Indices as Indicators of Milk Production Losses Due to Heat Stress. J. Dairy Sci. 2007, 90, 1947–1956. [Google Scholar] [CrossRef]
  10. de Campos, I.L.; Chud, T.C.S.; Oliveira, H.R.; Baes, C.F.; Cánovas, A.; Schenkel, F.S. Using Publicly Available Weather Station Data to Investigate the Effects of Heat Stress on Milk Production Traits in Canadian Holstein Cattle. Can. J. Anim. Sci. 2022, 102, 368–381. [Google Scholar] [CrossRef]
  11. Carabaño, M.J.; Logar, B.; Bormann, J.; Minet, J.; Vanrobays, M.L.; Díaz, C.; Tychon, B.; Gengler, N.; Hammami, H. Modeling Heat Stress under Different Environmental Conditions. J. Dairy Sci. 2016, 99, 3798–3814. [Google Scholar] [CrossRef] [PubMed]
  12. Yousef, M.K. Stress Physiology: Definition and Terminology; CRC Press: Boca Raton, FL, USA, 1985. [Google Scholar]
  13. Aggarwala, A.C.; Sharma, R.M. A Laboratory Manual of Milk Inspection; Asia Publishing House: London, UK, 1961. [Google Scholar]
  14. AOAC. Official Methods of Analysis of the Association of Official’s Analytical Chemist, 17th ed.; Association of Official Analytical Chemist: Arlington, VA, USA, 2003. [Google Scholar]
  15. Armstrong, D.V. Heat Stress Interaction with Shade and Cooling. J. Dairy Sci. 1994, 77, 2044–2050. [Google Scholar] [CrossRef]
  16. Dikmen, S.; Hansen, P.J. Is the Temperature-Humidity Index the Best Indicator of Heat Stress in Lactating Dairy Cows in a Subtropical Environment? J. Dairy Sci. 2009, 92, 109–116. [Google Scholar] [CrossRef] [PubMed] [Green Version]
  17. Al Reyad, M.; Sarker, M.A.H.; Uddin, M.E.; Habib, R.; Rashid, M.H.U. Effect of Heat Stress on Milk Production and Its Composition of Holstein Friesian Crossbred Dairy Cows. Asian J. Med. Biol. Res. 2016, 2, 190–195. [Google Scholar] [CrossRef] [Green Version]
  18. Chanda, T.; Debnath, G.; Khan, K.; Rahman, M.; Chanda, G. Impact of Heat Stress on Milk Yield and Composition in Early Lactation of Holstein Friesian Crossbred Cattle. Bangladesh J. Anim. Sci. 2018, 46, 192–197. [Google Scholar] [CrossRef]
  19. Wang, T.; Zhong, R.; Zhou, D. Temporal–Spatial Distribution of Risky Sites for Feeding Cattle in China Based on Temperature/Humidity Index. Agriculture 2020, 10, 571. [Google Scholar] [CrossRef]
  20. Bouraoui, R.; Lahmar, M.; Majdoub, A.; Belyea, R. The Relationship of Temperature-Humidity Index with Milk Production of Dairy Cows in a Mediterranean Climate. Anim. Res. 2002, 51, 479–491. [Google Scholar] [CrossRef] [Green Version]
  21. Spiers, D.E.; Spain, J.N.; Sampson, J.D.; Rhoads, R.P. Use of Physiological Parameters to Predict Milk Yield and Feed Intake in Heat-Stressed Dairy Cows. J. Therm. Biol. 2004, 29, 759–764. [Google Scholar] [CrossRef]
  22. West, J.W. Effects of Heat-Stress on Production in Dairy Cattle. J. Dairy Sci. 2003, 86, 2131–2144. [Google Scholar] [CrossRef]
  23. Brown-Brandl, T.M.; Nienaber, J.A.; Eigenberg, R.A.; Hahn, G.L.; Freetly, H. Thermoregulatory Responses of Feeder Cattle. J. Therm. Biol. 2003, 28, 149–157. [Google Scholar] [CrossRef]
  24. Rhoads, M.L.; Rhoads, R.P.; VanBaale, M.J.; Collier, R.J.; Sanders, S.R.; Weber, W.J.; Crooker, B.A.; Baumgard, L.H. Effects of Heat Stress and Plane of Nutrition on Lactating Holstein Cows: I. Production, Metabolism, and Aspects of Circulating Somatotropin. J. Dairy Sci. 2009, 92, 1986–1997. [Google Scholar] [CrossRef]
  25. Sacido, M.B.; Loholaberry, F.; Sanchez, N.; Intruvini, J. Effect of Caloric Stress on Milk Production and Animal. In Proceedings of the International Grassland Congress Proceedings, Sao Pedro, Brazil, 11–21 February 2001. [Google Scholar]
  26. Segnalini, M.; Nardone, A.; Bernabucci, U.; Vitali, A.; Ronchi, B.; Lacetera, N. Dynamics of the Temperature-Humidity Index in the Mediterranean Basin. Int. J. Biometeorol. 2011, 55, 253–263. [Google Scholar] [CrossRef] [PubMed]
  27. Zheng, L.; Chenh, M.; Zhi-Cheng, G. Effects of Heat Stress on Milk Performance and Fatty Acids in Milk Fat of Holstein Dairy Cows. China Dairy Ind. 2009, 37, 17–19. [Google Scholar]
  28. Kadzere, C.T.; Murphy, M.R.; Silanikove, N.; Maltz, E. Heat Stress in Lactating Dairy Cows: A Review. Livest. Prod. Sci. 2002, 77, 59–91. [Google Scholar] [CrossRef]
  29. Najar, T.; Rejeb, M.; Rad, M.B.M. Modelling of the Effects of Heat Stress on Some Feeding Behaviour and Physiological Parameters in Cows. In Modelling Nutrient Digestion and Utilisation in Farm Animals; Wageningen Academic Publishers: Wageningen, The Netherlands, 2011; pp. 130–136. [Google Scholar]
  30. Wheelock, J.B.; Rhoads, R.P.; VanBaale, M.J.; Sanders, S.R.; Baumgard, L.H. Effects of Heat Stress on Energetic Metabolism in Lactating Holstein Cows. J. Dairy Sci. 2010, 93, 644–655. [Google Scholar] [CrossRef] [PubMed] [Green Version]
  31. Younes, R.B.; Ayadi, M.; Najar, T.; Caccamo, M.; Schadt, I.; M’Rad, M.B. Hormonal (Thyroxin, Cortisol) and Immunological (Leucocytes) Responses to Cistern Size and Heat Stress in Tunisia. J. Life Sci. 2011, 11, 332–338. [Google Scholar]
  32. West, J.W. Nutritional Strategies for Managing the Heat-Stressed Dairy Cow. J. Anim. Sci. 1999, 77 (Suppl 2), 21–35. [Google Scholar] [CrossRef]
  33. Xue, B.; Wang, Z.S.; Li, S.L.; Wang, L.Z.; Wang, Z.X. Temperature-Humidity Index on Performance of Cows. China Anim. Husb. Vet. Med. 2010, 37, 153–157. [Google Scholar]
  34. Xu, W.; Zhao, Y.; Cao, L.; Zhou, J.; Guo, G.; Dong, G.; Wang, Y. Study on the Effect of Dairy Cows&rsquo; Rectal Temperature on Milk Yield in Summer in Beijing Area. Acta Vet. Zootech. Sin. 2016, 47, 745–751. [Google Scholar] [CrossRef]
  35. Liu, J.; Li, L.; Chen, X.; Lu, Y.; Wang, D. Effects of Heat Stress on Body Temperature, Milk Production, and Reproduction in Dairy Cows: A Novel Idea for Monitoring and Evaluation of Heat Stress—A Review. Asian-Australas. J. Anim. Sci. 2019, 32, 1332. [Google Scholar] [CrossRef]
  36. Rodriquez, L.A.; Mekonnen, G.; Wilcox, C.J.; Martin, F.G.; Krienke, W.A. Effects of Relative Humidity, Maximum and Minimum Temperature, Pregnancy, and Stage of Lactation on Milk Composition and Yield. J. Dairy Sci. 1985, 68, 973–978. [Google Scholar] [CrossRef]
  37. Knapp, D.M.; Grummer, R.R. Response of Lactating Dairy Cows to Fat Supplementation during Heat Stress. J. Dairy Sci. 1991, 74, 2573–2579. [Google Scholar] [CrossRef] [PubMed]
  38. Ozrenk, E.; Inci, S.S. The Effect of Seasonal Variation on the Composition of Cow Milk in Van Province. Pak. J. Nutr. 2008, 7, 161–164. [Google Scholar] [CrossRef] [Green Version]
  39. Kamiya, M.; Iwama, Y.; Tanaka, M.; Shioya, S. Effects of High Ambient Temperature and Restricted Feed Intake on Nitrogen Utilization for Milk Production in Lactating Holstein Cows. Anim. Sci. J. 2005, 76, 217–223. [Google Scholar] [CrossRef]
  40. Mariani, P.; Zanzucchi, G.; Blanco, P.; Masoni, M. Variazioni stagionali del contenuto in fosforo del latte di massa di singoli allevamenti. Ind. Latte 1993, 29, 39–53. [Google Scholar]
  41. Summer, A.; Lora, I.; Formaggioni, P.; Gottardo, F. Impact of Heat Stress on Milk and Meat Production. Anim. Front. 2019, 9, 39–46. [Google Scholar] [CrossRef] [PubMed]
Figure 1. Location of the study area and adjacent weather station.
Sustainability 15 00085 g001
Figure 2. Temporal variation of THI in different months over the 35-year (1986–2020) period. THIMAX (A), THIMEAN (B) and THIMIN (C) are the maximum, mean and minimum daily THI value calculated from 3-hourly temperature and humidity data recorded by the weather station. Red colored dotted line indicates upper critical comfort THI level, assuming THI ≤ 72 indicates no stress.
Sustainability 15 00085 g002
Figure 3. Periodic variation of THI in two different months, January (A) and June (B), over the 35-year (1986–2020) period. The THI value was calculated using the temperature and humidity data obtained from weather station at each 3-h interval. Red-colored dotted line indicates upper critical comfort THI level, assuming THI ≤ 72 indicates no stress.
Sustainability 15 00085 g003
Figure 4. Relationship between THIMEAN, rectal temperature (RT) and milk production (MP) during 5-year (2016–2020) study period. The milk production data are the average of weekly values (n = 500) obtained from individual dairy cows. THIMEAN is the average THI values generated from test day temperature and humidity recorded by the weather station at 3-h intervals.
Sustainability 15 00085 g004
Figure 5. Effect of THIMEAN on milk composition during 5-year (2016–2020) study period. The milk composition data are the average of weekly values (n = 500) obtained from individual dairy cows. THIMEAN is the average THI values generated from test day temperature and humidity recorded by the weather station at 3-h intervals.
Sustainability 15 00085 g005
Figure 6. Regression correlation among milk production (MP), rectal temperature (RT) and daily mean temperature humidity index (THIMEAN). The MP and RT data are the weekly values (n = 500) obtained from each individual dairy cow. THIMEAN is the average THI values generated from test day temperature and humidity recorded by the weather station at every three-hour interval.
Sustainability 15 00085 g006
Table 1. Genotype and phenotype characteristics of the selected animals.
ParametersObservations (n = 100)
Parity2nd43%
3rd57%
Milk production7.6 ± 0.3 L
Lactation stage53.9 ± 2.3 days
Genotype1/2 HF 1/2 Local45%
3/4 Jersey 1/4 Local20%
3/4 HF 1/4 Local15%
1/2 HF 1/2 Sindhi10%
3/4 Shahiwal 1/4 Local5%
Unknown5%
Disclaimer/Publisher’s Note: The statements, opinions and data contained in all publications are solely those of the individual author(s) and contributor(s) and not of MDPI and/or the editor(s). MDPI and/or the editor(s) disclaim responsibility for any injury to people or property resulting from any ideas, methods, instructions or products referred to in the content.

