Abstract
Although greenhouse production is an especially intensive form of agricultural production, horticultural products have not been subject to many carbon footprint studies. This study examines the poinsettia, a relevant greenhouse plant in the market. It analyzes the poinsettia’s climate impact by undertaking a product carbon footprint (PCF) study, along the whole poinsettia value chain; this starts at the mother-plant farms in Uganda, goes through the production in German greenhouses, and ends with the disposal of the plant by the consumer. A life cycle inventory was conducted, including input materials, equipment, cultural practices, and other processes used in two horticultural farms. A standardized questionnaire collected consumer data. The PCF for the poinsettia is 0.69 kg of carbon dioxide equivalent (kg of CO2e), including distribution. As heating in both investigated farms is conducted via renewable energy, major contributors to the PCF were overhead electricity, substrate, pot, and packaging. The consumers’ contribution varies from 0.31 (best), through 0.45 (average), to 1.49 (worst) kg of CO2e, and is mostly due to differences in shopping behavior, producing a total PCF of 1.0–2.18 kg of CO2e. The results show a high variability for emissions along the value chain, due to different input factor choices on the production side and a significant consumer contribution.
1. Introduction
From a global perspective, the agricultural sector is the second largest emitter of greenhouse gases [1]. In 2016, Germany released sector-specific reduction goals for the first time in its ‘Climate Protection Plan 2050’, which demands a reduction of 31–34% in the agricultural sector until 2030 [2]. Horticulture, as a part of this sector, has not been the focus of wider research due to its relatively low share of land use and production factors [3]. However, this is only partly true, taking into account the energy intensive greenhouse production in regions such as Central or Northern Europe, which are also the core markets within Europe [4]. Because the land use is smaller than for classical agricultural crops, higher yields per hectare are common in horticulture, especially when it comes to greenhouse production. In recent years, carbon footprint studies have become a common tool to get more insight into the climate-relevant emissions from horticultural production.
Most studies in the horticultural sector have analyzed the Product Carbon Footprint (PCF) in the fruit and vegetable area. For example, Theurl [5] analyzed tomatoes, Bell and Horvath [6] researched oranges, and the study of Schäfer and Blanke [7] was one of the first to apply the Publicly Available Specification (PAS) 2050-1 horticulture to calculate the PCF of pumpkins and asparagus. So far, only a few studies have dealt with the carbon footprint of ornamental greenhouse plants, even though it is a billion-dollar market across the world. In particular, Germany is known as the biggest market for flowers and plants in Europe [8]. Relevant work for ornamental plants was published by Soode et al. [9], Lazzerini [10], and Ingram et al. [11,12]. Soode et al. [9] examined cut roses and Phalaenopsis along the whole value chain, including consumer shopping trips and use phases based on empirical data, whereas Lazzerini [10] and Ingram et al. [11,12] set their system boundaries within the farm gates. Looking at the emission hotspots of previously conducted studies of ornamental plants grown in greenhouses, it becomes obvious that heating energy is one the factors that most influences the Carbon Footprint. Energy-related emissions from Phalaenopsis, for example, contribute 73% [9]–95% [13] to the total Carbon Footprint at the production stage. Renewable energy sources, such as the cogenerated heat of a power plant, can contribute to a decrease in emissions of up to 46% of a total Carbon Footprint in the production stage, of 4.2 kg of CO2e per plant [9]. According to Soode et al. [9], a bundle of ten greenhouse-grown cut roses releases almost the same emissions as one orchid produced with fossil energy (~8 kg of CO2e per plant). Even more emissions arise from the production of green foliage plants such as Ficus. They show a Carbon Footprint between 11 and 16 kg of CO2e per plant, depending on the growth stage [13]. Besides energy, other hotspots in ornamental plant production are reported in previous studies. For example, Ingram et al. [11] show the importance of a potting substrate (45%) and container pots (26%) when producing chrysanthemums with a PCF of 0.56 kg of CO2e. In a case study in Austria, Wandl and Haberl [14] calculated the PCF of nine ornamental pot-plants, of which Cyclamens has the highest Carbon Footprint with 5.5 kg of CO2e, followed by amaryllis, azalea, poinsettia, hyacinths, pelargonium, primula, bedding plants, and viola, with these plants producing an average of 1.8 kg of CO2e [14].
One of the most produced greenhouse products in the ornamental sector is the poinsettia, better known as a ‘Christmas star’. Besides Phalaenopsis, the poinsettia is the second most popular flowering indoor plant in Germany, with a market share of 11% [15]. In 2021, 20 million plants were produced and sold in Germany, making it the top selling indoor plant actually produced in Germany. Due to its marketing season shortly before Christmas, the energy demand throughout the cultivation period under German climate conditions is at the upper end. The poinsettia supply chain is highly diversified, starting with mother plant cultivation and the production of cuttings in Africa, and ending with the end-of-life stage in consumer households. This international and subdivided value chain makes it especially interesting to analyze the production and distribution of this plant from a climate-impact point of view. There are many potential emission phases, including heating, cooling, and different transportation systems, as well as different actor groups that are involved in the value chain. However, there is so far no detailed carbon footprint calculation that covers all stages of the value chain, from the production stage until the consumer phase, for this important horticultural plant. Additionally, there is also no proofing system for the methodology used to compare hotspots of the same horticultural product with different production systems, combined with alternative transport types and distances, and consumer scenarios.
Recent PCF studies that aim to lower emissions in the horticultural sector have primarily focused on the production side and less on the consumer side. Yet, for example, the average US citizen is responsible for the production of approximately 17 t of CO2e per year, caused by consumer-related activities [16]. Carbon Footprint (CF) studies that include consumer-related activities in a cradle-to-grave assessment come to the conclusion that, depending on the product and consumer behavior, the customer does indeed have a remarkable impact on the whole PCF [7,9,17,18]). Furthermore, in a meta-analysis of Life Cycle Assessment (LCA) studies, Foster et al. [19] point out that the consumer stage plays an important role when consuming pasta, potatoes, or frozen fish. Concerning ornamental plants, there is only one study [9] that includes the consumer phase on the basis of empirically collected data in a PCF calculation. Therefore, the objective of the current research is to calculate and analyze the PCF of poinsettias produced in Germany in a cradle-to-grave approach, based on primary data from both sides: the production side and the consumer side. This calculation allows for the uncovering of emission hotspots and identification of scenario-based reduction potentials.
As a result, we contribute to the empirical analysis of PCF of ornamental plants, in particular, by considering the entire value chain, including the consumer phase. This is especially relevant since previous studies have often underestimated the PCF level of such plants, as consumers contribute to a substantial part of the CO2e emissions in such value chains. Another important aspect is that the specifically collected empirical data for this study go ‘beyond the average’ of the horticultural industry, since the companies under investigation have already reduced their CO2e emissions significantly in the past by, for example, modernizing their heating systems in the greenhouses. In this sense, this study delivers insights into the situation of a more advanced horticultural production and value chain, and the related CO2e emissions.
2. Materials and Methods
The PCF calculation was conducted with the regulations of PAS 2050-1 horticulture, which allows specific guidance in terms of horticultural production systems. It was developed by a European expert group from the horticultural sector and the British Standards Institution (BSI). As PAS 2050-1 does not especially address consumer aspects, rules from ISO 14067 were adapted for this step of the value chain. First, the production system was described with the help of the literature research and expert interviews. Second, a questionnaire based on the production system described was developed for personal interviews, in order to obtain data for the life cycle inventory and the later climate impact assessment. Lastly, for the consumer stage, a questionnaire was developed and applied to a representative sample of German horticultural consumers.
2.1. Production Systems
Poinsettia is produced in two stages: The production of cuttings in Africa and the actual production of the potted plants in the greenhouses in Europe. In Africa, taking care of the mother plants is the major task of the local management; this includes irrigation, pest control, fertilizing and hygiene measures. Management practices for the greenhouse production in Europe include potting, fertilizing, pest control, application of growth regulators, irrigation, applying the right temperature strategies and daylight control. Two different heating systems for the production of the poinsettia (Table 1) in Germany were analyzed using primary data from two horticultural companies. In addition, three consumer stage scenarios (Table 2) and five distribution channels were considered. By combining the different heating systems and distribution channels with the three different consumer scenarios, a total of 30 variants for poinsettia value chains were analyzed within this study.

Table 1.
Variables in the PCF calculation of the poinsettia.
Table 2.
Consumer scenarios and quantitative data of inputs.
Factors in the consumer phase, such as fertilizers, watering with warm water, and plant protection chemicals, fell under the 1% cut-off limit, so they do not need to be included in the PCF calculation.
2.2. Functional Unit
The functional unit used in this study was one poinsettia in a pot with a 12 cm diameter and a plastic bag ready for retail. Some processes required using weight for the functional unit. In such cases, we measured the weight of plants and packaging materials with real-life data, such as plastic bags, trays, and pots.
2.3. System Boundaries
The system boundaries of the PCF analyzes of the few products of horticultural origin that have been realized so far, commonly end at the farm or the retail outlet [5,11,13,20,21]. The current study goes beyond that and includes all product-related processes, from young plant production in Africa to disposal at the end of life. The processes that are included in the study are shown in Figure 1. According to the PAS 2050-1 for horticultural products, GHG emissions from the production, maintenance, and the end of life of capital goods (e.g., greenhouses and machinery used in production) are not included in the system boundary.
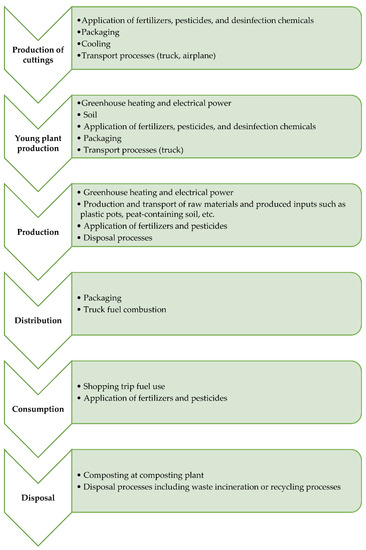
Figure 1.
System boundary according to the life cycle stages of the poinsettia.
2.4. Data Collection
2.4.1. Young Plant Stage
The German company’s production of cuttings, in the analyzed poinsettia value chain, takes place in a specialized horticultural farm in the region of Wagagai in Uganda. The mother plants cultivated on that farm use so-called elite plants bred in Germany, so that unrooted cuttings of the best quality can be harvested for young plant production in Germany. Situated beside Lake Victoria, the climatic conditions are ideal for the production of poinsettias, due to consistently warm temperatures (a yearly average temperature of 23.5 degrees Celsius). Data collection could not be performed directly in Uganda due to time and budget restrictions. This is why the question was forwarded by the same German young plant production company that owns the facility. This was sent to the Chief Operation Officer in Uganda so that the relevant first-hand data could be collected. A plausibility check of the submitted data was conducted by the person in charge of the young plant production company in Germany, who himself was the Chief Operation Officer for many years in Uganda.
2.4.2. Production Stage
For the calculation of the poinsettia, two producers provided data for the production stage. All the producers were located in the western part of Germany, near the cities of Cologne and Münster. The annual average temperature in this area is about 9.0 degrees Celsius. All producers received a questionnaire in advance, which was used to collect basic data. These data were checked, and missing parameters were added in a subsequent interview in the nursery. The data collection took place from September 2015 until December 2015. As the two companies are GLOBALG.A.P. certified, the data collection took advantage of its well-documented production. In cases where no primary data were available, secondary data were derived from the literature or databases, such as ecoinvent v2.2. The consolidated data of the inputs of Company 1 in the production and transportation stage are presented in Table 3.
Table 3.
Material input for production of one poinsettia (12cm-pot) in Germany.
2.4.3. Consumer Stage
For collecting empirical data for the consumer stage, an online study with 1000 consumers was conducted in April 2017, with the general character as shown in Table 4. At the beginning of the survey, participants were presented with questions concerning their general shopping behavior for ornamental plants. In a later part, participants who declared that they bought a poinsettia during the last season were presented with further questions related to that plant. In this manner, all information relevant for calculating the PCF at the consumer stage could be collected. The consumer survey mainly concentrated on the shopping trip and the end-of-life stage.
Table 4.
Characteristics of the consumer survey.
Before calculating the data, based on statistical procedure, we removed outliers that would have otherwise distorted the results. The data were analyzed with the statistics software SPSS. In order to generate different shopping scenarios for the PCF, we used descriptive statistics to perform an analysis of variance. The mean value was the basis for the actual scenario. The worst-case scenario was based on the mean plus one standard deviation, while the best-case scenario was the mean minus one standard deviation. In some cases, adding or subtracting the standard deviation would not have been meaningful, so the average scenario value was used. The quantitative data of the consumer stage are presented in Table 2.
2.5. PCF Calculation
We used PAS 2050 [22] and PAS 2050-1 [23] as guidelines for calculating the PCF. However, contrary to the PAS 2050-1 guidance, we also included customer shopping trip emissions because it can be an essential parameter in horticultural or grocery supply chains, according to Lampert et al. [18], Soode et al. [9], and Schaefer and Blanke [7].
For the modelling of the relevant processes and the PCF calculation, we used the specialized software Umberto NXT CO2 and ecoinvent v2.2 databases. The PCF calculations are based on a 100-year global warming potential according to the Intergovernmental Panel on Climate Change (IPCC, 2007). According to PAS 2050 (BSI, 2011) and the Product Life Cycle Accounting and Reporting Standard (Greenhouse Gas Protocol, 2011), all relevant GHGs should be included in the evaluation, which is carried out in this study.
2.6. Hotspots
We identified the hotspots using the absolute amount of emitted GHG from one material or process, and the corresponding contribution to the final PCF in percentage. All materials or processes that contributed at least 0.1 kg of CO2e or 10% to the total PCF were considered to be hotspots.
2.7. Allocation
All production processes resulted in only one output, a poinsettia plant. If the organic waste was composted, occurring methane (CH4), nitrous oxide (N2O), and carbon monoxide (CO) emissions were accounted for. In the consumer scenario, the emissions resulting from the shopping trip by car were allocated, according to the weight of the purchased products and the number of stops during that trip.
3. Results
3.1. Overview
The total PCF value consists of the young plant production, the actual greenhouse production (with the different data of two companies), and the distribution and consumer stage with a best-case, average, and worst-case scenario (Figure 2). By aggregating the carbon emissions at the different stages of the value chain, the total PCF value of one poinsettia adds up to around 1 kg of CO2e (1.27, 1.0 kg of CO2e) with the average best-case consumer scenario, and it can reach up to 2.31 kg of CO2e/poinsettia in total in the worst-case consumer scenario.
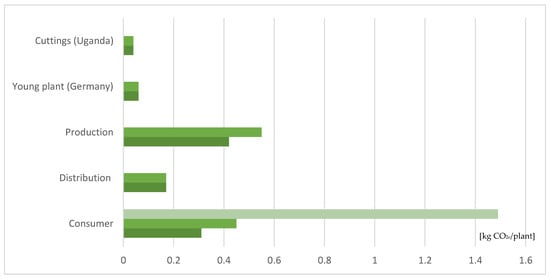
Figure 2.
Overview of the life cycle stages and their contribution to the PCF of the poinsettia. Note: The consumer stage represents the three scenarios best, average and worst.
3.2. Young Plant Phase
As Figure 2 shows, the production of cuttings in Africa and the young plant production in a German greenhouse are the lowest contributing part to the total emissions in the entire life cycle of the poinsettia. Even though many energy-consuming processes, for example, fertilizing, sanitizing, and air transport, occur in this phase, the impact on climate emissions is quite low; this is thanks to the high yields of each mother plant of cuttings, in combination with a low weight per packaging unit during air transportation. The hotspots in this phase (responsible for 80% of this stage’s emission) are the transport by airplane (0.03 kg of CO2e/plant) and the rooting of cuttings in the greenhouses in Germany (0.05 kg of CO2e/plant).
3.3. Horticultural Production and Distribution
The core process of the poinsettia value chain is the actual production in the greenhouses of the horticultural companies; this what justifies a detailed analysis. As Figure 3 shows, there are three hotspots to be recognized during this phase: packaging, potting substrate, and electrical power, which add up to 65–70% of the emissions of this stage. Even though the two companies examined have similar production techniques, one company shows significantly less emissions from electrical power. This is because this company has installed photovoltaic panels as a source of renewable energy, and the produced power is consumed directly in the nursery. This means that there is not a lower energy consumption in this company, but there is a lower emission factor of electrical power in total. As the potting substrate is peat-based, it appears as the number one hotspot for Company 2 and second hotspot for Company 1. Heating, which could be expected to be a hotspot due to the high temperature requirements of poinsettias during the production period in autumn/winter, does not, in fact, cause high emissions in either company under investigation. This is due to heating systems that rely on renewable energy sources (wood chips, biogas), which have been installed by the companies in recent years. Instead, the cardboard packaging (which is part of the distribution phase) of the ready-to-sell poinsettia is one of the hotspots in both companies, due to carbon emissions resulting from raw material and the production of the cardboard. The subsequent transport is based on empirical data for both companies. It is assumed that both deliver their plants to a DIY outlet in southern Germany, with 665 km and 521 km of distance travelled, respectively.
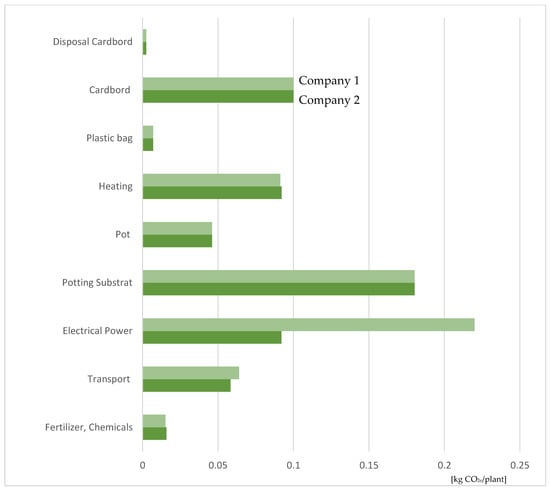
Figure 3.
Contribution of the different steps of production processes to the PCF of the poinsettia of the two companies under investigation (source: own data).
3.4. Consumer Stage
As described in Table 2, three different consumer scenarios have been developed based on the empirical data of the online survey. Because shopping trips by bike or on foot result in almost zero emissions, they are excluded from the scenarios. Moreover, 76% of the respondents used a car for their shopping trips. The contribution at the consumer stage varies from around 31% (best case) to more than 65% of the total PCF of one poinsettia in the worst-case scenario, simply due to different consumer behaviors when buying and using the same product. In the case of the poinsettia value chain, the variation in the consumer phase is mainly due to the shopping trip. Therefore, it is worthwhile to take a closer look at the factors influencing consumers’ shopping trips when purchasing such plants. The factors that are analyzed in more detail in this study are the distance to the retail outlet, whether the trip is combined with other stops, the number of total stops, whether a detour must be taken to get to the retail outlet, and the size of the basket of goods. Based on the data shown in Table 2, the minimum consumer scenario results in emissions of 0.31 kg of CO2e, the average scenario in emissions of 0.45 kg of CO2e, and the maximum scenario in emissions of 1.49 kg of CO2e. Figure 4 shows the contribution of the single factors in the consumer stage, in a sensitivity analysis. Taking the average scenario as reference, Figure 4 further shows the influence of the single factors in case the used value is 50% below or above average. A small basket of goods and a non-combined shopping trip have the biggest impact on the PCF in the consumer stage.
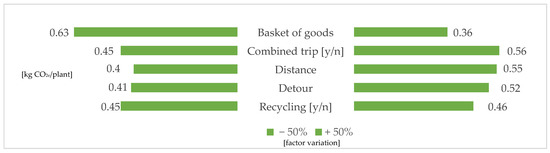
Figure 4.
Sensitivity analysis of influencing factors in the consumer stage.
As Table 5 shows, the PCF of the shopping trip varies between different outlets. Therefore, the PCF of buying a poinsettia at a garden center is almost doubled when compared to buying them at the supermarket or discounter. The main reasons for this can be found in the factors mentioned above in the results section. The distance to the supermarket or discounter is around 3 km (single trip), while the distance to a garden center is more than double, around 8 km. The mean size of the basket of goods in supermarkets is 14.5 kg (1 poinsettia is estimated to be around 1 kg of goods), whereas the basket of goods at the garden center is 5 kg less than that. Going out just for an exclusive purchase of a poinsettia is more likely at a garden center (around 35%) than at a supermarket (around 20%).
Table 5.
Overview of different retail outlets and their contribution to the PCF.
4. Discussion
Recently, a few studies have analyzed the PCF of ornamental plants. Within these studies, different system boundaries were applied, which must be considered when comparing the results. Most studies undertaken had a bundle of 10 cut roses as the functional unit, such as Williams [24], Torrellas et al. [25], Sahle and Potting [26], and Soode et al. [9]. The emissions of these roses vary between 0.33 kg/CO2e (Ethiopian production only and no transport to Europe [26]) and 3.43 kg/CO2e (Kenya field production with air transport to Europe [24]), and they can reach up to 8.47 kg of CO2e (Dutch greenhouse production including consumer phase [9]). Even fewer PCF results are published concerning potted plants. Soode et al. [9] found that Phalaenopsis from sustainable production emits 4.1 kg of CO2e, including the consumer phase. Ingram et al. [12] took the production of 20 cm chrysanthemums under assessment and calculated emissions of 0.555 kg of CO2e. Blonk et al. [13] analyzed several ornamental plants, with PCFs ranging from 8 kg of CO2e (hortensias), up to 42 kg of CO2e (Phalaenopsis), with no consumer phase included. Taking into account the high variation of the published PCF data for ornamental plants, the results of our study—a total of around 1 kg of CO2e, up to 2.31 kg of CO2e, for a poinsettia in a 12 cm pot from sustainable production (heating with renewable energy and different scenarios for consumer behavior)—seem to be located in the lower level of potted plants emissions, considering that the consumer stage is included in this calculation.
In the young plant stage of the poinsettia value chain, the main drivers of the emissions are not found in the Ugandan mother plant company, nor in the production of the cuttings. The major hotspots during this phase are the transport by airplane and the rooting of cuttings in greenhouses in Germany. The transport by airplane does not have much optimization potential that can be influenced by the producers or distributors of the ornamental plants. The sensitive unrooted cuttings cannot by transported another way (e.g., transportation by ship would require too much time, resulting in spoilage of the cuttings), and there is no possibility of enlarging the number of cuttings per box. In our case study, reduction potential is found in the rooting of cuttings in the greenhouses in Germany, as a major part of the heating energy is generated by coal in one of the analyzed companies. If the coal heating can be substituted completely for wood chips heating (which already generates part of the heating supply in one company), 50% of this company’s emissions during the rooting process could be saved.
Looking at the results of the PCF calculation of horticultural production of poinsettias, the major hotspots (electrical power, potting substrate and packaging) are in line with the findings of Ingram et al. (2020). Despite the debate in the public, potentially environmental-harmful activities, such as applying plant protection chemicals or the use of fertilizers, contribute very little (<1.5%) to the overall emissions. This is also true for the irrigation of water as the companies already have closed water systems and reuse most of the water, regarding nutrient solutions. As mentioned above, the companies analyzed in our study have already taken measures in recent years related to the most relevant hotspots in greenhouse horticulture. In the case of the poinsettia, this is the use of energy for heating the greenhouses. Both analyzed companies use regenerative energy sources, such as wood chips or biogas. These sources cause only a small proportion of the CO2e emissions, compared to fossil energy sources such as coal or natural gas. Coal would be responsible for CO2e emissions 31 times higher than those of biogas (which is the energy source of one of the analyzed companies), as shown in Figure 5.
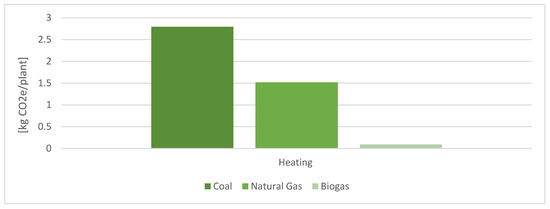
Figure 5.
Different heating systems and their impact on the PCF of the poinsettia.
If the energy input has already been optimized during the production phase of the poinsettia, other factors come into attention when calculating the PCF. One factor is the packaging of the plants, which is identified as a hotspot in both analyzed companies. Different consumers ask for different packaging options in order to fit their logistics structure. For example, in food retail, all plants are handled through the cold storage in the regional distribution center. Therefore, the poinsettia, a cold-sensitive plant, must be protected with cardboard packaging. Figure 6 shows the high variability in the CO2e emissions of the four analyzed packaging options.
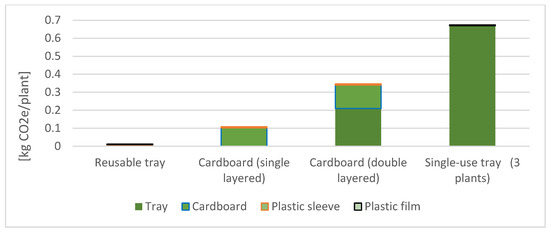
Figure 6.
Influence of different packaging options on the PCF of poinsettias.
The reusable tray is by far the most climate efficient way to pack poinsettias, followed by cardboard and plastic sleeves for the plants. Packing a poinsettia into a single-use tray without a plastic sleeve around the plant is not recommended from a climate perspective. The high emissions of 0.7 kg of CO2e for this packaging option is mostly due to the fact that only three plants (instead of eight plants) can be transported in one tray if no plastic bag is wrapped around the plants. These results show that reducing plastic packaging and the corresponding plastic waste—which is a major target of the EU and EU member states—can result in contrary effects regarding the climate-relevant emissions of the analyzed poinsettia value chain.
Another interesting aspect of our results is the discrepancy between the actual contribution of some materials or activities to the calculated CO2e emissions, and the related view of the population or the public. One example is the plastic sleeves around the plant. These contribute low shares to the total PCF of the poinsettia but are regarded as an important target for substitution from major actors in the value chain in Germany [27]. In the same way, consumers also prefer paper packaging or no packaging of cut flowers over plastic packaging [28]. Another example is transportation: due to efficient logistic processes, the total share of production-side transport is below 5% of the total PCF for the poinsettia plant. However, the transportation of raw materials or consumer goods, particularly from overseas countries, is often regarded as one of the main contributors to carbon emissions by consumers or the general public [29]. In contrast, activities or materials that consumers do not see or are not aware of, are often not regarded as being important contributors to carbon emissions or other environmental problems. For example, the packaging at the production and wholesale stage of the poinsettia value chain has a higher contribution to the CO2e emissions of this plant than the plastic sleeves around the plant, but the latter is visible for consumers at the point of sale. A similar phenomenon can be observed, for example, in the use of plastic packaging in the apparel value chain [30].
As poinsettias are ornamental plants that are produced and sold outside the main season in the summer, the PCF of the poinsettia on the production side is hardly comparable to that of other ornamentals, due to the high energy requirements of poinsettias in greenhouse production. In contrast, the shopping trips to different retail outlets are thought to be rather similar for other ornamental plants. The different retail outlets used by consumers for this purpose have a significant influence on the overall variability of the PCF, as already described in the results section (Table 5). This variability within the shopping trip has also been proven by Mohr [31] for groceries and by Soode et al. [9] for asparagus, strawberries, and Phalaenopsis. Furthermore, the main factors for the differences between the retail outlets (basket of goods, distance, combined trip) are in line with the studies by Mohr [32] and Lampert et al. [18].
Although CO2e emissions in the consumer phase are often the most important contributor to the PCF of the entire value chain of ornamental plants [33], consumers are hardly aware of this fact; thus, they overlook their important role in producing and also in reducing the CO2e emissions related to such products. Changing consumer behavior to become more sustainable, such as by avoiding unnecessary trips for one single good, is a very long process and is not explicitly related to just horticultural products; it is relevant to the shopping behaviors related to all products purchased by consumers. This would require not only information activities, but also efforts from all actors that influence the purchasing of consumer goods in general. Hence, in the short term, it seems more promising to optimize the production side of the value chain of ornamental plants in order to reduce climate emissions.
5. Limitations of the Study
Even though our results are in line with some comparable studies, there might be some uncertainties in the data collection. In the young plant stage, we acquired primary data from a young plant company through a standardized questionnaire and a personal interview. However, we could not verify the data directly in the production site in Uganda. In the production stage, we examined two horticultural companies that have already optimized some of the hotspots, such as heating energy, so this data might underestimate the input of heating systems of other poinsettia nurseries. Here, we refer to the scenario with the conventional energy sources, as 41% of German greenhouses are judged as to be operating in suboptimal technical conditions (which accompanies older heating systems and fossil fuels) [34]. To generalize the findings in this field, further studies and calculations are recommended.
In the consumer stage, data collection was conducted with the help of an online survey and a fieldwork institute to get a validated sample of poinsettia consumers by a multi-access panel. As the survey was conducted in May and the typical season for poinsettias is before Christmas, panelists’ uncertainties while filling in the questionnaire, concerning factors such as total size of the basket of goods or number of stops during the shopping trip, must be kept in mind when interpreting the results. To further validate these data, a consumer study with the help of a diary method, where every poinsettia purchase is documented, would be useful in the future. In addition, there is a need for a science-based consensus on applicable allocation methods concerning multi-purpose shopping trips. We used the method of Sima et al. [35], which was also used by Mohr [32].
In the context of environmental assessment, carbon emissions are just one out of several impact categories, but they are the most politically important. In the case of ornamental plants, looking at the use of water, for example, will become more important in the future, as water scarcity increasingly becomes the reality in Germany. This should be part of further studies in this field.
6. Conclusions
The product under investigation, the poinsettia, confirmed once more that a horticultural product cannot have a static PCF value. Different heating systems, distribution issues, and consumer behaviors lead to a wide range in the PCF. In our case, it varies from 0.88 kg to 3 kg for the exact same product. Thus, our study shows that, if the hotspots concerning energy (regenerative heating systems and electrical power) are already resolved (which is mostly not true for German horticultural companies), other issues, such as packaging, gain importance. For these parts of the value chain, there is much potential to lower emissions, for example, by establishing re-usable trays for transport. Therefore, our study emphasizes the necessity of the ongoing discussions in this field of the horticultural industry. Another discussion, which has lasted for years, relates to the question of whether it is ecologically meaningful to produce plant cuttings (such as those for poinsettias) in other continents. There are many processes going on in the care of the mother plant and the cuttings production, but our results show that through the economy of scales, even transport by air has a very low influence on the product’s total PCF. Contrary to common opinion, the cuttings production in Africa is not ecologically worse than in Europe, not least due to savings in heating energy in Africa compared to Europe.
Besides the production factors, the consumer can be held responsible for up to 70% of the product’s total emissions in the worst-case scenario. Therefore, only a cradle-to-grave approach leads to correct overall results for the product; otherwise, the consumer influence might be significantly underestimated. It must be kept in mind that all transport processes on the production stage totaled together add up to fewer CO2e emissions per plant than the so-called ‘last dirty mile’, which is entirely the consumer’s responsibility. With this background, ideas for more efficient logistics in distributing horticultural products to the front door of the end user must be developed in the future.
This work especially shows that it is extremely important to look at the whole value chain of products. Only this approach ensures getting the full picture of the phases in which emissions arise, thus allowing more insight into where sustainable solutions must be found. Policy makers should, therefore, not only single out producers to demand a reduction in emissions, but they should also be aware that the individual consumer has at least the same responsibility in this field.
Author Contributions
Methodology, data generation, PCF calculation, validation, formal analysis, writing—original draft preparation, writing—review and editing: P.L.; project administration, funding acquisition, supervision, data curation, writing—review and editing: K.M. All authors have read and agreed to the published version of the manuscript.
Funding
This research was funded by Federal Ministry of Education and Research, Germany, grant number 01UT1415B.
Informed Consent Statement
Informed consent was obtained from all subjects involved in the study.
Data Availability Statement
Data will be made available upon reasonable request.
Conflicts of Interest
The authors declare no conflict of interest.
References
- ClimateWatch. Höhe der Weltweiten Treibhausgasemissionen Nach Quellgruppe im Jahr 2018. 2021. Available online: https://de.statista.com/statistik/daten/studie/311844/umfrage/globale-treibhausgasemissionen-nach-quellgruppe/ (accessed on 2 October 2022).
- Federal Ministry for the Environment, Nature Conservation, Building and Nuclear Safety (BMUB). Climate Action Plan 2050. Berlin, Germany. 2016. Available online: https://ec.europa.eu/clima/sites/lts/lts_de_en.pdf (accessed on 13 October 2022).
- Zentrum für Betriebswirtschaft im Gartenbau e. V. (ZBG). Der Gartenbau in Deutschland: Auswertung des Gartenbaumoduls der Agrarstrukturerhebung 2016; ZBG: Berlin, Germany, 2021. [Google Scholar]
- Centre for the Promotion of Imports from Developing Countries (CBI). Exporting Roses to Germany; CBI: New Delhi, India, 2017. [Google Scholar]
- Theurl, M. CO2-Bilanz der Tomatenproduktion: Analyse Acht Verschiedener Produktionssysteme in Österreich, Spanien und Italien; Social Ecology Working Paper 110; Klagenfurt University: Klagenfurt am Wörthersee, Austria, 2008. [Google Scholar]
- Bell, E.M.; Horvath, A. Modeling the carbon footprint of fresh produce: Effects of transportation, localness, and seasonality on US orange markets. Environ. Res. Lett. 2020, 15, 34040. [Google Scholar] [CrossRef]
- Schäfer, F.; Blanke, M. Farming and marketing system affects carbon and water footprint—A case study using Hokaido pumpkin. J. Clean. Prod. 2012, 28, 113–119. [Google Scholar] [CrossRef]
- Landesanstalt für Landwirtschaft E. Zierpflanzenbau. 2021. Available online: https://ltz.landwirtschaft-bw.de/pb/,Lde/Startseite/Kulturpflanzen/Zierpflanzenbau (accessed on 10 February 2022).
- Soode, E.; Lampert, P.; Weber-Blaschke, G.; Richter, K. Carbon footprints of the horticultural products strawberries, asparagus, roses and orchids in Germany. J. Clean. Prod. 2015, 87, 168–179. [Google Scholar] [CrossRef]
- Lazzerini, G.; Lucchetti, S.; Nicese, F.P. Analysis of greenhouse gas emissions from ornamental plant production: A nursery level approach. Urban For. Urban Green. 2014, 13, 517–525. [Google Scholar] [CrossRef]
- Ingram, D.L.; Hall, C.R.; Knight, J. Analysis of Production System Components of Container-grown Chrysanthemum for Their Impact on Carbon Footprint and Variable Costs Using Life Cycle Assessment. HortScience 2018, 53, 1139–1142. [Google Scholar] [CrossRef]
- Ingram, D.L.; Hall, C.R.; Knight, J. Global Warming Potential, Variable Costs, and Water Use of a Model Greenhouse Production System for 11.4-cm Annual Plants Using Life Cycle Assessment. HortScience 2018, 53, 441–444. [Google Scholar] [CrossRef]
- Blonk, H.; Kool, A.; Luske, B.; Ponsionen, T.; Scholten, J. Methodology for Assessing Carbon Footprints of Horticultural Products: A Study of Methodological Issues and Solutions for the Development of the Dutch Carbon Footprint Protocol for Horticultural Products; Blonk Milieu Advies: Gouda, The Netherlands, 2010. [Google Scholar]
- Wandl, M.-T.; Haberl, H. Greenhouse gas emissions of small scale ornamental plant production in Austria—A case study. J. Clean. Prod. 2017, 141, 1123–1133. [Google Scholar] [CrossRef]
- TASPO. Poinsettien-Saison 2021: Hohe Nachfrage und Gestiegene Preise. 2022. Available online: https://taspo.de/gruene-branche/poinsettien-saison-2021-hohe-nachfrage-und-gestiegene-preise/ (accessed on 10 February 2022).
- Berners-Lee, M. How Bad Are Bananas? The Carbon Footprint of Everything; Profile Books: London, UK, 2020. [Google Scholar]
- Pape, J. Der PCF—Die Methodik bei Märkisches Landbrot; Oekom Verlag: Berlin, Germany, 2012. [Google Scholar]
- Lampert, P.; Soode, E.; Menrad, K.; Theuvsen, L. Distributing asparagus: A climate perspective considering producer and consumer aspects. Agroecol. Sustain. Food Syst. 2016, 40, 169–186. [Google Scholar] [CrossRef]
- Foster, C.; Green, K.; Bleda, M. Environmental Impacts of Food Production and Consumption; The University of Manchester: Manchester, UK, 2006. [Google Scholar]
- Hall, C.R.; Ingram, D. Production Costs of Field-grown Cercis canadensis L. ‘Forest Pansy’ Identified during Life Cycle Assessment Analysis. HortScience 2014, 49, 622–627. [Google Scholar] [CrossRef]
- Ingram, D.L.; Hall, C.R.; Knight, J. Understanding Carbon Footprint in Production and Use of Landscape Plants. HortTechnology 2019, 29, 6–10. [Google Scholar] [CrossRef]
- British Standard Institution. Assessment of Life Cycle Greenhouse Gas Emissions from Horticultural Products: Supplementary Requirements for the Cradle to Gate Stages of GHG Assessments of Horticultural Products Undertaken in Accordance with PAS 2050; BSI: London, UK, 2012; Available online: https://knowledge.bsigroup.com/products/assessment-of-life-cycle-greenhouse-gas-emissions-from-horticultural-products-supplementary-requirements-for-the-cradle-to-gate-stages-of-ghg-assessments-of-horticultural-products-undertaken-in-accordance-with-pas-2050/standard/details (accessed on 18 January 2022).
- European Standards. PAS 2050:2011 Specification for the Assessment of the Life Cycle Greenhouse Gas Emissions of Goods and Services. 19 October 2011. Available online: https://www.en-standard.eu/pas-2050-2011-specification-for-the-assessment-of-the-life-cycle-greenhouse-gas-emissions-of-goods-and-services/ (accessed on 13 October 2022).
- Williams, A. Comparative Study of Cut Roses for the British Market Produced in Kenya and the Netherlands; Cranfield University: Bedford, UK, 2007. [Google Scholar]
- Torrellas, M.; Antón, A.; Ruijs, M.; García Victoria, N.; Stanghellini, C.; Montero, J.I. Environmental and economic assessment of protected crops in four European scenarios. J. Clean. Prod. 2012, 28, 45–55. [Google Scholar] [CrossRef]
- Sahle, A.; Potting, J. Environmental life cycle assessment of Ethiopian rose cultivation. Sci. Total Environ. 2013, 443, 163–172. [Google Scholar] [CrossRef] [PubMed]
- Landgard. Landgard Entwickelt Nachhaltigere Papiertüten in Zeitungsoptik für Weihnachtssterne. 2019. Available online: https://www.landgard.de/neuigkeiten~Nachhaltigere-Papiert%C3%BCten-f%C3%BCr-Weihnachtssterne-~ (accessed on 13 October 2022).
- Berki-Kiss, D.; Menrad, K. Consumer Preferences of Sustainability Labeled Cut Roses in Germany. Sustainability 2019, 11, 3358. [Google Scholar] [CrossRef]
- Der Spiegel. Klimaschädliche Transporte: Pro Tag fliegen 140 Tonnen Lebensmittel nach Deutschland. DER SPIEGEL. 14 December 2010. Available online: www.spiegel.de/wissenschaft/natur/klimaschaedliche-transporte-pro-tag-fliegen-140-tonnen-lebensmittel-nach-deutschland-a-734553.html (accessed on 13 October 2022).
- Decker, T.; Lippl, M.; Albrecht, S.; Bauer, K.; Drechsel, P.; Frommeyer, B.; Habermehl, T.; Heider, D.; Holterbosch, J.; Klaene, K.; et al. Verbraucherreaktionen bei Plastik und dessen Vermeidungsmöglichkeiten am Point of Sale (VerPlaPoS); Abschlussbericht; FONA: Berlin, Germany, 2021. [Google Scholar]
- Mohr, M. Empirische Erhebungen zum Consumer Carbon Footprint (CCF) beim Lebensmitteleinkauf; Manuel Mohr: Berlin, Germany, 2018. [Google Scholar] [CrossRef]
- Mohr, M. Consumer Carbon Footprint beim Einkauf von Bioprodukten, 1st ed.; Shaker Verlag GmbH: Herzogenrath, Germany, 2013. [Google Scholar]
- Lampert, P.; Soode, E.; Menrad, K. The carbon-conscious-consumer? A causal model for the product carbon footprint of asparagus at the consumer stage. Int. J. Consum. Stud. 2015, 39, 269–280. [Google Scholar] [CrossRef]
- Geidel, K.; Flenker, J.; Bokelmann, W. Ergebnisse einer Expertenbefragung im Rahmen von ZINEG; Hortigate: Naples, FL, USA, 2011. [Google Scholar]
- Sima, A.; Möhrmann, I.; Thomae, D. Einkfaufswege als Teil des Consumer Carbon Footprints (CCF). Zum Anteil des Endverbrauchers an der Klimarelvanz von Prozessketten im Lebensmittelbereich. Ernahr. Umsch. 2012, 59, 524–530. [Google Scholar] [CrossRef]


Disclaimer/Publisher’s Note: The statements, opinions and data contained in all publications are solely those of the individual author(s) and contributor(s) and not of MDPI and/or the editor(s). MDPI and/or the editor(s) disclaim responsibility for any injury to people or property resulting from any ideas, methods, instructions or products referred to in the content. |
© 2022 by the authors. Licensee MDPI, Basel, Switzerland. This article is an open access article distributed under the terms and conditions of the Creative Commons Attribution (CC BY) license (https://creativecommons.org/licenses/by/4.0/).