

Restorative Effects of Park Visiting on Physiology, Psychology, and Society and the Factors Influencing Park Visiting


Abstract
1. Introduction
2. Methods
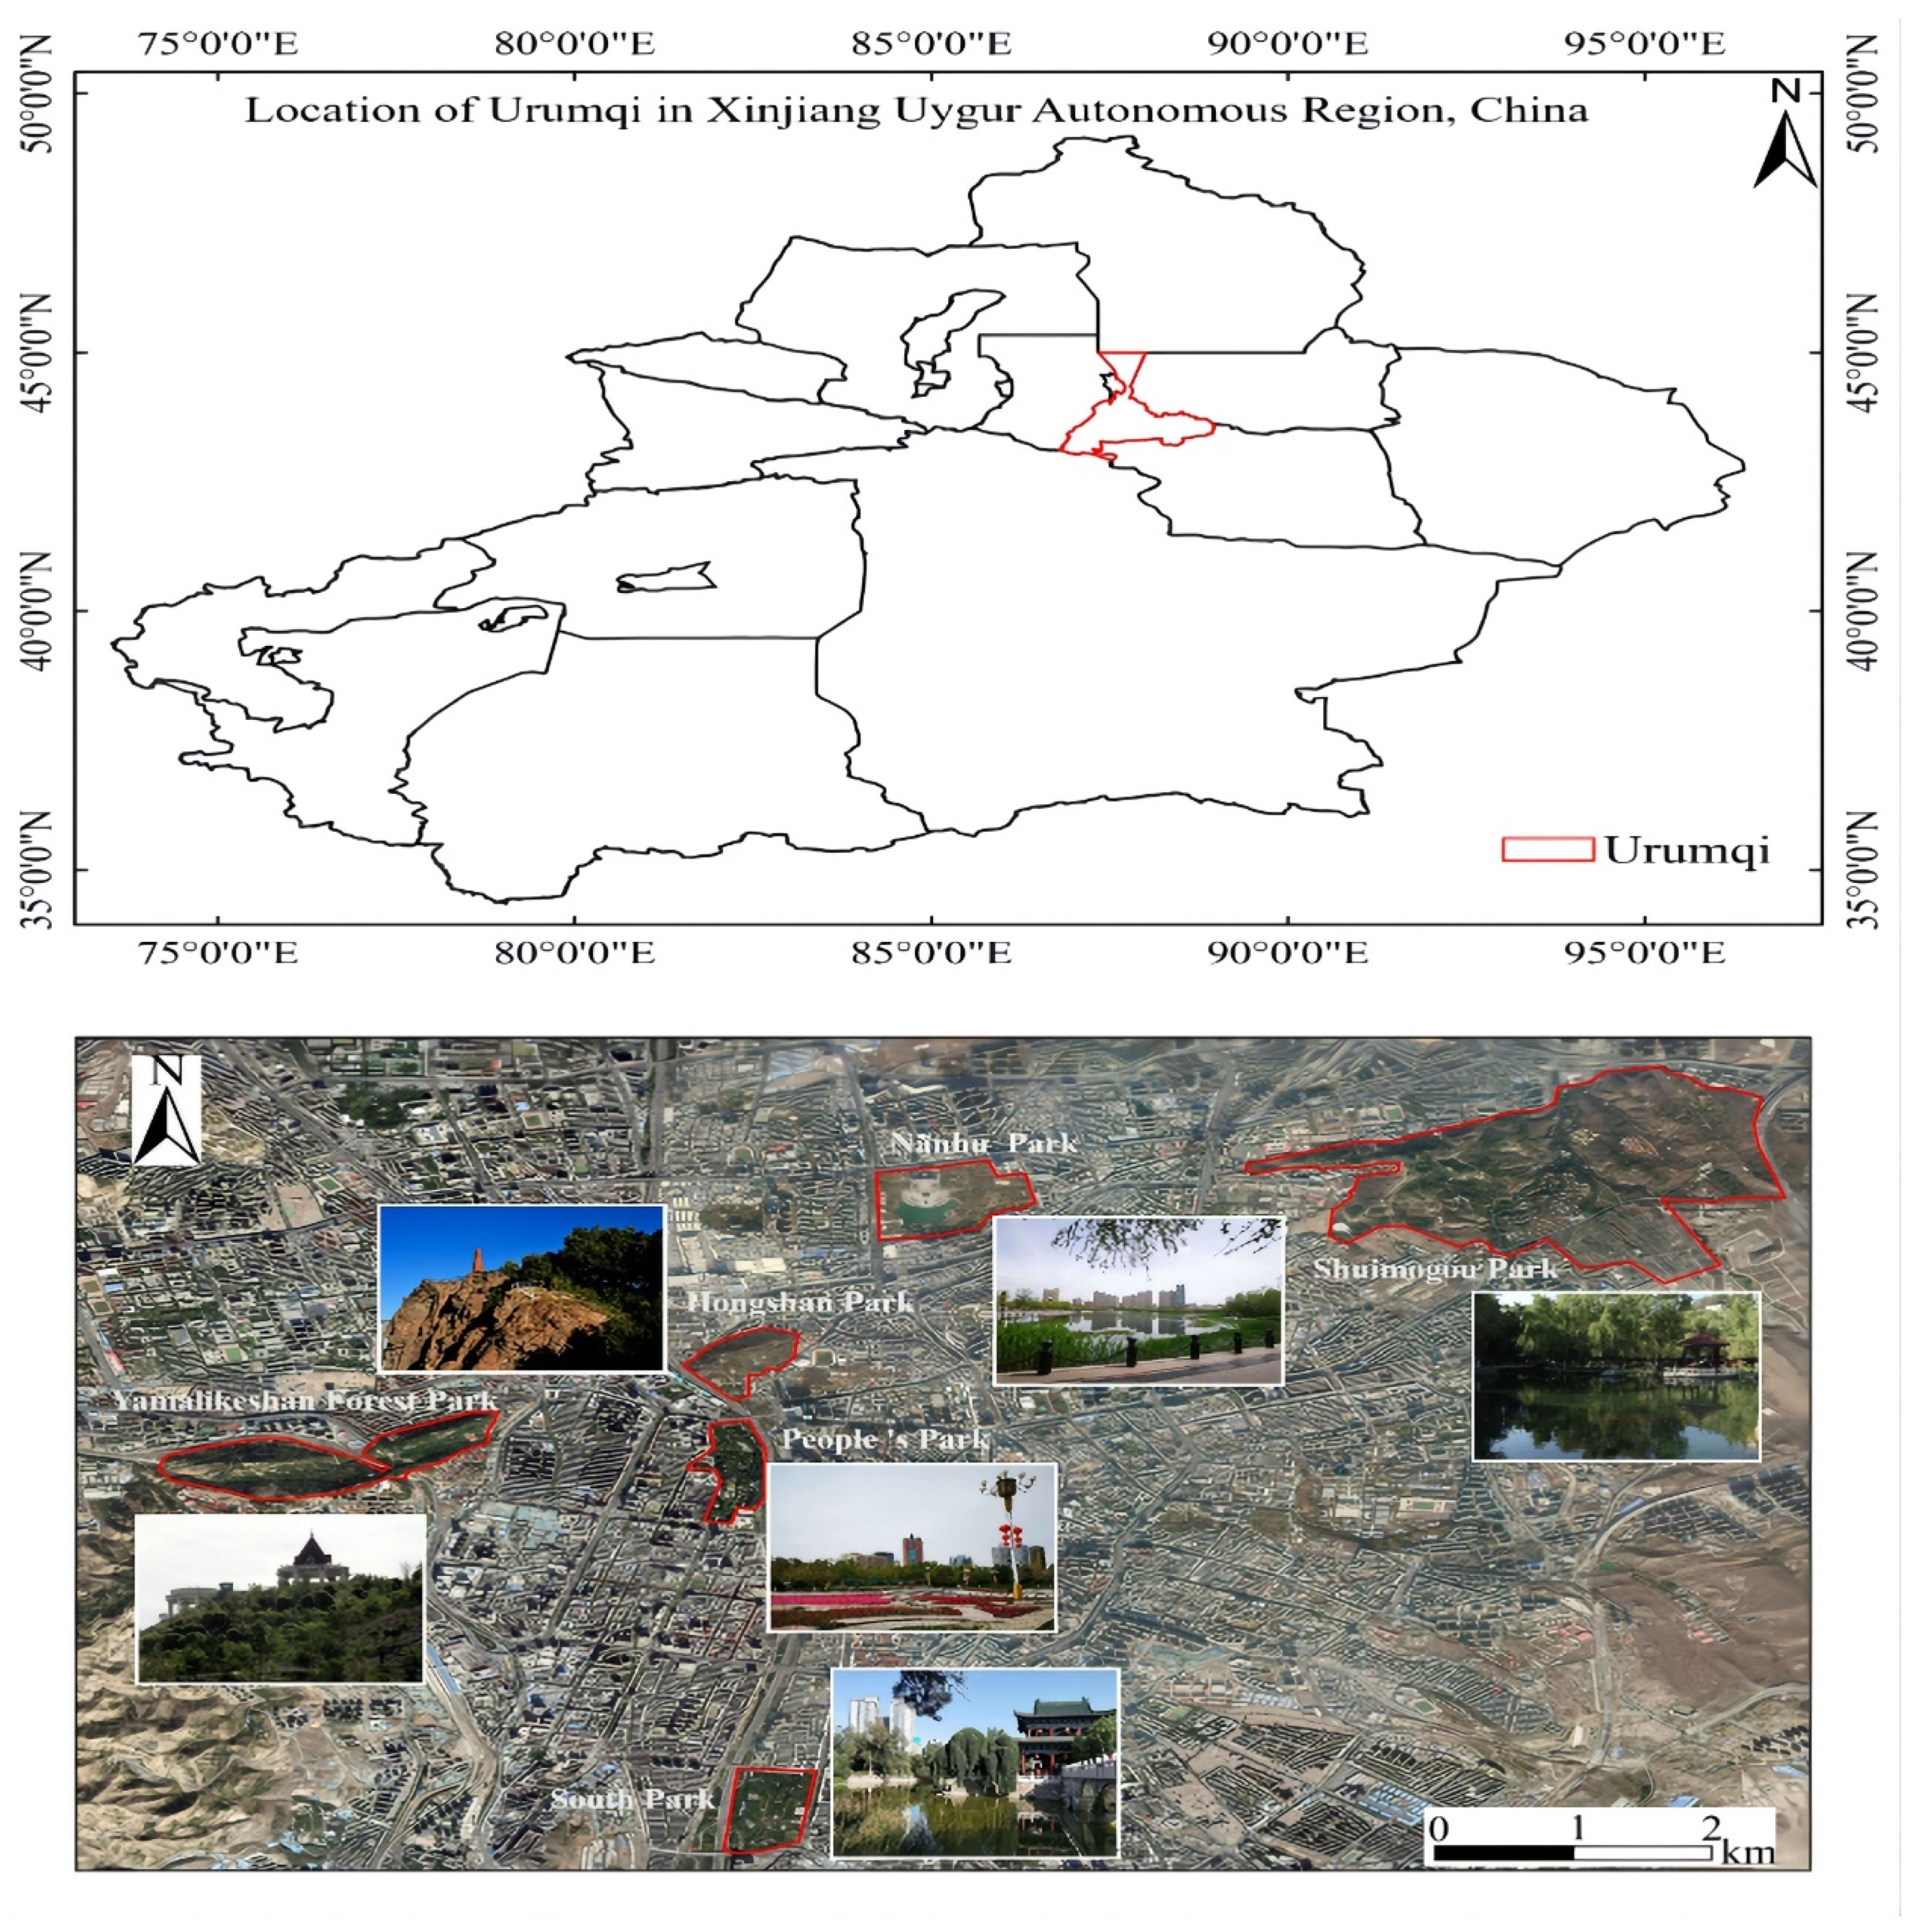
2.1. Study Area
2.2. Experiment Design and Data Collection
2.2.1. The Psychological, Physical and Social Recovery of Residents in Different Types of Parks
2.2.2. Motivations and Impediments
2.2.3. Model Variables
2.3. Statistical Analysis
3. Results
3.1. Descriptive Statistics
3.2. Relationship between Different Types of Parks and Residents’ Physical, Psychological, and Social
3.3. Motivation for and Impediments to Park Visits
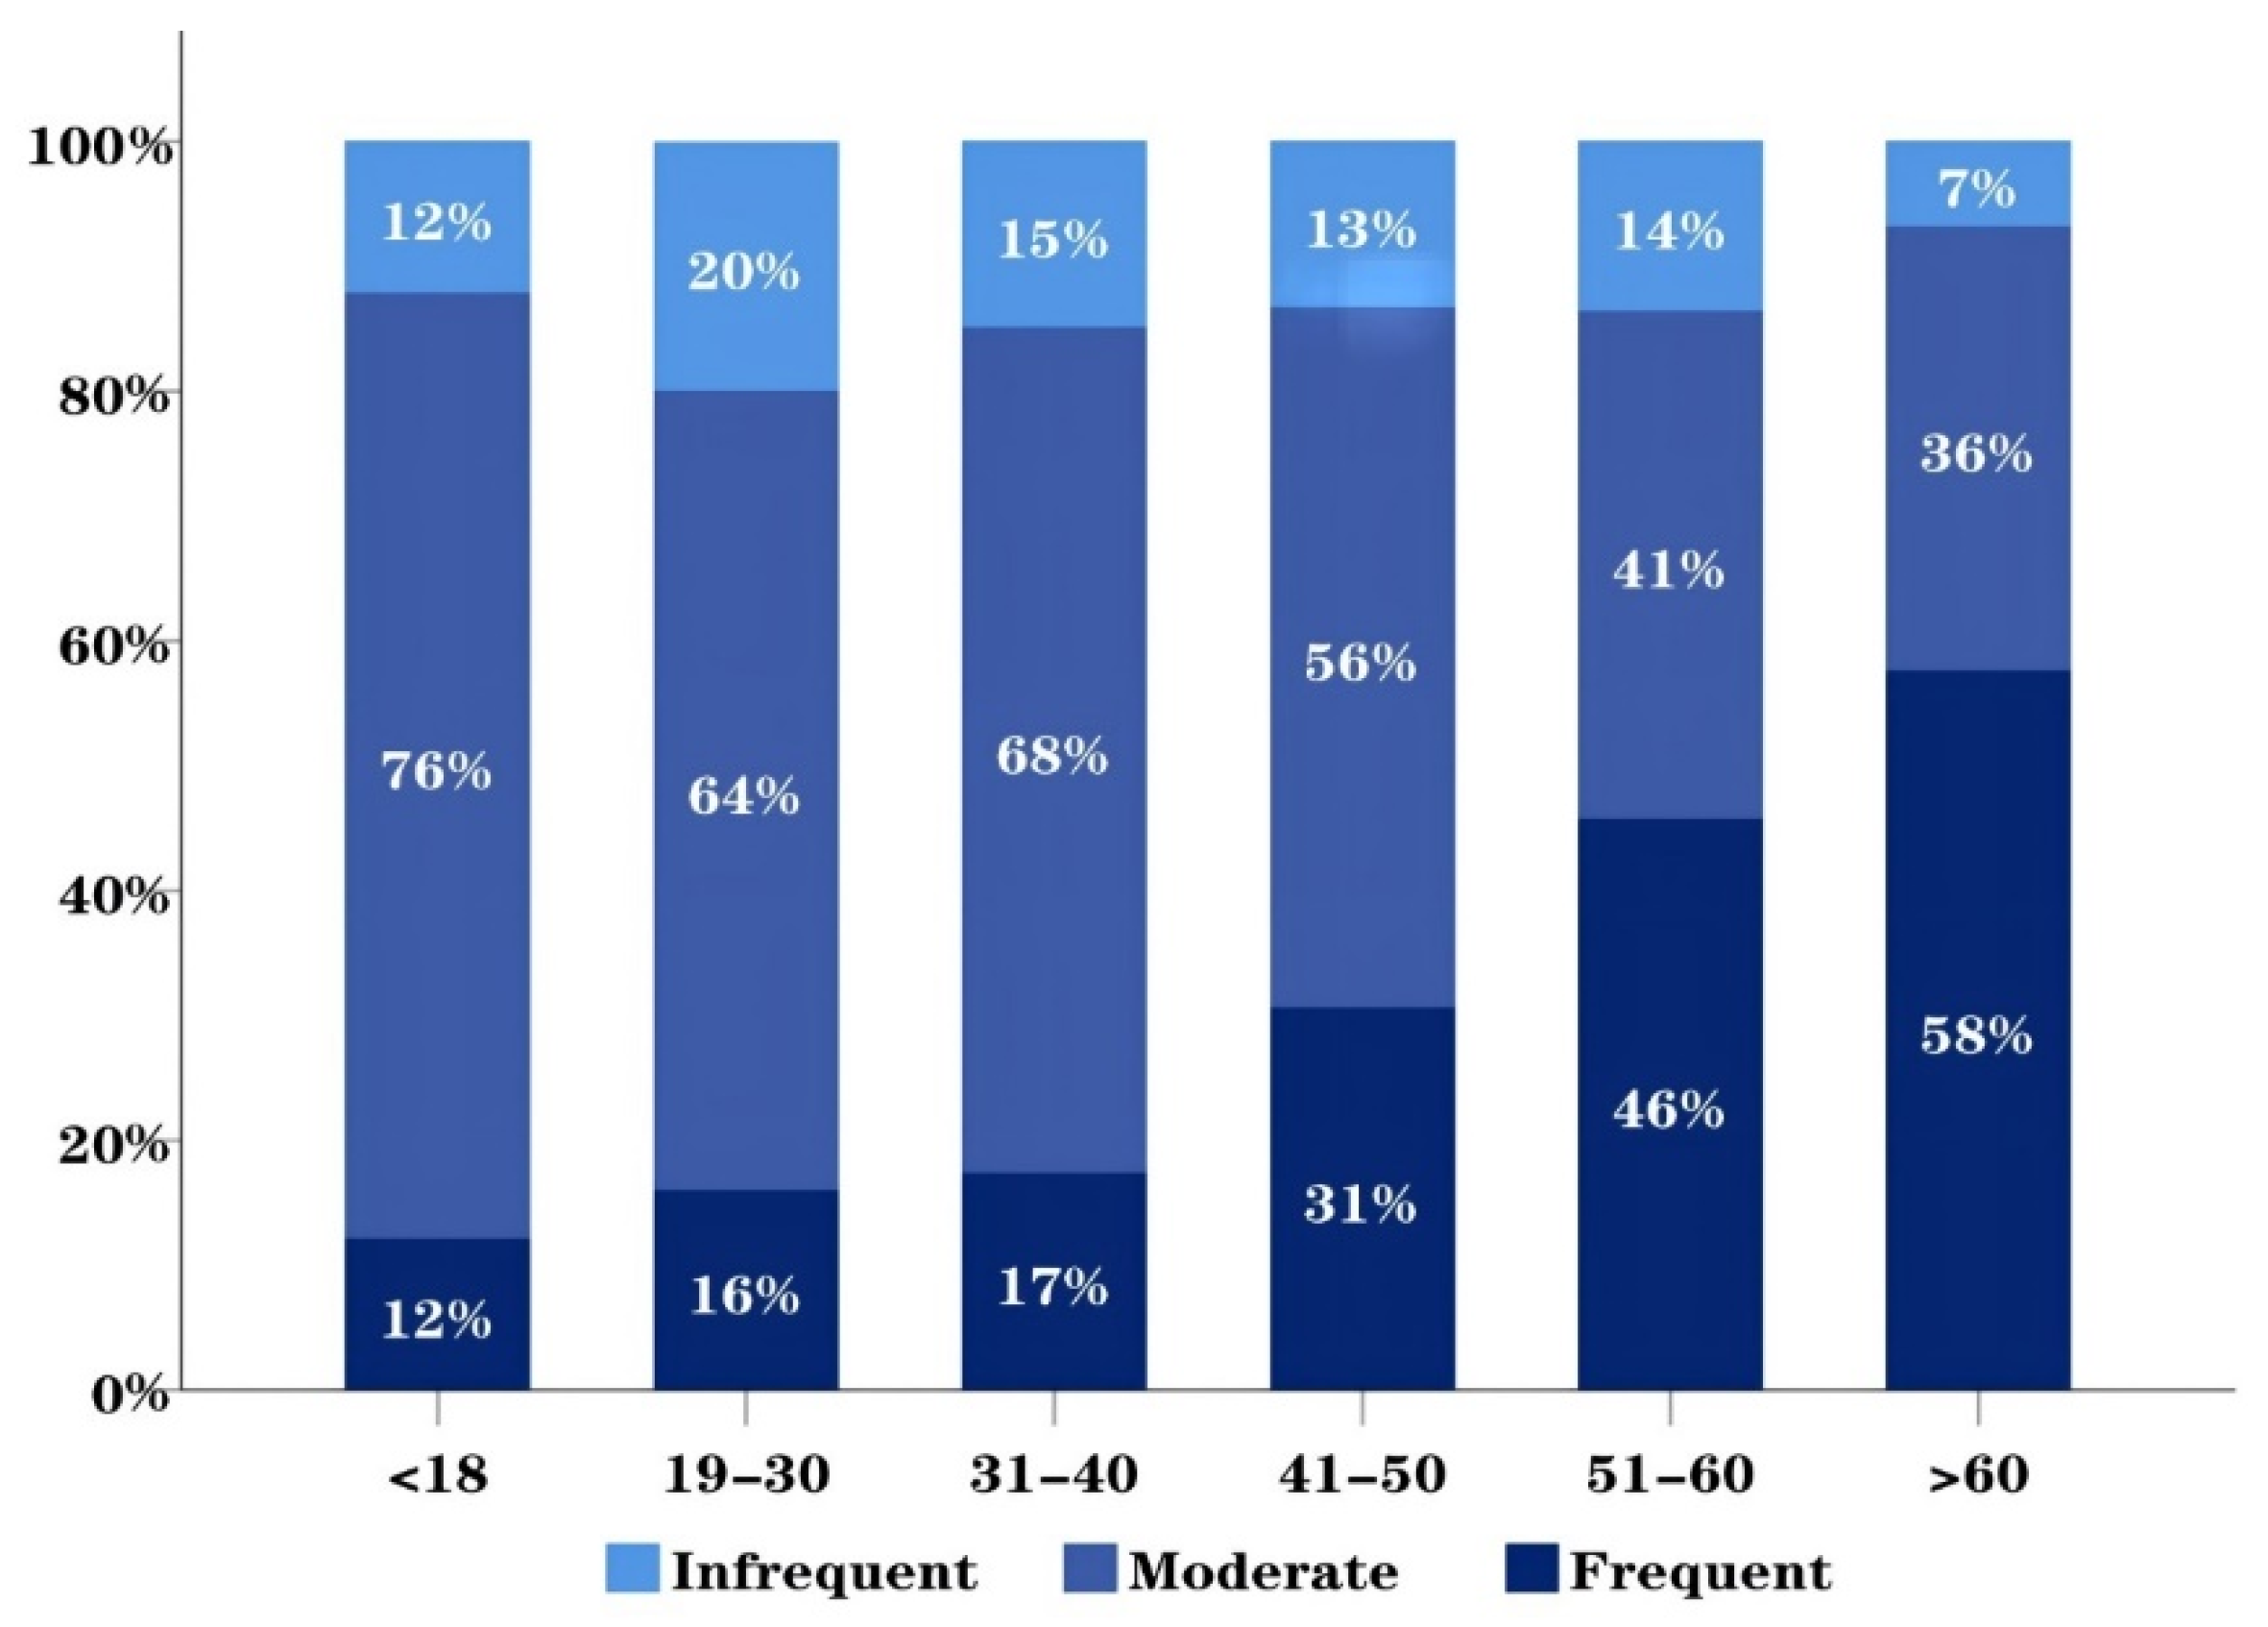
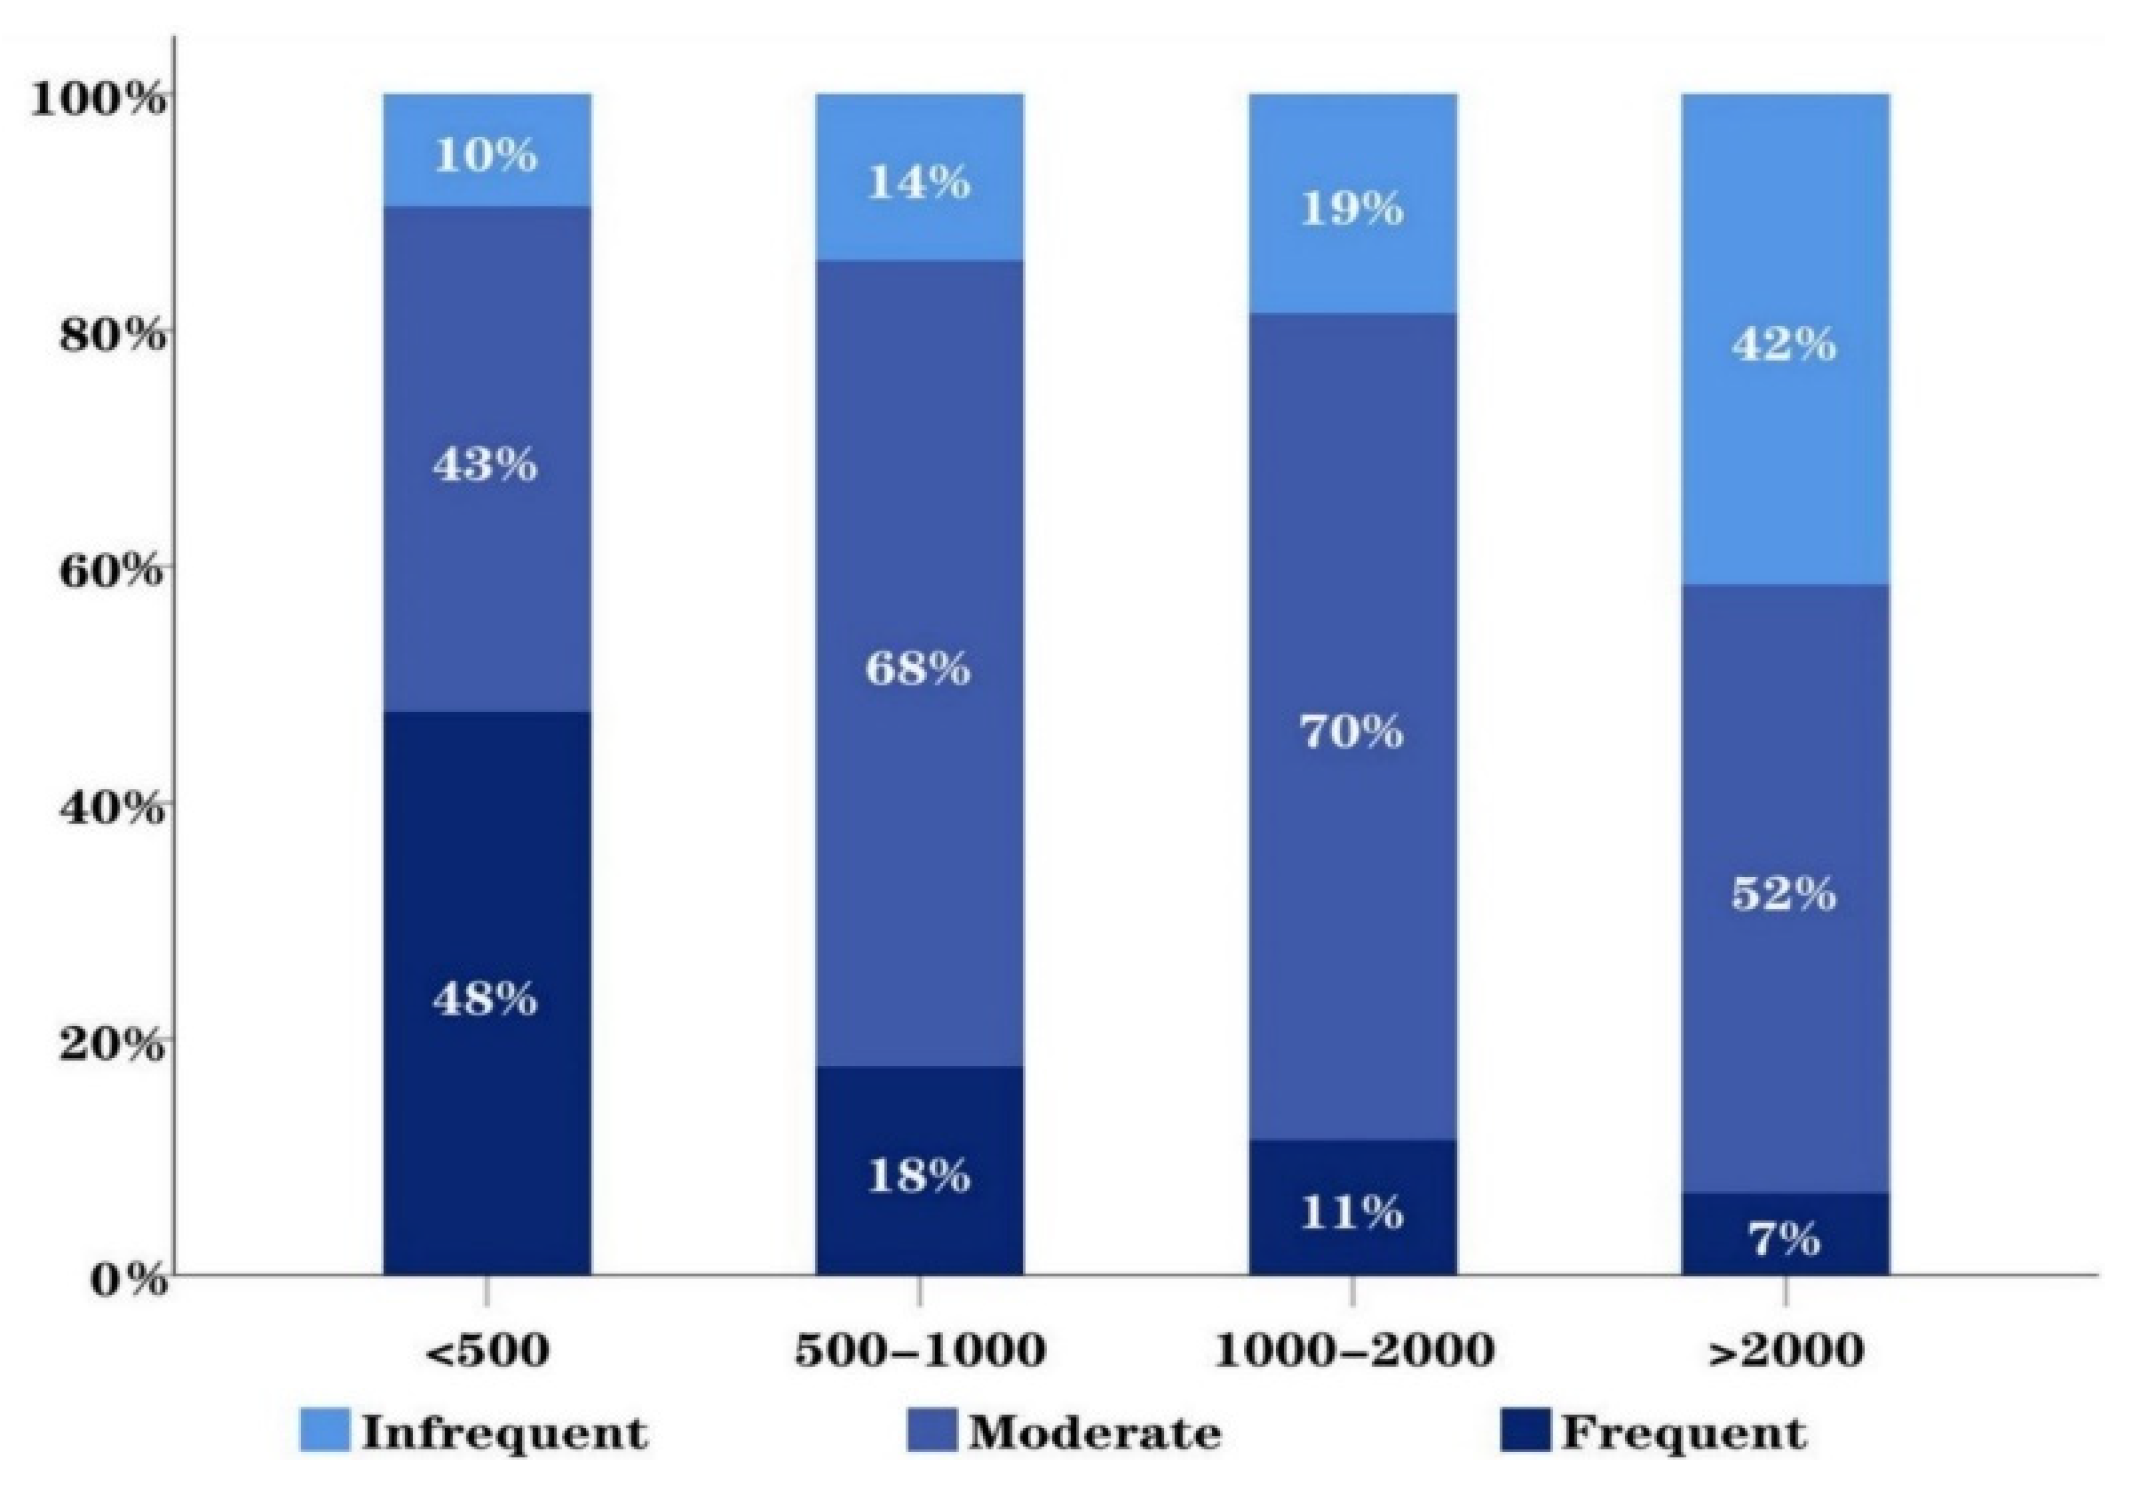
3.4. The Association and Relative Importance of Socio-Demographic, Individual, and Environmental Factors in the Frequency of Citizens’ Park Visitation
4. Discussion
4.1. Psychological, Physical, and Social Recovery Differences in Different Types of Parks
4.2. Motivations for and Impediments to Citizens’ Park Visitation
4.3. Joint Effects of Socio-Demographic, Personal, Spatial Attributes of Residence, and Park Feature Factors
4.4. The Effects of Socio-Demographic Factors, Personal Factors, Spatial Attributes of Residence, and Park Feature Factors on Park Use
4.5. Contributions to the Research in this Field
4.6. Implications for Policy and Planning
4.7. Limitations and Future Research
5. Conclusions
Author Contributions
Funding
Institutional Review Board Statement
Informed Consent Statement
Data Availability Statement
Acknowledgments
Conflicts of Interest
References
- World Health Organization. Urban Population Growth: Situation and Trends in Key Indicators; Global Health Observatory: Geneva, Switzerland, 2012. [Google Scholar]
- Liu, Z.; Ding, M.; He, C.; Li, J.; Wu, J. The impairment of environmental sustainability due to rapid urbanization in the dryland region of northern China. Landsc. Urban Plan. 2019, 187, 165–180. [Google Scholar] [CrossRef]
- Wu, J. Urban ecology and sustainability: The state-of-the-science and future directions. Landsc. Urban Plan. 2014, 125, 209–221. [Google Scholar] [CrossRef]
- Beaglehole, R.; Bonita, R.; Horton, R.; Ezzati, M.; Bhala, N.; Amuyunzu-Nyamongo, M.; Reddy, K.S. Measuring progress on NCDs: One goal and five targets. Lancet 2012, 380, 1283–1285. [Google Scholar] [CrossRef] [PubMed]
- Tian, X.; Zhao, G.; Li, Y.; Wang, L.; Shi, Y. Overweight and obesity difference of Chinese population between different urbanization levels. J. Rural. Health 2014, 30, 101–112. [Google Scholar] [CrossRef] [PubMed]
- Konijnendijk, C.C.; Annerstedt, M.; Nielsen, A.B.; Maruthaveeran, S. Benefits of Urban Parks. A Systematic Review. A Report for IFPRA; (The International Federation of Parks and Recreation Administration)—IFPRA: Copenhagen, Denmark, 2013. [Google Scholar]
- Hough, R.L. Biodiversity and human health: Evidence for causality? Biodivers. Conserv. 2014, 23, 267–288. [Google Scholar] [CrossRef]
- Keniger, L.E.; Gaston, K.J.; Irvine, K.N.; Fuller, R.A. What are the benefits of interacting with nature? Int. J. Environ. Res. Public Health 2013, 10, 913–935. [Google Scholar] [CrossRef]
- Plunz, R.A.; Zhou, Y.; Vintimilla, M.I.C.; Mckeown, K.; Yu, T.; Uguccioni, L.; Sutto, M.P. Twitter sentiment in New York City parks as measure of well-being. Landsc. Urban Plan. 2019, 189, 235–246. [Google Scholar] [CrossRef]
- Rahnema, S.; Sedaghathoor, S.; Allahyari, M.S.; Damalas, C.A.; El Bilali, H. Preferences and emotion perceptions of ornamental plant species for green space designing among urban park users in Iran. Urban For. Urban Green. 2019, 39, 98–108. [Google Scholar] [CrossRef]
- Cohen, P.; Potchter, O.; Schnell, I. The impact of an urban park on air pollution and noise levels in the Mediterranean city of Tel-Aviv, Israel. Environ. Pollut. 2014, 195, 73–83. [Google Scholar] [CrossRef]
- Sun, R.; Chen, L. Effects of green space dynamics on urban heat islands: Mitigation and diversification. Ecosyst. Serv. 2017, 23, 38–46. [Google Scholar] [CrossRef]
- Ulrich, R.S. View through a window may influence recovery from surgery. Science 1984, 224, 420–421. [Google Scholar] [CrossRef] [PubMed]
- Zhu, J.; Xu, C. Sina microblog sentiment in Beijing city parks as measure of demand for urban green space during the COVID-19. Urban For. Urban Green. 2021, 58, 126913. [Google Scholar] [CrossRef]
- Kaplan, R.; Kaplan, S. The Experience of Nature: A Psychological Perspective; Cambridge University Press: Cambridge, UK, 1989. [Google Scholar]
- Gidlow, C.J.; Jones, M.V.; Hurst, G.; Masterson, D.; Clark-Carter, D.; Tarvainen, M.P.; Nieuwenhuijsen, M. Where to put your best foot forward: Psycho-physiological responses to walking in natural and urban environments. J. Environ. Psychol. 2016, 45, 22–29. [Google Scholar] [CrossRef]
- Nieminen, T.; Martelin, T.; Koskinen, S.; Aro, H.; Alanen, E.; Hyyppä, M.T. Social capital as a determinant of self-rated health and psychological well-being. Int. J. Public Health 2010, 55, 531–542. [Google Scholar] [CrossRef]
- Kaźmierczak, A. The contribution of local parks to neighbourhood social ties. Landsc. Urban Plan. 2013, 109, 31–44. [Google Scholar] [CrossRef]
- Zanon, D.; Doucouliagos, C.; Hall, J.; Lockstone-Binney, L. Constraints to park visitation: A meta-analysis of North American studies. Leis. Sci. 2013, 35, 475–493. [Google Scholar] [CrossRef]
- Huang, Y.; Xu, J. Exploring the factors of using frequency of large-scale urban public space: Post-occupancy evaluation of the flower city square and the Pearl River park. S. Archit. 2013, 4, 86–90. [Google Scholar]
- Bedimo-Rung, A.L.; Mowen, A.J.; Cohen, D.A. The significance of parks to physical activity and public health: A conceptual model. Am. J. Prev. Med. 2005, 28, 159–168. [Google Scholar] [CrossRef] [PubMed]
- Zhang, X. Toward a Regenerative Sustainability Paradigm for the Built Environment: From Vision to Reality; Elseveier: Amsterdam, The Netherlands, 2014; Volume 65, pp. 3–6. [Google Scholar]
- Wang, D.; Brown, G.; Zhong, G.; Liu, Y.; Mateo-Babiano, I. Factors influencing perceived access to urban parks: A comparative study of Brisbane (Australia) and Zhongshan (China). Habitat Int. 2015, 50, 335–346. [Google Scholar] [CrossRef]
- Roovers, P.; Hermy, M.; Gulinck, H. Visitor profile, perceptions and expectations in forests from a gradient of increasing urbanisation in central Belgium. Landsc. Urban Plan. 2002, 59, 129–145. [Google Scholar] [CrossRef]
- Maller, C.; Townsend, M.; Pryor, A.; Brown, P.; St Leger, L. Healthy nature healthy people:‘contact with nature’as an upstream health promotion intervention for populations. Health Promot. Int. 2006, 21, 45–54. [Google Scholar] [CrossRef]
- Gu, X.; Li, Q.; Chand, S. Factors influencing residents’ access to and use of country parks in Shanghai, China. Cities 2020, 97, 102501. [Google Scholar] [CrossRef]
- Tan, P.Y.; Samsudin, R. Effects of spatial scale on assessment of spatial equity of urban park provision. Landsc. Urban Plan. 2017, 158, 139–154. [Google Scholar] [CrossRef]
- Zhang, S.; Zhou, W. Recreational visits to urban parks and factors affecting park visits: Evidence from geotagged social media data. Landsc. Urban Plan. 2018, 180, 27–35. [Google Scholar] [CrossRef]
- Veitch, J.; Ball, K.; Crawford, D.; Abbott, G.; Salmon, J. Is park visitation associated with leisure-time and transportation physical activity? Prev. Med. 2013, 57, 732–734. [Google Scholar] [CrossRef] [PubMed]
- Wan, C.; Shen, G.Q.; Choi, S. Effects of physical and psychological factors on users’ attitudes, use patterns, and perceived benefits toward urban parks. Urban For. Urban Green. 2020, 51, 126691. [Google Scholar] [CrossRef]
- Gozalo, G.R.; Morillas, J.M.B.; González, D.M. Perceptions and use of urban green spaces on the basis of size. Urban For. Urban Green. 2019, 46, 126470. [Google Scholar] [CrossRef]
- Mak, B.K.; Jim, C.Y. Examining fear-evoking factors in urban parks in Hong Kong. Landsc. Urban Plan. 2018, 171, 42–56. [Google Scholar] [CrossRef]
- Lin, B.B.; Fuller, R.A.; Bush, R.; Gaston, K.J.; Shanahan, D.F. Opportunity or orientation? Who uses urban parks and why. PLoS ONE 2014, 9, e87422. [Google Scholar] [CrossRef]
- Scopelliti, M.; Carrus, G.; Adinolfi, C.; Suarez, G.; Colangelo, G.; Lafortezza, R.; Panno, A.; Sanesi, G. Staying in touch with nature and well-being in different income groups: The experience of urban parks in Bogotá. Landsc. Urban Plan. 2016, 148, 139–148. [Google Scholar] [CrossRef]
- Yuen, H.K.; Jenkins, G.R. Factors associated with changes in subjective well-being immediately after urban park visit. Int. J. Environ. Health Res. 2020, 30, 134–145. [Google Scholar] [CrossRef] [PubMed]
- Benita, F.; Bansal, G.; Tunçer, B. Public spaces and happiness: Evidence from a large-scale field experiment. Health Place 2019, 56, 9–18. [Google Scholar] [CrossRef] [PubMed]
- Liu, H.; Li, F.; Xu, L.; Han, B. The impact of socio-demographic, environmental, and individual factors on urban park visitation in Beijing, China. J. Clean. Prod. 2017, 163, S181–S188. [Google Scholar] [CrossRef]
- Wang, P.; Zhou, B.; Han, L.; Mei, R. The motivation and factors influencing visits to small urban parks in Shanghai, China. Urban For. Urban Green. 2021, 60, 127086. [Google Scholar] [CrossRef]
- Donahue, M.L.; Keeler, B.L.; Wood, S.A.; Fisher, D.M.; Hamstead, Z.A.; McPhearson, T. Using social media to understand drivers of urban park visitation in the Twin Cities, MN. Landsc. Urban Plan. 2018, 175, 1–10. [Google Scholar] [CrossRef]
- Lyu, F.; Zhang, L. Using multi-source big data to understand the factors affecting urban park use in Wuhan. Urban For. Urban Green. 2019, 43, 126367. [Google Scholar] [CrossRef]
- Deng, L.; Li, X.; Luo, H.; Fu, E.-K.; Ma, J.; Sun, L.-X.; Huang, Z.; Cai, S.-Z.; Jia, Y. Empirical study of landscape types, landscape elements and landscape components of the urban park promoting physiological and psychological restoration. Urban For. Urban Green. 2020, 48, 126488. [Google Scholar] [CrossRef]
- Qin, G. Study on the Post Occupancy Evaluation in Urban Park-A Case Study on Beijing Black Bamboo Park; Beijing Forestry University: Beijing, China, 2007. [Google Scholar]
- Ren, B.; Li, Y.; Bu, Y.; Liu, T. Research on users’ recreation action in open park of Beijing in winter. Chin. Landsc. Archit. 2012, 28, 58–61. [Google Scholar]
- Zhao, K.M.; Li, X.; Lu, X.Y.; Wang, L.; Ren, Q.; Feng, Z.M.; Ma, C. Spatial and temporal distribution characteristics of winter air pollution in the isthmus city of Urumqi. Geogr. Arid. Reg. 2014, 37, 1108–1118. [Google Scholar]
- Zhou, C.; Li, G. Willingness to pay and influencing factors of ecological compensation in watersheds: The case of Zhengzhou City, a receiving area of the South-North Water Transfer Central Project. Econ. Geogr. 2015, 35, 38–46. [Google Scholar]
- Yao, L.; Liu, J.; Wang, R.; Yin, K.; Han, B. Effective green equivalent—A measure of public green spaces for cities. Ecol. Indic. 2014, 47, 123–127. [Google Scholar] [CrossRef]
- Bertram, C.; Meyerhoff, J.; Rehdanz, K.; Wüstemann, H. Differences in the recreational value of urban parks between weekdays and weekends: A discrete choice analysis. Landsc. Urban Plan. 2017, 159, 5–14. [Google Scholar] [CrossRef]
- McCormack, G.R.; Rock, M.; Toohey, A.M.; Hignell, D. Characteristics of urban parks associated with park use and physical activity: A review of qualitative research. Health Place 2010, 16, 712–726. [Google Scholar] [CrossRef]
- George, D. Data Analysis for Psychology; Hodder Arnold Publishers: London, UK, 1997. [Google Scholar]
- De Vries, S.; Nieuwenhuizen, W.; Farjon, H.; van Hinsberg, A.; Dirkx, J. In which natural environments are people happiest? Large-Scale experience sampling in the Netherlands. Landsc. Urban Plan. 2021, 205, 103972. [Google Scholar] [CrossRef]
- Dinarvandi, M.; Jafari, H.; Salehi, S.; Pari, M.A. The role of parks in improving the quality of urban life (case study: The sixth region of tehran). J. Soc. Issues Humanit. 2014, 2, 34–40. [Google Scholar]
- Irvine, K.N.; Warber, S.L.; Devine-Wright, P.; Gaston, K.J. Understanding urban green space as a health resource: A qualitative comparison of visit motivation and derived effects among park users in Sheffield, UK. Int. J. Environ. Res. Public Health 2013, 10, 417–442. [Google Scholar] [CrossRef]
- Maas, J.; Van Dillen, S.M.; Verheij, R.A.; Groenewegen, P.P. Social contacts as a possible mechanism behind the relation between green space and health. Health Place 2009, 15, 586–595. [Google Scholar] [CrossRef]
- Dadvand, P.; Bartoll, X.; Basagaña, X.; Dalmau-Bueno, A.; Martinez, D.; Ambros, A.; Nieuwenhuijsen, M.J. Green spaces and general health: Roles of mental health status, social support, and physical activity. Environ. Int. 2016, 91, 161–167. [Google Scholar] [CrossRef]
- Gaikwad, A.; Shinde, K. Use of parks by older persons and perceived health benefits: A developing country context. Cities 2019, 84, 134–142. [Google Scholar] [CrossRef]
- You, H. Characterizing the inequalities in urban public green space provision in Shenzhen, China. Habitat Int. 2016, 56, 176–180. [Google Scholar] [CrossRef]
- Xiao, Y.; Wang, Z.; Li, Z.; Tang, Z. An assessment of urban park access in Shanghai—Implications for the social equity in urban China. Landsc. Urban Plan. 2017, 157, 383–393. [Google Scholar] [CrossRef]
- Heynen, N.C.; Lindsey, G. Correlates of urban forest canopy cover: Implications for local public works. Public Work. Manag. Policy 2003, 8, 33–47. [Google Scholar] [CrossRef]
- Danford, R.S.; Cheng, C.; Strohbach, M.W.; Ryan, R.; Nicolson, C. What Does It Take to Achieve Equitable Urban Tree Canopy Distribution? A Boston Case Study. Cities Environ. (CATE) 2014, 7, 2. [Google Scholar]
- Baur, J.W.; Tynon, J.F.; Gómez, E. Attitudes about urban nature parks: A case study of users and nonusers in Portland, Oregon. Landsc. Urban Plan. 2013, 117, 100–111. [Google Scholar] [CrossRef]
- Church, A.; Fish, R.; Haines-Young, R.; Mourato, S.; Tratalos, J.A.; Stapleton, L.M.; Kenter, J.O. UK National Ecosystem Assessment Follow-On: Work Package Report 5: Cultural Ecosystem Services and Indicators; UNEP-WCMC, LWEC: Cambridge, UK, 2014. [Google Scholar]
- Sallis, J.F.; Owen, N.; Fisher, E. Ecological models of health behavior. Health Behav. Theory Res. Pract. 2015, 5, 43–64. [Google Scholar]
- Nielsen, T.S.; Hansen, K.B. Do green areas affect health? Results from a Danish survey on the use of green areas and health indicators. Health Place 2007, 13, 839–850. [Google Scholar] [CrossRef]
- Scott, M.M.; Evenson, K.R.; Cohen, D.A.; Cox, C.E. Comparing perceived and objectively measured access to recreational facilities as predictors of physical activity in adolescent girls. J. Urban Health 2007, 84, 346–359. [Google Scholar] [CrossRef]
- Wendel, H.E.W.; Zarger, R.K.; Mihelcic, J.R. Accessibility and usability: Green space preferences, perceptions, and barriers in a rapidly urbanizing city in Latin America. Landsc. Urban Plan. 2012, 107, 272–282. [Google Scholar] [CrossRef]
- Peschardt, K.K.; Stigsdotter, U.K.; Schipperrijn, J. Identifying features of pocket parks that may be related to health promoting use. Landsc. Res. 2016, 41, 79–94. [Google Scholar] [CrossRef]
- Tarimo, M.; Wondimu, P.; Odeck, J.; Lohne, J.; Lædre, O. Sustainable roads in Serengeti National Park: - gravel roads construction and maintenance. Procedia Comput. Sci. 2017, 121, 329–336. [Google Scholar] [CrossRef]


| Urban Parks | Suburban Parks | |
|---|---|---|
| Goal | Meet people’s various entertainment, leisure, and fitness needs | Return to nature, experience and protect the natural habitat of the city |
| Function | Entertainment, recreation, and viewing | Leisure and recreation, environmental regulation, social education, fitness, disaster prevention and risk avoidance, and scientific research |
| Space layout | Mainly manual design | The design combines nature, has few artificial elements, and is close to the original ecology |
| Ecology function | Manual maintenance, unstable | Self-sustaining and stable |
| Features | According to certain indicators, the layout of urban production and living needs, mainly ornamental plants, low diversity index, lack of sound ecological structure, high investment, small area and poor stress resistance | Combined with the landscape characteristics of the urban area and the layout of natural conditions, taking the restoration of landscape process and integrity as the guiding principle, it has high diversity index, pays attention to ecological succession and the formation of natural structure, strong self stability, low investment, and large area |
| Park Category | Name of the Park | Region | Size (hm2) | Year Opened |
|---|---|---|---|---|
| Urban | Hongshan Park | Shuimogou District | 41 | 1985 |
| People’s Park | Saybagh District | 30 | 1988 | |
| Nanhu Park | Shuimogou District | 54 | 2004 | |
| South Park | Tianshan District | 32 | 2005 | |
| Suburban | Yamalikeshan Park | Saybagh District | 4000 | 1996 |
| Shuimogou Park | Shuimogou District | 3600 | 2008 |
| Variables (n = 520) | Percent/Mean (s. e.) | Variables (n = 520) | Percent/Mean (s. e.) | |||
|---|---|---|---|---|---|---|
| Socio-demographic variables | Income (RMB/ month) | <3000 3000–6000 6000–8000 8000–10,000 10,000–15,000 15,000–20,000 >20,000 | 6.2% 24.8% 24.2% 19.6% 16.9% 6.0% 2.3% | Environmental variables | Residential green space Distance from home to the park (m) (<500, 500–1000, 1000–2000, >2000) Average housing price (RMB) (<6000, 6000–8000, 8000–9000, 9000–10,000, >10,000) Walking time to the park (minute) (<30, 30–60, 60–90, >90) Number of parks within 500 m of home Number of parks within 1000 m of home Number of parks within 1500 m of home (0, 1, 2, 3, ≥4) | 19.9% 44.5%, 27.0%, 16.4%, 12.1% 1.7%, 29.4%, 39.6%, 20.2%, 9.0% 46.0%, 14.0%, 18.1%, 21.9% 53.2%, 46.8% 19.3%, 29.3%, 27.2%, 14.7%, 9.5% 2.4%, 5.4%, 37.3%, 31.3%, 23.6% |
| Education | Junior high school and below High school, Technical secondary school, Technical school Junior college Undergraduate Master’s degree and above | 14.4% 24.0% 19.2% 35.6% 6.8% | Individual variables | Mean leisure time on weekdays (hour) (<1 h, 1–2 h, 2–3 h, 3–4 h, >4 h) Mean leisure time on weekends (hour) (<3 h, 3–5 h, 5–7 h, 7–9 h, >9 h) Time spent in residential greenspace (hour) (<0.3, 0.3–1, 1–1.5, 1.5–2, 2–3, >3) Being willing to spend time in nature Self-reported level of busyness with child under 7 years | 13.4%, 18.0%, 25.5%, 12.7%, 30.4% 13.7%, 14.7%, 17.8%, 12.5%, 41.2% 2.7%, 30.0%, 16.5%, 45.4%, 3.3%, 2.1% 4.20 3.05 19.3% | |
| Age | ≤18 19–30 31–40 41–50 50–60 >60 | 6.5% 27.9% 20.4% 19.8% 13.5% 11.9% | Park features variables | Facility Maintenance Safety Aesthetics Overall greening | 3.76 3.95 4.00 3.94 4.03 | |
| Gender | Male Female | 52.3% 47.7% | Park visit frequency | 1− 3 times a Year 1− 3 times a Month 1− 2 times a Week 3− 5 times a Week Every day | 14.8% 30.6% 27.7% 13.1% 13.8% |
| Classification | Category | Scores | Urbans | Suburbs | Total | p-Value |
|---|---|---|---|---|---|---|
| Psychological | Enhancing Happiness | Mean | 3.71 | 3.62 | 3.67 | 0.815 |
| Std. Dev. | 1.101 | 1.213 | 1.152 | |||
| Relieving Stress | Mean | 4.20 | 4.33 | 4.27 | 0.067 | |
| Std. Dev. | 0.774 | 0.734 | 0.759 | |||
| Emotional relief | Mean | 3.80 | 3.91 | 3.86 | <0.001 *** | |
| Std. Dev. | 0.920 | 1.165 | 1.034 | |||
| Average | 3.90 | 3.95 | 3.93 | 0.520 | ||
| Physical | Physical relaxation | Mean | 4.22 | 4.51 | 4.37 | <0.001 *** |
| Std. Dev. | 0.838 | 0.818 | 0.840 | |||
| Improving concentration | Mean | 3.17 | 2.96 | 3.07 | <0.001 *** | |
| Std. Dev. | 1.384 | 1.117 | 1.408 | |||
| Physical rehabilitation | Mean | 4.37 | 4.07 | 4.22 | <0.001 *** | |
| Std. Dev. | 0.75 | 0.783 | 0.778 | |||
| Average | 3.92 | 3.85 | 3.89 | <0.001 *** | ||
| Social | Family interactions | Mean | 3.68 | 3.63 | 3.65 | 0.382 |
| Std. Dev. | 1.001 | 1.123 | 1.142 | |||
| Social interactions | Mean | 3.63 | 2.71 | 3.17 | <0.001 *** | |
| Std. Dev. | 1.071 | 1.183 | 1.210 | |||
| Average | 3.66 | 3.17 | 3.41 | <0.001 *** |
| Motivations | Percent | Impediments | Percent |
|---|---|---|---|
| Physical exercise: running, walking, using fitness equipment, playing Tai Chi, dancing, playing ball | 30% | Time limitation | 29% |
| Relaxation and rest | 26% | Too far from home | 17% |
| Spending time with children and family | 15% | Other activities | 15% |
| Interaction with nature: Enjoying flowers and plants, birds and fish, feeding fish | 12% | High cost | 10% |
| Enjoy fresh air, shade, and coolness | 8% | Poor transportation | 7% |
| Meeting with friends | 4% | No companions | 6% |
| Visiting Attractions | 3% | Not interested in attractions | 6% |
| Publicity and Education | 1% | Poor scenery and lack of recreational facilities | 5% |
| Unit organization activities | 1% | Unfavorable weather | 5% |
| Statistics | Model 1 (Socio Demographic Variables) | Model 2 (Spatial Attributes of Residence (Variables) | Model 3 (Individual Variables) | Model 4 (Park Features Variables) |
|---|---|---|---|---|
| F | 17.719 | 17.574 | 13.840 | 12.038 |
| df | 452 | 445 | 440 | 435 |
| Significance | 0.0000 | 0.0000 | 0.0000 | 0.0000 |
| Adj R2 a | 0.136 | 0.303 | 0.348 | 0.378 |
| Δ Adj R2 b | 0.167 | 0.046 | 0.029 | |
| Predictors | Age, Income, Education | Average housing price, Distance from home to the park, Walking time to the park, Residential green space | Time spent in residential greenspace, With child under 7 years, Being willing to spend time in nature | Safety, Maintenance, Overall greening |
| Variables | St. Beta a | Sig. b | Variables | St. Beta a | Sig. b |
|---|---|---|---|---|---|
| Intercept | 0.000 *** | Individual variables | |||
| Socio-demographic variables | with child under 7 years | 0.363 * | 0.037 | ||
| Gender | −0.084 | 0.059 | Being willing to spend time in nature | 0.089 * | 0.023 |
| Age | 0.284 *** | 0.000 | Mean leisure time on weekends | −0.029 | 0.537 |
| Education | −0.134 ** | 0.005 | Mean leisure time on weekdays | 0.008 | 0.857 |
| Income | −0.121 ** | 0.009 | Time spent in residential greenspace | 0.194 *** | 0.000 |
| Spatial attributes of residence variables | Self-reported level of busyness | 0.004 | 0.922 | ||
| Residential green space | 0.091 * | 0.024 | Park features variables | ||
| Distance from home to the park | −0.277 *** | 0.000 | Safety | 0.037 | 0.585 |
| Average housing price | −0.096 * | 0.018 | Maintenance | 0.115 ** | 0.008 |
| Walking time to the park | −0.167 ** | 0.001 | Facility | 0.150 * | 0.034 |
| Number of parks within 500 m of home | −0.015 | 0.718 | Aesthetics | −0.019 | 0.811 |
| Number of parks within 1000 m of home | 0.019 | 0.629 | Overall greening | 0.160 * | 0.022 |
| Number of parks within 1500 m of home | −0.033 | 0.410 |
Disclaimer/Publisher’s Note: The statements, opinions and data contained in all publications are solely those of the individual author(s) and contributor(s) and not of MDPI and/or the editor(s). MDPI and/or the editor(s) disclaim responsibility for any injury to people or property resulting from any ideas, methods, instructions or products referred to in the content. |
© 2023 by the authors. Licensee MDPI, Basel, Switzerland. This article is an open access article distributed under the terms and conditions of the Creative Commons Attribution (CC BY) license (https://creativecommons.org/licenses/by/4.0/).
Share and Cite
Gong, Y.; Mamat, Z.; Shi, L.; Liu, F. Restorative Effects of Park Visiting on Physiology, Psychology, and Society and the Factors Influencing Park Visiting. Sustainability 2023, 15, 841. https://doi.org/10.3390/su15010841
Gong Y, Mamat Z, Shi L, Liu F. Restorative Effects of Park Visiting on Physiology, Psychology, and Society and the Factors Influencing Park Visiting. Sustainability. 2023; 15(1):841. https://doi.org/10.3390/su15010841
Chicago/Turabian StyleGong, Yangyang, Zulpiya Mamat, Lei Shi, and Fenglin Liu. 2023. "Restorative Effects of Park Visiting on Physiology, Psychology, and Society and the Factors Influencing Park Visiting" Sustainability 15, no. 1: 841. https://doi.org/10.3390/su15010841
APA StyleGong, Y., Mamat, Z., Shi, L., & Liu, F. (2023). Restorative Effects of Park Visiting on Physiology, Psychology, and Society and the Factors Influencing Park Visiting. Sustainability, 15(1), 841. https://doi.org/10.3390/su15010841