Article

Two Terminal Instantaneous Power-Based Fault Classification and Location Techniques for Transmission Lines

1
Department of Electrical Engineering, University of Lahore, Lahore 54000, Pakistan
2
Department of Electrical and Computer Engineering, Comsats University Islamabad, Lahore Campus, Lahore 54000, Pakistan
3
Department of Electrical, Electronics and Telecommunication Engineering, University of Engineering and Technology, Lahore 54000, Pakistan
4
Department of Electrical and Computer Engineering, King Abdulaziz University, Jeddah 21589, Saudi Arabia
*
Author to whom correspondence should be addressed.
Sustainability 2023, 15(1), 809; https://doi.org/10.3390/su15010809
Submission received: 11 December 2022 / Revised: 26 December 2022 / Accepted: 27 December 2022 / Published: 2 January 2023
(This article belongs to the Section Energy Sustainability)

Abstract

:
Transmission lines are an important part of the power system, as they are the carriers of power from one end to another. In the event of a fault, the power transferring process is disturbed and can even damage the equipment, which is attached to the generation end as well as the user end. Most of the power systems are connected to the transmission lines, so it is very important to make the transmission lines secure. For protection purposes, relays are used, but relays only trip in the event of a fault and do not tell us about the location of the fault. The power system requires a speedy protection system. For a speedy protection system, quick and fast fault analysis and classification are required. An effective approach for the analysis of the transmission line with three sources is proposed. This method is quite effective and accurate for locating the fault and classifying its types. This technique needs power measurement from both ends simultaneously for fault diagnosis. Instantaneous power and sign power values are used for fault detection and classification. A voltage profile is used to identify the fault location. For three-phase transmission lines, voltage profiles are built up at different segment points to locate the fault. The IEEE-9 bus system is simulated for this technique. MATLAB is employed for simulation purposes. The test system is simulated with different types of faults at different locations. Relay operation has not affected the accuracy of the system. This technique has an accuracy of more than 97%. This method is quite effective for the analysis of power transmission lines. It can discriminate the fault type, identify the faulty phase of the line, and locate the point of the fault. Faults are located with errors not more than 0.45%. Moreover, the time difference between the actual fault and the calculated fault obtained from the estimated location is not more than 0.004 s. Simulations are claimed to be executed in less computational time, ensuring effective and rapid protection against faults.

1. Introduction

Fault detection in the transmission line is discussed due to its utmost importance. The efficiency and accuracy of a method primarily depend upon the input samples. Although the location depends on different factors like fault duration, fault occurring time, fault detecting algorithm, measurements, and power flow, various methods are employed to find the approximate location of the fault. It can be determined by analyzing fault sequence components, decaying DC components, as well as traveling wave techniques.
Conventional techniques are easy to use and less complex. For instance, impedance value at the relay location and varying samples of voltage and current are obtained and processed using a digital filter to extract their fundamental components, as in [1]. A linear quadratic estimation approach is used in [2] that uses before-fault measurements and after-fault measurements to differentiate faults, resulting in a much faster response and better fault classification, but these methods are not accurate and are only used for estimation purposes.
A numerical approach is used in [3] that uses the Laplace method to analyze its transient response and increase its accuracy a little, but it is not suitable for high voltage levels. The method in [4] uses transposed line parameters for the calculation of fault location to enhance accuracy and input errors, but accuracy is affected by transmission line length and different types of faults.
Machine learning techniques differentiate between faulty and healthy line conditions when subjected to minor changes [5]. In [6], an artificial neural network is used that analyzes post-fault current and voltage phasors to determine the type of fault. This method not only improves accuracy, but is also resistant to noise input. In [7], a fault-locating algorithm is used that uses fundamental frequency components to efficiently reduce location error due to line compensation. The complexity of [6] is reduced in [8] by adopting a fuzzy logic technique that results in effective fault determination, location, faulty phases, and reduced fault time. It also removed DC offset and non-harmonic components. To reduce the uncertainty of fault in one-ended measurement systems, a two-end system is preferred. In [9], a GPS-connected system is used to obtain synchronized samples of voltage and current on both ends of the transmission line to improve the accuracy of input parameters, leading to a reduction in error. The method in [10] uses a distributed parameter line model to locate the fault. It uses low sampling frequency, voltage, and current phasors as inputs. It can find fault location efficiently, but by using two different models for different line lengths, its complexity is increased. The study in [11,12,13,14,15,16,17,18] uses a support vector machine approach in which fundamental voltage and current are for all phases. This detects fault efficiently without regard to length or type of fault. The only drawback is that it does not perform well for large input datasets.
Although synchronized sampling is used to reduce fault location errors, source impedance and transposed lines can cause location variation. These problems are solved by the method adopted in [19]. It not only solves the CT ratio error, but is also independent of pre-fault scenarios. In [20], the fuzzy logic fault classification scheme is used to differentiate between all short-circuit faults. This method has benefits over [8] because only line currents are required to find the faulty phase. It can also be applied to a wide range of input voltages. The study in [21] improves fault detection and differentiation by combining neural networks with fuzzy adaptive resonance theory. This method improves the deficiencies of both methods, and combining them gives improved accuracy with minimum error.
The recent improvement in ANN is studied in [22], where four neural networks are used for each phase wire, enhancing its response speed. Each network gathers its input voltage and current. The output of ANN specifies the faulty phase.
Sometimes errors are caused by improper computation of decaying components in post-fault conditions. Extracting the right information from them is essential. An important technique used for fault detection, as in [23], is the phasor measurement unit method. This method combines two algorithms for precise results. One is used for assessment of performance-affecting parameters such as aging of line, and the second is a discrete Fourier-transform-based algorithm that is used for noise and error reduction. Fault resistance can cause inaccurate assessment of location, so it must be accounted for.
An unconventional method is employed in [24] to eliminate this flaw. The amplitude of current vectors is compared with a preset value to determine fault location. This method also accounts for load flow problems that cause location inaccuracy. A better approach is used in [25] that uses a wavelet transform that can give high-frequency resolution and can differentiate faults regardless of their inception angle, impedance, fault resistance, line symmetry, and compensation of line while keeping the computations as simple as possible. Ref. [26] employs a sophisticated methodology that combines wavelet transform and linear discriminant analysis to distinguish sequence current components.
Reduced protection time, minimal computations, high accuracy, distance independence, and new fault feature learning capability are the attractive features of fault classification and location technique. In the aforementioned techniques, extensive computation compromises the protection time, and the rapidness of the technique reduces the accuracy. Moreover, the conventional techniques are not supportive of a renewable energy environment in which volatile nature persuades unavoidable and volitional tripping [27,28,29,30,31,32].
In this research, a synchronized sampling-based method was developed for transmission lines [33]. This method offers speedy fault diagnosis and classification with less computation and execution time. It is found from the simulation scenarios that the time difference between the actual fault location and the estimated fault location is about 0.004 s, confirming the rapidness of the proposed technique. This proposed method is applied to the IEEE–9 bus system to analyze its operation. Simulations show that the accuracy of fault detection and classification can be improved, but it can also be done with fewer complexities and computational time. It is proved from the simulation experiments that the error is not more than 0.45% in the estimation of fault location. Following are the differences and superiority of this proposed technique as compared to the previous techniques:
  • The proposed technique is implemented on the IEEE-9 bus system, which is an entirely different system to that used in the previous research.
  • The fault locations are identified and located with less than 0.45% error. However, in the previous studies, the error in fault location was up to more than 5%.
  • More parameters were required in the previous research to reduce the percentage error in fault location like fault inception angle, fault distance, and resistance. Here, the proposed technique is quite simple, and fault distance is sufficient to produce the desired results.
  • The proposed technique helps us to prepare the datasets that could be used to train the machine learning algorithms so that a new fault type and location could be identified with the trained algorithm. However, there is no such information available in previous research.
  • The proposed technique and the previous technique are both threshold-independent. However, the proposed technique is more independent of the variations of the system parameters, resulting in more accuracy for fault identification and location.
Highly sensitive data of fault inception angle is required in the previous research to reduce percentage error. In the proposed technique, fault distance is enough to predict and locate the fault.
The rest of the research paper contains the following sections. In Section 2, the mathematical formulation of the proposed fault estimation technique is presented. Section 3 covers the discussion of simulation results. Section 4 describes the tabular results for the location of the fault. Section 5 presents the summary of the research outcomes and limitations. A comparison of the proposed method with the available mature techniques is given in Section 6. Section 7 presents the conclusion of the proposed method.

2. Proposed Method for Fault Analysis and Location

The proposed technique is used for detecting faults, which compares the instantaneous power of the line from both ends. The change in the direction of the instantaneous power on all three phases assessed at both ends of the transmission line helps to detect the fault. Calculation of the instantaneous power does not require averaging. It can be computed directly by synchronized samples of voltage and current.

2.1. Detection of Fault and Fault Type Classification

The instantaneous values of power are assessed from the time-synchronized samples of voltage and current measured at both ends simultaneously and synchronously.
V 1 t , I 1 t denote the voltage and current sampled at one end of the transmission line at time t. Similarly, V 2 t , I 2 t denote the voltage and current evaluated at the other end of the transmission line at time t . The directions of the currents concerning the measuring equipment are given in Figure 1. Here, single-phase voltage and currents are assumed for calculations.
Mathematically, voltage and current at bus 1 are given by:
V 1 t = V 1 m   c o s ω t I 1 t = I 1 m   c o s ω t θ 1
where θ 1 is a phase difference between V 1 t and I 1 t . V 1 m and I 1 m are the maximum values of voltage and current at bus 1, respectively. Instantaneous power is expressed as:
P 1 t = V 1 t × I 1 t P 1 t = V 1 m   c o s ω t × I 1 m   c o s ω t θ 1   P 1 t = V 1 m   I 1 m c o s ω t   c o s ω t θ 1 P 1 t = P 1 m c o s   2 ω t + 1 c o s θ 1 + P 1 m   s i n   2 ω t   s i n θ 1
Mathematically, voltage and current at bus 2 are given by:
V 2 t = V 2 m   c o s ω t δ I 2 t = I 2 m   c o s ω t δ θ 2
where θ 2 is a phase difference between V 2 t and I 2 t . V 2 m and I 2 m are the maximum values of voltage and current at bus 2, respectively. Instantaneous power is expressed as:
P 2 t = V 2 t × I 2 t P 2 t = V 2 m cos ω t δ × I 2 m cos ω t δ θ 2 P 2 t = V 2 m I 2 m cos cos ω t δ cos ω t δ θ 2 P 2 t = P 2 m c o s   2 ω t δ + 1 c o s θ 2 + P 2 m   s i n   2 ω t δ   s i n θ 2
When a fault occurs on the transmission line, the current rises abruptly [23]. I 1 t and I 2 t are the currents flowing toward the fault point from two ends of the transmission line [34]. The direction of I 2 t is opposite to the direction of I 1 t , as shown in Figure 1. If I 2 t is positive, then I 1 t will be negative in the case of fault, and vice versa [33].
Therefore, under normal conditions, i.e., before the fault condition, the instantaneous powers (superscript “bf”) are expressed as:
P 1 b f t = P 1 m b f c o s   2 ω t + 1 c o s θ 1 b f + P 1 m b f   s i n   2 ω t   s i n θ 1 b f P 2 b f t = P 2 m b f c o s   2 ω t δ + 1 c o s θ 2 b f P 2 m b f   s i n   2 ω t δ   s i n θ 2 b f
The instantaneous powers (superscript “f”) after the occurrence of fault are expressed as:
P 1 f t = P 1 m f c o s   2 ω t + 1 c o s θ 1 f + P 1 m f   s i n   2 ω t   s i n θ 1 f P 2 f t = P 2 m f c o s   2 ω t δ + 1 c o s θ 2 f + P 2 m f   s i n   2 ω t δ   s i n θ 2 f

2.1.1. Case 1

If the power factor angles are lagging during the instants before the fault and after the fault, which are:
θ 1 b f > 0 ,   θ 2 b f > 0   ; θ 1 f > 0 ,   θ 2 f > 0
Then, before the instant of fault, the magnitude of the instantaneous values of power P 1 b f t = P 1 b f t θ 1 b f and P 2 b f t = P 2 b f t θ 2 b f will be expressed as:
P 1 b f t > 0 ,   P 2 b f t < 0
Then, after the instant of fault, the magnitude of the instantaneous values of power P 1 f t = P 1 f t θ 1 f and P 2 f t = P 2 f t θ 2 f will be expressed as:
P 1 f t > 0 ,   P 2 f t > 0

2.1.2. Case 2

If the power factor angles are leading during the instant before the fault, and the power factor angles are lagging after the instant of fault, which are:
θ 1 b f < 0 ,   θ 2 b f < 0   ; θ 1 f > 0 ,   θ 2 f > 0
Then, before the instant of fault, the magnitude of the instantaneous values of power will be expressed as:
P 1 b f t > 0 ,   i f   c o s   2 ω t + 1 c o s θ 1 b f > s i n   2 ω t   s i n θ 1 b f P 2 b f t < 0   i f cos 2 ω t δ + 1 c o s θ 2 b f >   s i n   2 ω t δ   s i n θ 2 b f
Then, after the instant of fault, the magnitude of the instantaneous values of power will be expressed as:
P 1 f t > 0 ,   P 2 f t > 0
Moreover, this can be proved for all the combinations of leading and lagging power factor angles before and after the fault P 1 b f t > 0 ,   P 2 b f t < 0 and   P 1 f t > 0 ,   P 2 f t > 0 under the following inequality conditions:
c o s   2 ω t + 1 c o s θ 1 b f > s i n   2 ω t   s i n θ 1 b f cos 2 ω t δ + 1 c o s θ 2 b f > s i n   2 ω t δ   s i n θ 2 b f c o s   2 ω t + 1 c o s θ 1 f > P 1 m f   s i n   2 ω t   s i n θ 1 f c o s   2 ω t δ + 1 c o s θ 2 f > s i n   2 ω t δ   s i n θ 2 f
In transmission line systems, pre-fault power factor angles are generally small. In post-fault conditions, power factor angles are lagging. This information leads to the conclusion expressed in Equations (8) and (9). These features enable the identification and classification of faults without using threshold computations. Mathematically, these features are represented by the signum function expressed as:
s g n x = 1 ,     x < 0     0 ,     x = 0 1 ,     x > 0
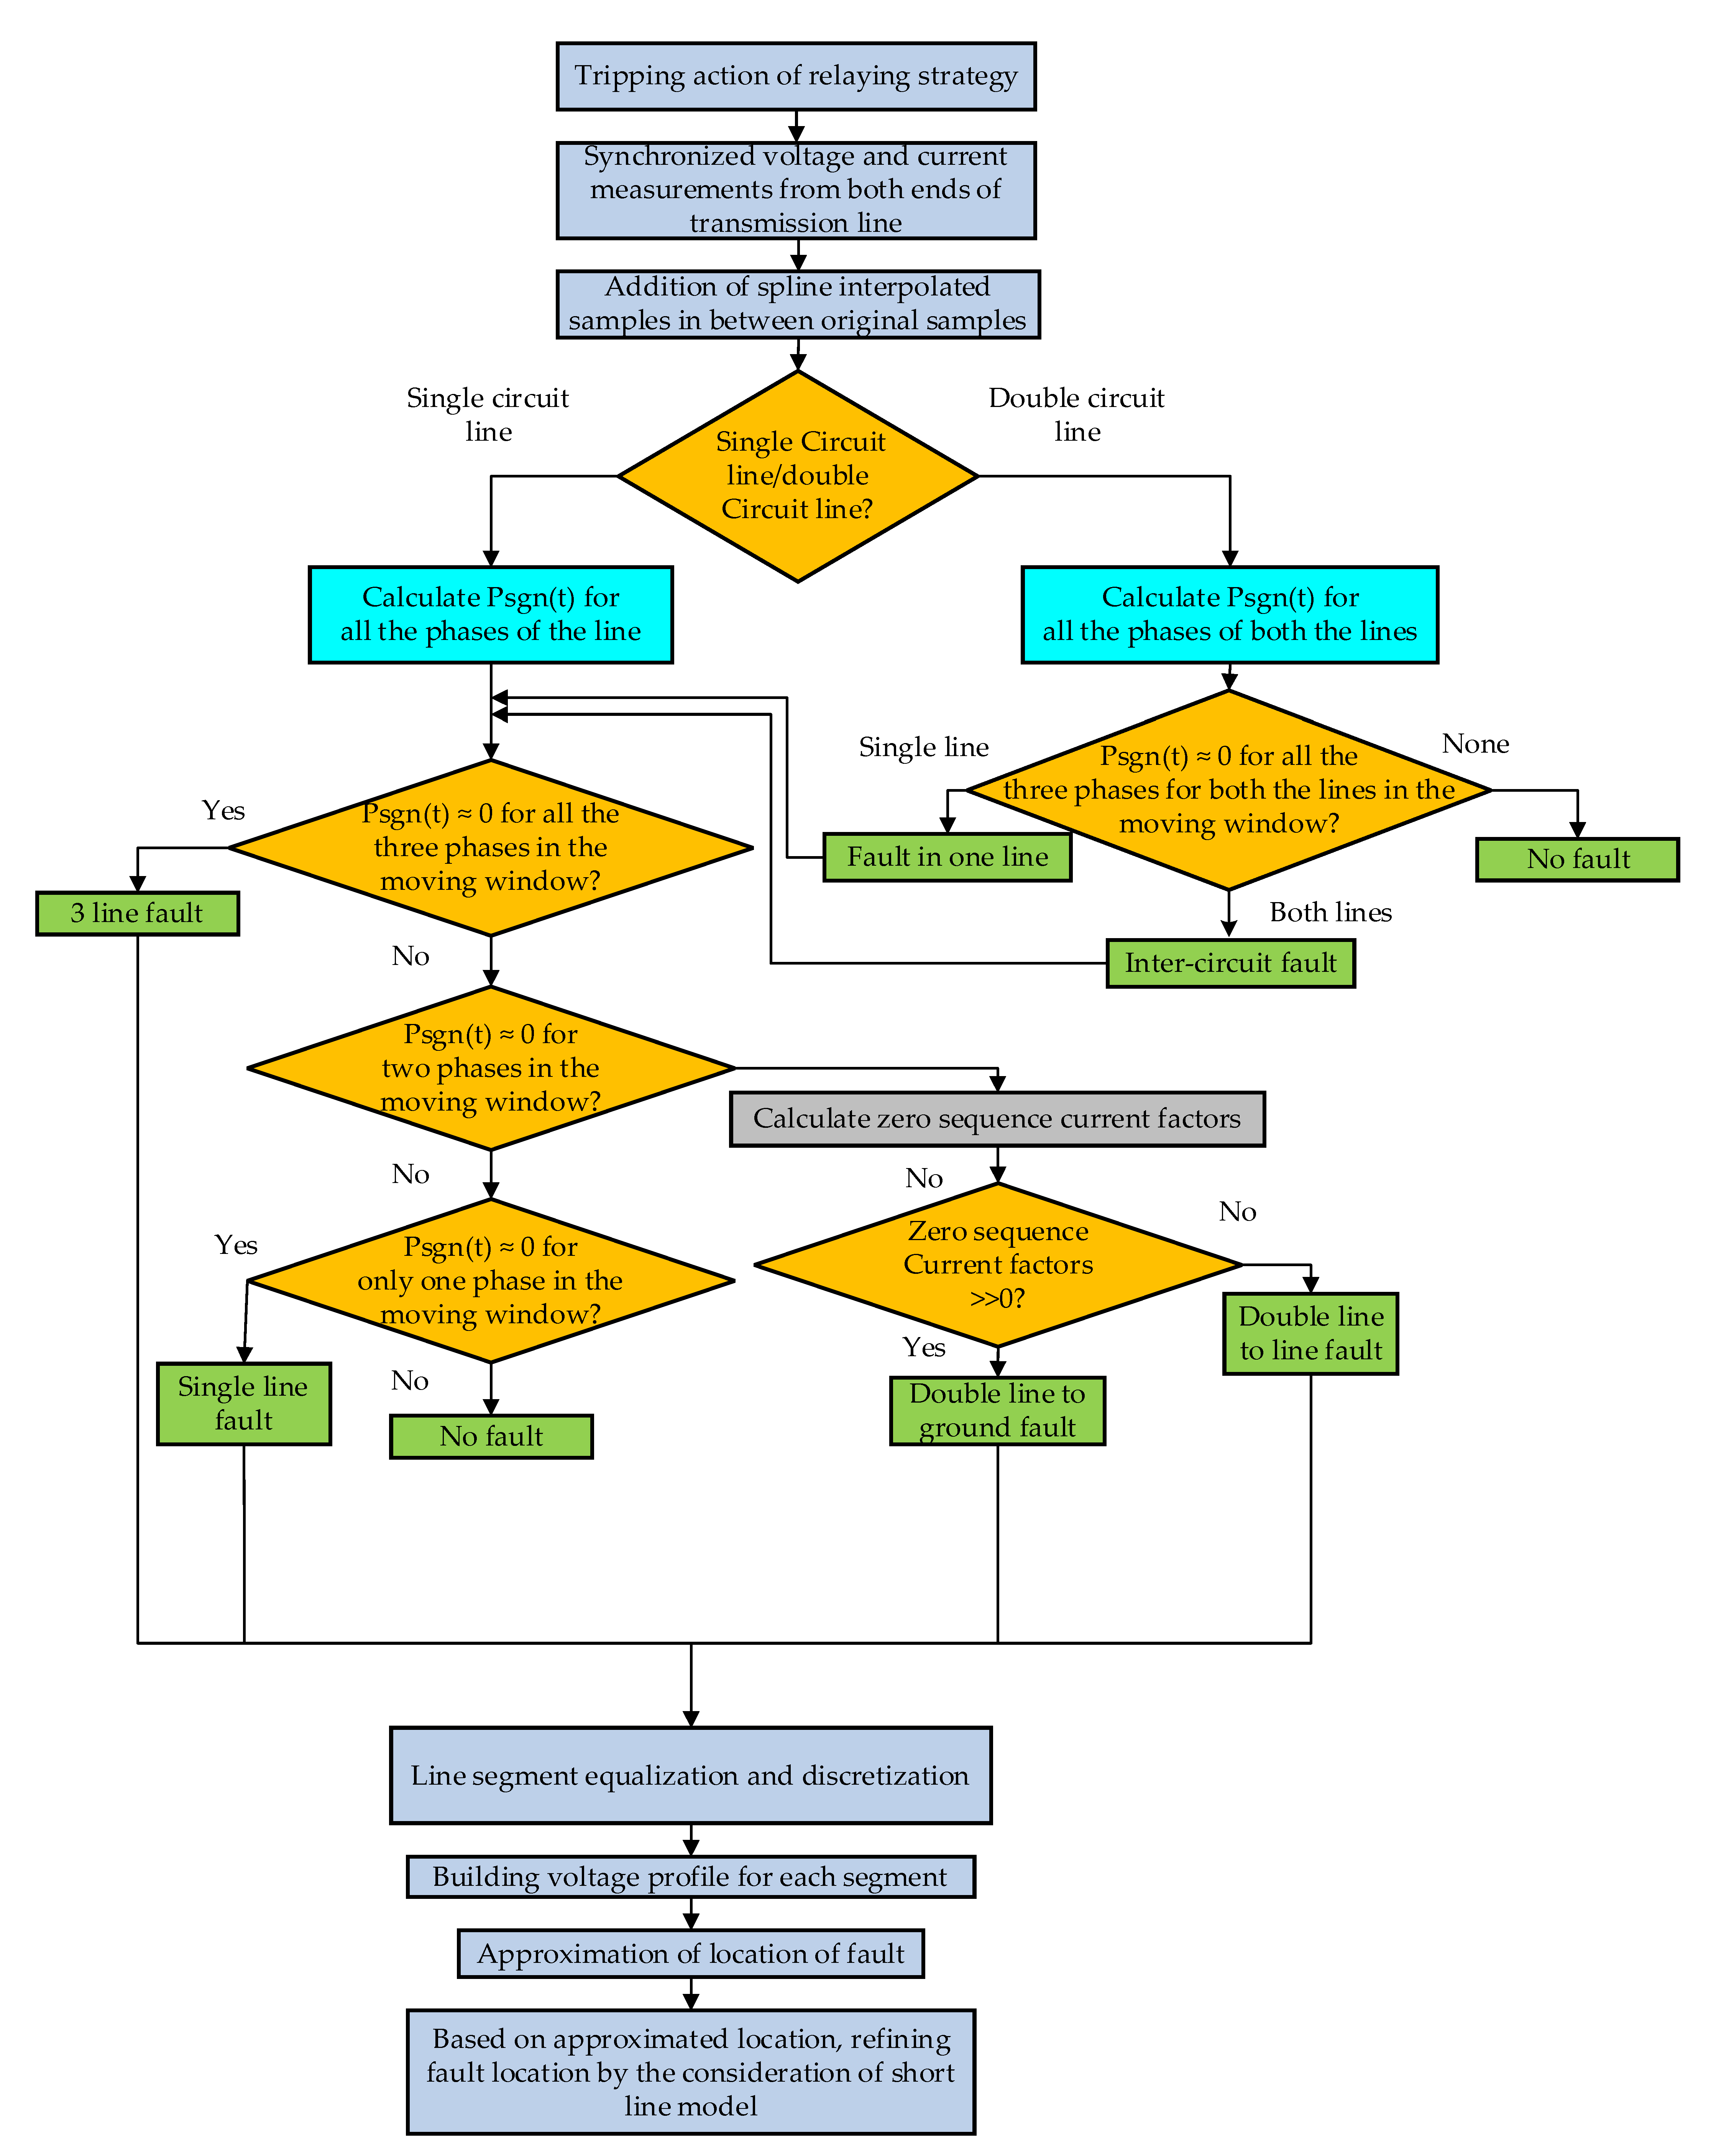
The measurements of the voltages and the currents at both ends of the transmission line undergo spline interpolation. The interpolated samples are employed to distinguish between single and double circuit lines.
Afterward, the computed values of P s g n t are used for the identification of faults. Discretization of voltage samples is utilized for locating the faults.
The flow chart of the proposed technique is presented in Figure 2.

3. Results and Discussions

3.1. Single Line-to-Ground Fault

For the single line-to-ground fault, Sgn values for instantaneous power from both ends of the line are computed, which are: s g n P 1 t and s g n P 2 t . The difference between both signum powers is computed.
P s g n t = s g n P 1 t s g n P 2 t
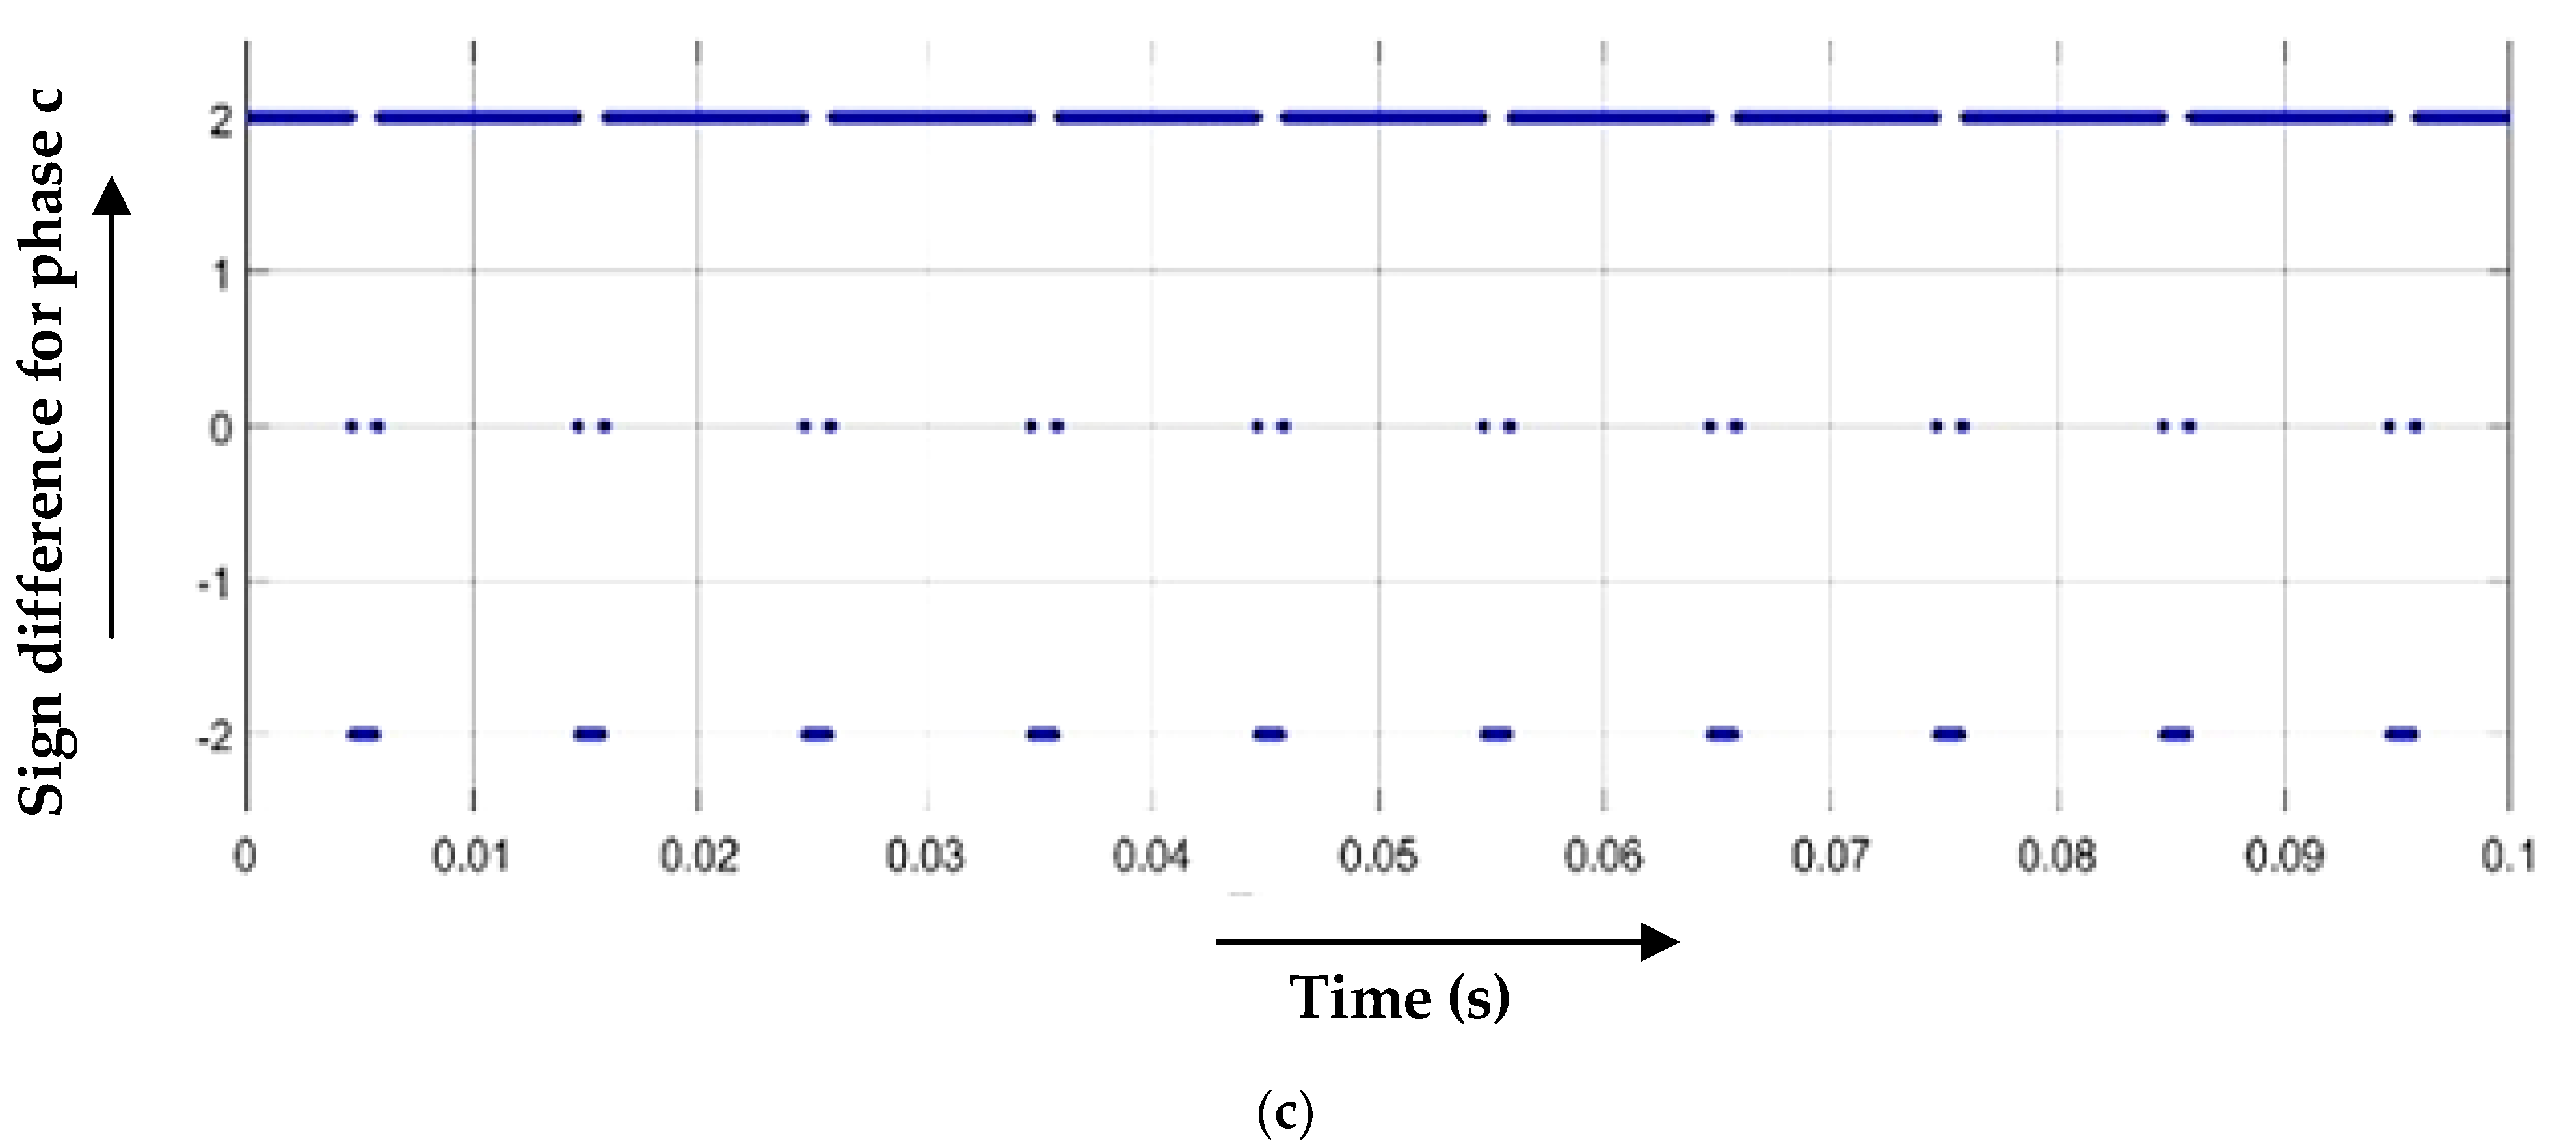
Ideally, P s g n t should be equal to ± 2 before the fault.
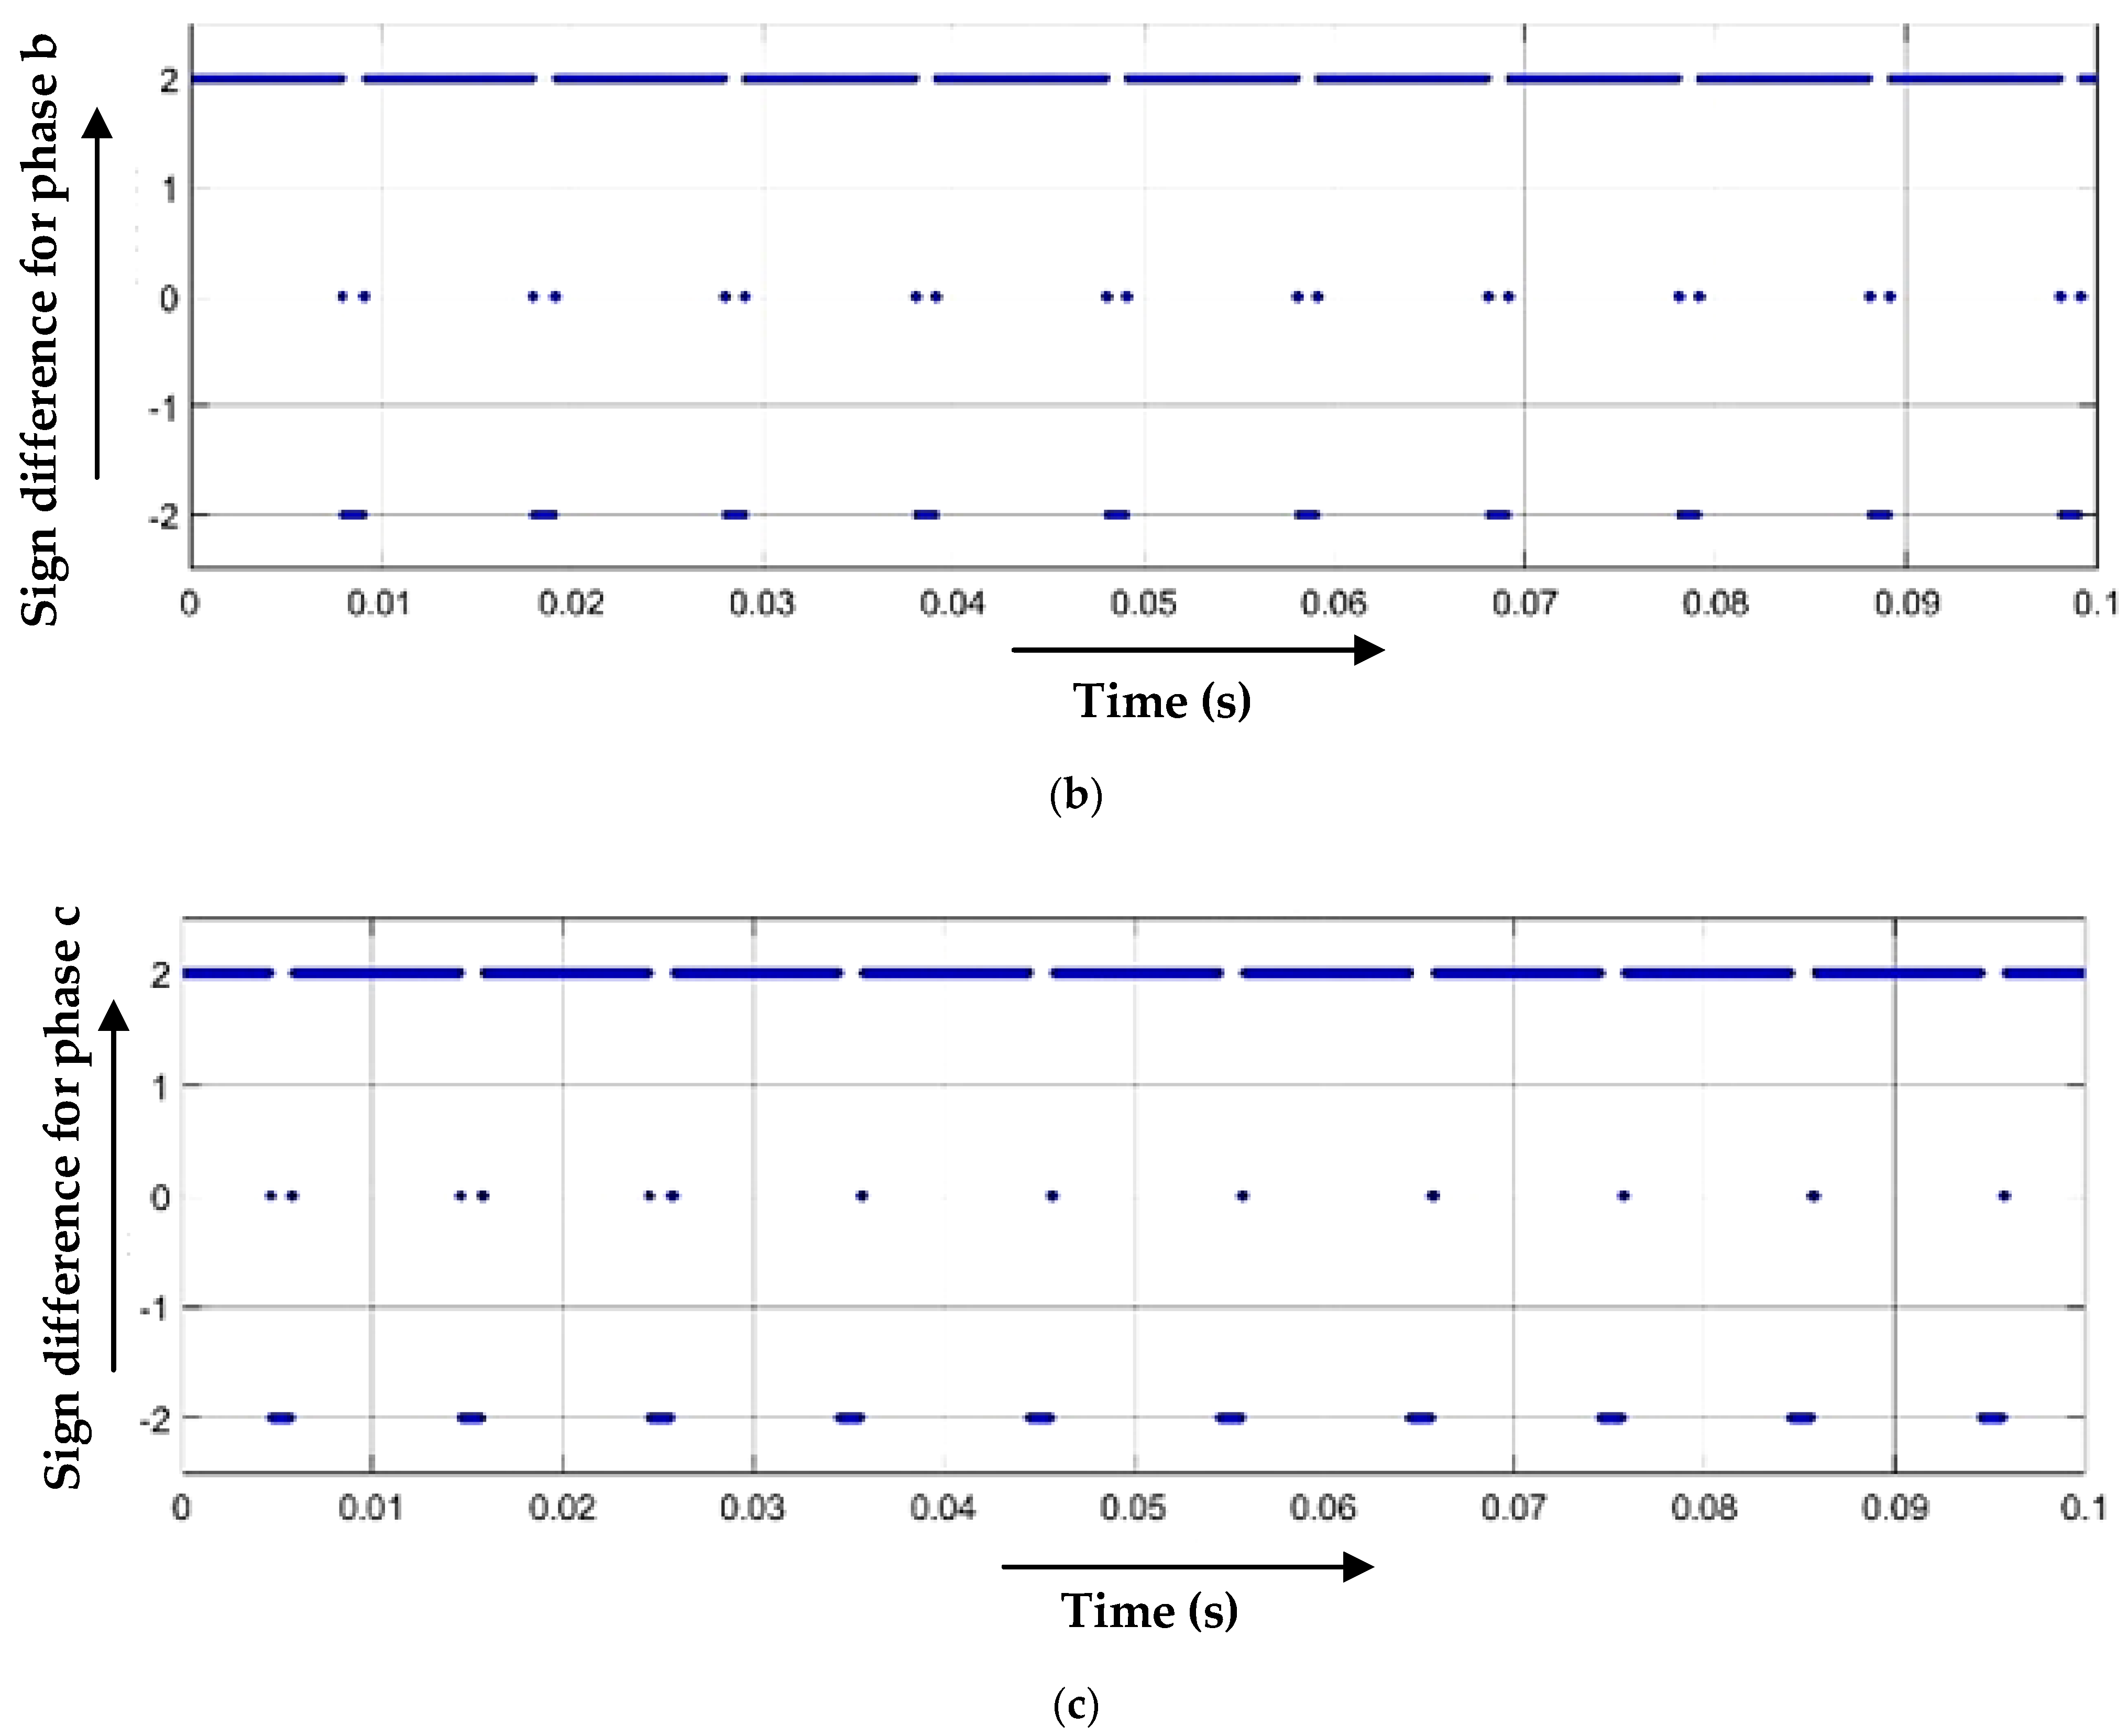
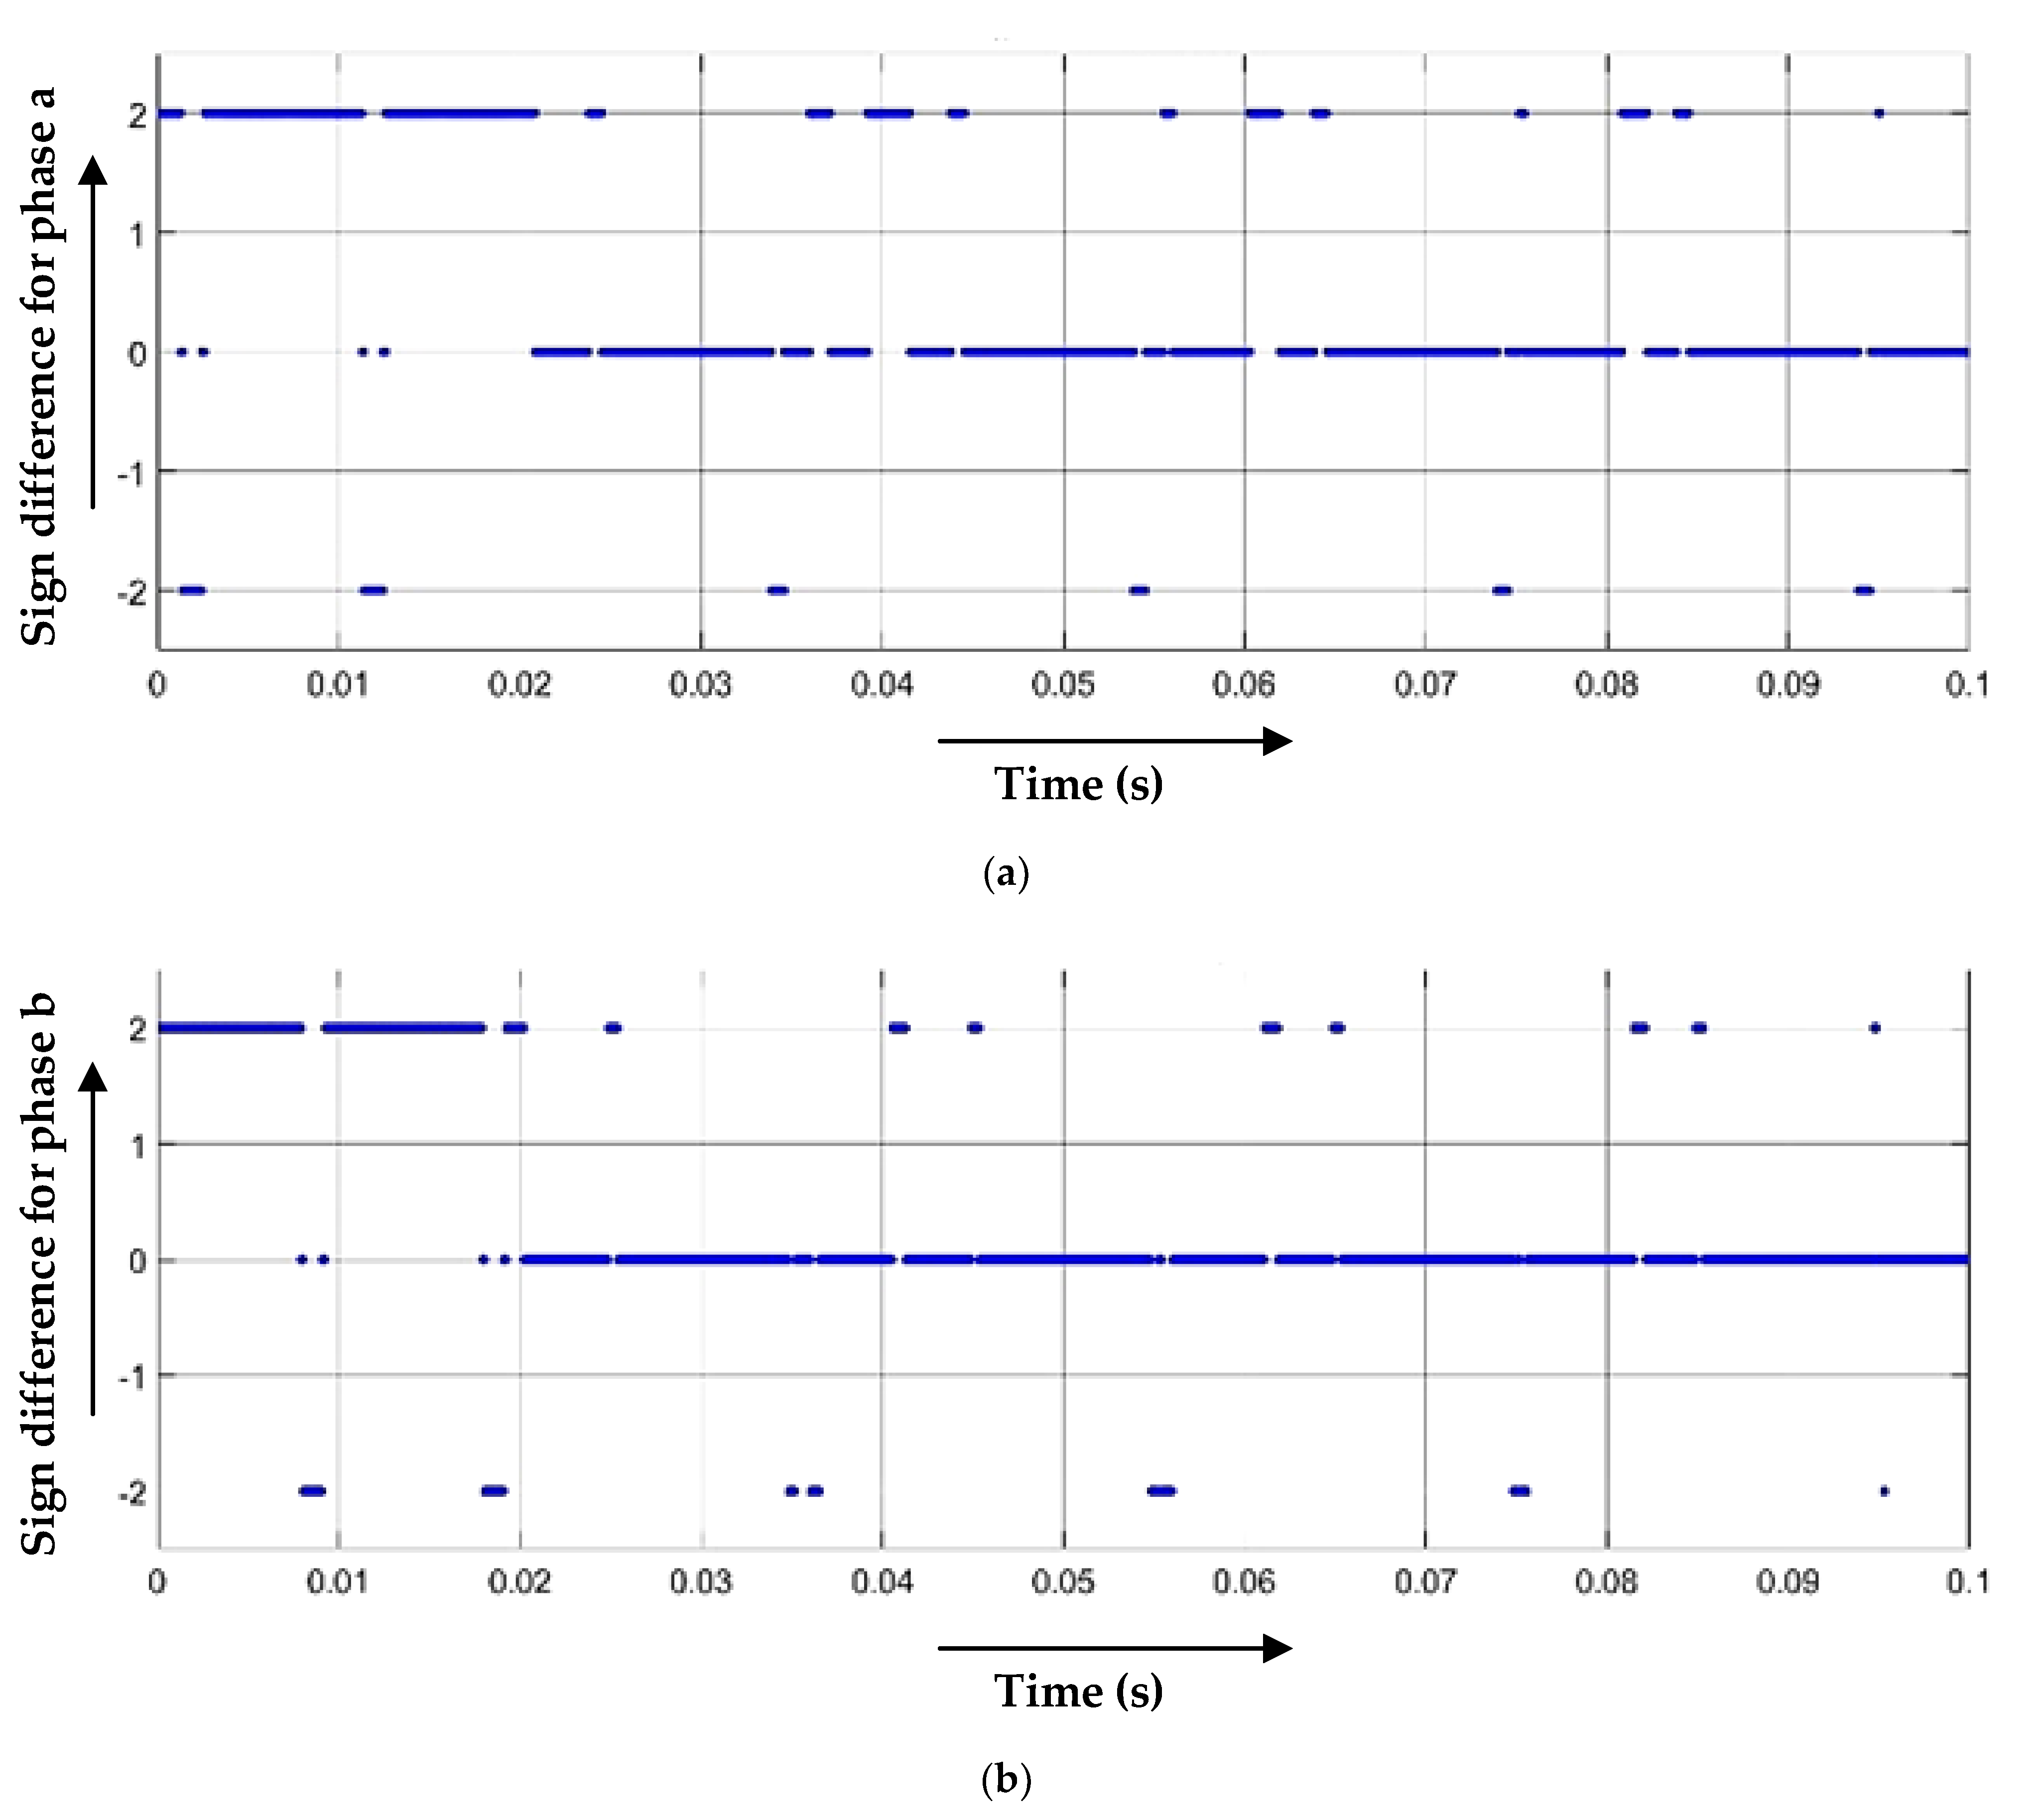
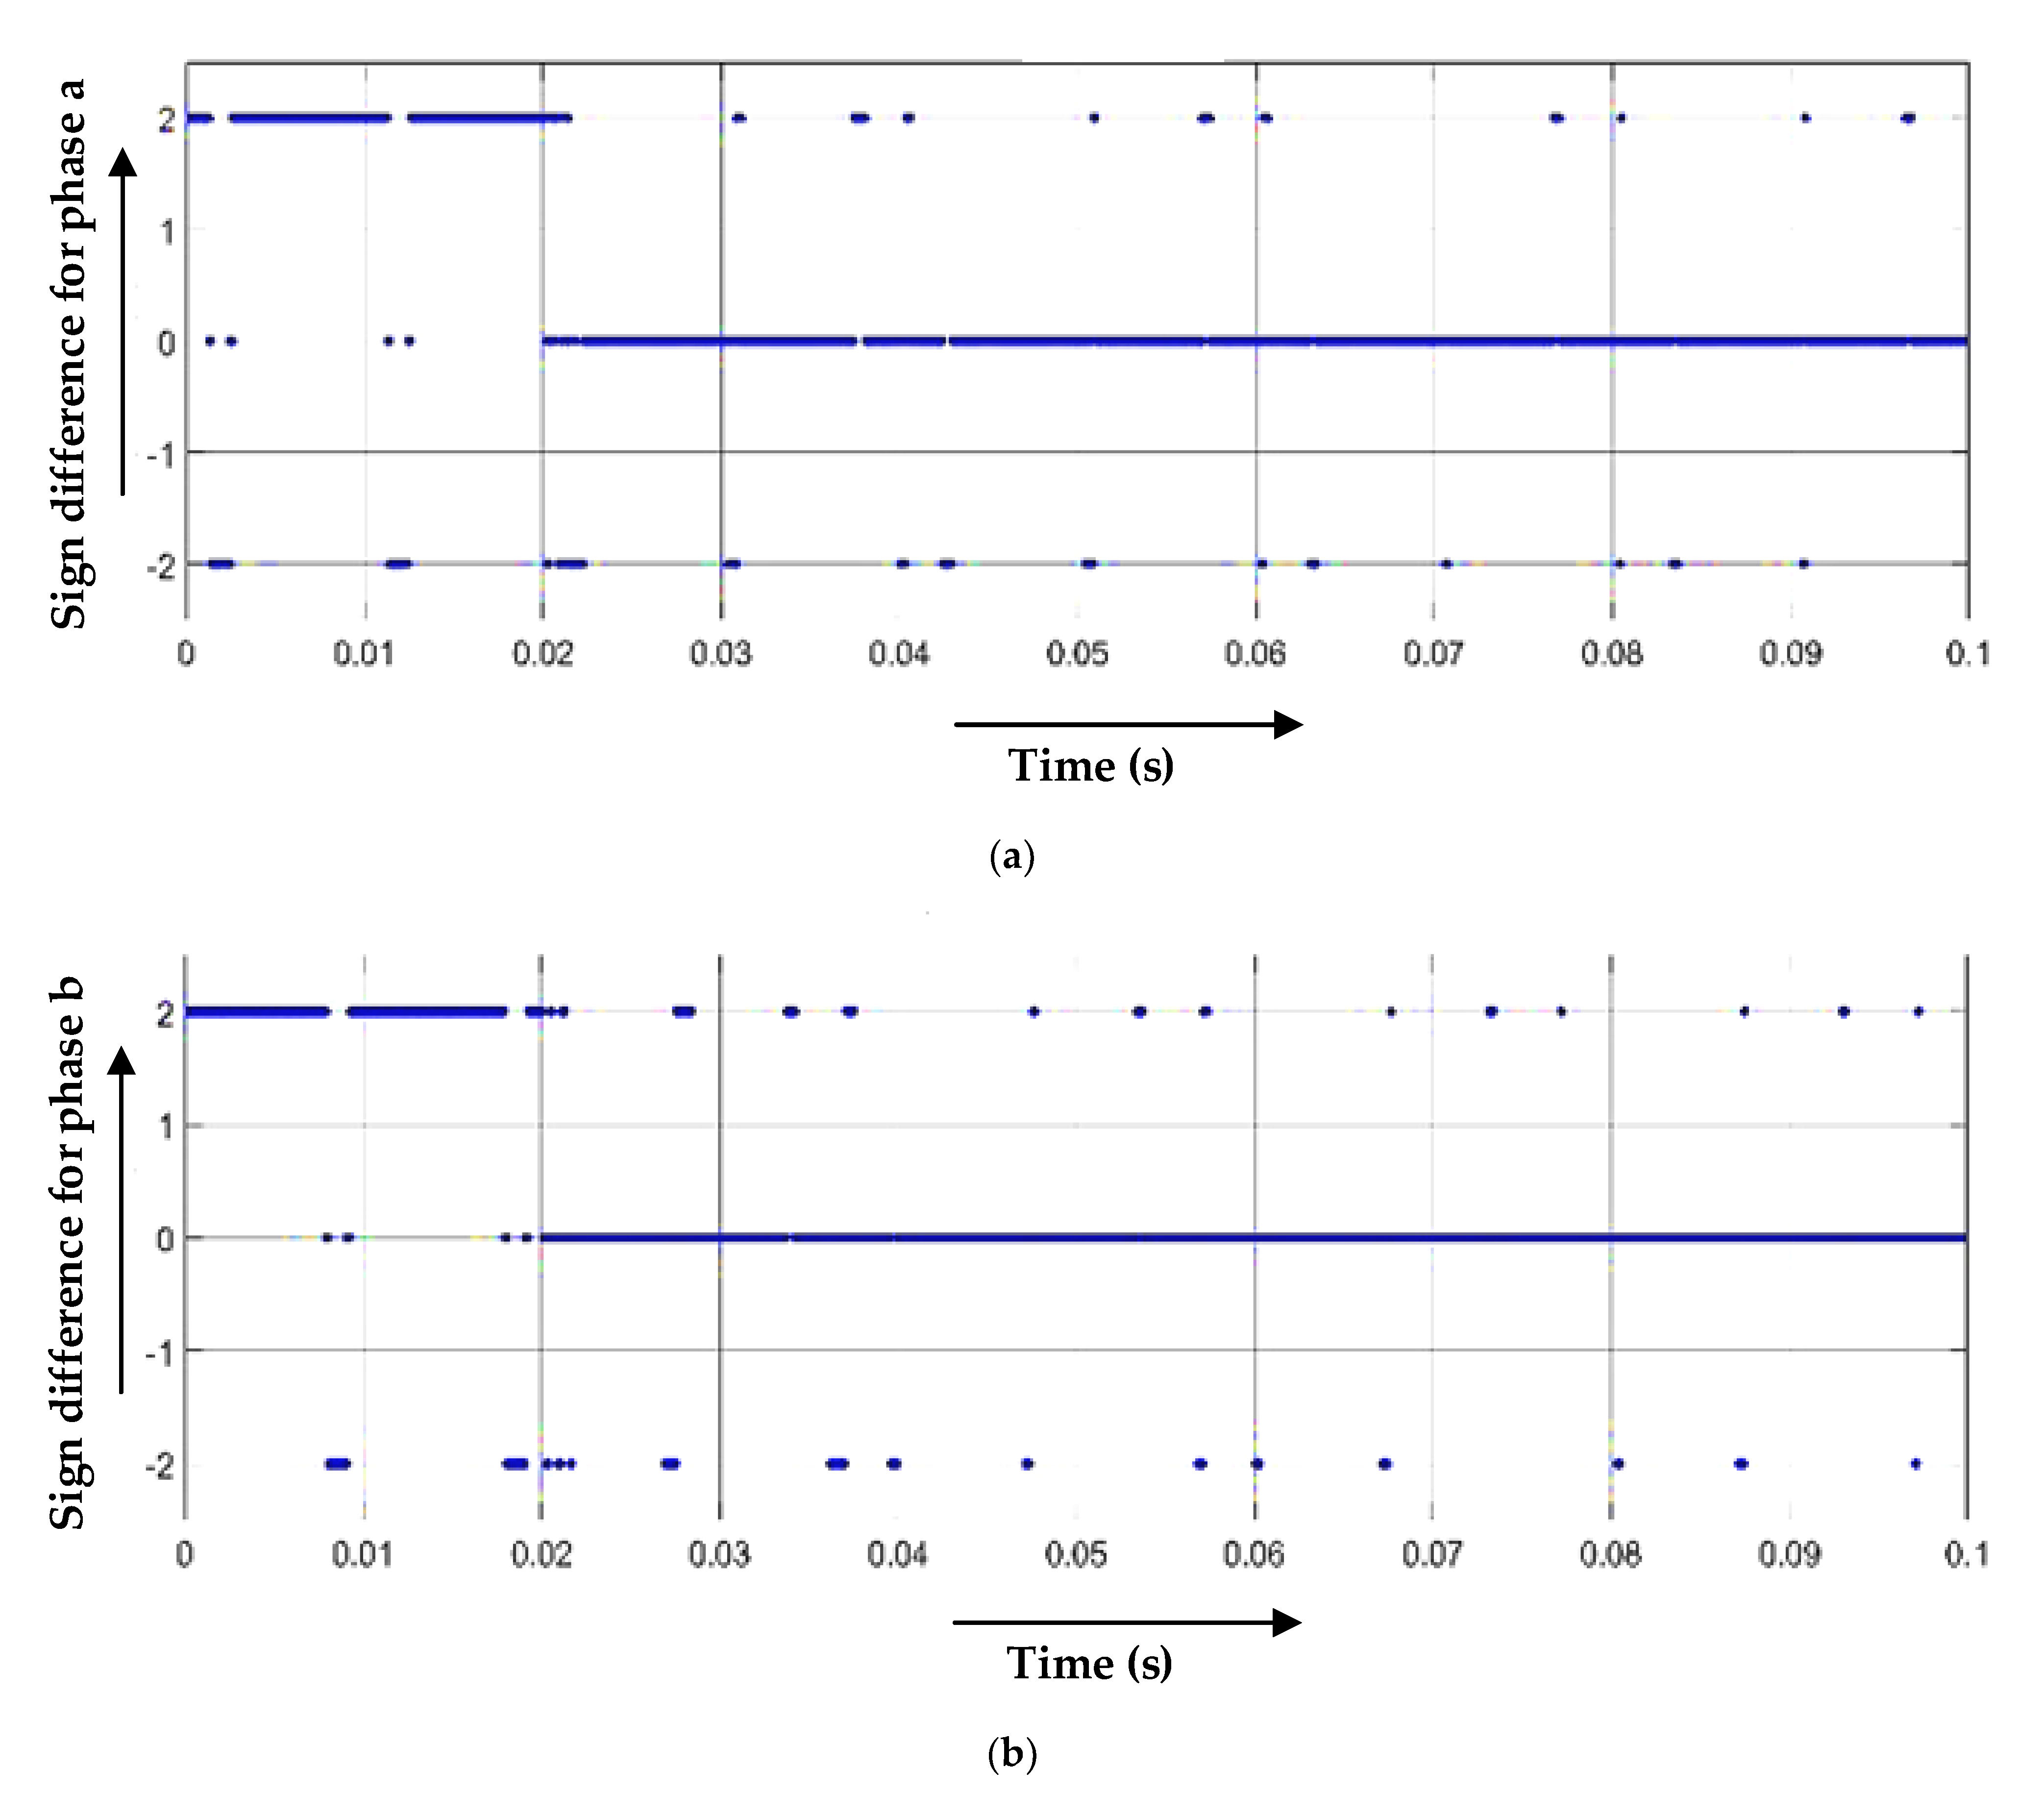
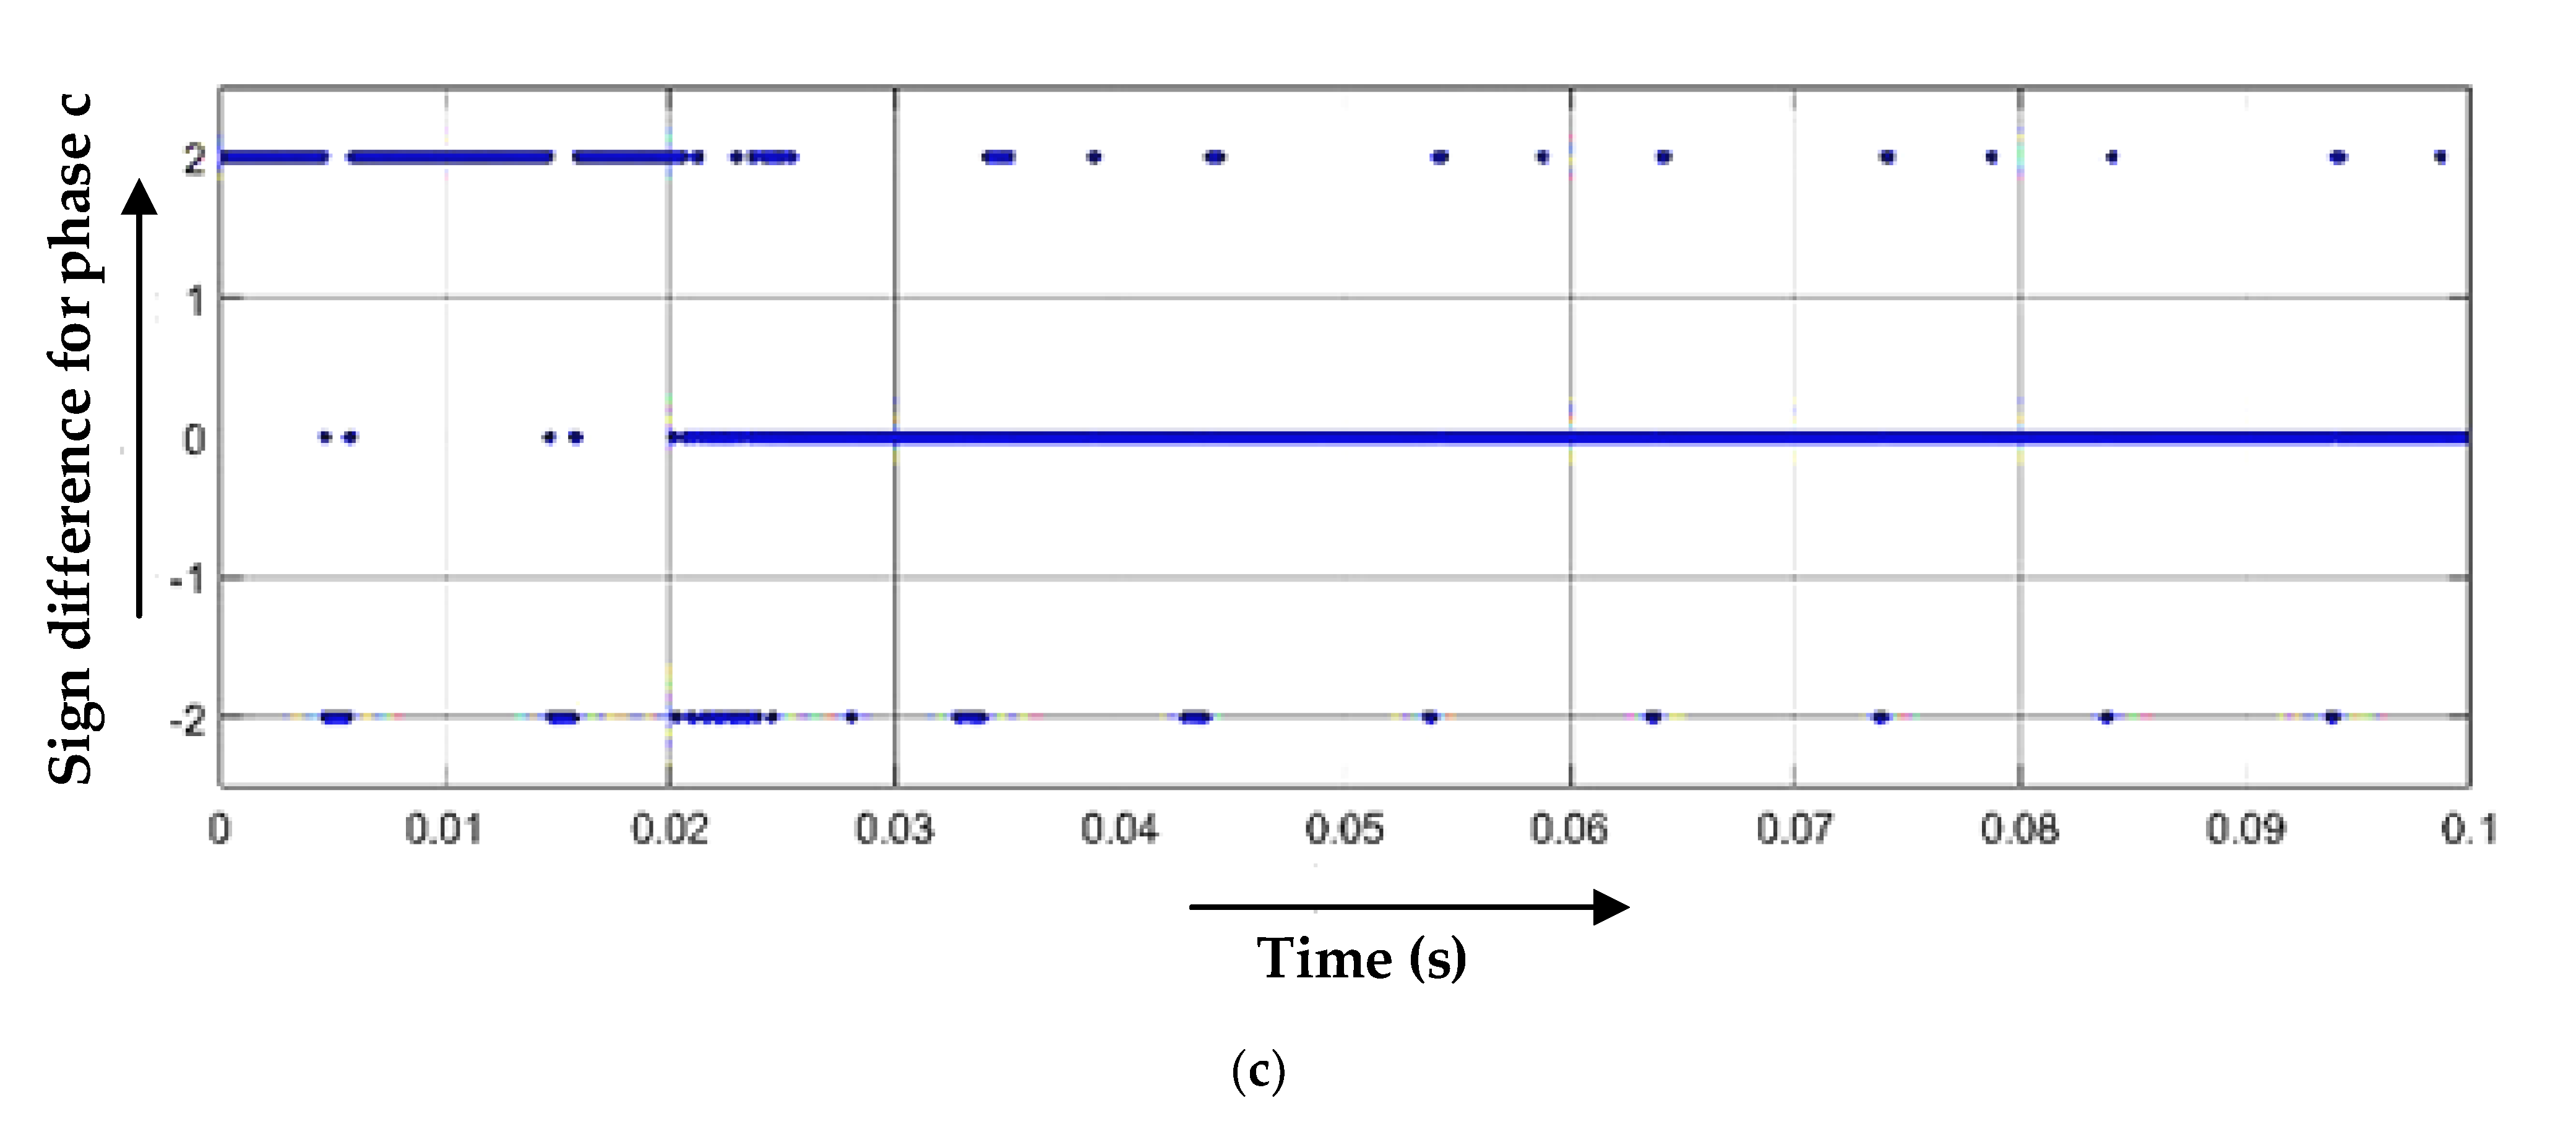
After the fault, it should be equal to zero. However, due to transients of the line and power factor, it would be approximately equal to zero. In the case of phase ‘a’ to ground fault, graphical results are shown in Figure 3 and Figure 4.
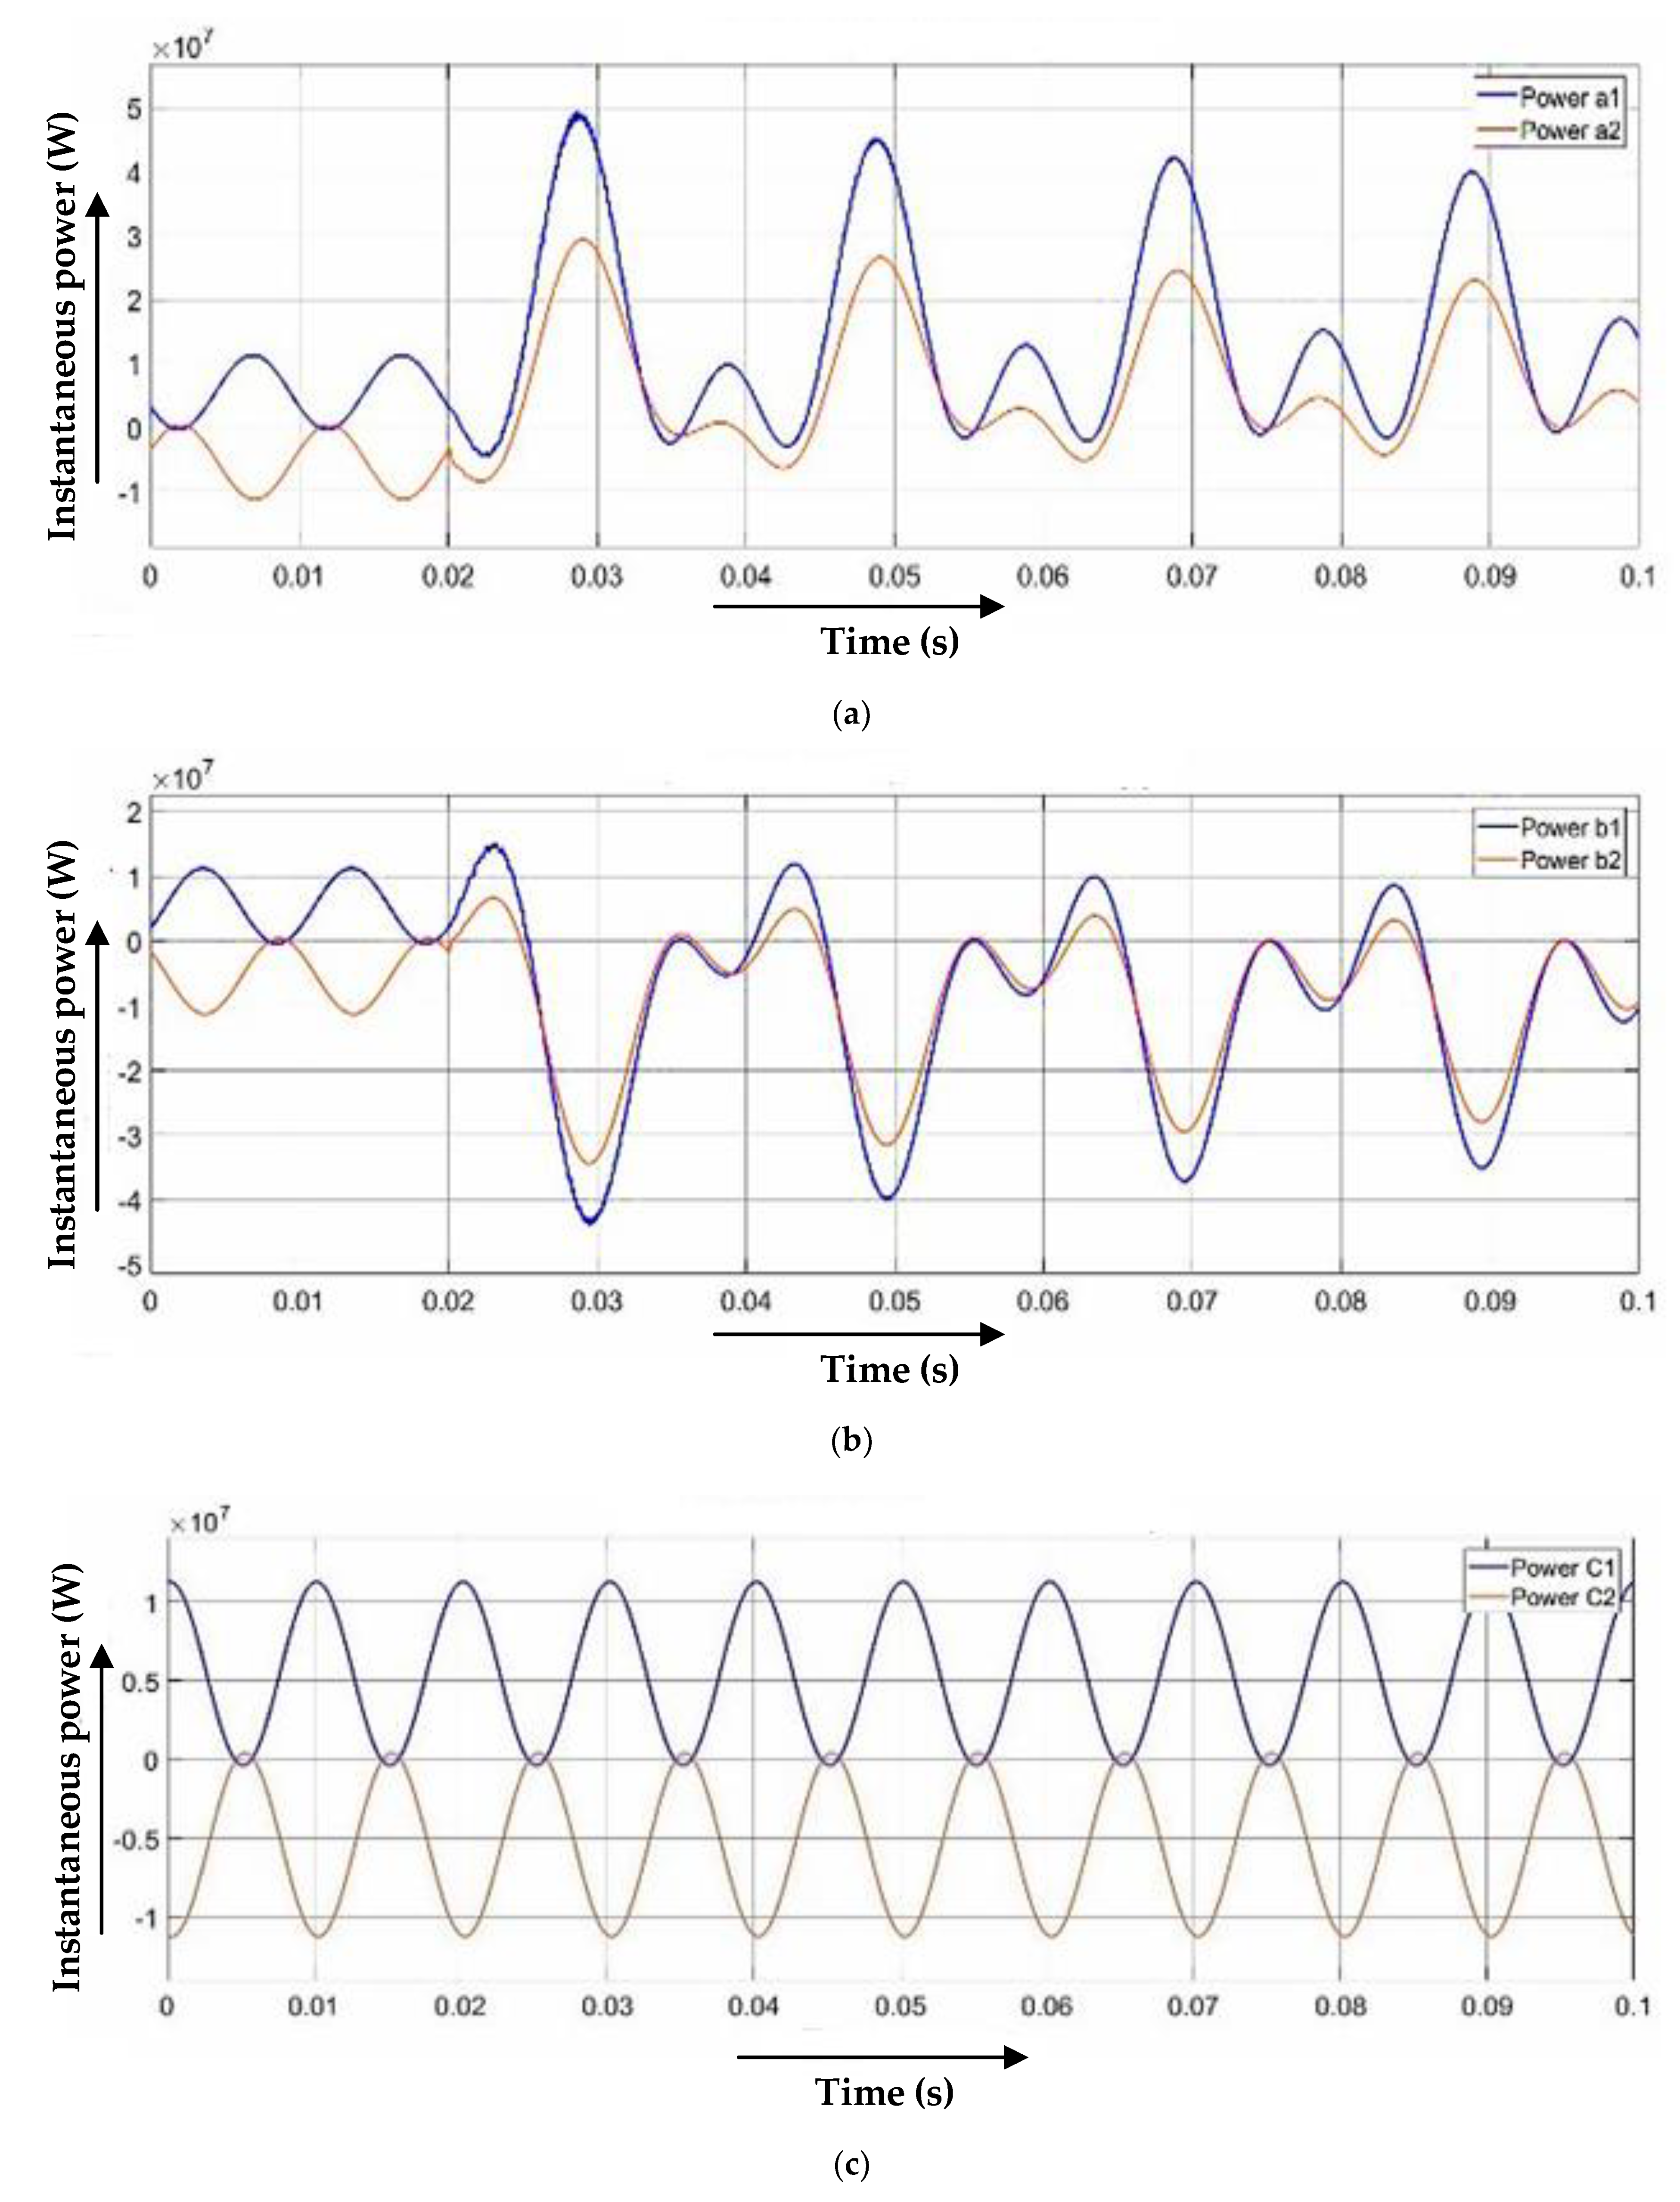
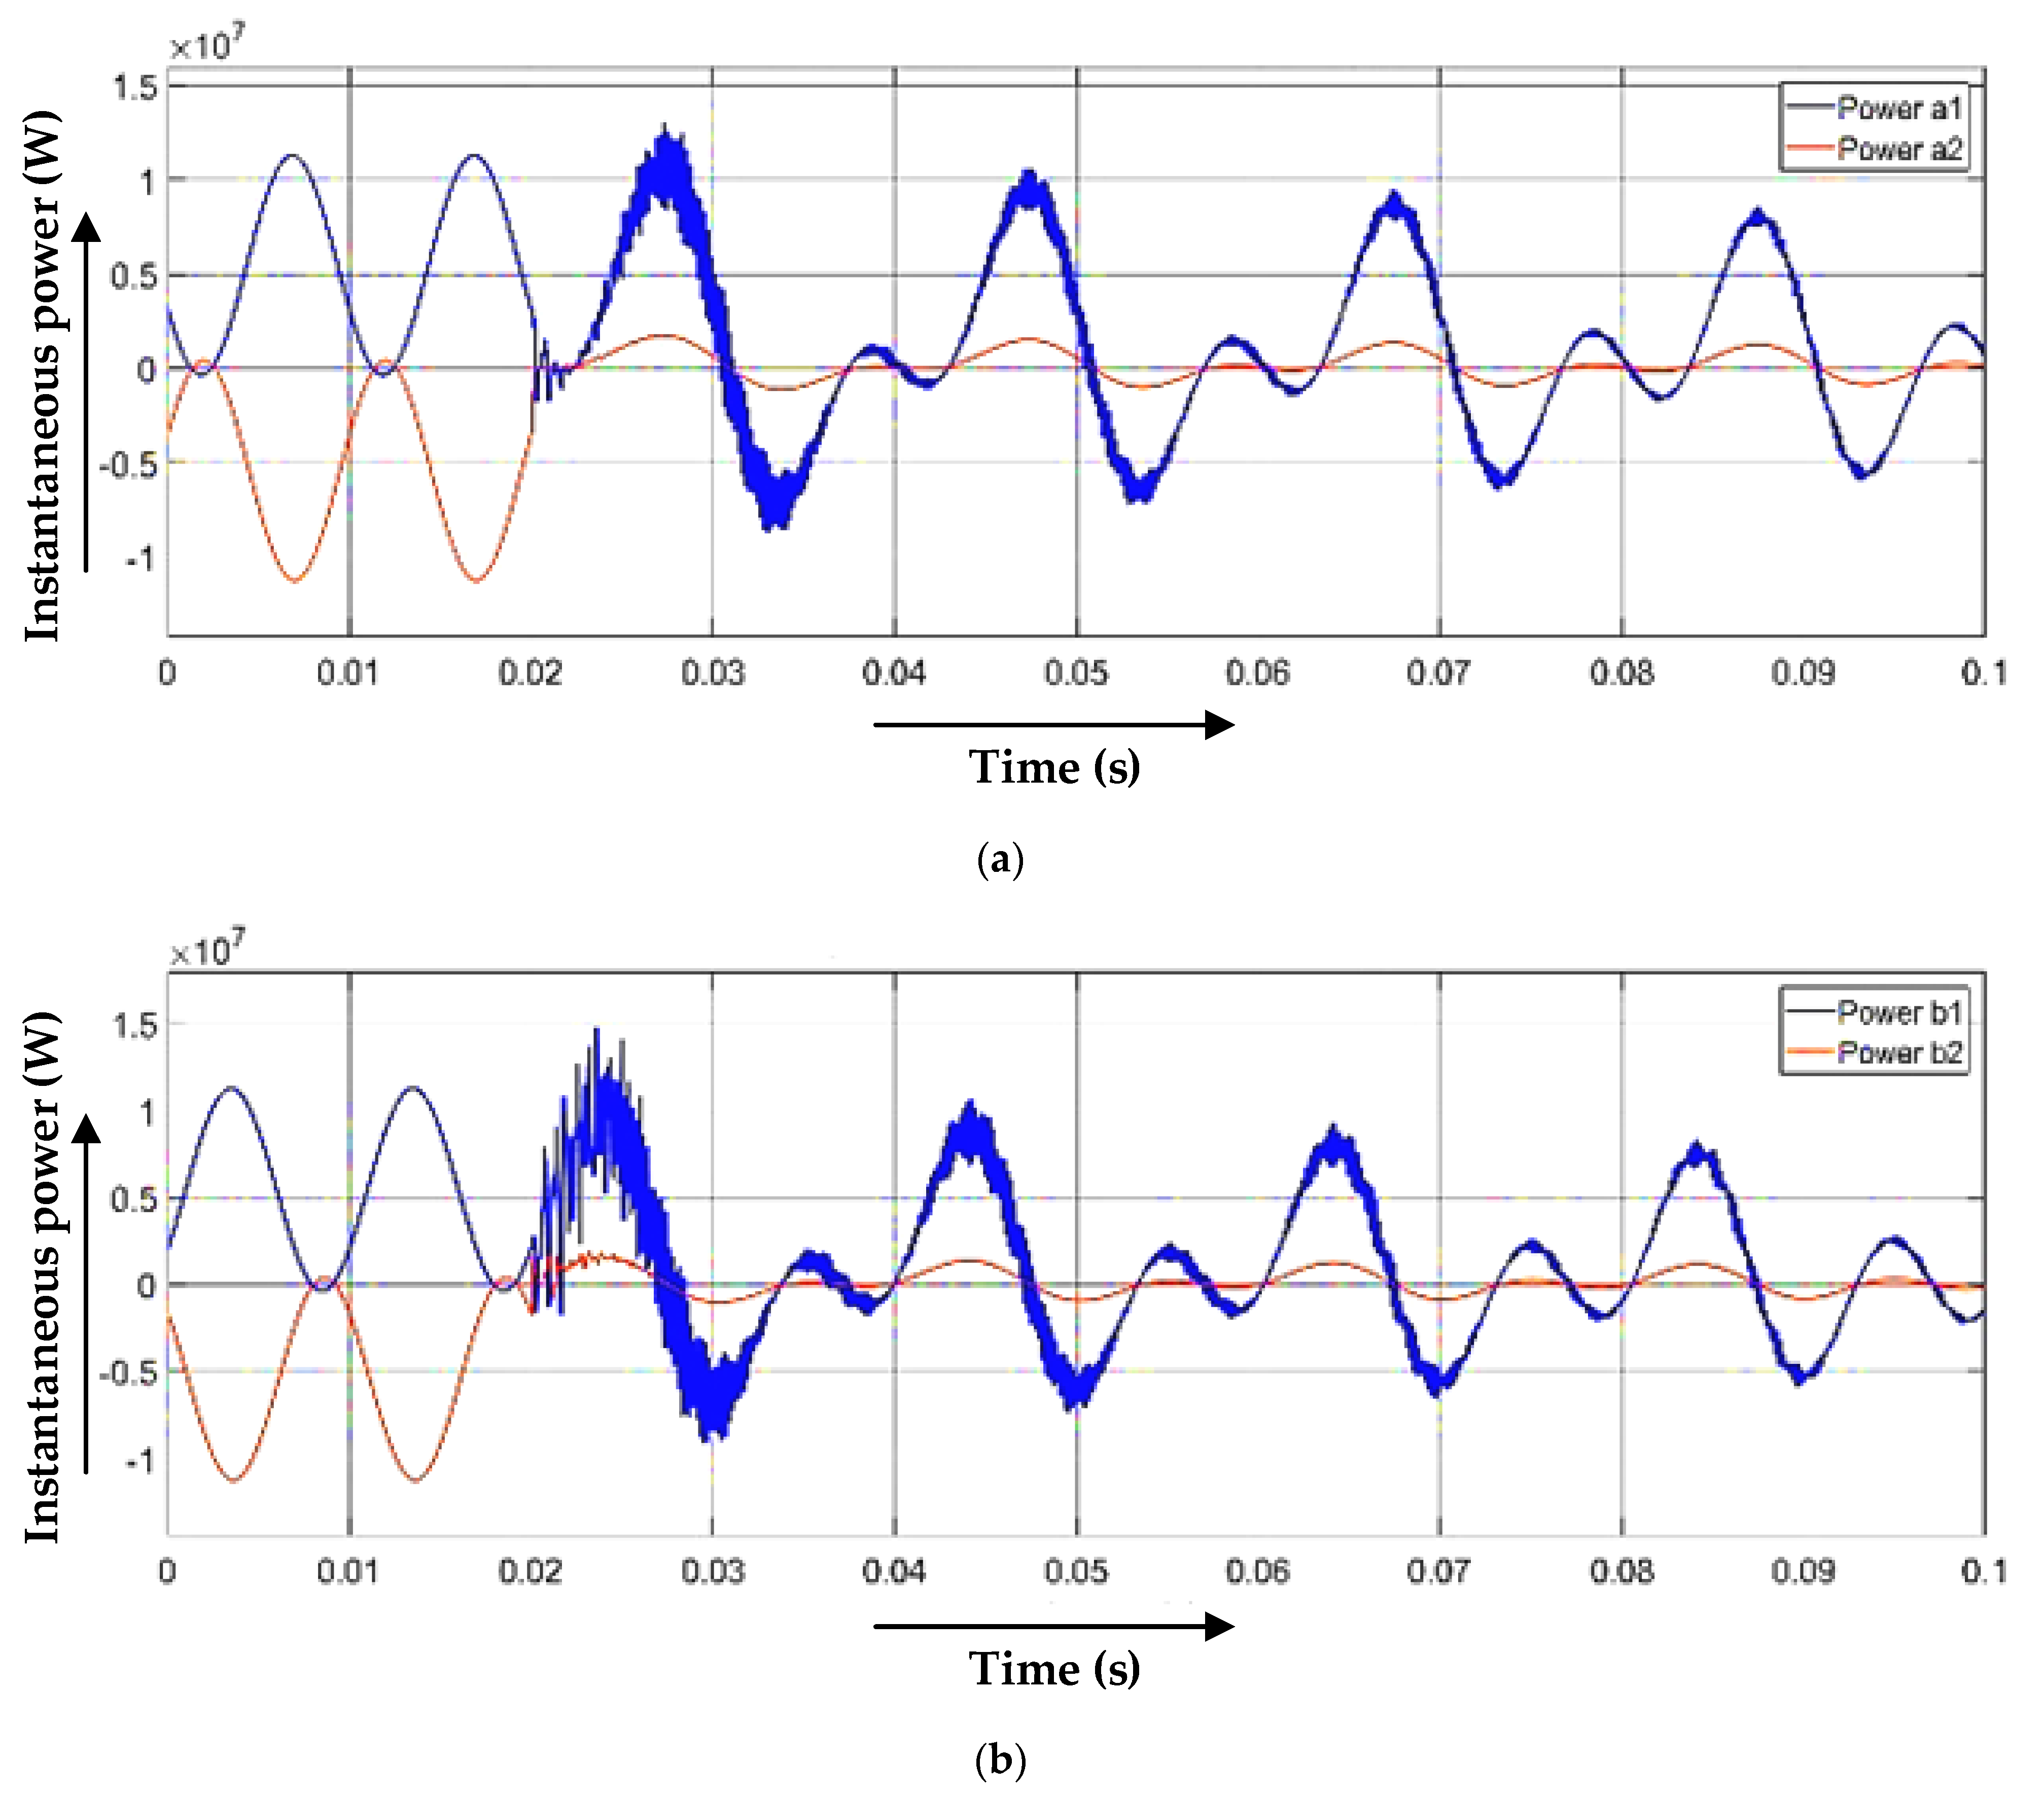
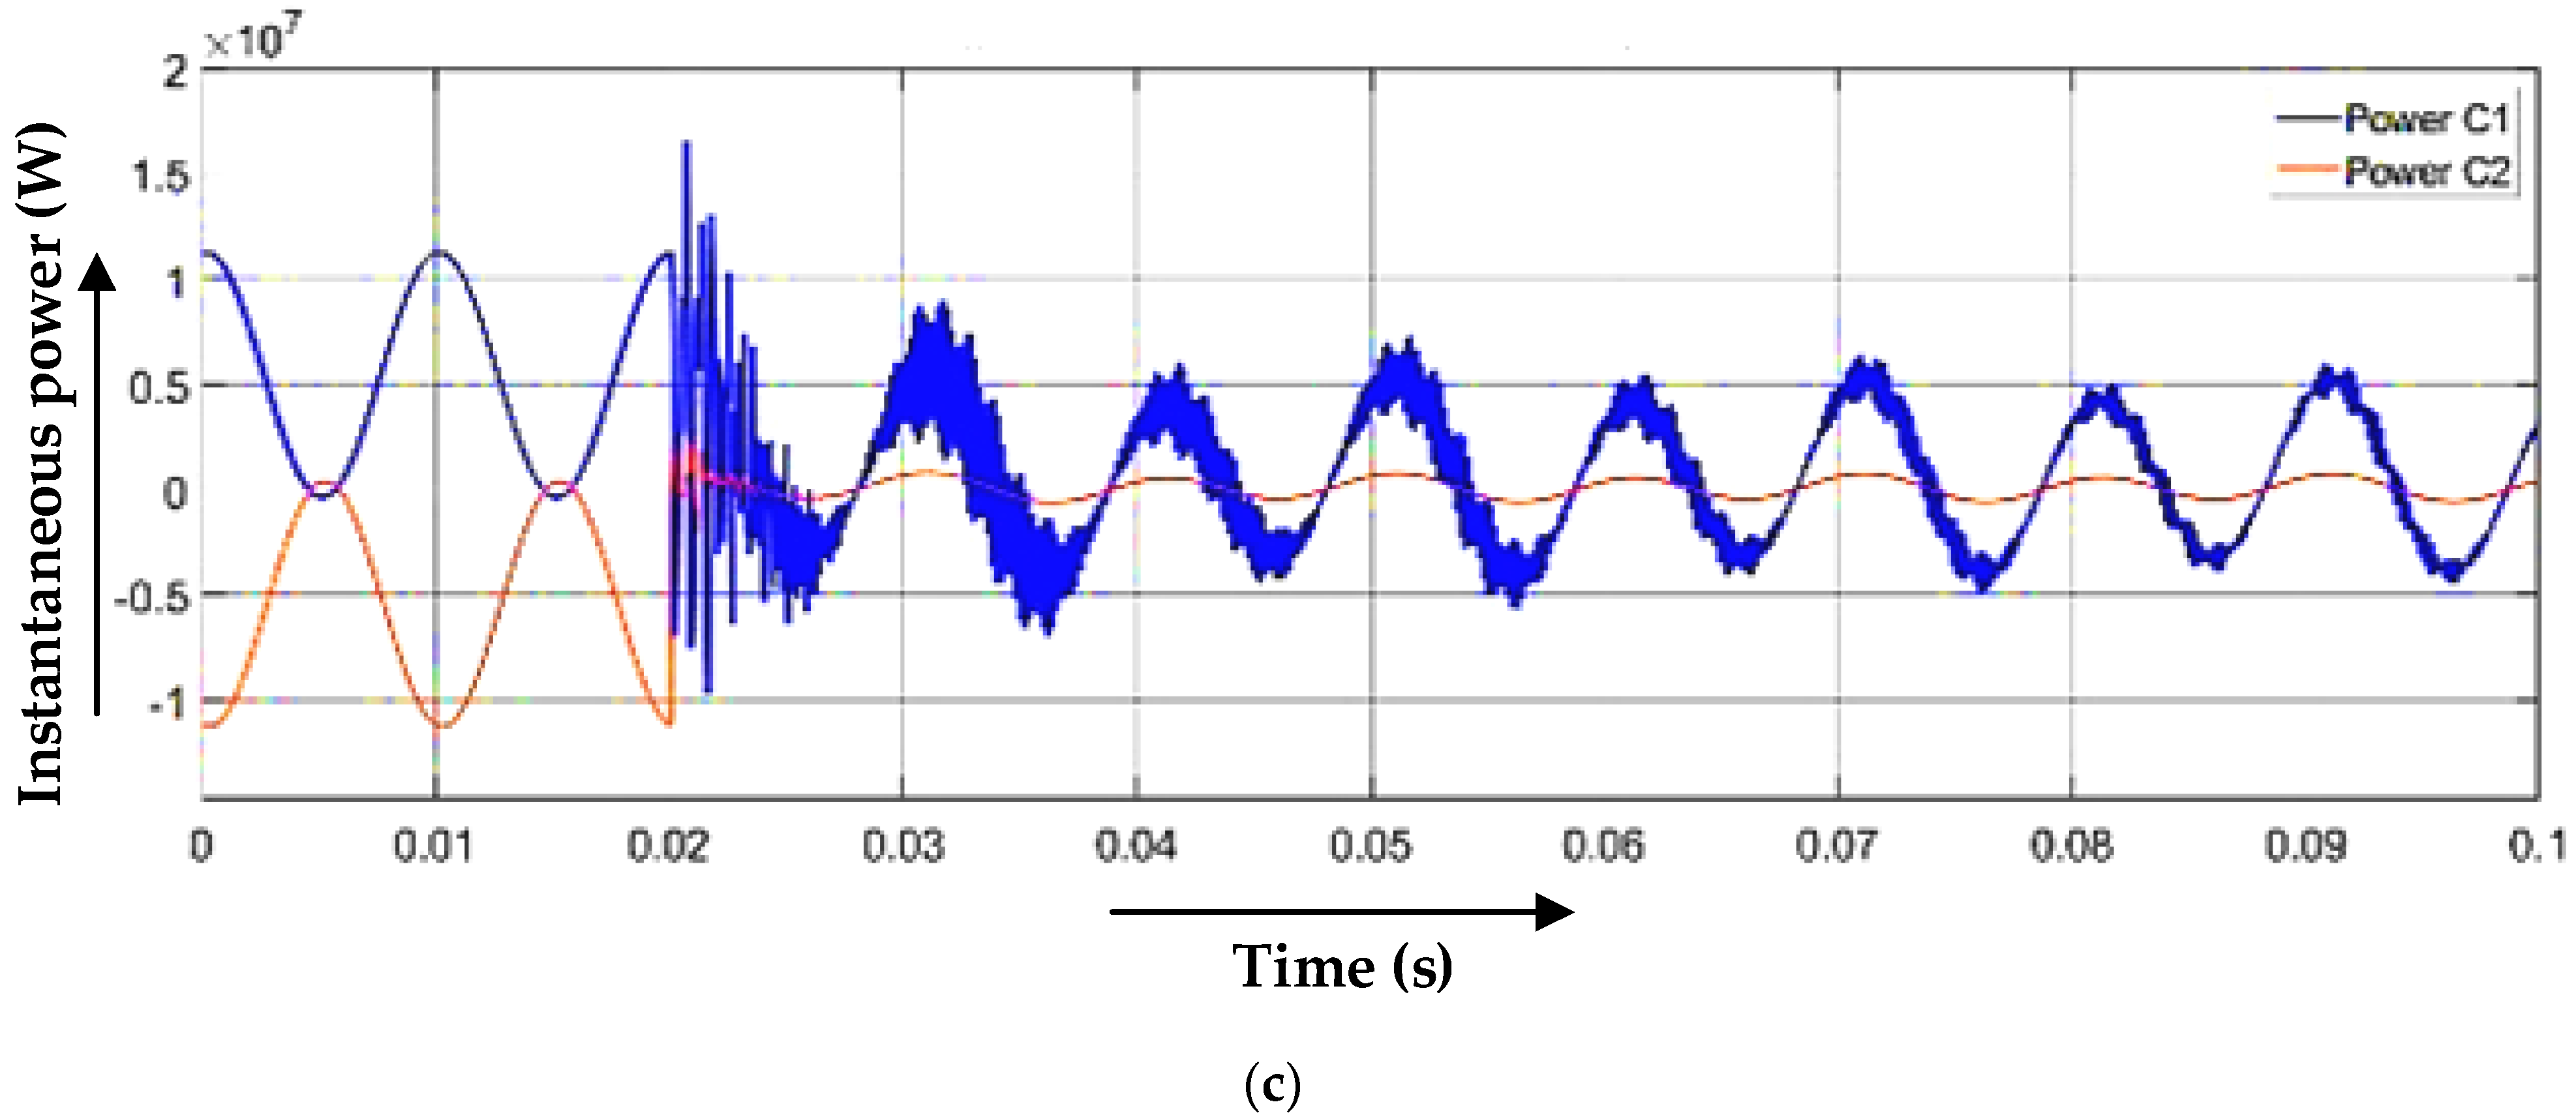
Figure 3a shows that at time 0.02 s, the instantaneous power of the other end of phase ‘a’ changes direction and its sign of magnitude, while the other two phases remain constant. Figure 4a shows that P s g n t for phase ‘a’ is approximately equal to zero at fault time 0.02 s, irrespective of the transient effects.
Therefore, these results show that the system experiences a single line-to-ground fault in phase ‘a’.
P 1 a f t > 0 ,   P 2 a f t > 0 P 1 b f t > 0 ,   P 2 b f t < 0 P 1 c f t > 0 ,   P 2 c f t < 0

3.2. Line-to-Line Fault

A line-to-line fault is created in a test system. P 1 t , P 2 t and P s g n t are examined and are shown in Figure 5 and Figure 6, respectively.
It is observed from Figure 5a,b that the instantaneous power from one end becomes inverted after the fault interception time of 0.02 s. From Figure 6a,b, it is observed that P s g n t for phase ‘a’ and phase ‘b’ is approximately equal to zero at a fault time of 0.02 s. This depicts that the line experiences a double-line fault for phase ‘a’ and phase ‘b’.
P 1 a f t > 0 ,   P 2 a f t > 0 P 1 b f t > 0 ,   P 2 b f t > 0 P 1 c f t > 0 ,   P 2 c f t < 0
Double-line or double-line-to-ground fault cannot be discriminated against without the zero-sequence components.
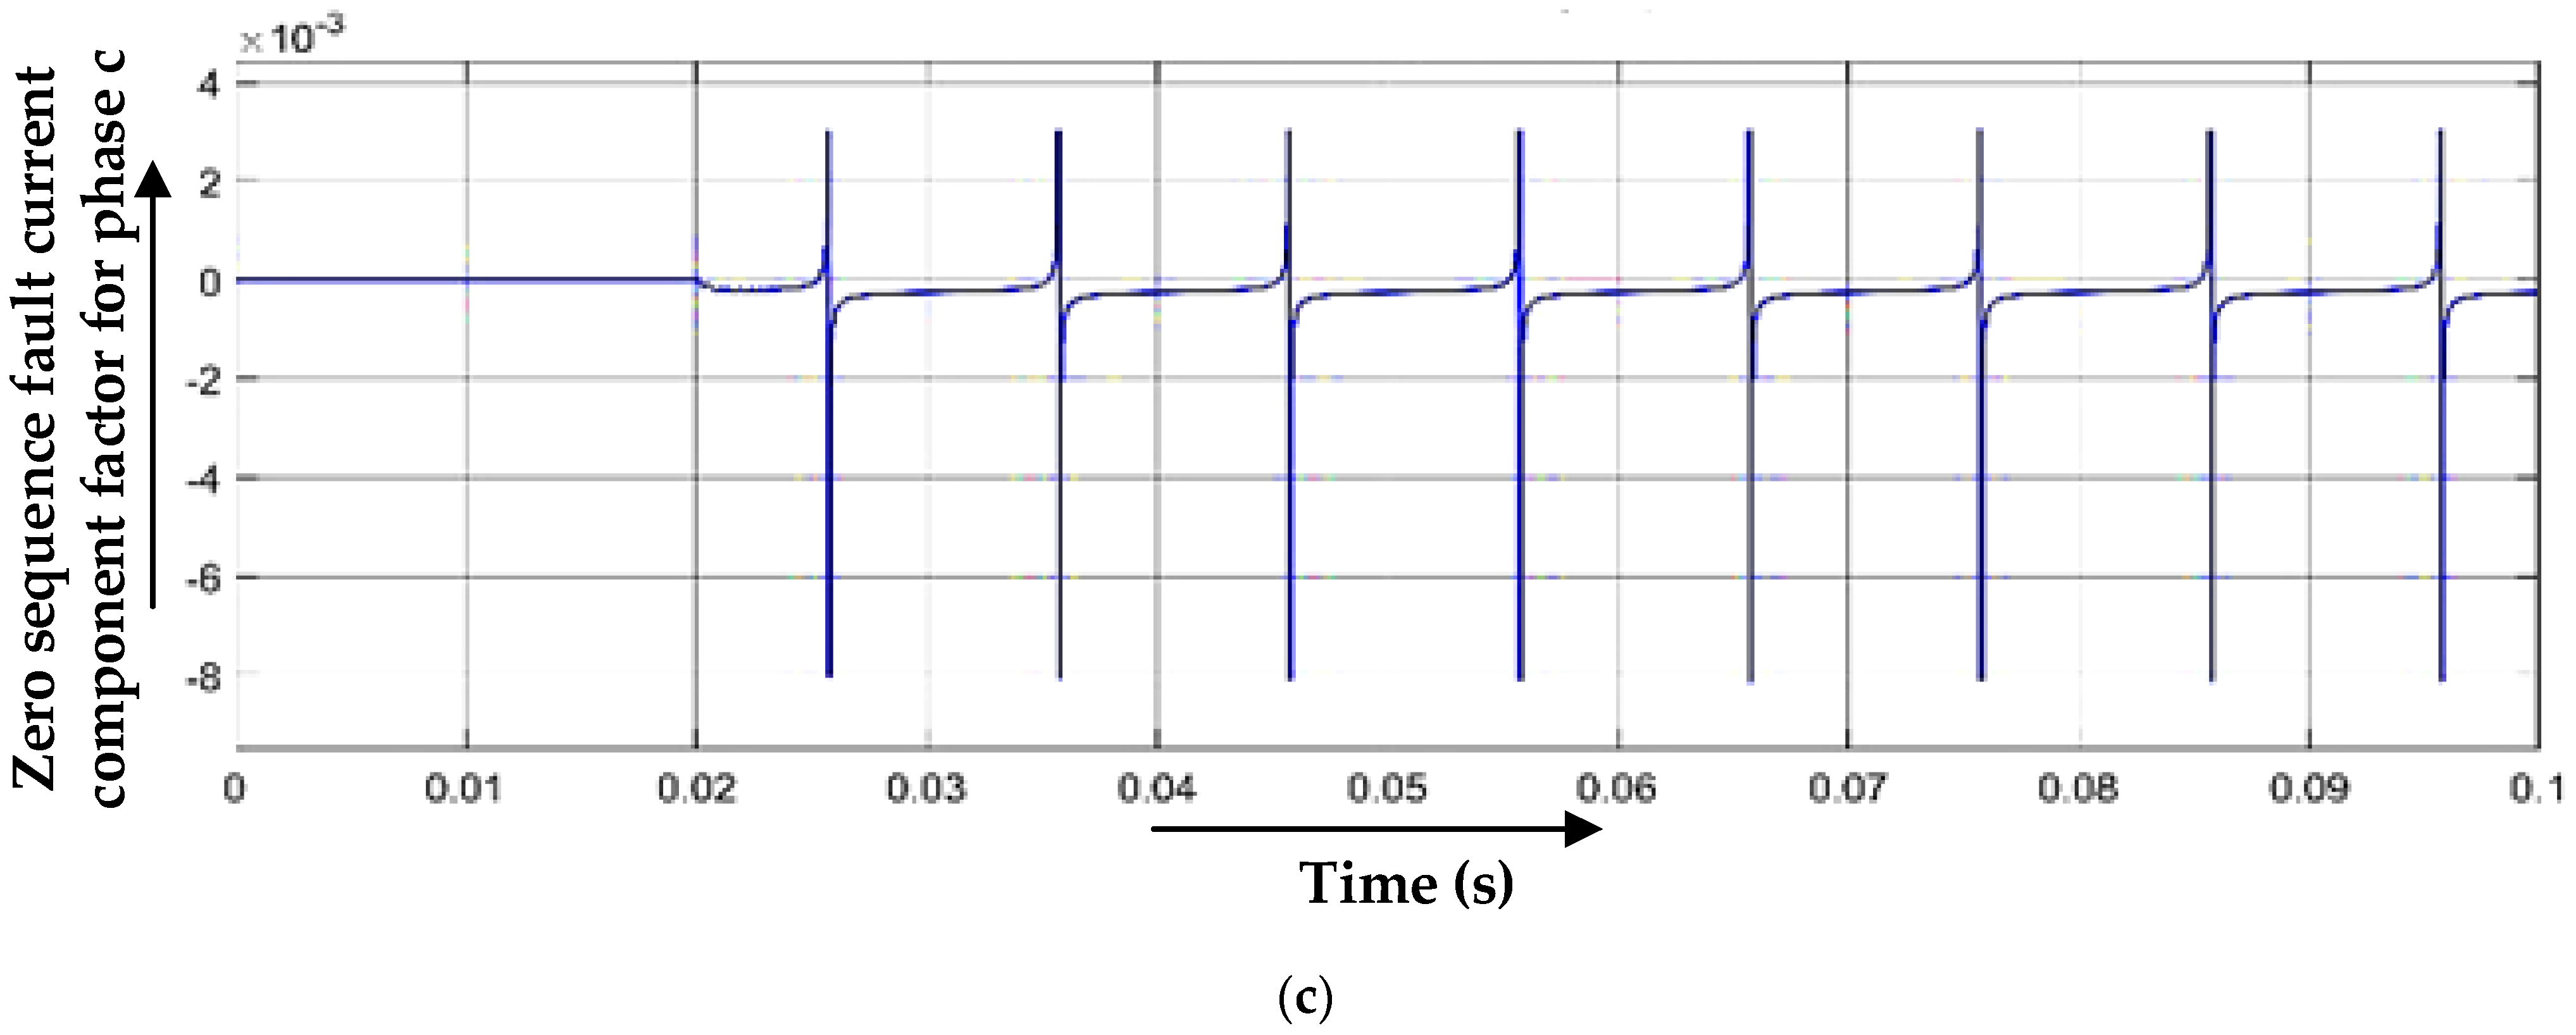
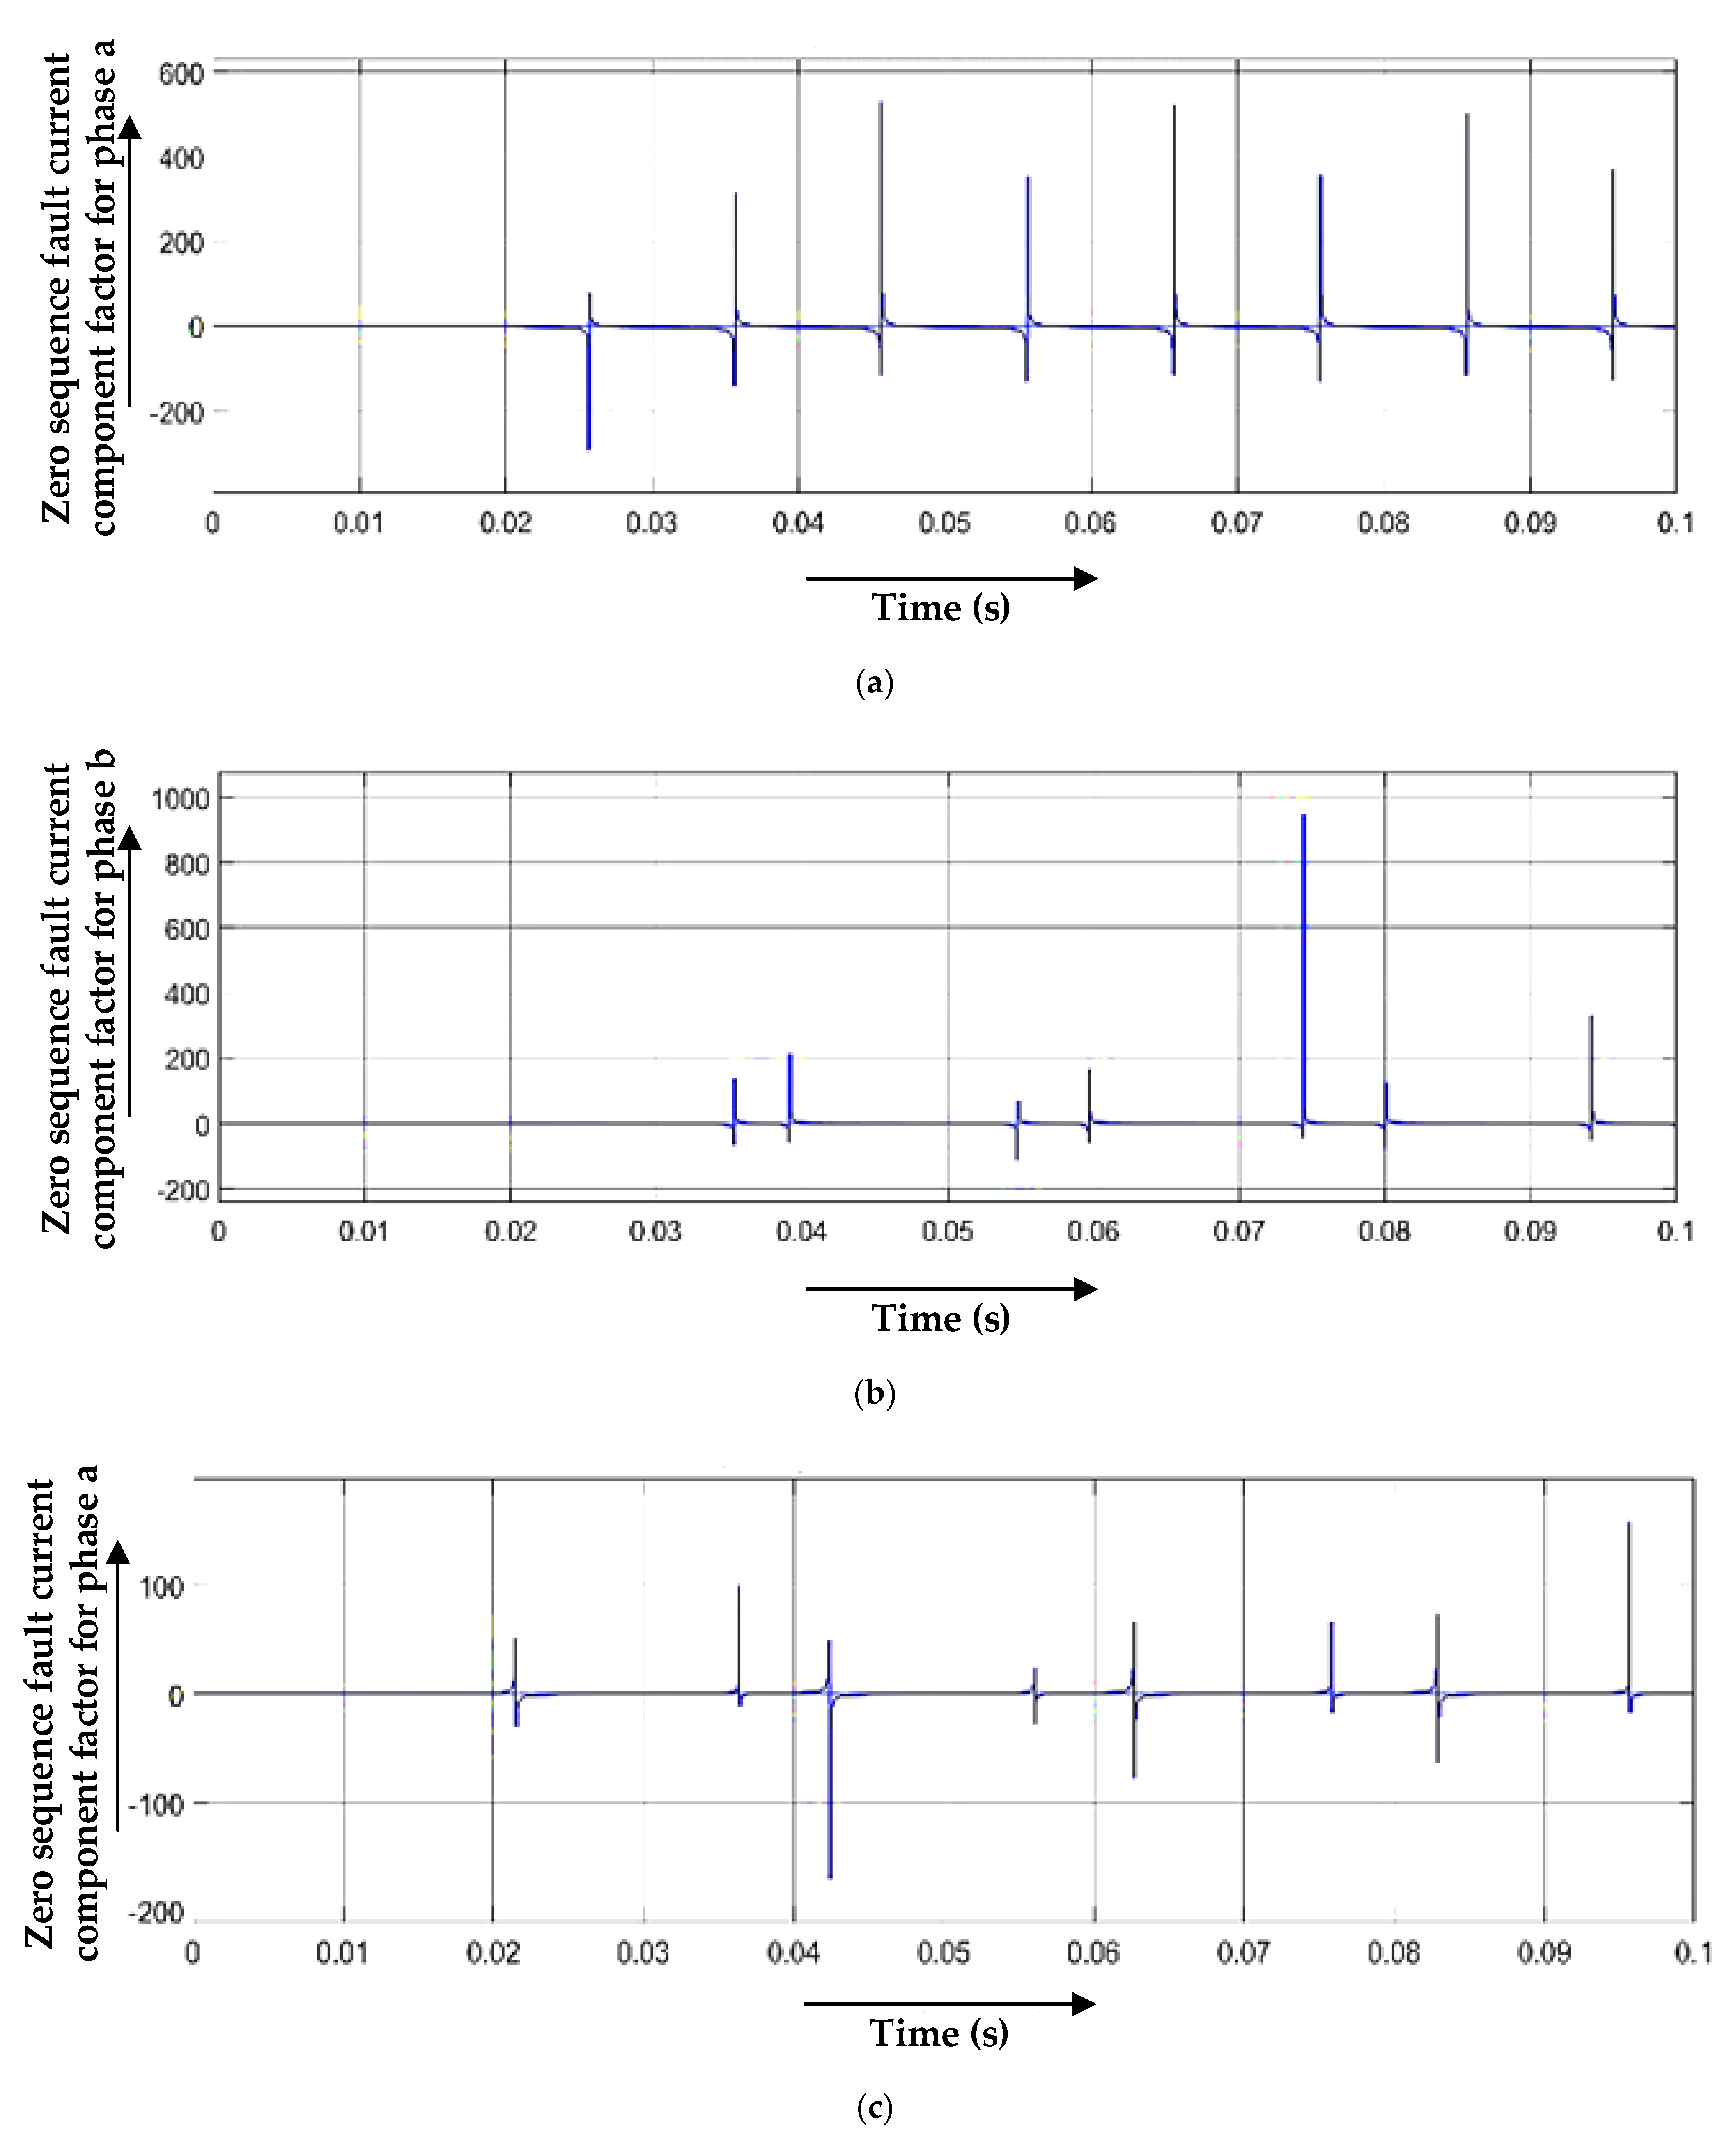
Zero-sequence current factors F a , F b , and F c for phase ‘a’, phase ‘b’, and phase ‘c’ are computed by this method respectively.
I f t = I a t + I b t + I c t
F a = I f t I a t ,   F b = I f t I b t ,   F c = I f t I c t
Figure 7 shows the zero-sequence components for the double-line-to-ground fault. It is observed that the zero-sequence current factor value is quite small, as is the case of a double-line fault.

3.3. Double-Line-to-Ground Fault

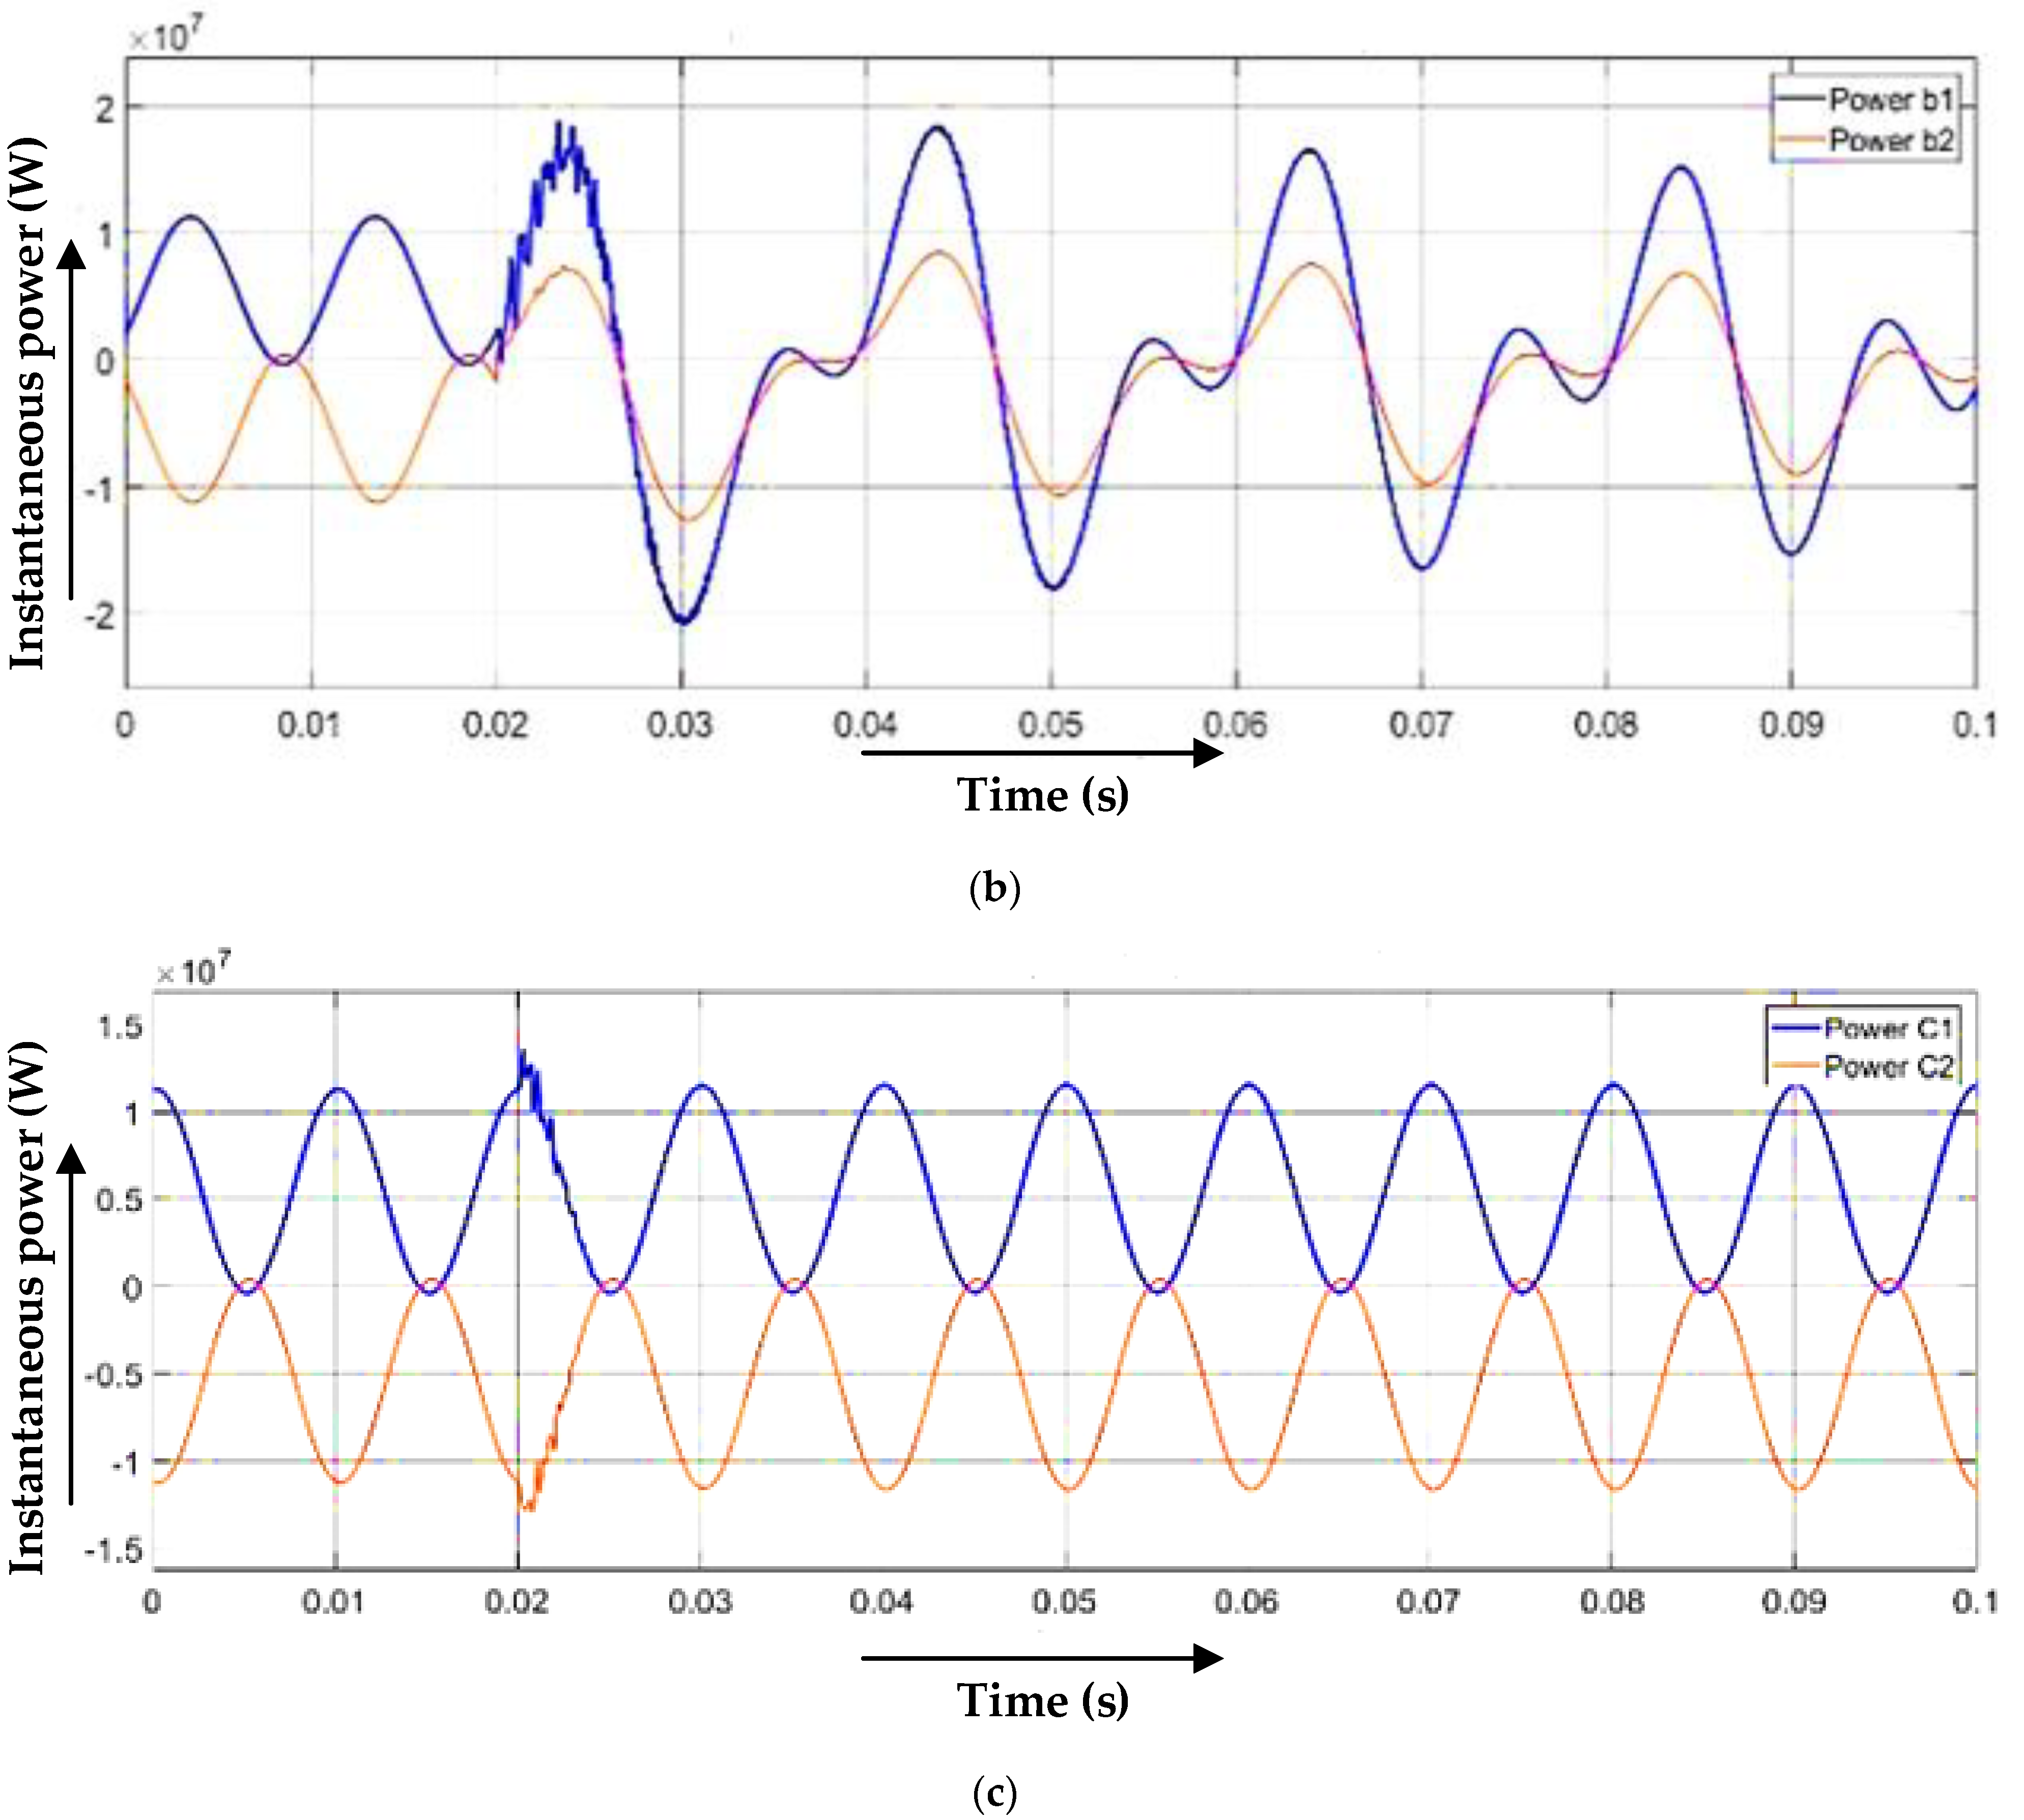
The test system is simulated for the double-line-to-ground fault. Figure 8 shows the instantaneous power for both ends for three phases for the ‘abg’ fault.
It is observed from Figure 8a,c, that the instantaneous power of phase ‘a’ and phase ‘b’ of both ends gets positive after a fault time of 0.02 s.
P 1 a f t > 0 ,   P 2 a f t > 0 P 1 b f t > 0 ,   P 2 b f t > 0 P 1 c f t > 0 ,   P 2 c f t < 0
From Figure 9a,b, it is found that P s g n t = 0   for phase ‘a’ and phase ‘b’ at fault time inception of 0.02 s. Since it is a double-line fault, for the classification between double-line and double-line-to-ground, zero-sequence current factors are computed.
In the double-line-to-ground fault, the zero-sequence current factors’ value is quite significant, as shown in Figure 10, after the fault inception time of 0.02 s.
This observation classifies this fault as the double-line-to-ground fault.

3.4. Line-to-Line and Line Fault (Three-Line Fault)

The test system is simulated for three-line fault ‘abc’, as shown in Figure 11. After time 0.02 s, it is observed that the instantaneous power of the three phases of both ends is positive.
P 1 a f t > 0 ,   P 2 a f t > 0 P 1 b f t > 0 ,   P 2 b f t > 0 P 1 c f t > 0 ,   P 2 c f t > 0
Figure 11 represents the simulations of instantaneous power for a three-phase fault applied at 0.02 s. It is observed that the instantaneous power of three phases of the line from the other end gets a positive value after the fault inception time of 0.02 s. From Figure 12, it is found that P s g n t is approximately equal to zero for all three phases of the line after the fault inception time of 0.02 s.

4. Location of Faults

For the fault location, voltage profiles are built into the line at different segments. Samples of voltage are compared to determine the location of the fault. The point that has the lowest voltage level will be the location of the fault, as the fault point always has the least voltage level. Therefore, by this approach, the exact fault point can be located. It can be an easy and more accurate method to find the exact location of the fault.
IEEE-9 bus systems have been simulated for different types of faults. The test system consists of six lines, and the length of each line is 100 km. The system is simulated for every line by applying different types of faults at different locations. The faults are applied at 0 km, 25 km, 50 km, and 75 km on each line of the system. The fault's exact location and computed location are presented in Table 1 for different transmission lines.

5. Research Outcomes and Limitations

Based on the simulation results, it is observed that faults are identified, classified, and located with an accuracy of more than 97% and within the minimum possible time. These observations led to the development of rapid relaying mechanisms with reduced computations, resulting in the reduction in time of protection. Furthermore, the proposed technique is useful in the classification of faults through machine learning and deep learning techniques because the proposed techniques provide not only the magnitude comparison of instantaneous powers, but also enable gathering information about the healthy and faulty cases with the sign of the instantaneous values of power. Therefore, a database consisting of not only the values, but also the sign convention serves as a tool for training and testing the algorithms. However, the proposed technique has a few limitations. The two terminal-based protection schemes always require synchronized values of voltages and currents at both ends of transmission lines. Synchronization is often affected by time delays. Furthermore, this technique is applied to transmission lines that are farther from the load centers. The reliability of the proposed technique can be compromised in power distribution lines near the load centers because the sign convention of instantaneous values of the power of distribution lines is affected by the power factor angles of the load centers before and after the fault. Hence, instantaneous values of power are not enough for fault identification, classification, and location in power distribution lines.

6. Comparative Analysis

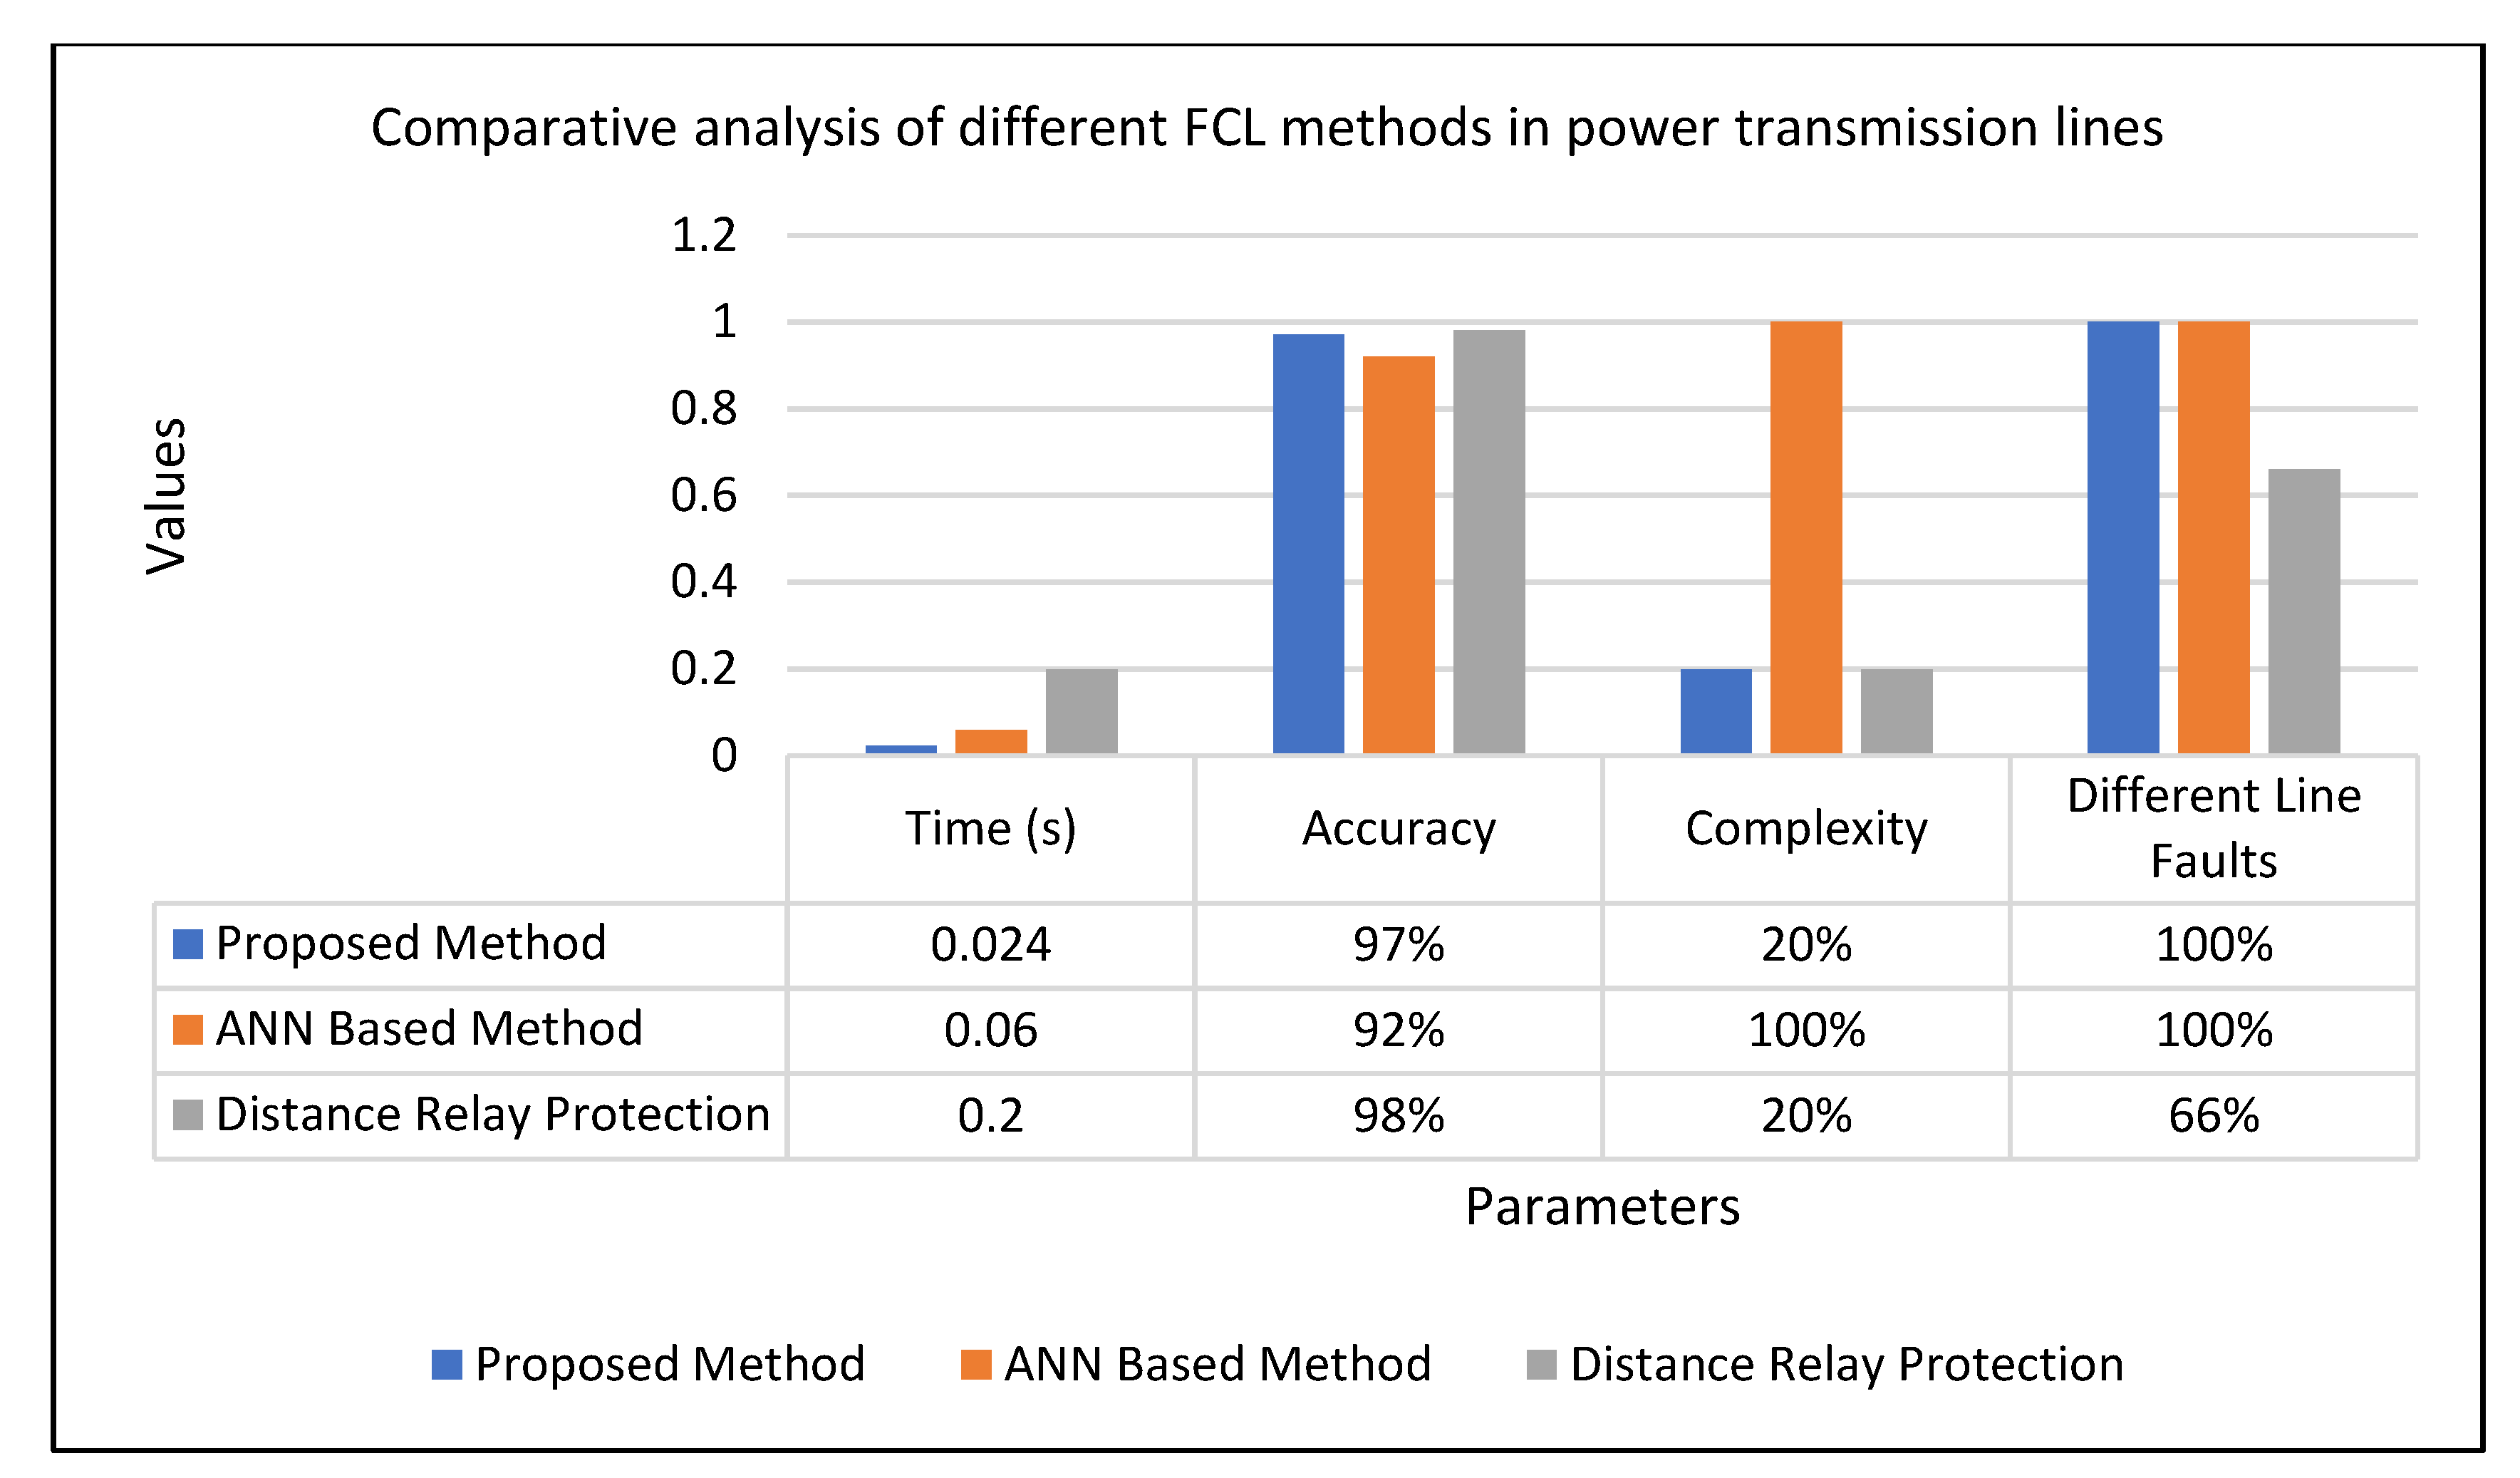
Because of its simplicity and accuracy, the proposed technique challenges the currently available techniques with exhaustive computation for accuracy. Therefore, it is necessary to evaluate the proposed method in comparison to simpler and more complex techniques for fault estimation in transmission lines. The performance of the proposed technique is compared with the existing techniques and is presented in Table 2.
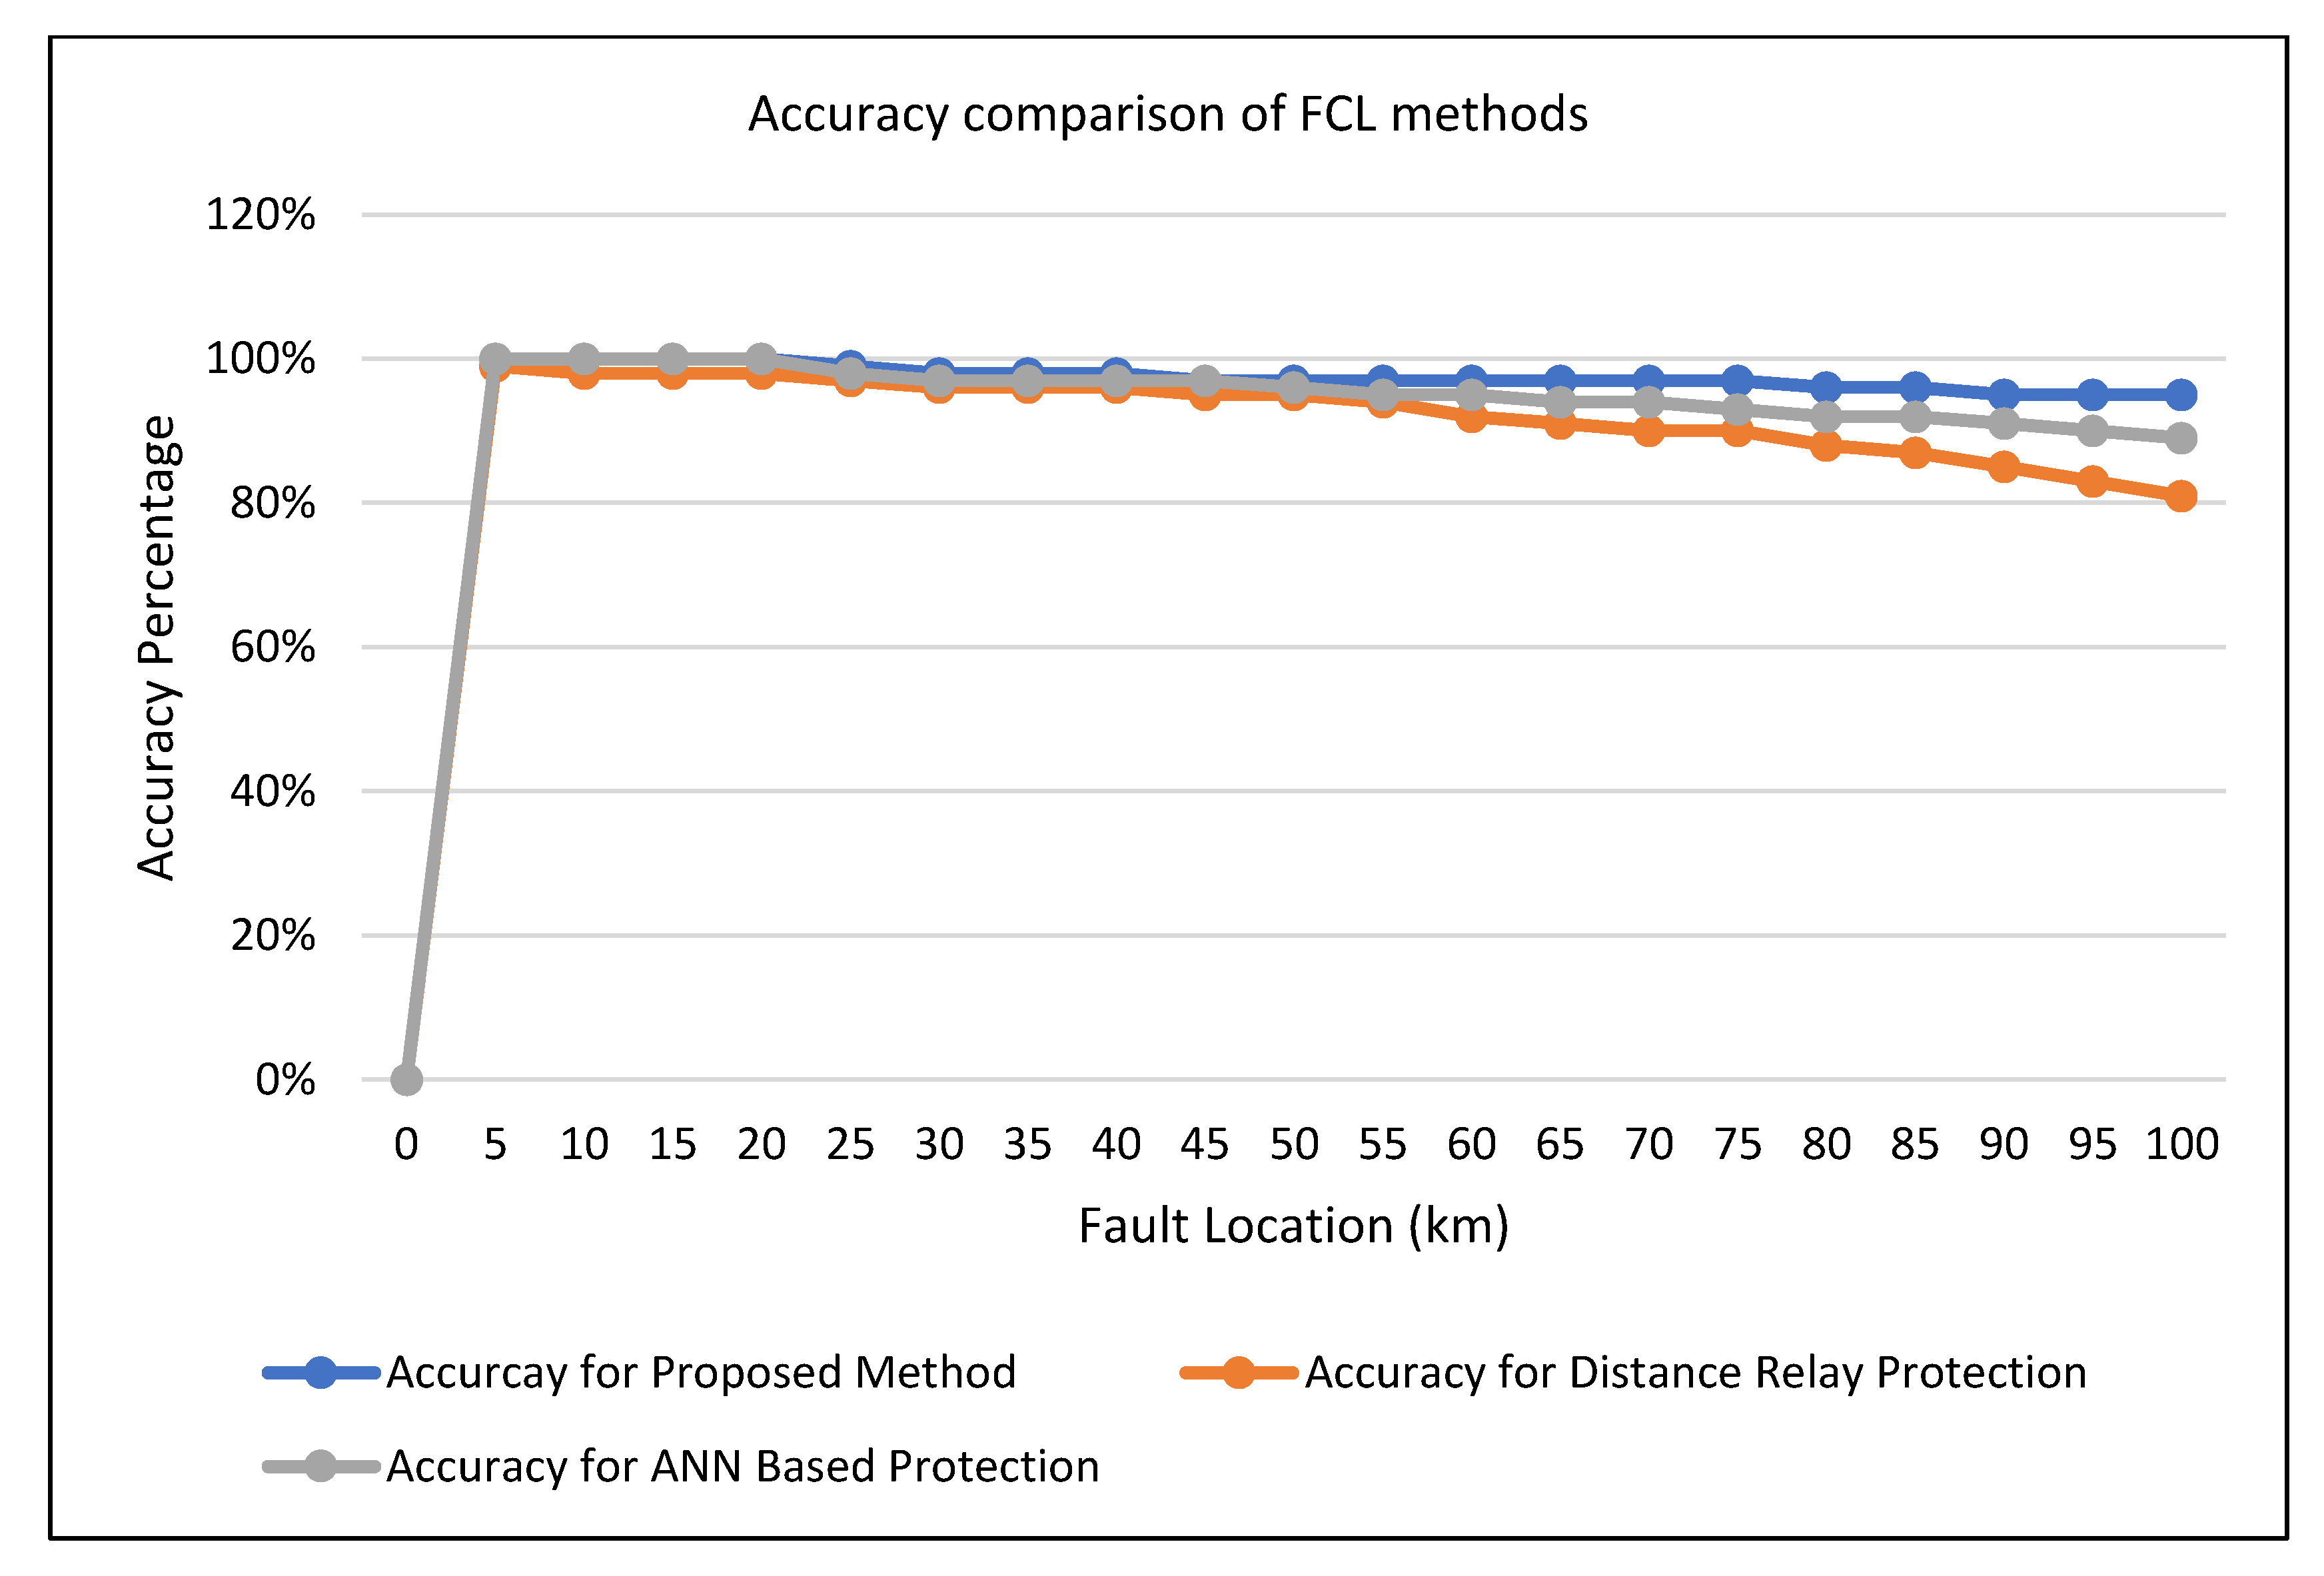
Performance parameters compared in Figure 13 depict the effectiveness of the proposed methods. Not only is the time of protection reduced significantly, but it also outclasses accuracy, complexity, and discrimination. Figure 14 compares the accuracy concerning fault location. It is observed that the proposed method is not affected by the increase in the fault distance, resulting in maintained accuracy.

7. Conclusions

A simple and efficient technique is proposed for the detection, classification, and locating of transmission line faults by using the instantaneous power samples from both ends. It is found from the simulation scenarios that the proposed method has an accuracy of more than 97%. Different fault locations are estimated in this research with an error of not more than 0.45%. Moreover, it is found from the fault classification and location that the time difference between the actual and calculated fault is not more than 0.004 s, which depicts its rapidness. The proposed method has the following characteristics:
  • It does not require threshold comparison and requires only voltage and current samples from both ends of the line.
  • It detects the fault in a very short time, and its fast response does not affect its accuracy.
  • It can discriminate between faulty and non-faulty conditions.
  • It can operate well with modern relays. The operation of the relay does not affect its performance.
  • The rapidness makes this technique an ideal candidate for the power system integrated with renewable energy sources. In addition to this, peer-to-peer energy trading can be offered with the implementation of this technique.
  • This technique is implemented on the IEEE-9 bus system for various types of faults and various fault locations. Its performance is not affected by any parameter of the system. This property highlights its effectiveness on any type of system.

Author Contributions

Conceptualization, R.M., N.S., and U.A.; Data curation, R.M. and N.S.; Formal analysis, R.M., R.A., A.R., N.S., and U.A.; Investigation, R.M., R.A., and A.R.; Methodology, R.M., R.A., A.R., and U.A.; Project administration, R.M., A.R., and U.A.; Software, R.M., R.A., N.S., and U.A.; Supervision, R.M., N.S., and U.A.; Validation, R.M., A.R., N.S., and U.A.; Writing—original draft, R.M., R.A., A.R., N.S., and U.A.; Writing—review & editing, R.M., R.A., A.R., N.S., and U.A.; Funding acquisition, A.R., N.S., and U.A.; Resources, N.S. and U.A. All authors have read and agreed to the published version of the manuscript.

Funding

This research received no external funding.

Institutional Review Board Statement

Not applicable.

Informed Consent Statement

Not applicable.

Data Availability Statement

Not applicable.

Acknowledgments

The authors are thankful to the (i) Department of Electrical Engineering, The University of Lahore, Lahore, Pakistan, (ii) Department of Electrical and Computer Engineering, Comsats University Islamabad, Lahore, Pakistan, (iii) Department of Electrical, Electronics and Telecommunication Engineering, University of Engineering and Technology, Lahore, Pakistan, and (iv) Department of Electrical and Computer Engineering, King Abdulaziz University, Jeddah 21589, Saudi Arabia for providing us with the research facilities.

Conflicts of Interest

The authors declare no conflict of interest.

References

  1. Sachdev, M.S.; Baribeau, M.A. A New Algorithm for Digital Impedance Relays. IEEE Trans. Power Appar. Syst. 1979, PAS-98, 2232–2240. [Google Scholar] [CrossRef]
  2. Girgis, A.A. A New Kalman Filtering Based Digital Distance Relay. IEEE Trans. Power Appar. Syst. 1982, PAS-101, 3471–3480. [Google Scholar] [CrossRef]
  3. Takagi, T.; Yamakoshi, Y.; Baba, J.; Uemura, K.; Sakaguchi, T. A New Algorithm of an Accurate Fault Location for EHV/UHV Transmission Lines: Part II-Laplace Transform Method. IEEE Trans. Power Appar. Syst. 1982, PAS-10, 564–573. [Google Scholar] [CrossRef]
  4. Johns, A.T.; Jamali, S. Accurate Fault Location Technique for Power Transmission Lines. IEE Proc. C Gener. Transm. Distrib. 1990, 137, 395–402. [Google Scholar] [CrossRef]
  5. Hussain, A.; Kim, C.-H.; Admasie, S. An intelligent islanding detection of distribution networks with synchronous machine DG using ensemble learning and canonical methods. IET Gener. Transm. Distrib. 2021, 15, 3242–3255. [Google Scholar] [CrossRef]
  6. Poeltl, A.; Frohlich, K. Two New Methods for Very Fast Fault Type Detection by Means of Parameter Fitting and Artificial Neural Networks. IEEE Trans. Power Deliv. 1999, 14, 1269–1275. [Google Scholar] [CrossRef]
  7. Saha, M.M.; Izykowski, J.; Rosolowski, E.; Kasztenny, B. A New Accurate Fault Locating Algorithm for Series Compensated Lines. IEEE Trans. Power Deliv. 1999, 14, 789–797. [Google Scholar] [CrossRef]
  8. Youssef, O.A.S. Combined Fuzzy-Logic Wavelet-Based Fault Classification Technique for Power System Relaying. IEEE Trans. Power Deliv. 2004, 19, 582–589. [Google Scholar] [CrossRef]
  9. Kezunovic, M.; Perunicic, B. Automated Transmission Line Fault Analysis Using Synchronized Sampling at Two Ends. In IEEE Trans. Power Syst.; 1996; Volume 11, pp. 441–447. [Google Scholar] [CrossRef]
  10. Gopalakrishnan, A.; Kezunovic, M.; McKenna, S.M.; Hamai, D.M. Fault Location Using the Distributed Parameter Transmission Line Model. IEEE Trans. Power Deliv. 2000, 15, 1169–1174. [Google Scholar] [CrossRef]
  11. Muzzammel, R. Machine Learning Based Fault Diagnosis in HVDC Transmission Lines. In Intelligent Technologies and Applications; Bajwa, I.S., Kamareddine, F., Costa, A., Eds.; Communications in Computer and Information Science; Springer: Singapore, 2019. [Google Scholar] [CrossRef]
  12. Muzzammel, R. Traveling Waves-Based Method for Fault Estimation in HVDC Transmission System. Energies 2019, 12, 3614. [Google Scholar] [CrossRef] [Green Version]
  13. Muzzammel, R. Restricted Boltzmann Machines Based Fault Estimation in Multi Terminal HVDC Transmission System. In Intelligent Technologies and Applications; Bajwa, I.S., Sibalija, T., Jawawi, D.N.A., Eds.; Communications in Computer and Information Science; Springer: Singapore, 2020. [Google Scholar] [CrossRef]
  14. Muzzammel, R.; Raza, A. Low Impedance Fault Identification and Classification Based on Boltzmann Machine Learning for HVDC Transmission Systems. J. Mod. Power Syst. Clean Energy 2021, 10, 440–449. [Google Scholar] [CrossRef]
  15. Muzzammel, R.; Raza, A. Fault Classification and Location in MT-HVDC Systems Based on Machine. In Artificial Intelligence Applications in Electrical Transmission and Distribution Systems Protection; Taylor and Francis: Boca, Raton, 2021. [Google Scholar]
  16. Muzzammel, R.; Raza, A. A Support Vector Machine Learning-Based Protection Technique for MT-HVDC Systems. Energies 2020, 13, 6668. [Google Scholar] [CrossRef]
  17. Salat, R.; Osowski, S. Accurate Fault Location in the Power Transmission Line Using Support Vector Machine Approach. IEEE Trans. Power Syst. 2004, 19, 979–986. [Google Scholar] [CrossRef]
  18. Muzzammel, R.; Raza, A.; Hussain, M.R.; Abbas, G.; Ahmed, I.; Qayyum, M.; Rasool, M.A.; Khaleel, M.A. MT–HVdc Systems Fault Classification and Location Methods Based on Traveling and Non-Traveling Waves—A Comprehensive Review. Appl. Sci. 2019, 9, 4760. [Google Scholar] [CrossRef] [Green Version]
  19. Brahma, S.M.; Girgis, A.A. Fault Location on a Transmission Line Using Synchronized Voltage Measurements. IEEE Trans. Power Deliv. 2004, 19, 1619–1622. [Google Scholar] [CrossRef]
  20. Das, B.; Reddy, J.V. Fuzzy-Logic-Based Fault Classification Scheme for Digital Distance Protection. IEEE Trans. Power Deliv. 2005, 20, 609–616. [Google Scholar] [CrossRef]
  21. Zhang, N.; Kexunovic, M. Coordinating Fuzzy ART Neural Networks to Improve Transmission Line Fault Detection and Classification. IEEE Power Engineering Society General Meeting; IEEE: San Francisco, CA, USA, 2005; Volume 1, pp. 734–740. [Google Scholar] [CrossRef]
  22. Jamil, M.; Sharma, S.K.; Singh, R. Fault Detection and Classification in Electrical Power Transmission System Using Artificial Neural Network. SpringerPlus 2015, 4, 334. [Google Scholar] [CrossRef] [Green Version]
  23. Jiang, J.-A.; Yang, J.-Z.; Lin, Y.-H.; Liu, C.-W.; Ma, J.-C. An adaptive PMU based fault detection/location technique for transmission lines. I. Theory and algorithms. In IEEE Trans. Power Deliv.; 2000; Volume 15, pp. 486–493. [Google Scholar] [CrossRef]
  24. Qingchao, Z.; Yao, Z.; Wennan, S.; Yixin, Y.; Zhigang, W. Fault Location of Two-Parallel Transmission Line for Non-Earth Fault Using One-Terminal Data. IEEE Power Engineering Society. 1999 Winter Meeting (Cat. No.99CH36233), IEEE: New York, NY, USA, 1999; Volume 2, 967. [Google Scholar] [CrossRef]
  25. Lin, S.; He, Z.Y.; Li, X.P.; Qian, Q.Q. Travelling Wave Time–Frequency Characteristic-Based Fault Location Method for Transmission Lines. IET Gener. Transm. Amp Distrib. 2012, 6, 764–772. [Google Scholar] [CrossRef]
  26. Yadav, A.; Swetapadma, A. A Novel Transmission Line Relaying Scheme for Fault Detection and Classification Using Wavelet Transform and Linear Discriminant Analysis. Ain Shams Eng. J. 2015, 6, 199–209. [Google Scholar] [CrossRef] [Green Version]
  27. Mansouri, S.A.; Nematbakhsh, E.; Jordehi, A.R.; Tostado-Véliz, M.; Jurado, F.; Leonowicz, Z. A Risk-Based Bi-Level Bidding System to Manage Day-Ahead Electricity Market and Scheduling of Interconnected Microgrids in the presence of Smart Homes. 2022 IEEE International Conference on Environment and Electrical Engineering and 2022 IEEE Industrial and Commercial Power Systems Europe (EEEIC/I&CPS Europe) 2022; IEEE: Prague, Czech Republic, 2022; pp. 1–6. [Google Scholar]
  28. Mansouri, S.A.; Nematbakhsh, E.; Ahmarinejad, A.; Jordehi, A.R.; Javadi, M.S.; Marzband, M. A hierarchical scheduling framework for resilience enhancement of decentralized renewable-based microgrids considering proactive actions and mobile units. Renew. Sustain. Energy Rev. 2022, 168, 112854. [Google Scholar] [CrossRef]
  29. Nasir, M.; Jordehi, A.R.; Tostado-Véliz, M.; Tabar, V.S.; Mansouri, S.A.; Jurado, F. Operation of energy hubs with storage systems, solar, wind and biomass units connected to demand response aggregators. Sustain. Cities Soc. 2022, 83, 103974. [Google Scholar] [CrossRef]
  30. Matin, S.A.A.; Mansouri, S.A.; Bayat, M.; Jordehi, A.R.; Radmehr, P. A multi-objective bi-level optimization framework for dynamic maintenance planning of active distribution networks in the presence of energy storage systems. J. Energy Storage 2022, 52, 104762. [Google Scholar] [CrossRef]
  31. Mansouri, S.A.; Ahmarinejad, A.; Sheidaei, F.; Javadi, M.S.; Jordehi, A.R.; Nezhad, A.E.; Catalão, J.P.S. A multi-stage joint planning and operation model for energy hubs considering integrated demand response programs. Int. J. Electr. Power Energy Syst. 2022, 140, 108103. [Google Scholar] [CrossRef]
  32. Mansouri, S.A.; Ahmarinejad, A.; Javadi, M.S.; Nezhad, A.E.; Shafie-Khah, M.; Catalão, J.P.S. Demand response role for enhancing the flexibility of local energy systems. In Distributed Energy Resources in Local Integrated Energy Systems; Graditi, G., Di Somma, M., Eds.; Elsevier: Amsterdam, The Netherlands, 2021; pp. 279–313. [Google Scholar] [CrossRef]
  33. Dutta, P.; Esmaeilian, A.; Kezunovic, M. Transmission-Line Fault Analysis Using Synchronized Sampling. IEEE Trans. Power Deliv. 2014, 29, 942–950. [Google Scholar] [CrossRef]
  34. Lin, Y.-H.; Liu, C.-W.; Chen, C.-S. A New PMU-Based Fault Detection/Location Technique for Transmission Lines with Consideration of Arcing Fault Discrimination-Part II: Performance Evaluation. IEEE Trans. Power Deliv. 2004, 19, 1594–1601. [Google Scholar] [CrossRef]
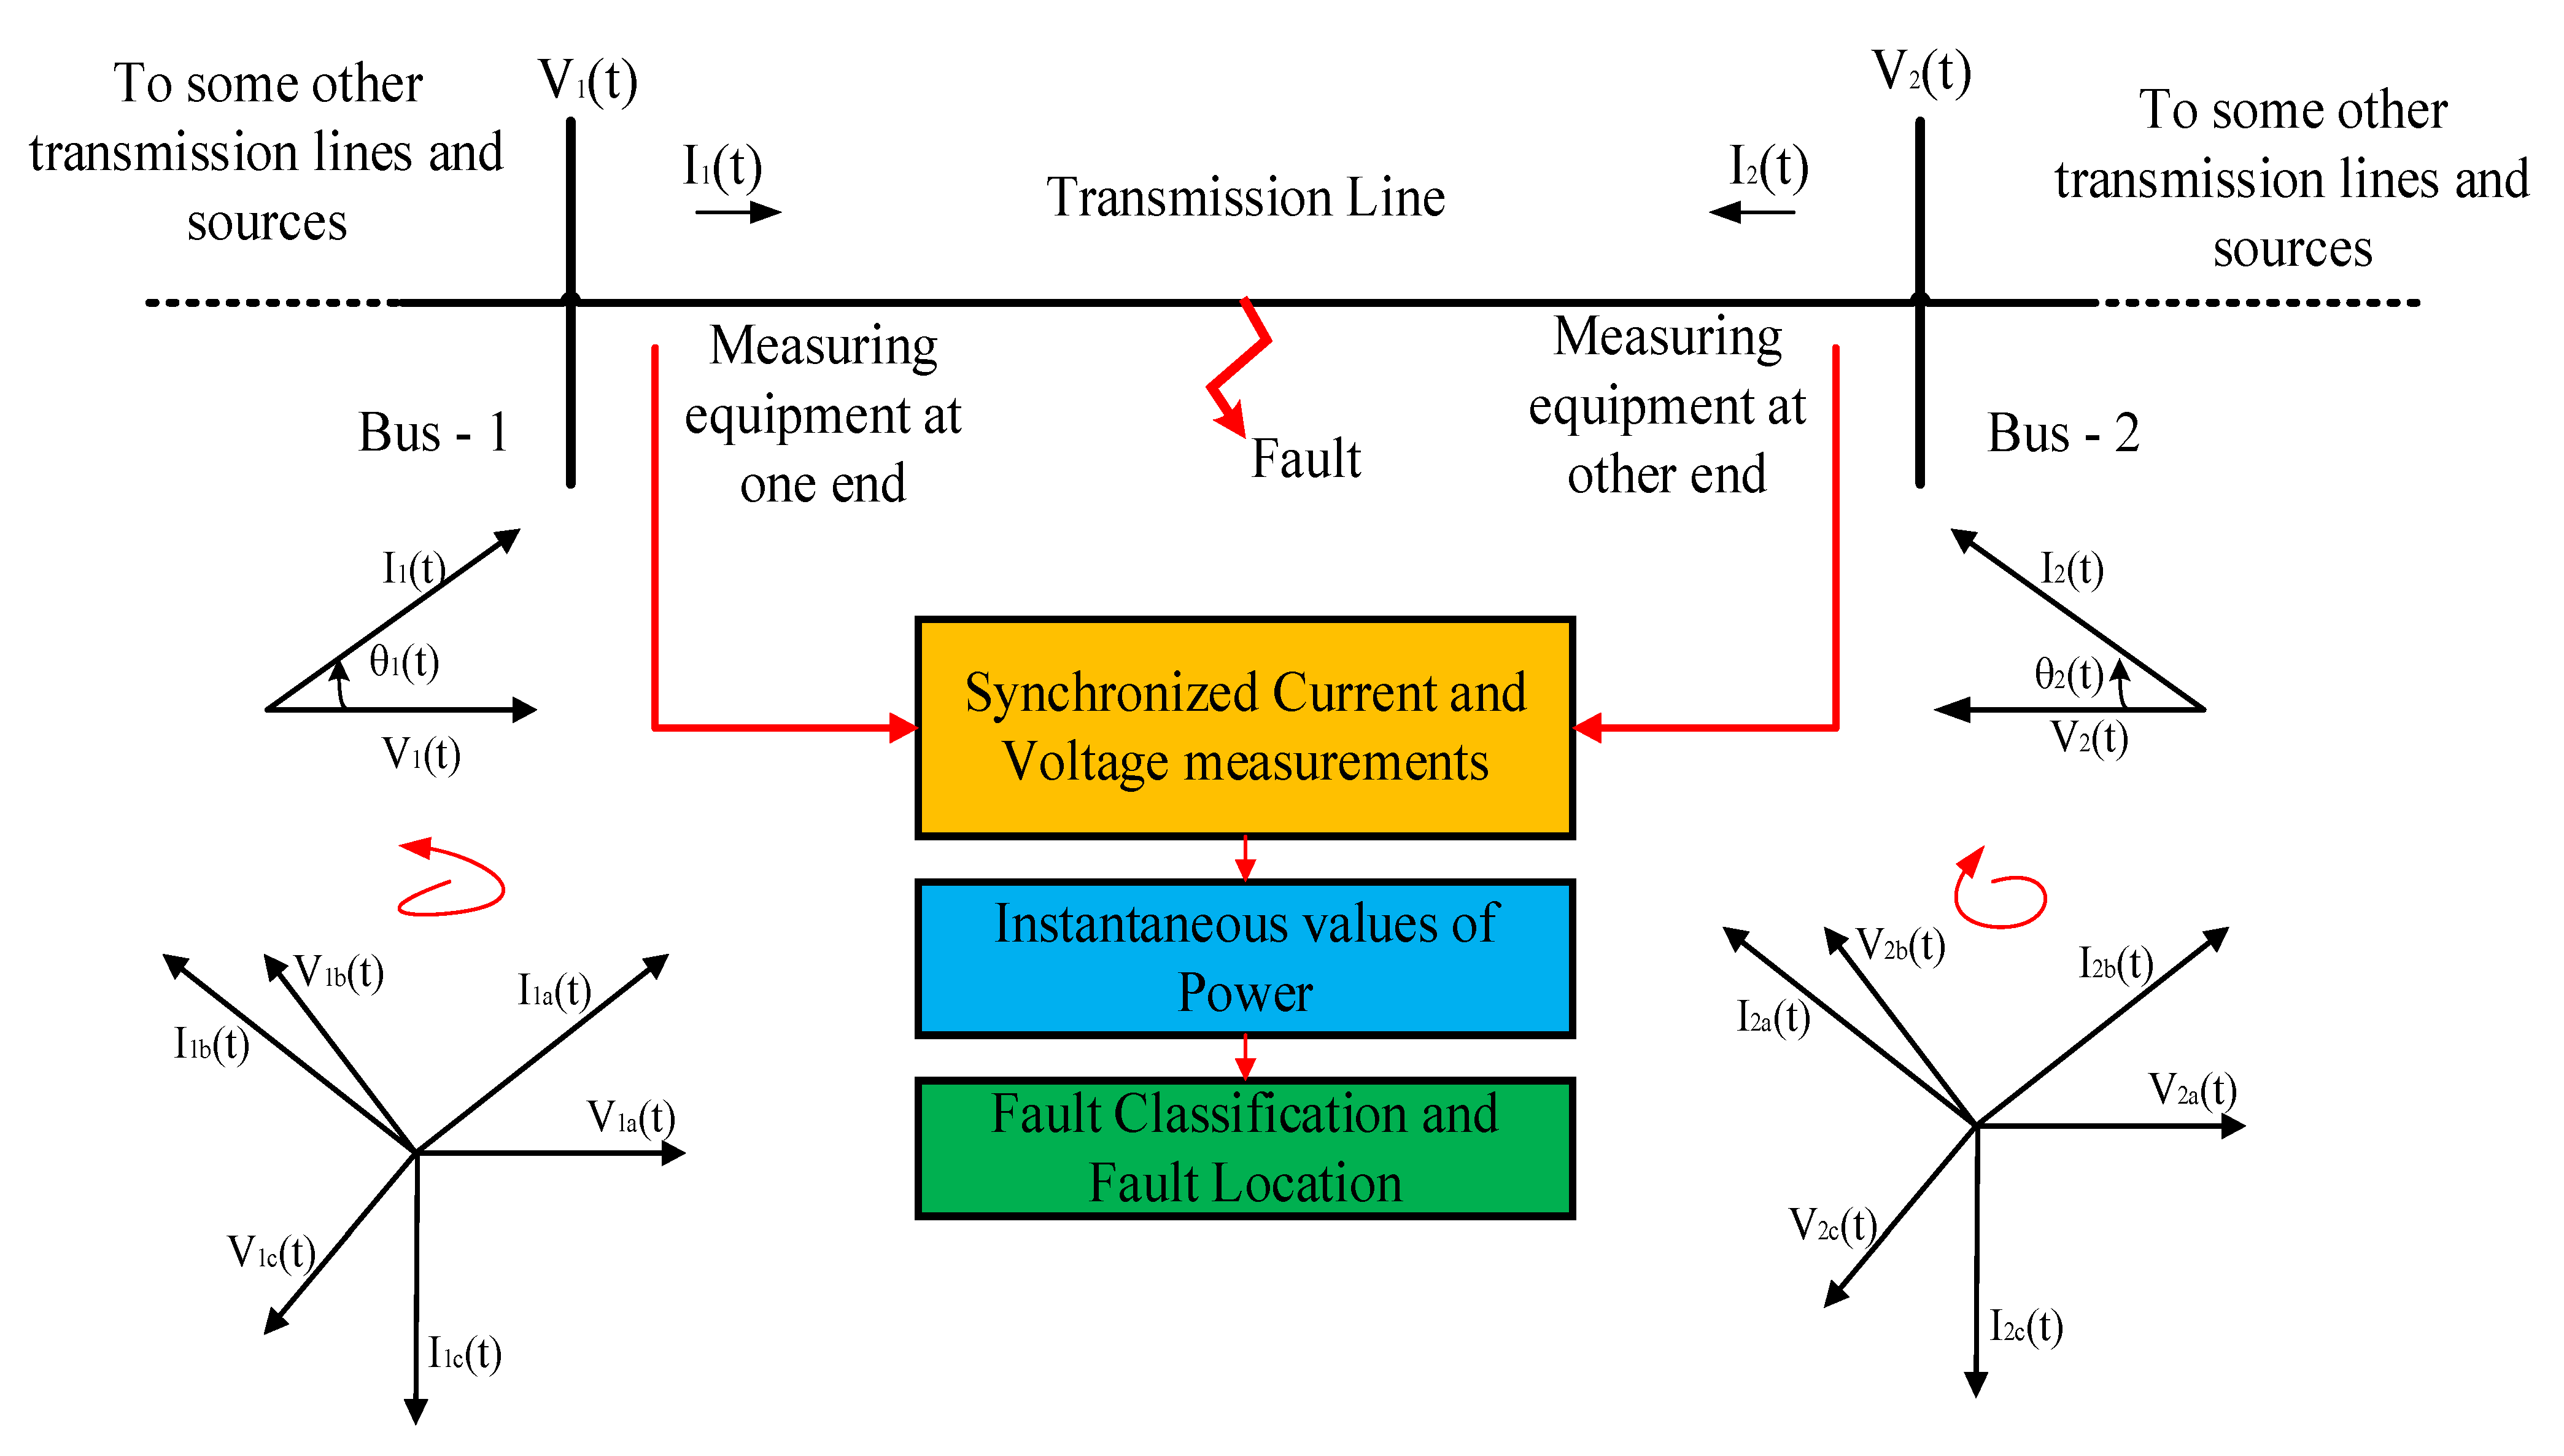
Figure 1. Two-ended measurements for transmission lines.
Sustainability 15 00809 g001
Figure 2. Flow chart of the proposed technique.
Sustainability 15 00809 g002
Figure 3. (ac) P 1 t and P 2 t for all three phases of the line concerning ‘ag’ fault.
Sustainability 15 00809 g003aSustainability 15 00809 g003b
Figure 4. (ac) P s g n t for all three phases of the line.
Sustainability 15 00809 g004aSustainability 15 00809 g004b
Figure 5. (ac) Instantaneous power concerning time for ‘ab’ fault for all three phases.
Sustainability 15 00809 g005
Figure 6. (ac) P s g n t for the three phases for ab fault.
Sustainability 15 00809 g006aSustainability 15 00809 g006b
Figure 7. (ac) Zero-sequence current factor components for 3 phases of the line.
Sustainability 15 00809 g007aSustainability 15 00809 g007b
Figure 8. (ac) Instantaneous power for three phases from both ends of the line.
Sustainability 15 00809 g008aSustainability 15 00809 g008b
Figure 9. (ac) P s g n t for the three phases of the line.
Sustainability 15 00809 g009aSustainability 15 00809 g009b
Figure 10. (ac) Zero-sequence current factor for three phases of the line.
Sustainability 15 00809 g010
Figure 11. (ac) Instantaneous power of three phases from both ends concerning time.
Sustainability 15 00809 g011aSustainability 15 00809 g011b
Figure 12. (ac) P s g n t for all three phases of the line concerning time.
Sustainability 15 00809 g012aSustainability 15 00809 g012b
Figure 13. Comparison of performance parameters of different FCL methods in the power transmission line.
Sustainability 15 00809 g013
Figure 14. Accuracy comparison of different FCL methods concerning fault location.
Sustainability 15 00809 g014
Table 1. Fault analysis of the system for different locations of transmission lines.
Fault TypeActual FaultCalculated Fault% Error
Location Km (Line)Time (s)Time (s)Location Km (Line)
ag25 (2–3)0.020.02425.71 (2–3)0.43
50 (6–7)0.020.02350.14 (6–7)0.07
75 (4–3)0.020.02474.53 (4–3)0.56
ab25 (4–3)0.020.02324.81 (4–3)0.12
50 (7–9)0.020.02249.58 (7–9)0.24
75 (9–2)0.020.02474.35 (9–2)0.43
abg25 (6–7)0.020.02324.83 (6–7)0.15
75 (4–6)0.020.02474.32 (4–6)0.45
75 (4–3)0.020.02474.58 (4–3)0.25
abc25 (2–3)0.020.02226.53 (2–3)1.43
50 (4–3)0.020.02250.54 (4–3)0.76
75 (9–2)0.020.02274.33 (9–2)0.45
Table 2. Comparison between different types of methods for FCL in power transmission lines.
Sr. No.ParametersProposed MethodDistance Relay ProtectionANN
1AccuracyHigh accuracy (97%)Inaccurate up to about 8%High
2ComplexityLow complexityDifficultDifficult
3Time responseVery fast responseHighResponse
4Detection of types of faultsCan detect all types of faultsCan detect all types of faultsYes, can detect the fault types
5Detection of phase involved in faultsYes, detect the faulty phase tooNoNo
6Detection of different linesaffected by the faultYes, can detect different lines affected by the faultOnly in some cases, like phase-to-phase faultsYes, can detect different lines affected
7Operational issuesDoes not get affected by the other parameters of the systemExpensive protection relay tester is requiredIt requires so much domain knowledge from experts, time-consuming
Disclaimer/Publisher’s Note: The statements, opinions and data contained in all publications are solely those of the individual author(s) and contributor(s) and not of MDPI and/or the editor(s). MDPI and/or the editor(s) disclaim responsibility for any injury to people or property resulting from any ideas, methods, instructions or products referred to in the content.