1. Introduction
The presence of water in masonry involves high-risk factors, directly for the building (such as aesthetic, structural, physical, and thermal damage) and indirectly for humans, with respiratory infections caused by a rise in mold and a high degree of humidity. Many studies have demonstrated that a high moisture quantity in indoor spaces causes a 30–50% increase in respiratory diseases for people [
1]. Therefore, moisture content monitoring is significant to define the healthy conditions for the environment, material durability, and energy saving for the building [
2].
Different and varied phenomena lead to vapor/liquid moisture formation in the building structures, such as meteoric precipitation, condensation, infiltration, and the hygroscopicity of materials; however, this study focused only on the analysis of rising damp. As in the rising damp model proposed by Hall and Hoff [
3], moisture tends to decrease according to the height of the geometry construction considered, and is identified with three areas: (1) the saturated area at a lower part, (2) the evaporation area at the middle height of the wall with a rapid decrease in moisture and a high quantity of soluble salt, and (3) the area in balance with the environmental humidity.
Clearly, the environmental context affects and involves factors that support water absorption [
4]: first, the material properties (porosity, permeability, mineral composition, sorptivity, etc.), wall thickness, evaporation potential at the materials’ interface, and physic-chemical reactions that regulate liquid movement in the pores of the wall; then, the boundary characteristics that influence the moisture content are the exposure and positioning, proximity to other buildings, climate conditions, salt accumulation, freeze–thaw cycle, ventilation, intended use of the building, crowding level, etc. [
5].
One purpose of studies on the rising damp is to develop local strategies and maintenance plans for the preservation of the architectural heritage. Venice city is a relevant case study where almost all buildings are affected by rising damp. The causes affecting the moisture content in building structures have been investigated by comparing laboratory tests that were carried out on full-size masonry walls, and realized with traditional techniques and dynamic hygrometric simulations. Preliminary results were presented in Guolo et al. [
6], and a more extensive description of the research is developed in this paper.
Rising Damp in Venetian Buildings
In Venice, typical masonry structures are made of clay bricks, lime mortar joints, and plaster in many cases, and were erected on salt soil. These conditions, and the relative humidity of over 70% in the atmospheric air, allow the water to pass through the porous material due to the capillary phenomenon. In the Venetian environment, the rising damp reaches an average level of 1.5–3 m, with the moisture content in solid materials constituting walls recorded as 25% [
7]. The factors that influence the rising damp are different: they could be summarized by floods, the times in which the building was soaked in sea water, the kinds of building materials, and the construction methods [
8,
9].
Furthermore, since ancient times in Venice, a peculiar method to prevent the rising damp and to limiting the influence of flooding called “acqua alta” has been used. A compact marble cladding (Istria stone, red Verona marble, and Carrara marble) is positioned on the base of the wall, just over the usual tide level. In the recent years, another method has been proposed: placing a wooden panel or plasterboard-like counter-wall [
10,
11] in the indoor environment of the building. These techniques worsen the moisture in the wall because natural evaporation is limited, and the rising damp can reach extreme cases of up to 5 m.
2. Materials and Methods
2.1. Material Properties
The masonry analyzed was a structure composed of brick and mortar, and an additional layer of plaster (if necessary). The bricks considered in this study consisted of two types: commercial “red brick” (RB) by the company S. Marco-Terreal (size UNI 120 × 250 × 55 mm [
12]). In the case of RB, the clay was fired at 950 °C, resulting in a high porosity and medium pore diameter of 0.6 μm.
Two types of mortar were analyzed: a premixed lime mortar produced by an industrial company (GLM), and a historical lime mortar (HLM), as described in previous studies on Venice masonries [
13]. The mortar usually used in Venice is a mixture of lime, water, and fine aggregates (such as sand and minced marble) as well as other additives in proportion, to eventually guarantee the workability and mechanical resistance. Usually, the binder/aggregate ratio per volume was 1:3.
Two Venetian traditional plasters, Marmorino and Cocciopesto, were tested. Marmorino originates from a mixture of lime and marble powder to obtain a smooth and precious finish; it is applied in several layers (usually three), creating a transparent reflection. Cocciopesto is a hydraulic mortar, used also as plaster until the XX century. Made of lime and volcanic ash or crushed bricks, these materials give the plaster a high resistance to moisture. The data about typical Venetian lime mortar or lime plaster (HLM/LP), Marmorino (MP), and Cocciopesto plasters (CP) were derived from the literature, with the data showing in
Table 1 as average values of the total cases [
14].
2.2. Laboratory Experimental Tests
Laboratory tests were performed to analyze the behavior of rising damp on mock-up masonries (100 × 120 × 25 cm), using the material described in
Table 1 [
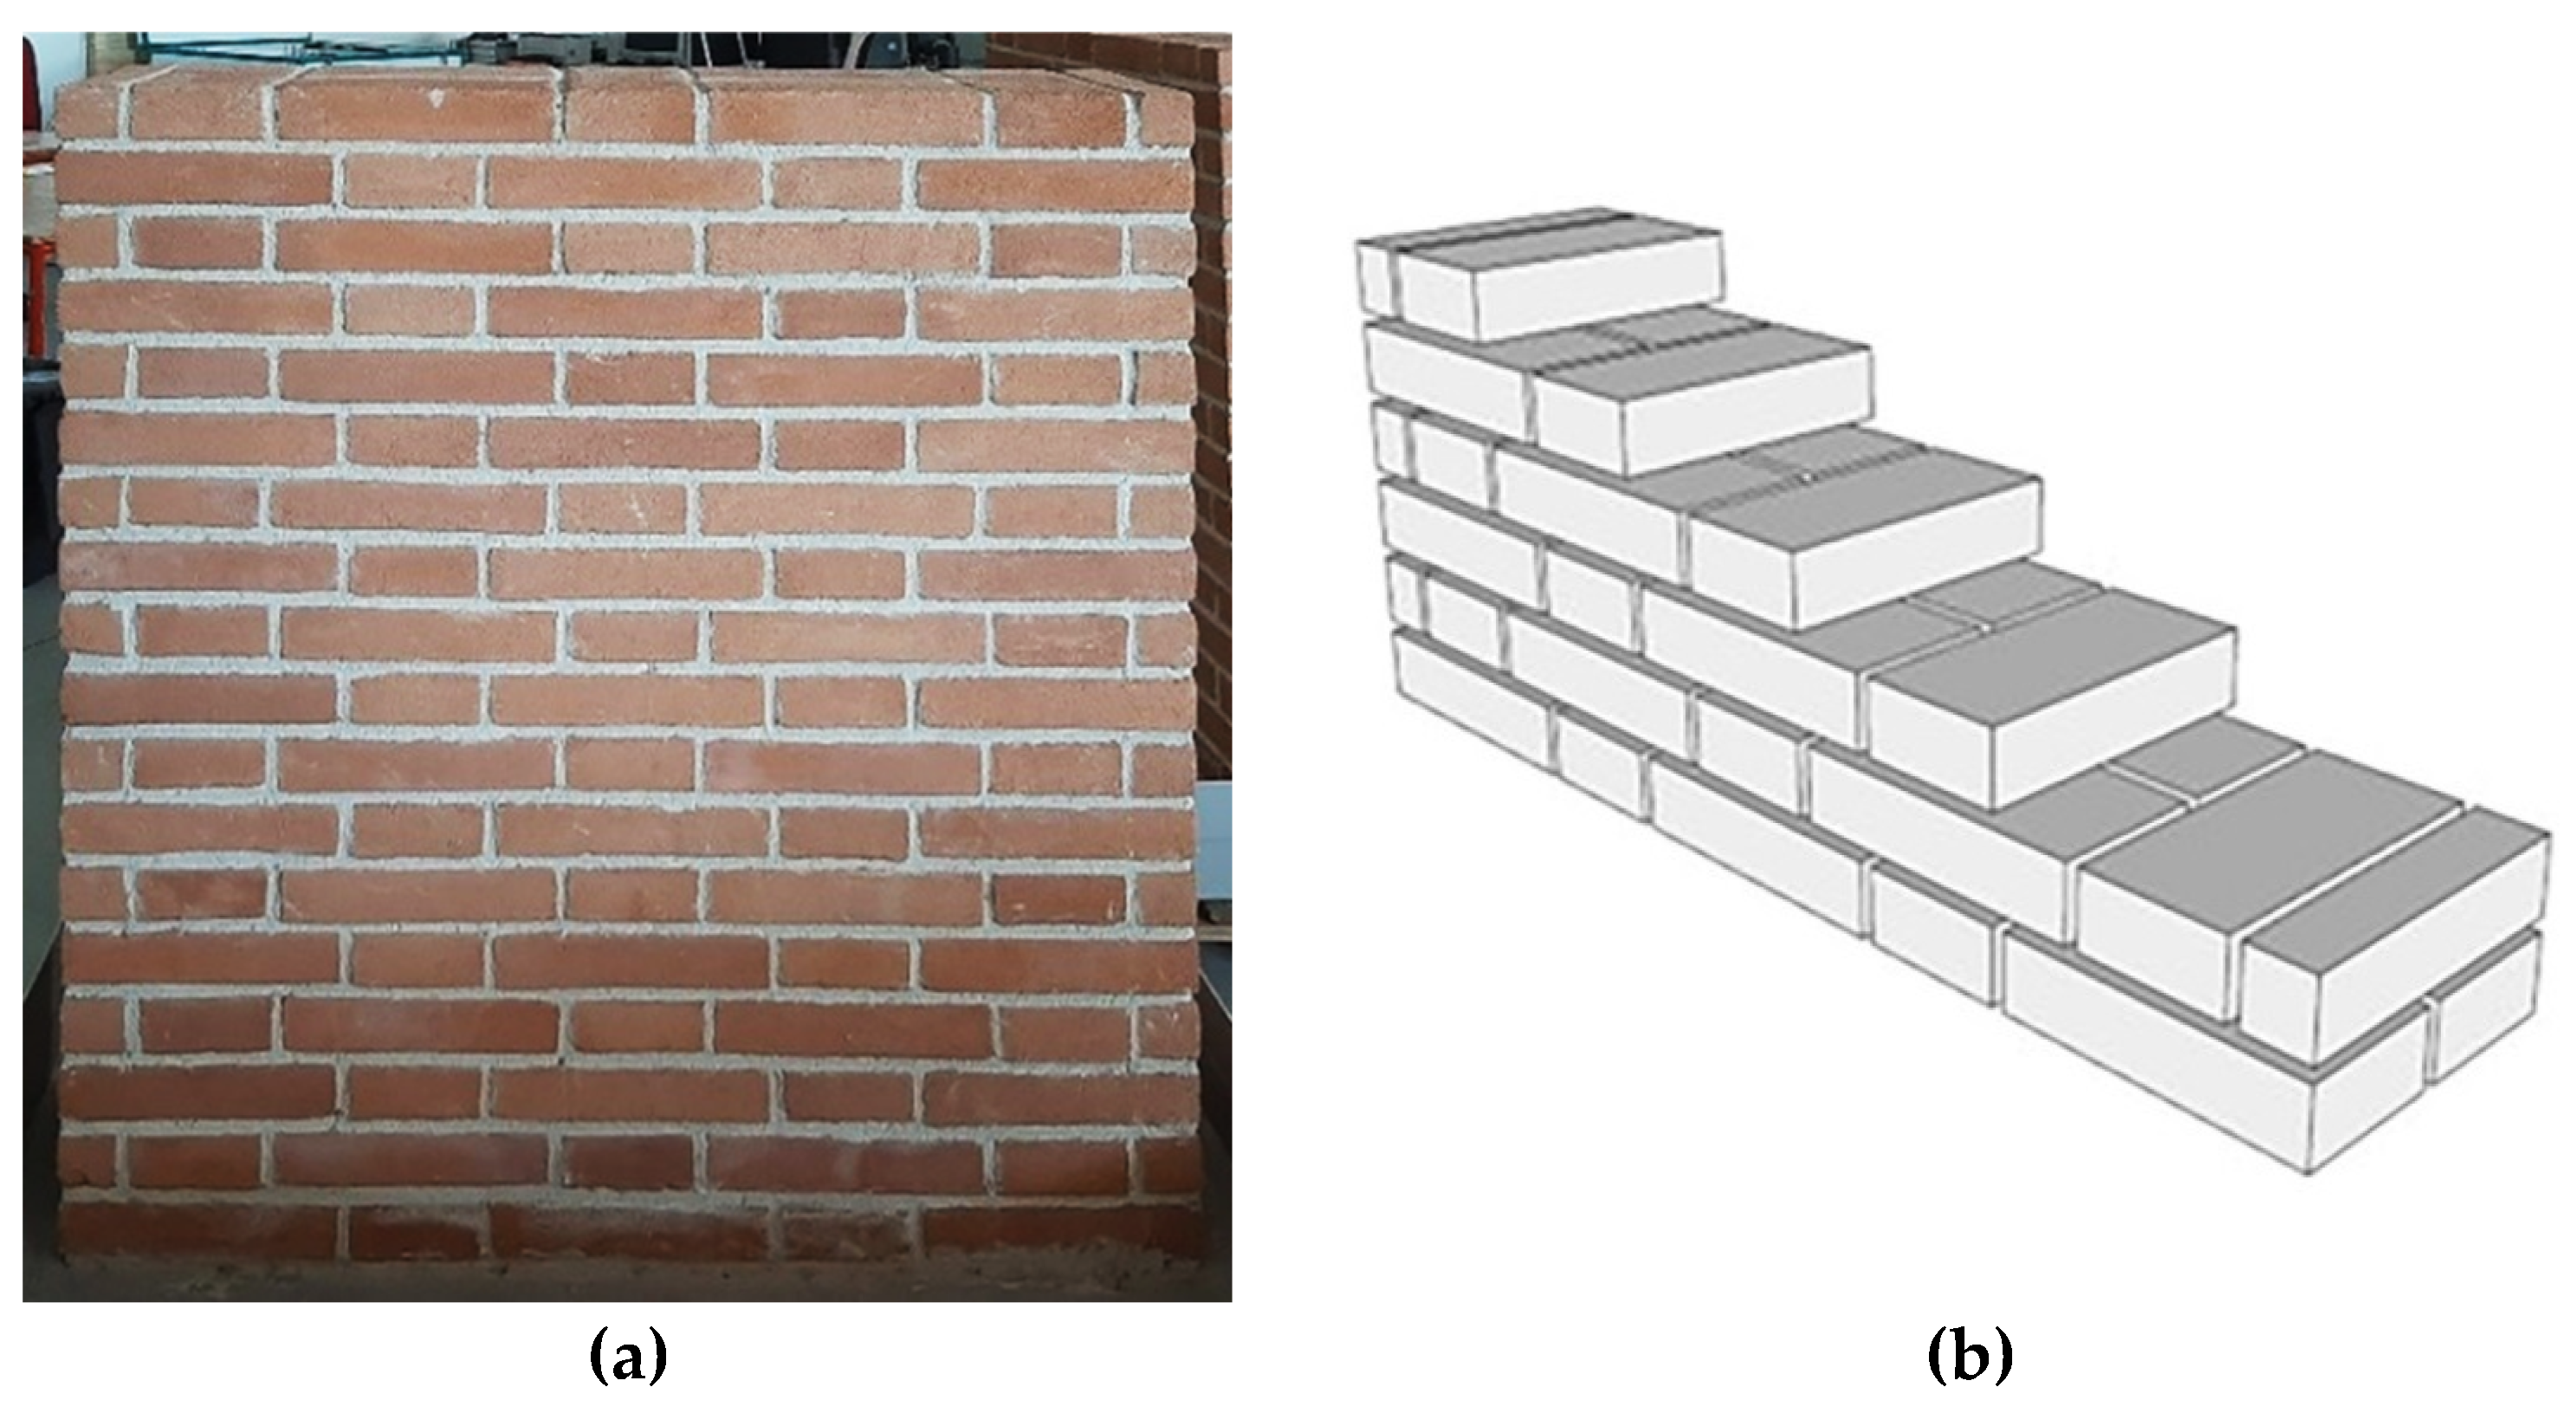
6]. The masonries were made with traditional techniques by brick-layers, as follows (
Figure 1): 6 mock-ups of new commercial brick and premixed lime mortar (MU-6) and 2 mock-ups of new commercial brick and historical lime mortar (MU-2); the average thickness of mortar joints was about 1 cm. Three of MU-6 were plastered with different materials: natural lime plaster (MU-6.L), Cocciopesto (MU-6.C), and Marmorino (MU-6.M).
A test specimen was developed in order to reproduce and simulate continuous capillary suction as in Venice masonry, by posing the mock-up into a polypropylene water tank of 120 × 80 × 19 cm.
During the experiments, the water level in the tank was kept at the height of ~0.13 m (corresponding to two wythes of bricks).
This laboratory test considered an “ideal case”: the scope was to limit the variables that influence the capillary rise, unlike real cases that have a series of elements which cause a significant increase in water content.
For the analysis of the process of rising damp, a non-destructive method was applied; despite this, the technique presents some disadvantages concerning the correlation between moisture content and measures: the IR thermography images were obtained using the FLIR T1020 (
Table 2), with an IR lens of 36 mm and 28° FOV (field of view). The IR approach allows non-continuous measures, conducted monthly (every day in the first month of soaking). The thermal images were acquired at a distance of 3.00 m from each sample, and at a height of 0.90 m from the ground, in order to obtain all of the mock-up dimensions for each side; emissivity was set up as 0.90, because that is a medium value for red brick (ε = 0.95) and mortar or plaster (ε = 0.85).
Currently, an ideal non-destructive method for measuring the moisture in building structures does not exist.
2.3. Simulation with Numerical Model
The hygrothermal behavior of masonry was simulated with a numerical model that was developed by the Fraunhofer Institute WUFI 2D [
15]. This software describes the heat and moisture distributions within a two-dimensional building structure, specifying the characteristics of the materials and climatic conditions. The standard adopted for hygrothermal dynamic simulation was EN 15026:2007 [
16], which represents the reference for calculating interstitial condensation, rain influence, vapor migration, construction moisture, absorption due to rising damp, and all phenomena related to the drying phase [
17,
18].
The model of heat and moisture transport adopted in the WUFI software family was developed according to Künzel [
19], based on finite volume methods: the relative humidity
RH was the only moisture transfer, instead of moisture content
w or suction pressure
Pc. The Künzel model was developed according to the two subsequent equations.
Equation system (1) describes this model and the material properties impact; the first equation is related to the energy transfer, and the second equation is related to the moisture transfer:
where
h is the enthalpy of water [J/m
3],
T is absolute temperature [K],
t is time [s],
λ is thermal conductivity [W/(m K)],
hv is the latent enthalpy of evaporation of water vapor [J/kg],
ρo is the density of the dry material [kg/m
3],
δp is water vapor permeability [kg/(m s Pa)],
RH is relative humidity [-], and
w is moisture content [kg/m
3].
Moreover, hygroscopic materials can absorb liquid water until they reach the equilibrium moisture, with reference to environmental conditions (free saturation
wf, corresponding to RH 100%). Beyond free saturation, the supersaturation region (
wmax) can be reached, with RH > 100%. In materials with a porous structure [
20], the free saturation level is lower than the maximum content, since there are internal interfaces between water and pore air that create air bubbles.
In this simulation, the scope was to investigate one of the principal mechanisms of moisture transport in porous materials: capillary motion. In building physics, this movement is considered a diffusion phenomenon (2), as it reproduces the linear increase in the liquid absorption quantity, directly with the square root of time.
here,
gw is the liquid transport flux density [kg/m
2s],
Dw is the liquid transport coefficient [m
2/s] and
w is the moisture content [kg/m
3].
Dw is strongly dependent on
w, but also on the material type and boundary conditions.
The WUFI engine adopts two liquid transport coefficients, due to absorption (
Dws) or diffusion (
Dww).
Dws (liquid transport coefficient for suction) is introduced in Equation (3) that describes the water absorption when the absorption surface is completely impregnated (due to large capillaries in the porous structure).
Dww describes the liquid water diffusion when the imbibition is complete (namely, when the hygroscopicity level of the material is a maximum, and the material layer can no longer absorb another quantity of water), and so the water inside begins to diffuse into the structure through small capillaries.
here,
A is the water absorption coefficient [kg/m
2s],
wf is the free water saturation [kg/m
3], and
w is the moisture content [kg/m
3].
2.4. Hygrothermal Dynamic Simulation
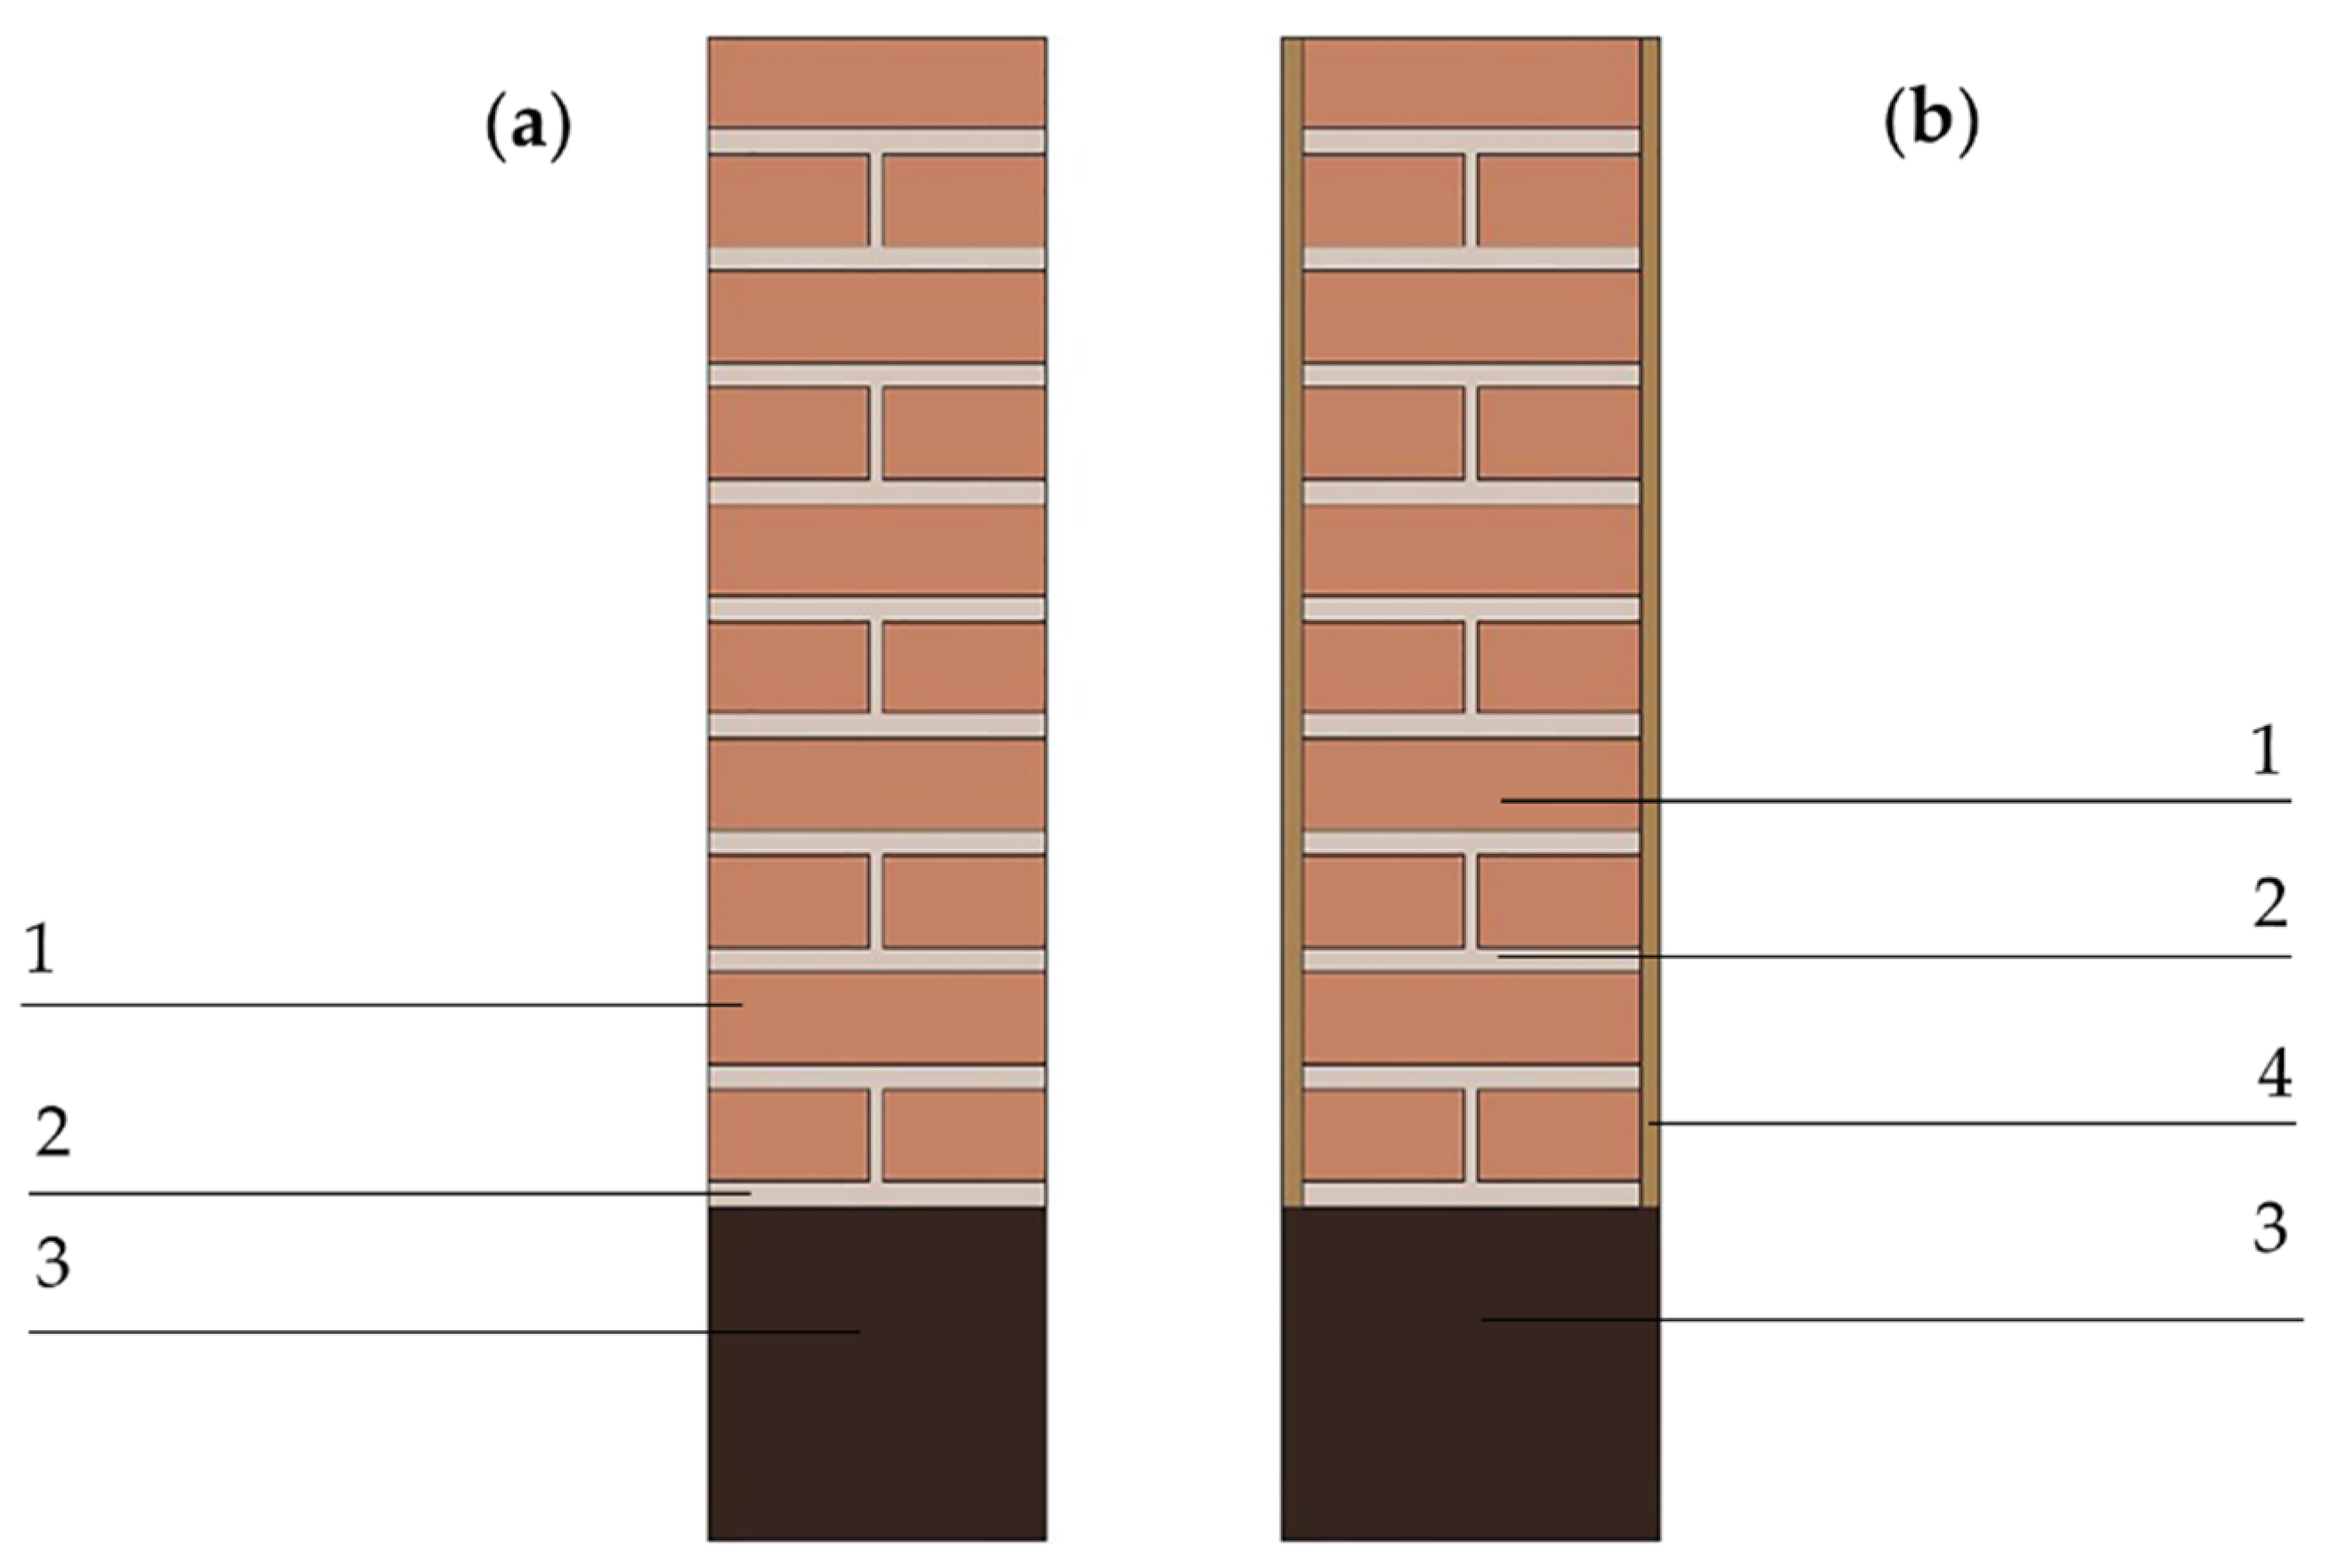
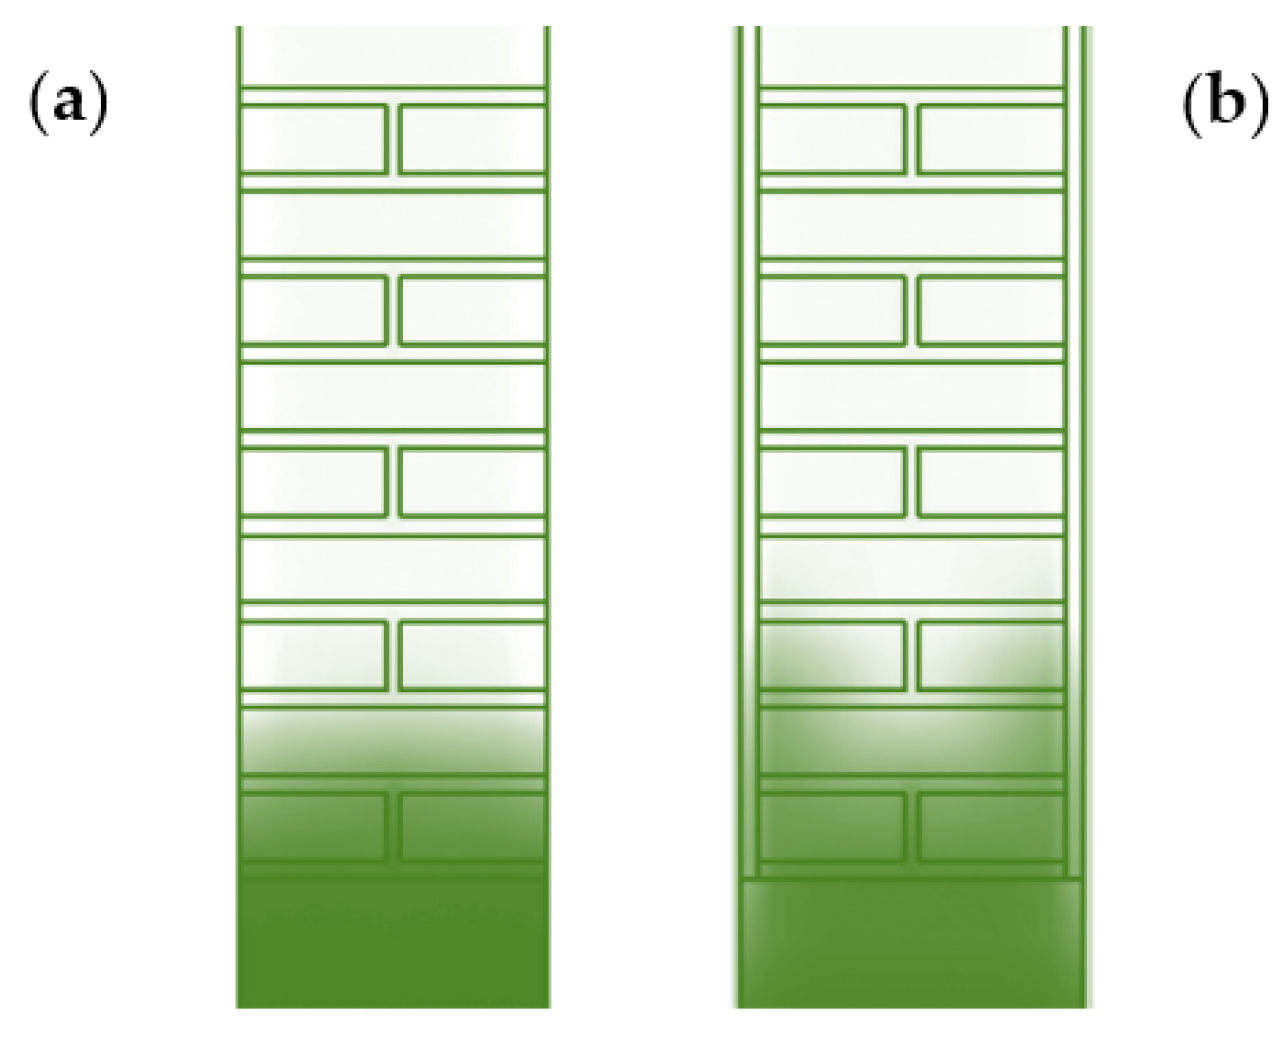
The analysis was achieved on masonry with a thickness of 0.25 m, with or without plaster (thickness 15 mm). The composition of the mock-up simulated by software was the same as in the laboratory experiments, both for geometric dimensions, thickness (of mortar joints and plaster layer), and installation: brick + mortar was the basic structure, and in some cases, it was plaster cladding. A layer, with a high quantity of free saturation water (~500 kg/m
3), placed under the masonry, was considered for simulating the conditions of the Venice lagoon (
Figure 2).
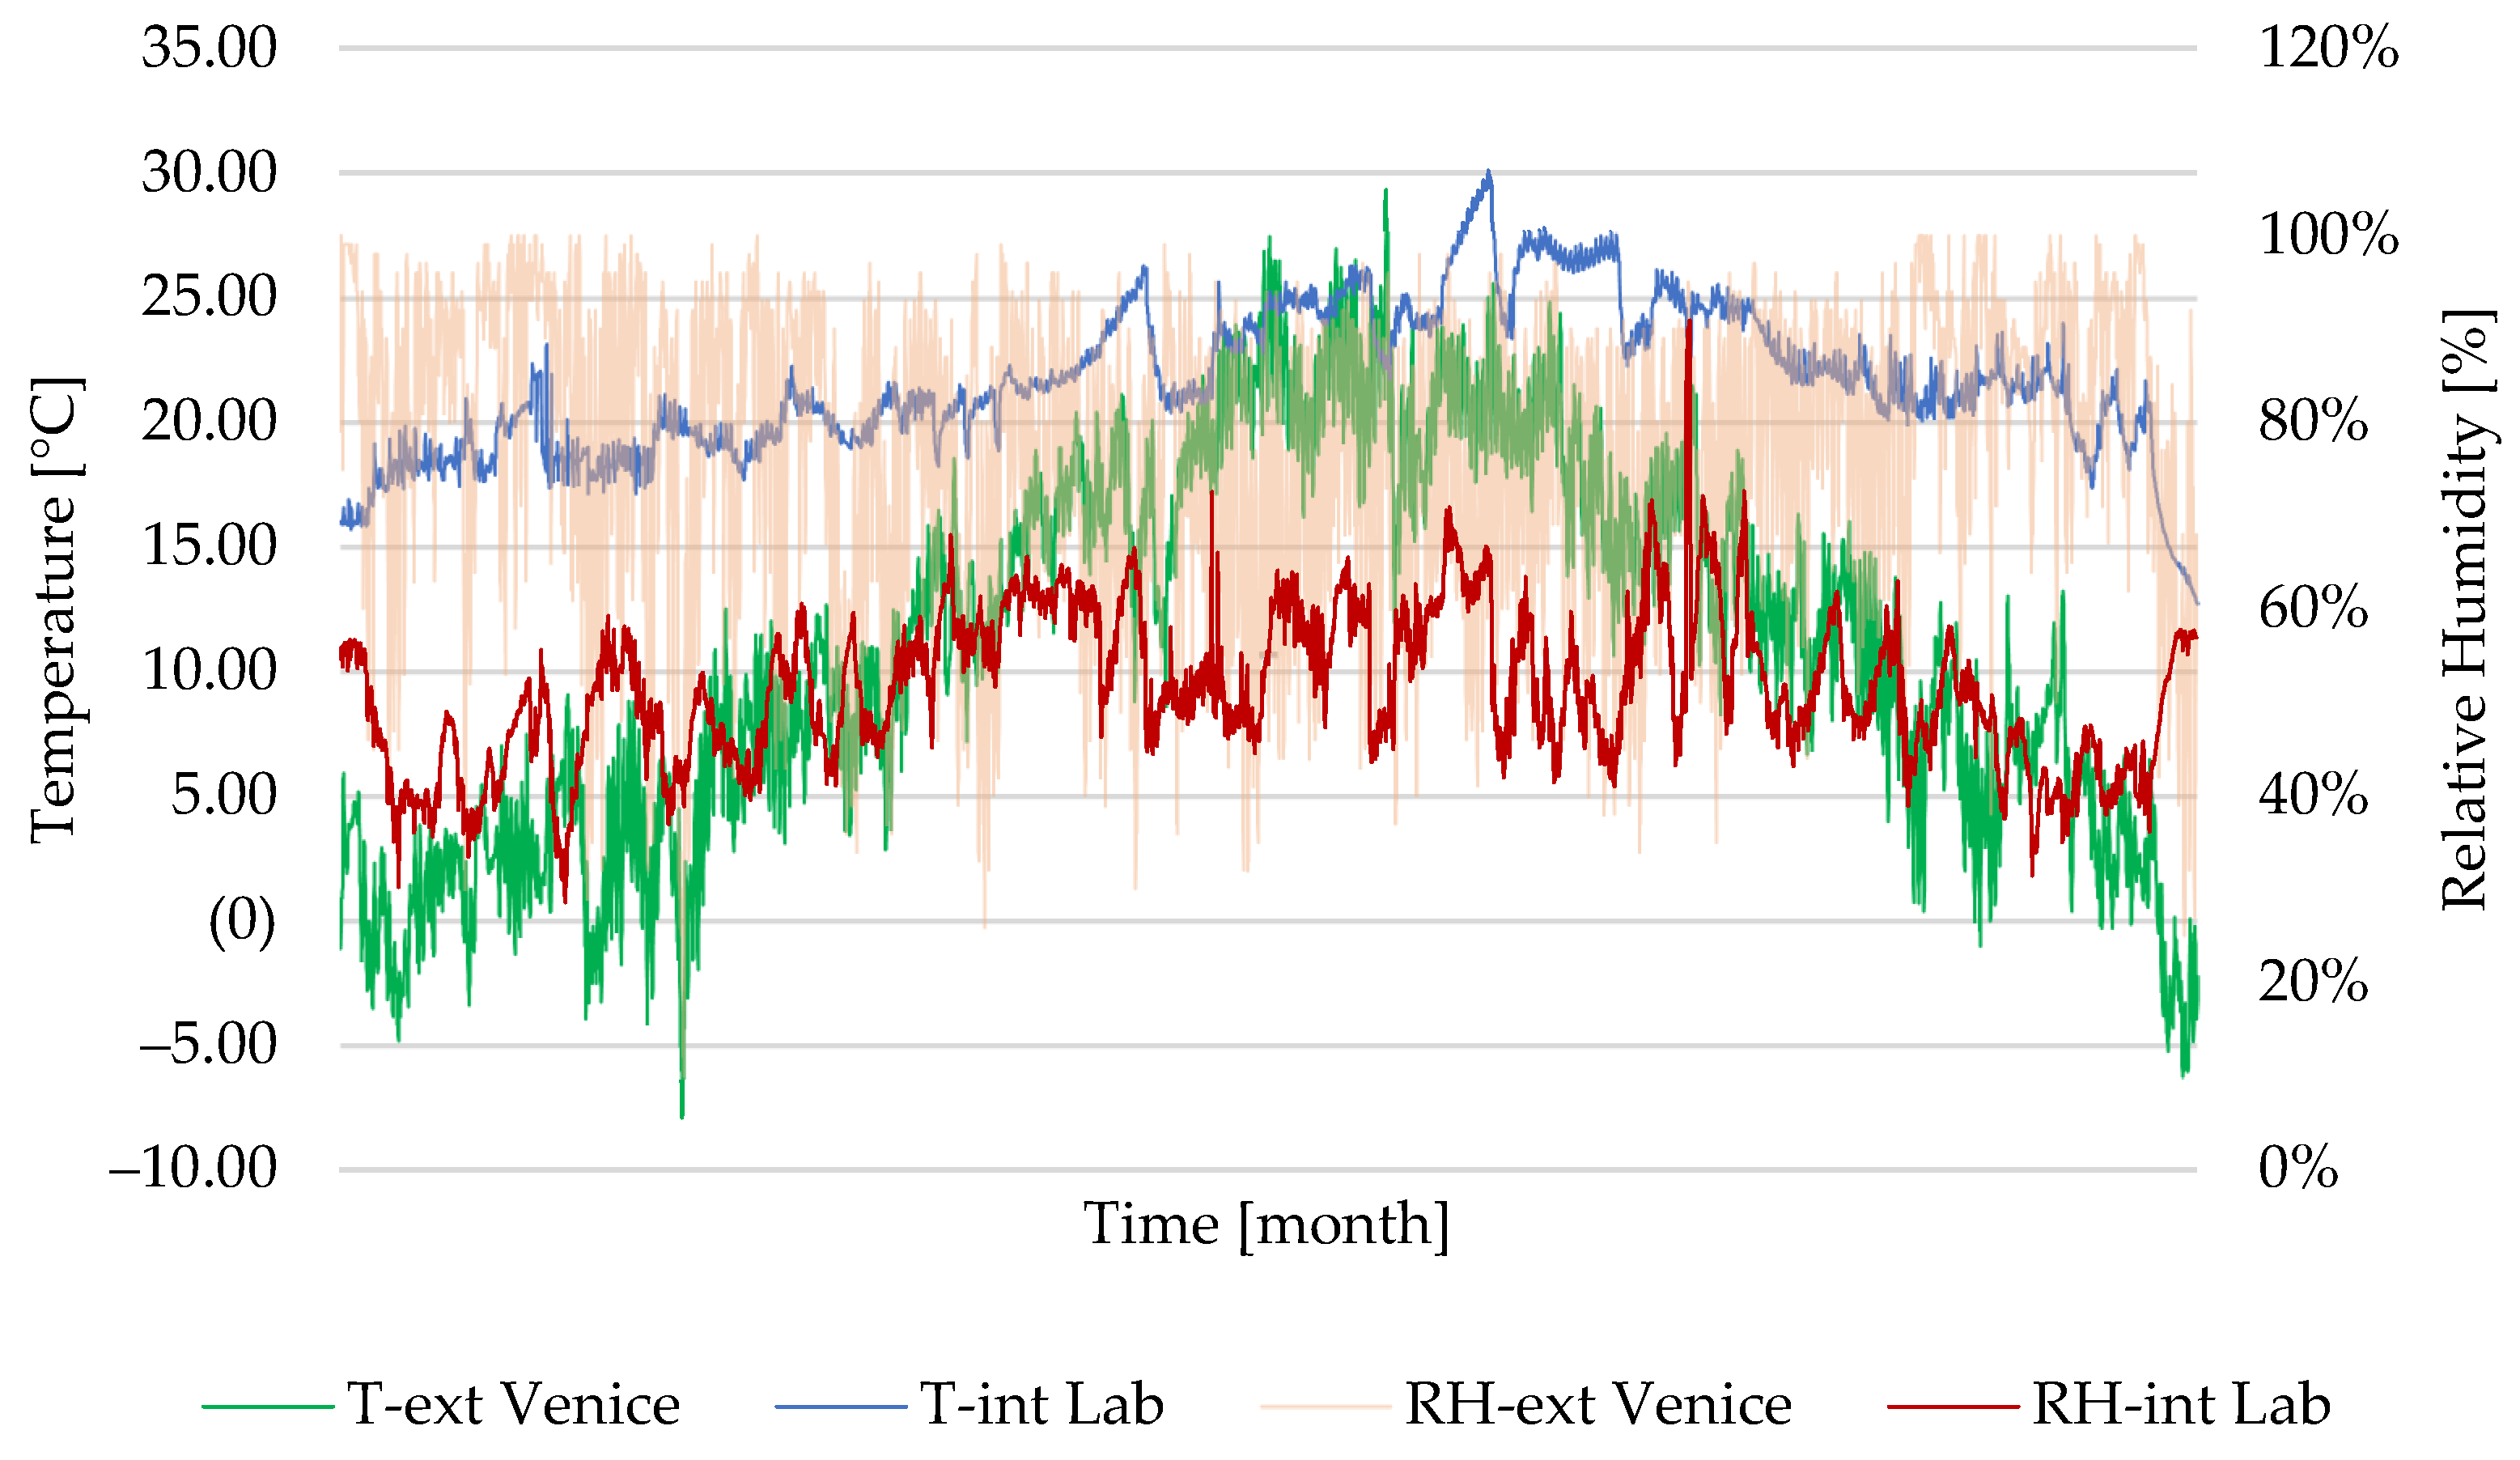
The evaluation adopted different climatic conditions. At first, controlled conditions as in the laboratory environment were recreated, fixing the inner temperature at 22 ± 3 °C, the relative humidity at 50 ± 10%, and adopting the weather data recorded by Hobo data logger (
Table 3). The data file was recreated based on the standard UNI EN ISO 13788:2013 [
21]. Then, the external conditions as in Venice were recreated by adopting weather statistical data. In this case, the model was integrated with a weather file developed by EnergyPlus [
22], representing a typical year in the Venetian context, according to the standard UNI EN ISO 15927-4:2005 [
23]. Both weather files refer to annual data (
Figure 3).
3. Results
3.1. Laboratory Tests
The outputs of non-destructive monitoring achieved on the laboratory mock-ups are presented in the figures below.
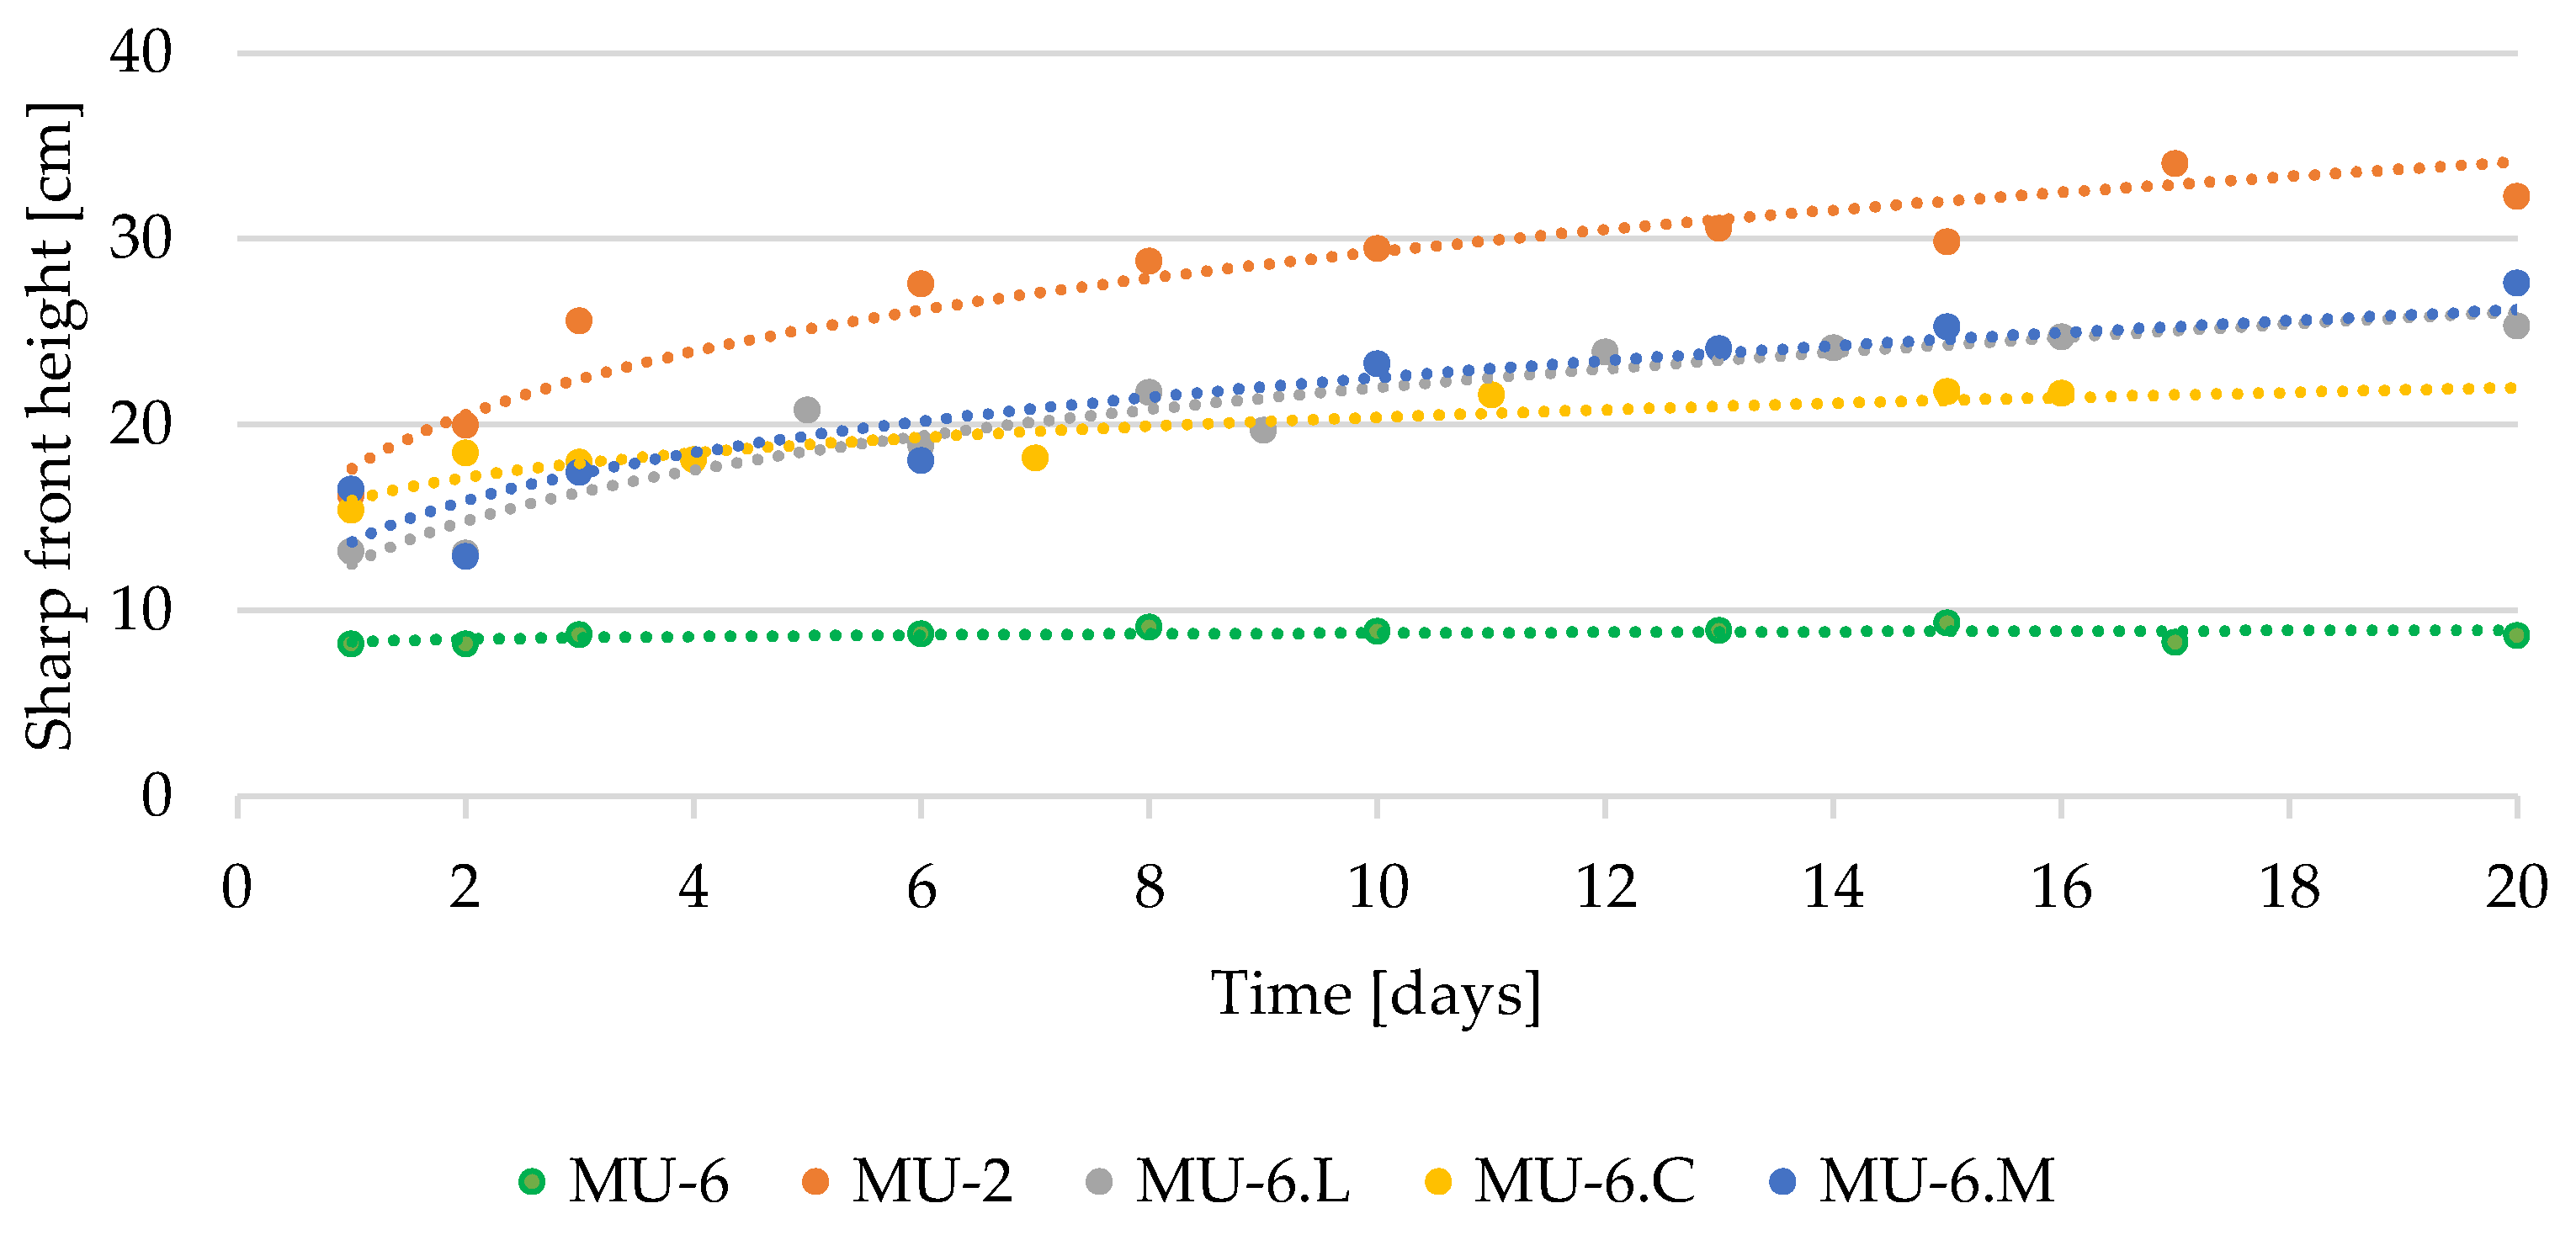
Figure 4 shows the wetting front height of rising damp in the laboratory test masonries; the data were obtained from the evaluation of surface evaporation by means of thermography. This graph shows the imbibition level and speed during the first 20 days. The trend was similar for all mock-ups: from the start situation in which each masonry was completely dry and did not have a wet front on the surface, water was observed to rapidly rise to the surface after impregnation; however, some differences shall be highlighted between the construction type. MU-6 had a rapid increase of ~8 cm in 2 days; then, an important stabilization in the height level was observed for the next 18 days (0.4 cm). MU-2, MU-6.L, and MU-6.M had higher wetting levels close to 13 ÷ 17 cm, and then continuous growth was noted up to 25 ÷ 28 cm after 20 days in plastered masonry, and higher in MU-2 structure, approximately 32 cm (growth of 16 cm). Small differences were recorded in MU-6.C, which had an initially sharp front height similar to the other plastered masonries (~15 cm), and then the tendency became more similar to MU-6, because it had a lower height but a greater stabilization of values (growth of 6 cm).
All of the masonries are still in the testing phase, so the stabilization phase is still under analysis.
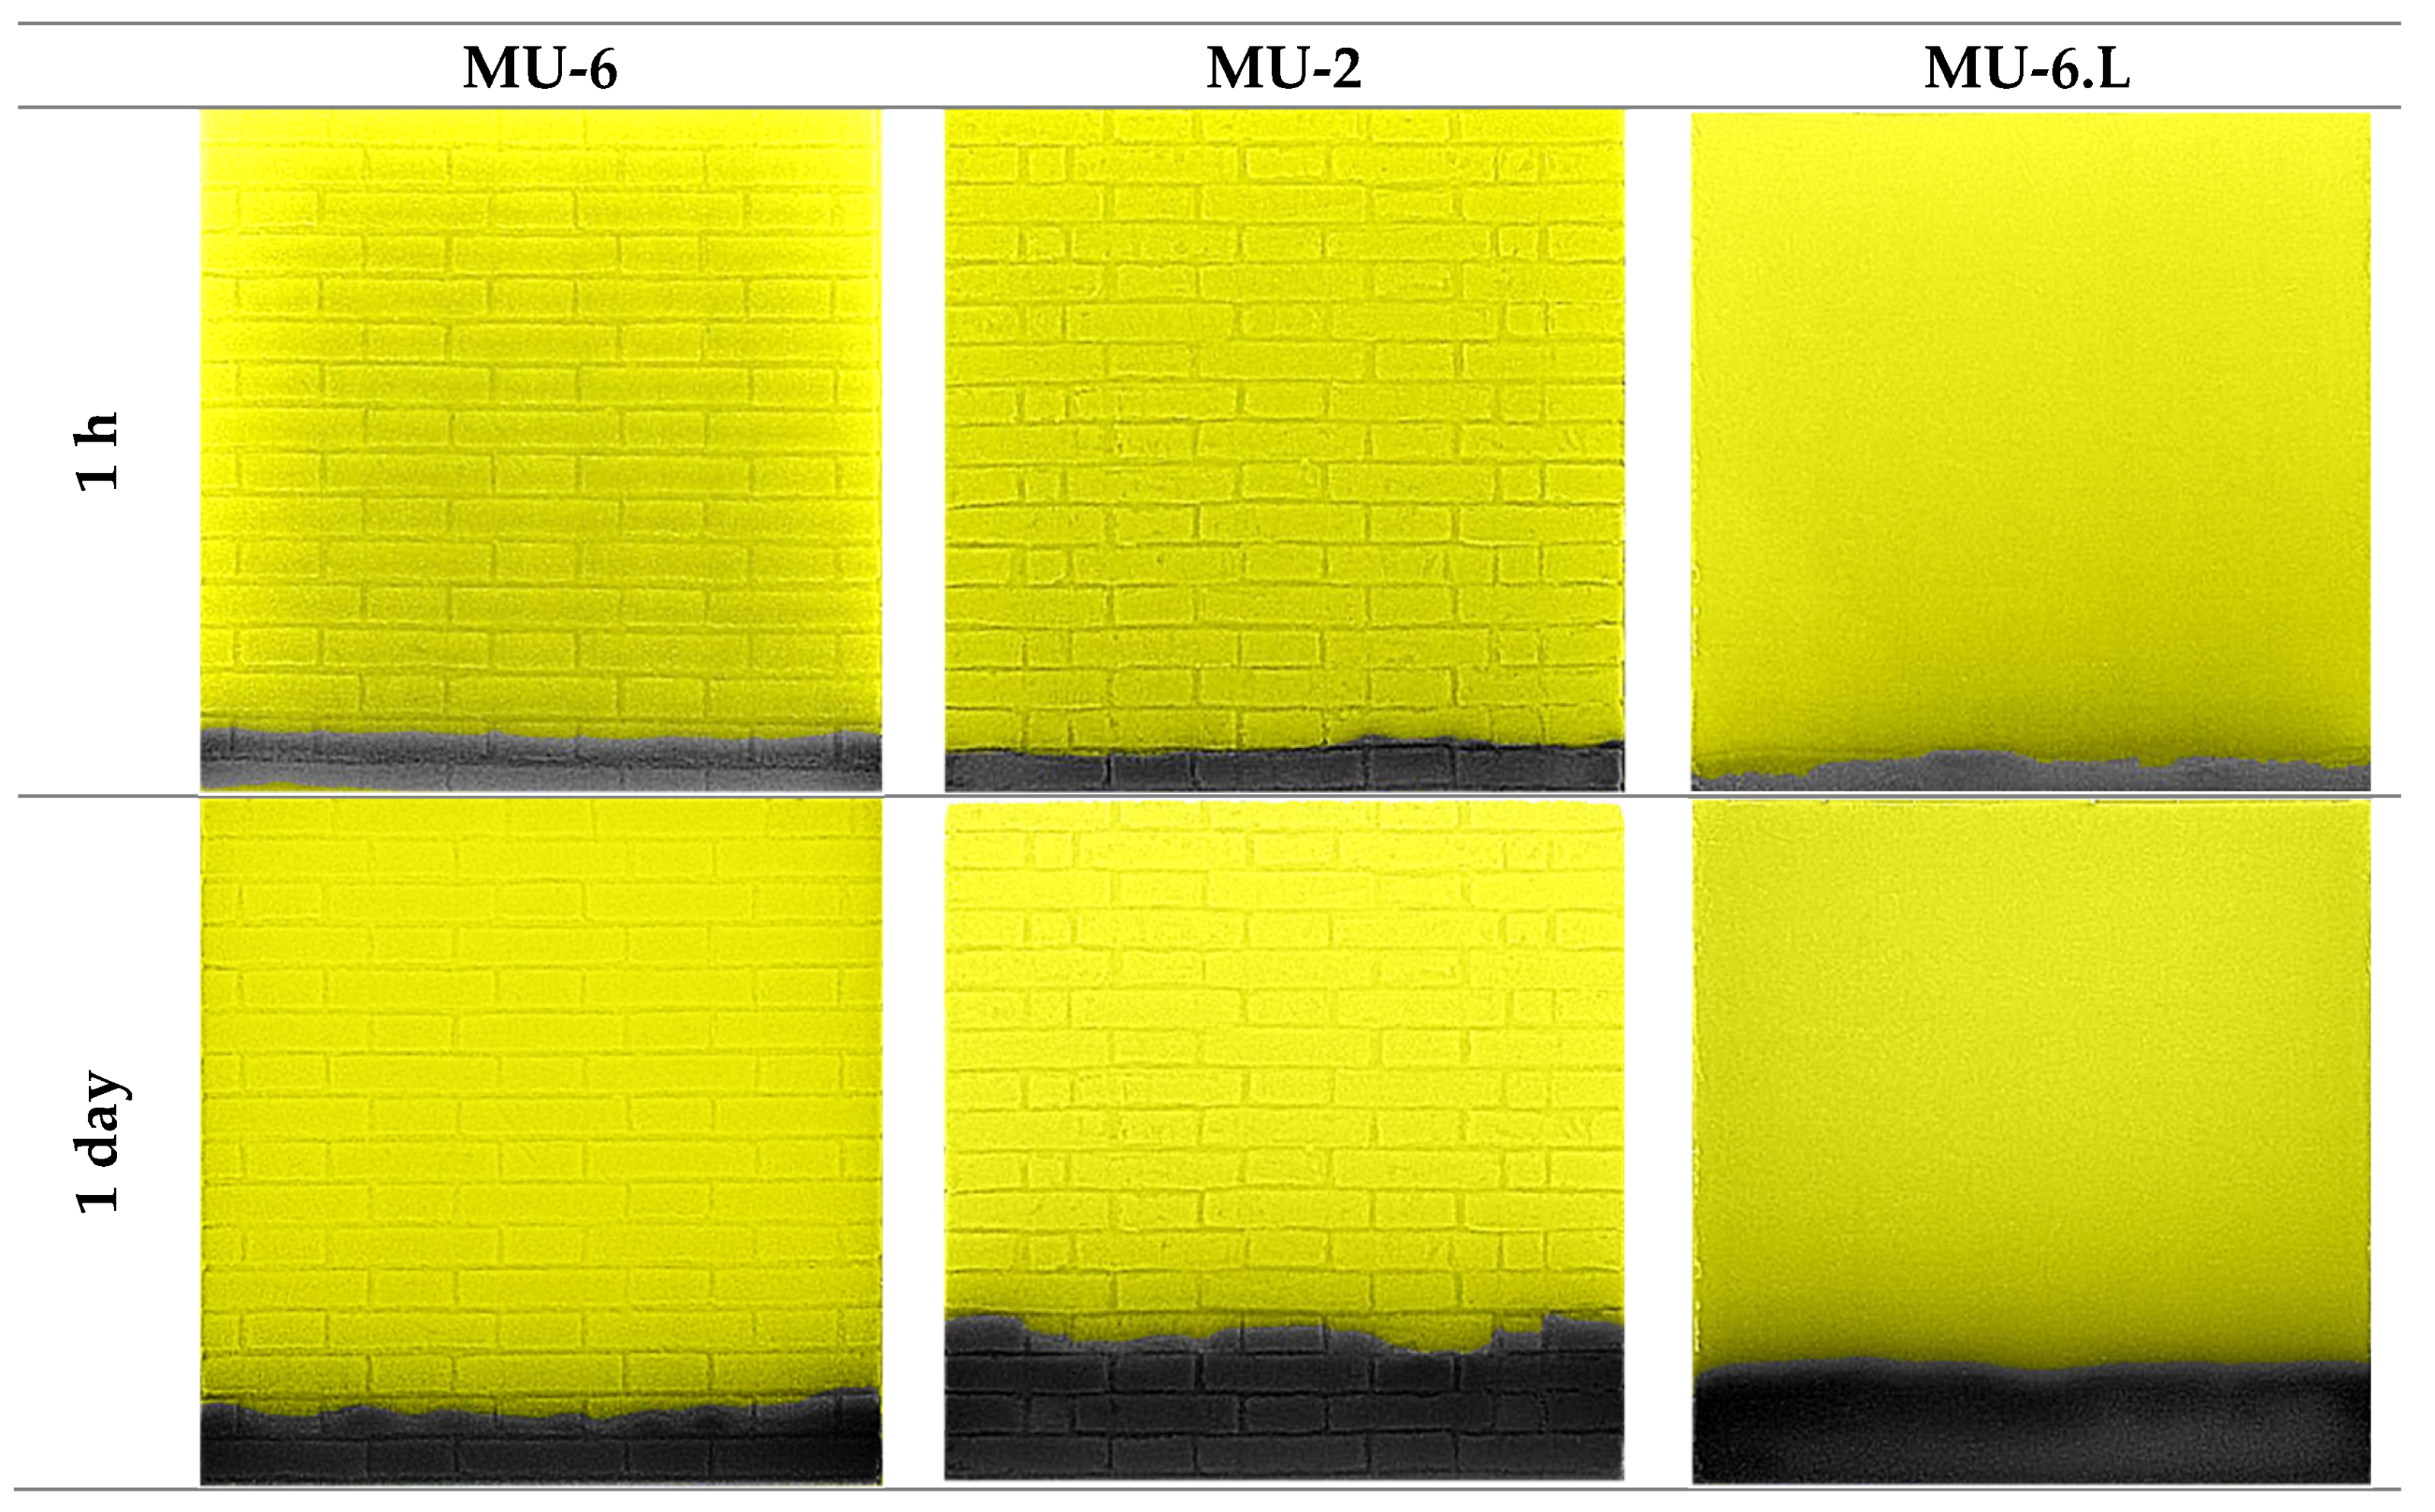
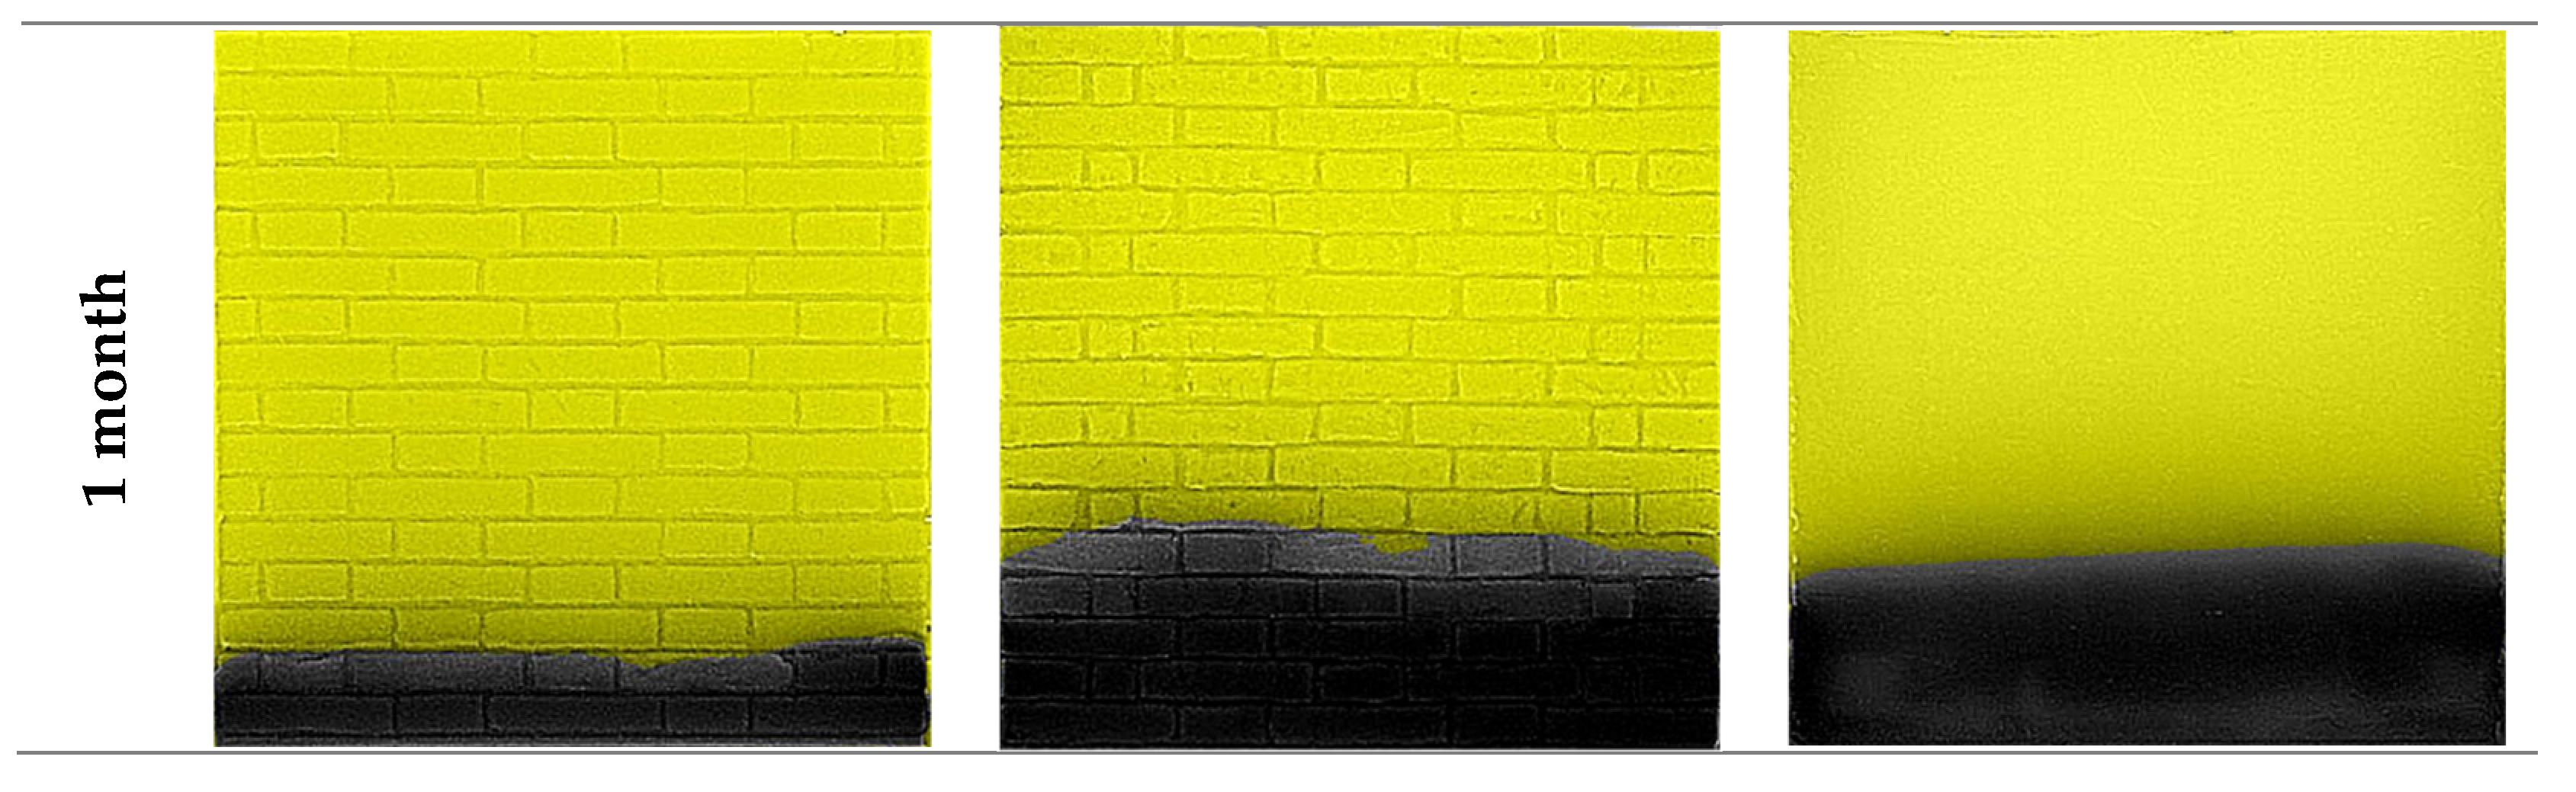
Figure 5 describes in an IR map the qualitative results regarding the trend in surface rising damp, previously represented in
Figure 4, focusing in three different masonries and different times of imbibition. All of the images show a rapid rising damp in the first hour, with little difference between exposed (MU-6 and MU-2) and plastered masonry (MU-6.L). After 1 day and 1 month, the images present a reversed trend in MU-6 from MU-2 and MU-6.L, with a high level of surface moisture in all of the masonries that had traditional mortar and/or plaster made by lime and sand, and a higher level in MU-2, as already shown in
Figure 4.
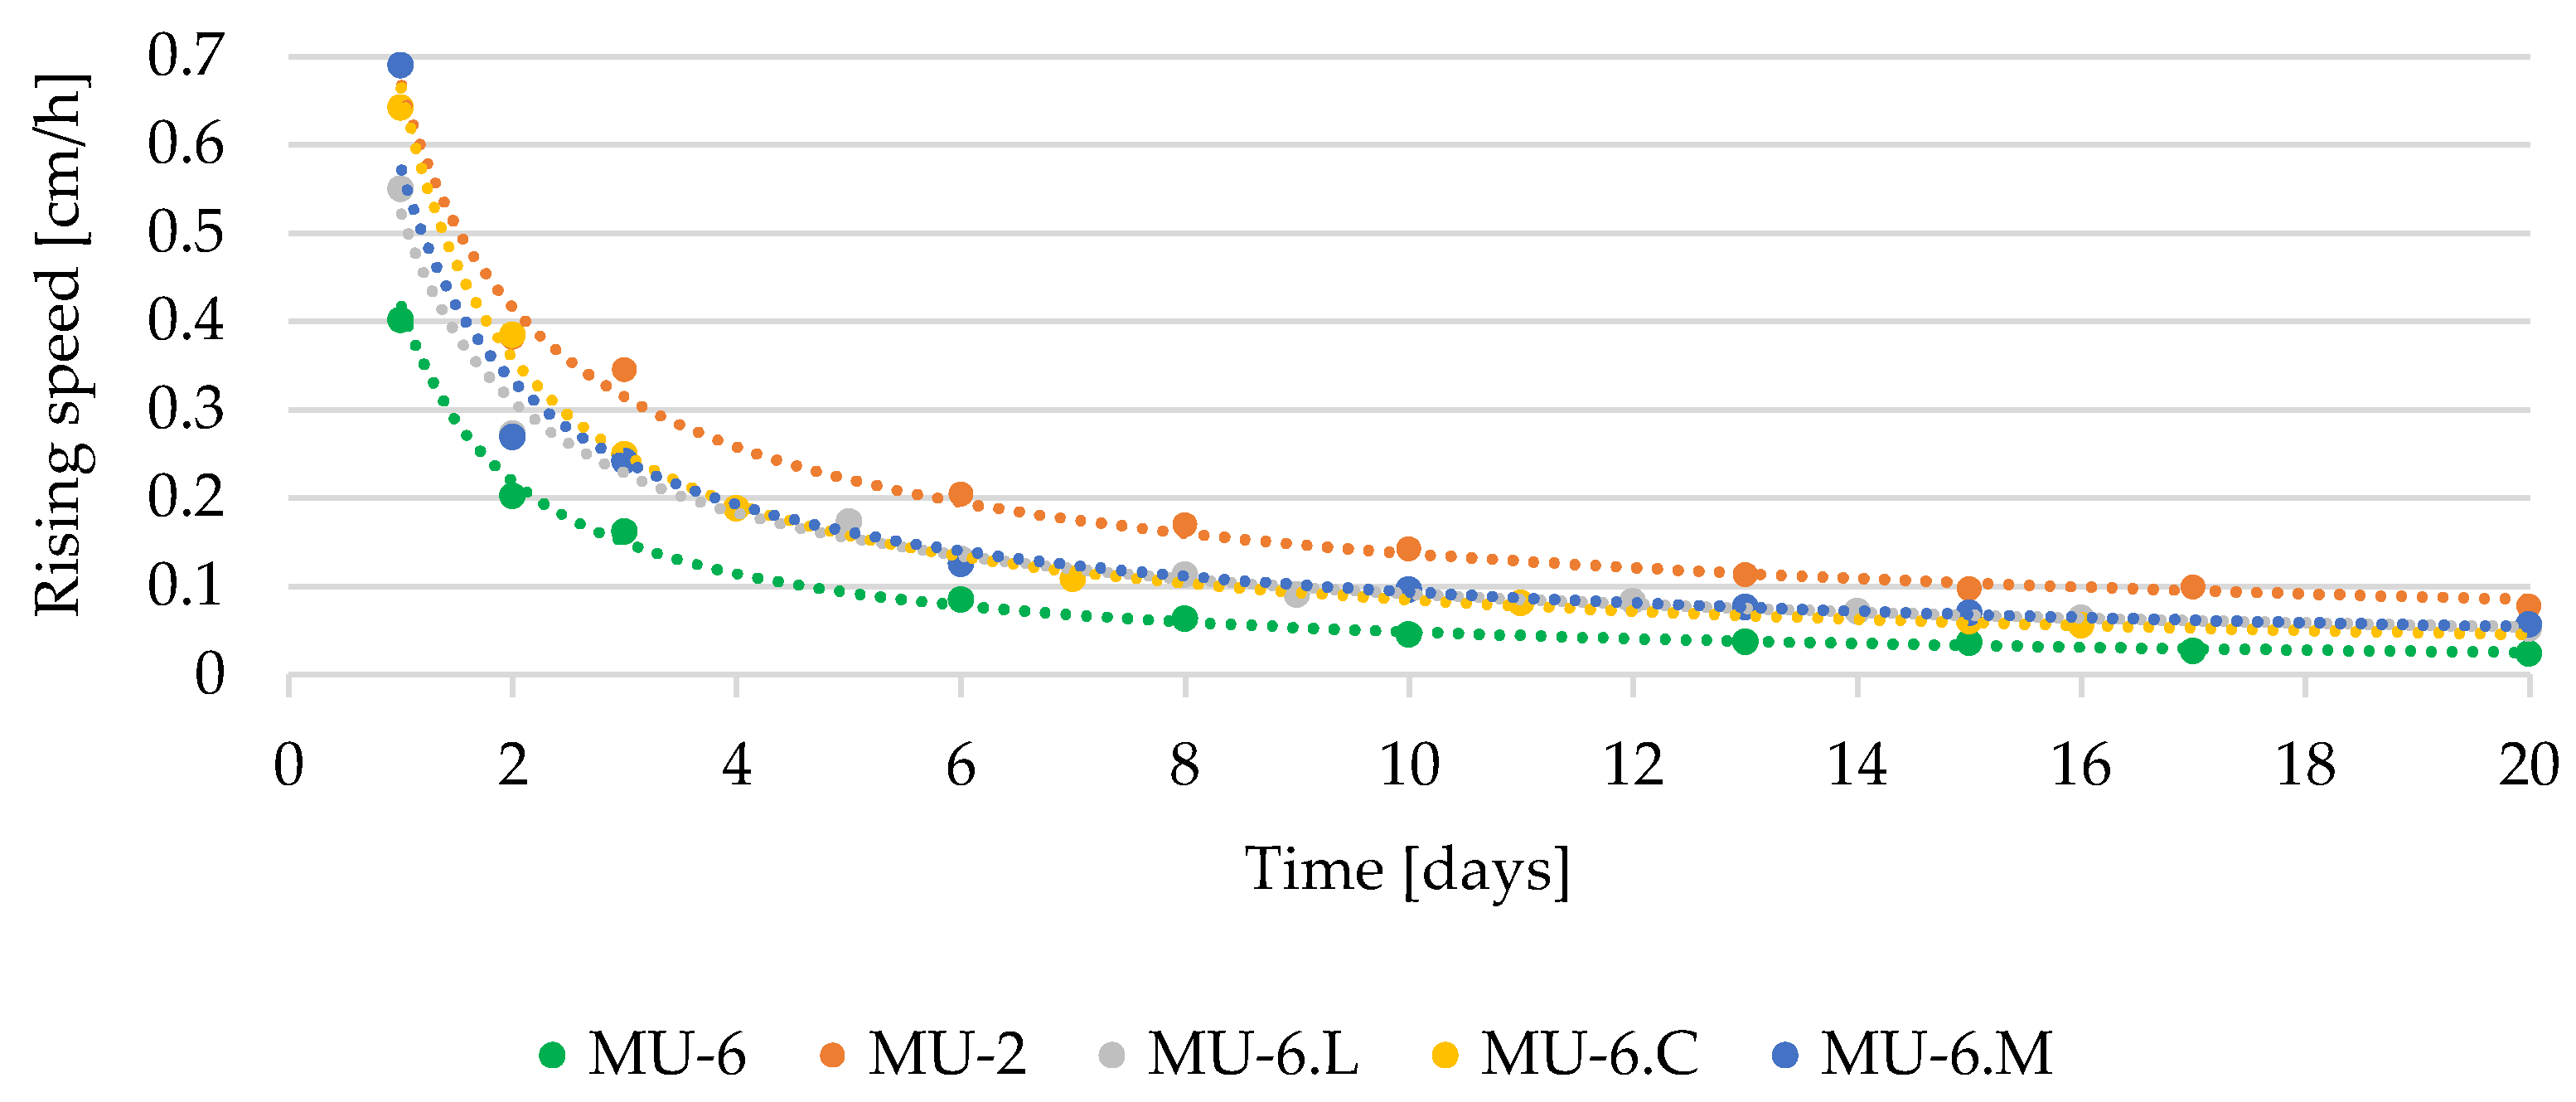
Results to the laboratory study for the rising speed [cm/h] of the rising damp in mock-up masonry were obtained: in
Figure 6, a rapid increase in rising damp was observed until the third−fourth day, and then the speed slowly decreased with little difference between the mock-ups. A faster rising speed was measured in the MU-2 and then in plastered MU-6, as described in the previous graph and IR images. At the end of 20 days, all mock-ups reached a rising speed between 0.02 cm/h and 0.07 cm/h. This result demonstrates the influence of the mortar and/or plaster in masonry structures: a high diffusion factor influences moisture rise the most.
3.2. Simulations
The results of dynamic simulation laboratory tests are presented in
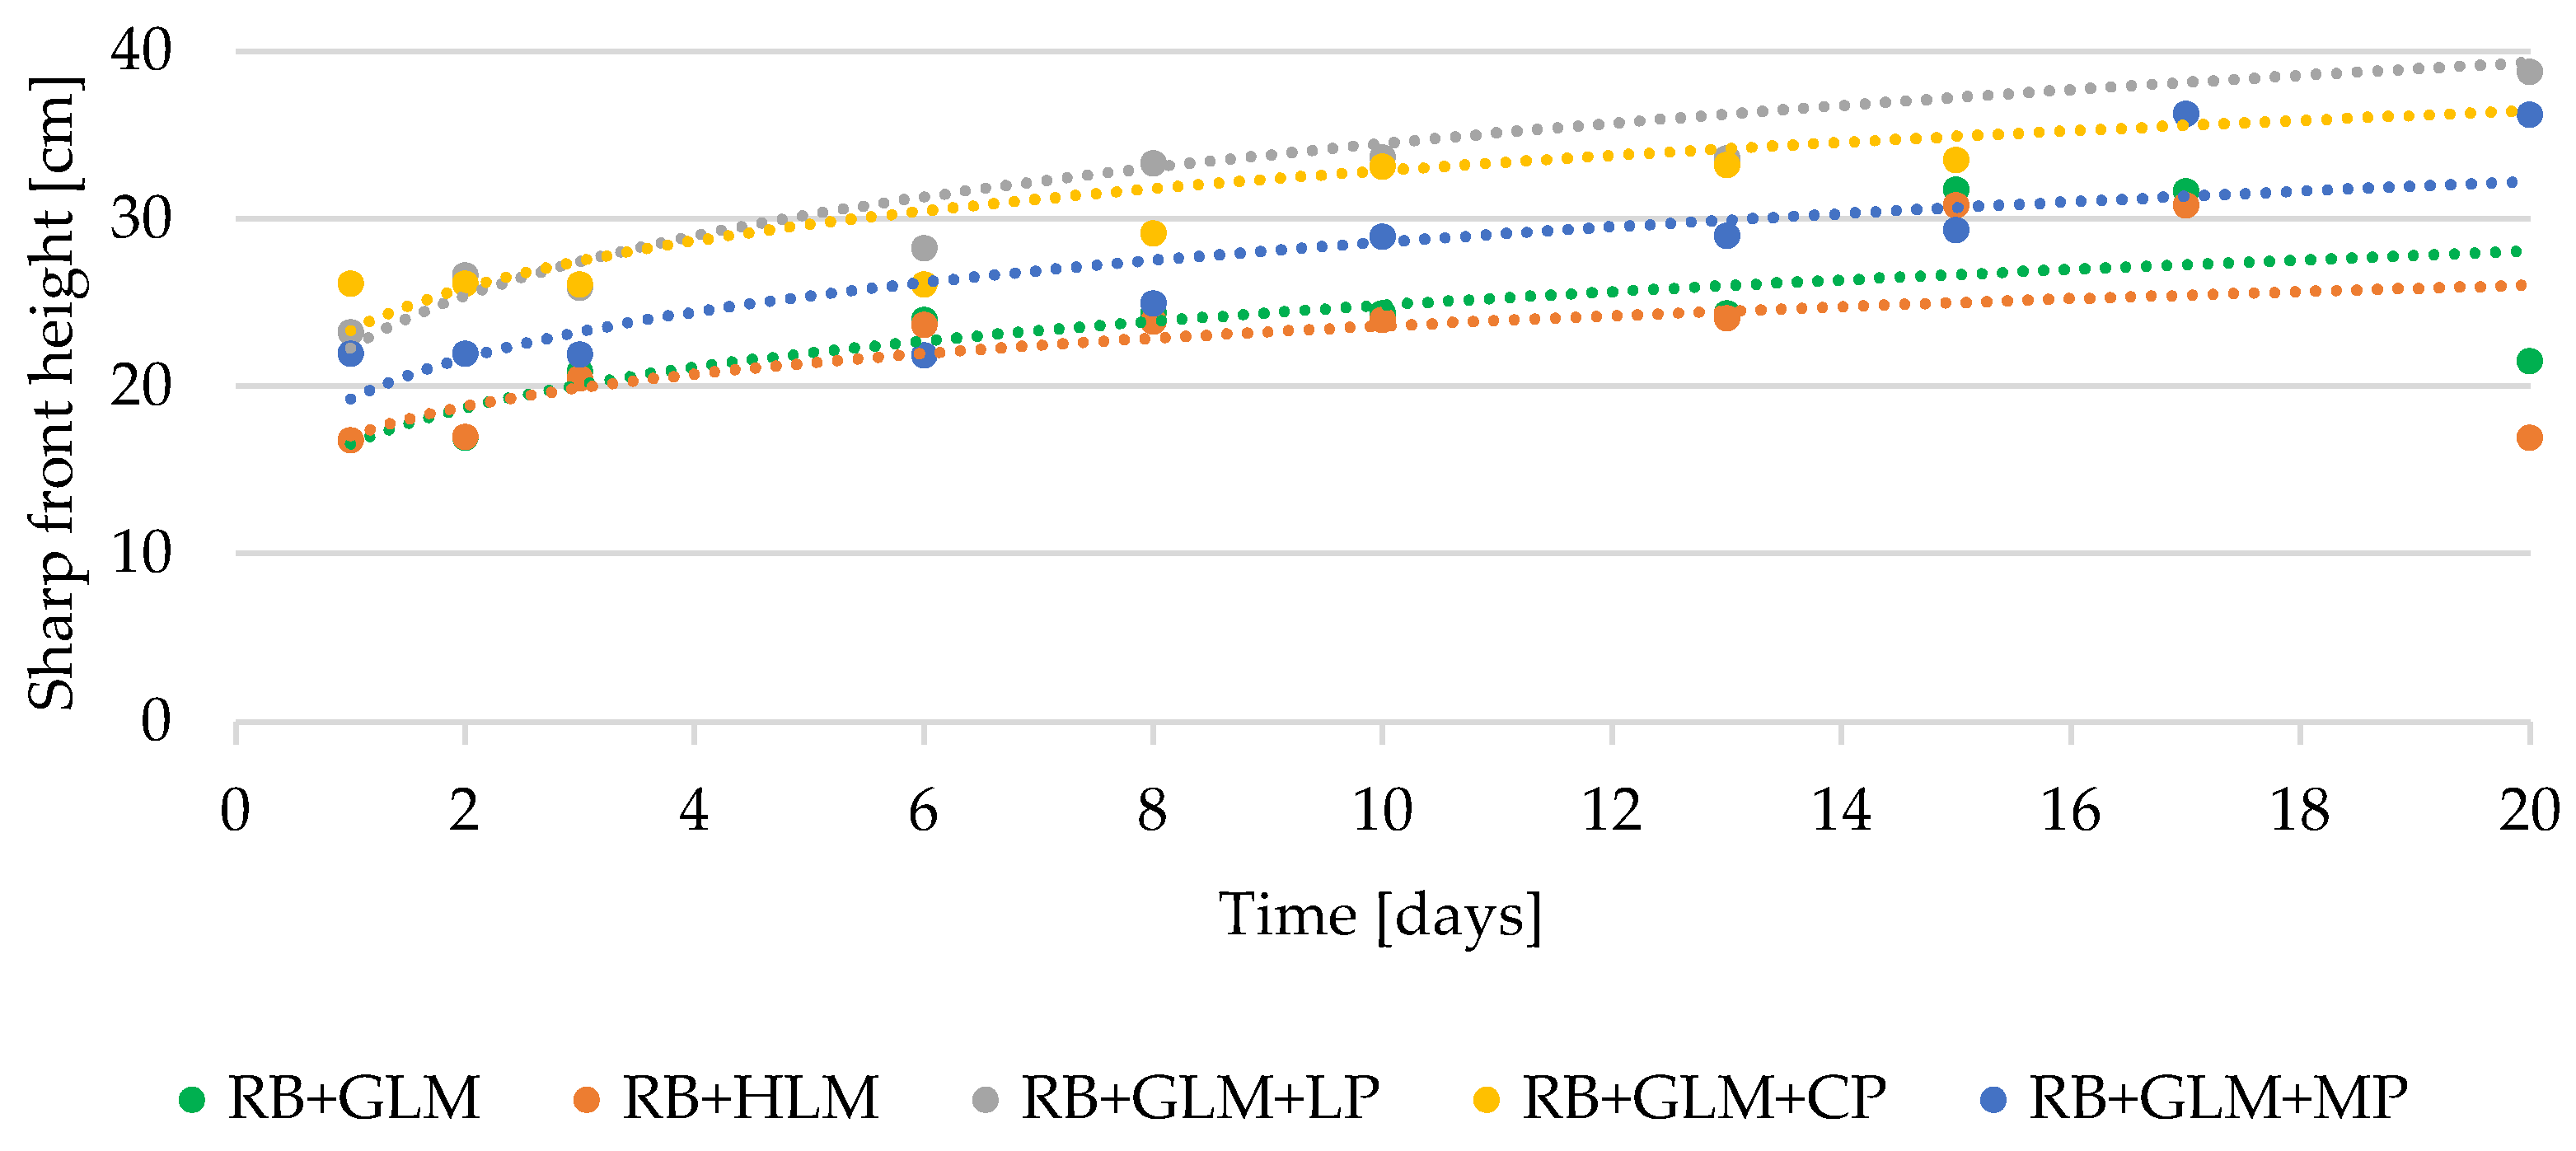
Figure 7, showing the height of surface rising damp: the water content was evaluated in the masonry, considering the same technology and laboratory conditions of the real test. The simulations presented different behaviors between exposed and plastered masonry: the firsts (RB + GLM and RB + HLM) had a level of wetting front of ~17 cm, and the seconds were ~22 ÷ 24 cm (RB + GLM + LP and RB + GLM + CP), with a slight increase of 3 cm in the structure with Cocciopesto plaster (RB + GLM + CP) that then stabilized. In general, a growth of 1 ÷ 4 cm in the exposed structure and 14–15 cm in the plastered structure was observed by highlighting the greater increase in the RB + GLM + LP, from ~23 cm to ~39 cm in 20 days.
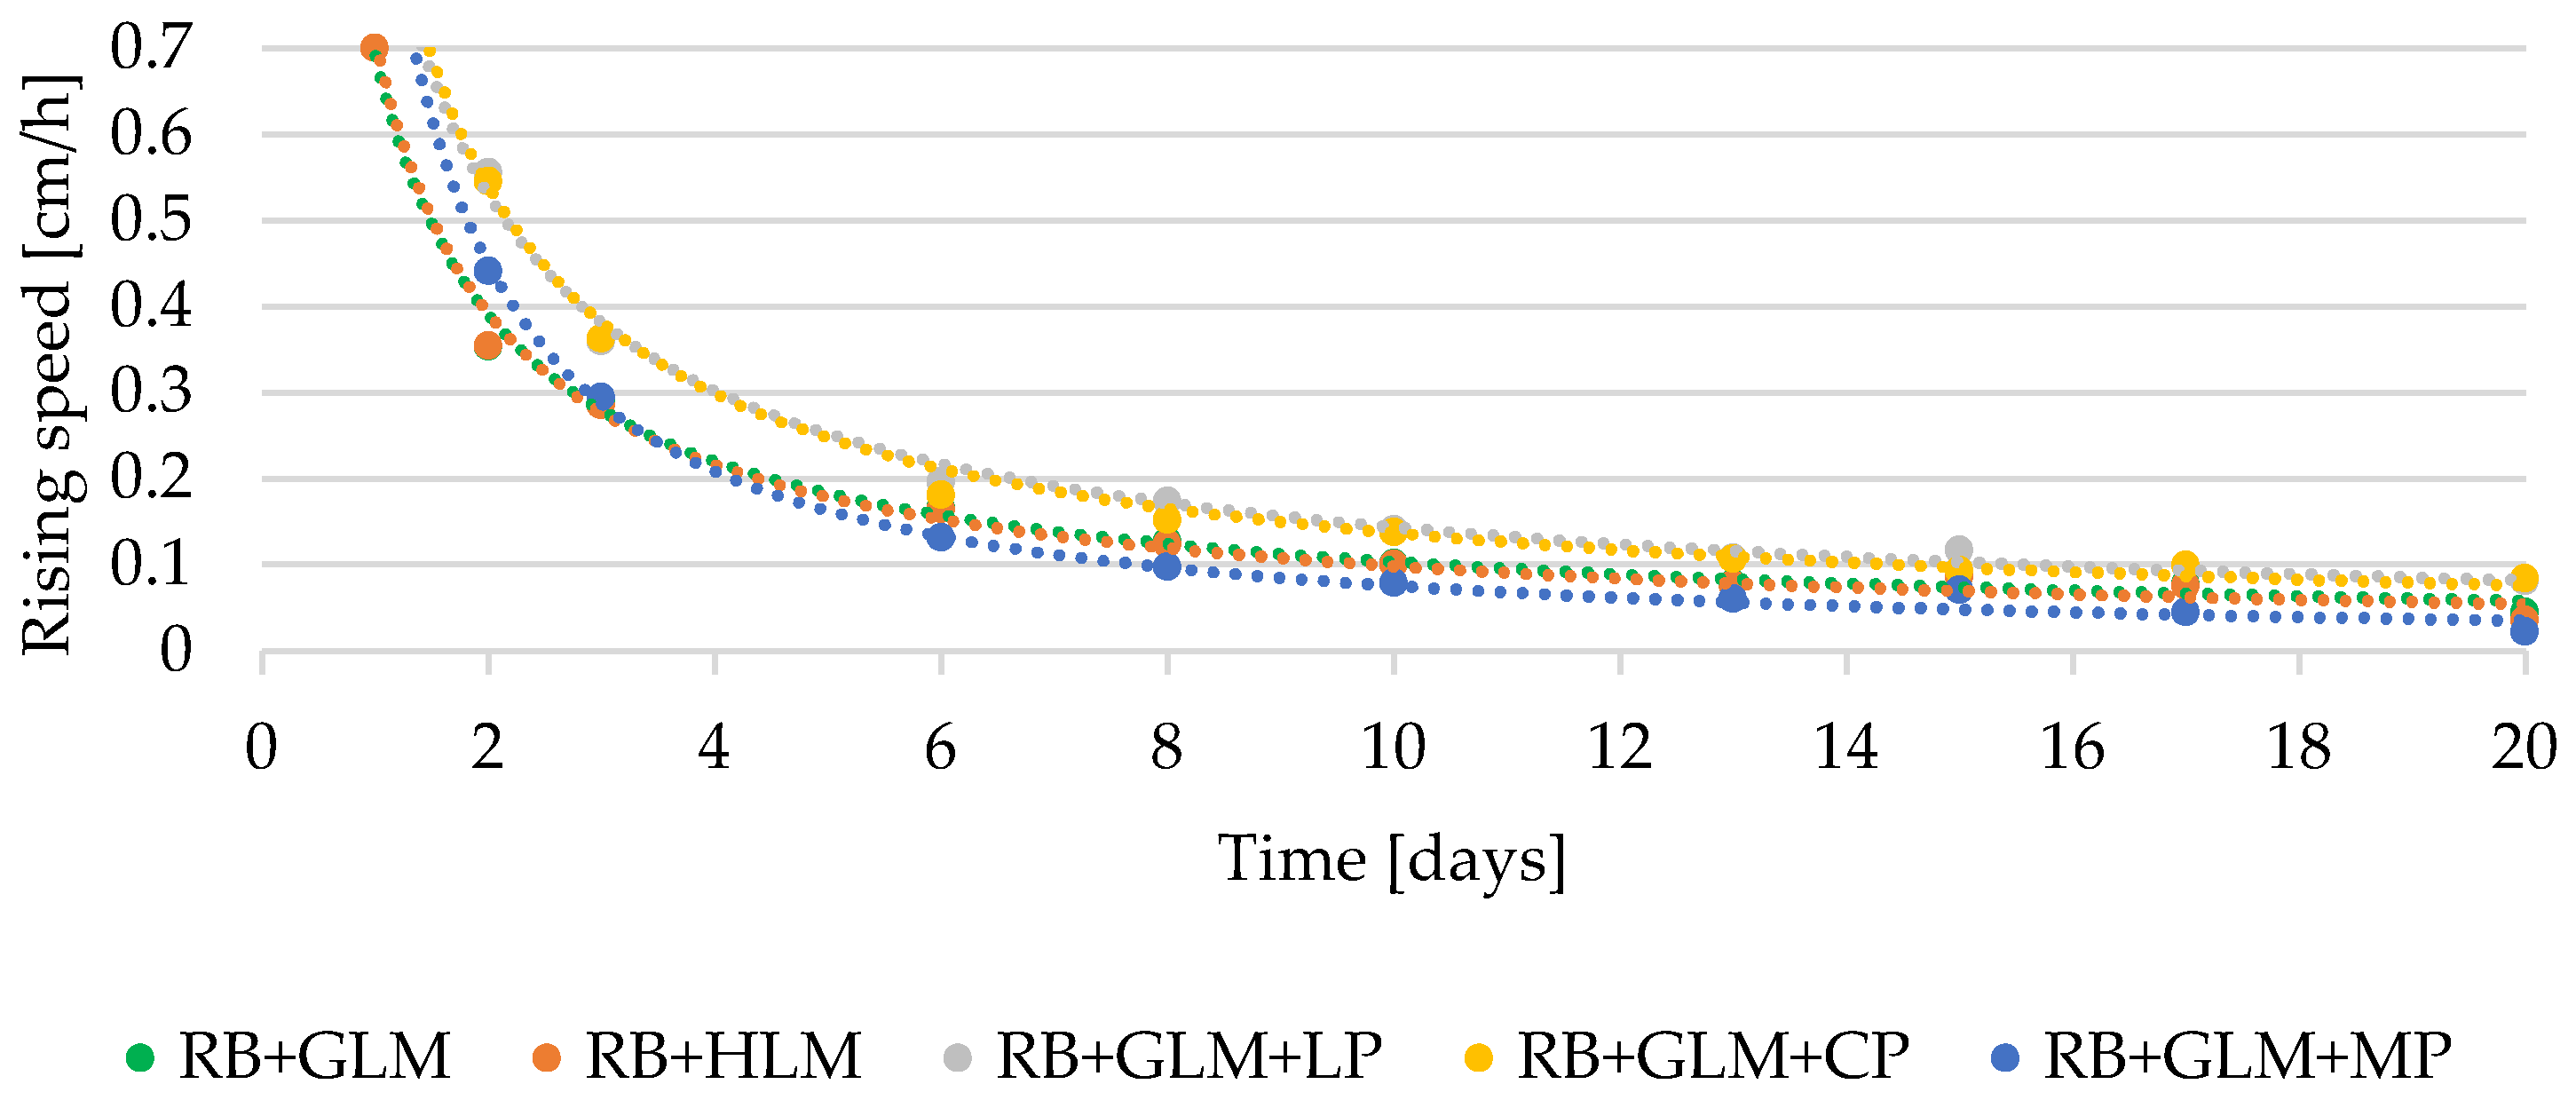
Even in the simulations, the rising speed of damp in the masonry presented in
Figure 8 slowly decreased after the fourth day, starting from 0.7 ÷ 1 cm/h, and arriving on the twentieth day at 0.02 ÷ 0.08 cm/h, in the same way as the laboratory tests.
Furthermore, the water flow rise in the exposed and plastered masonry was analyzed, as shown in
Figure 9: (a) the unplastered masonry had a convex trend; (b) the plastered masonry showed a concave trend. The differing performance is probably related to the high porosity of Cocciopesto that facilitates and increases hygroscopicity in the structure. A similar behavior occurred in all of the plastered structures.
With reference to the laboratory specimens, a test was developed that focused on an annual survey of the moisture content (MC%) data in the masonry, using the gravimetric method. In fact, a monthly survey or a minor time range in destructive and invasive terms would compromise the structural integrity of the specimen, and also the hygroscopic capacity of the entire masonry, increasing the surfaces in contact with the air and the porosity index, consequently accelerating the evaporation process. In MU-6, after 1 year of imbibition, the third course of bricks had an MC value of 20 ÷ 30%, with higher values at greater depths (5–10 cm) than the surface, affected by a higher evaporation rate. Already in the fourth brick course the MC was lower, with values below 10%. In MU-2 and plastered MU-6, there were no weight evaluations because the soaking time was less than a year.
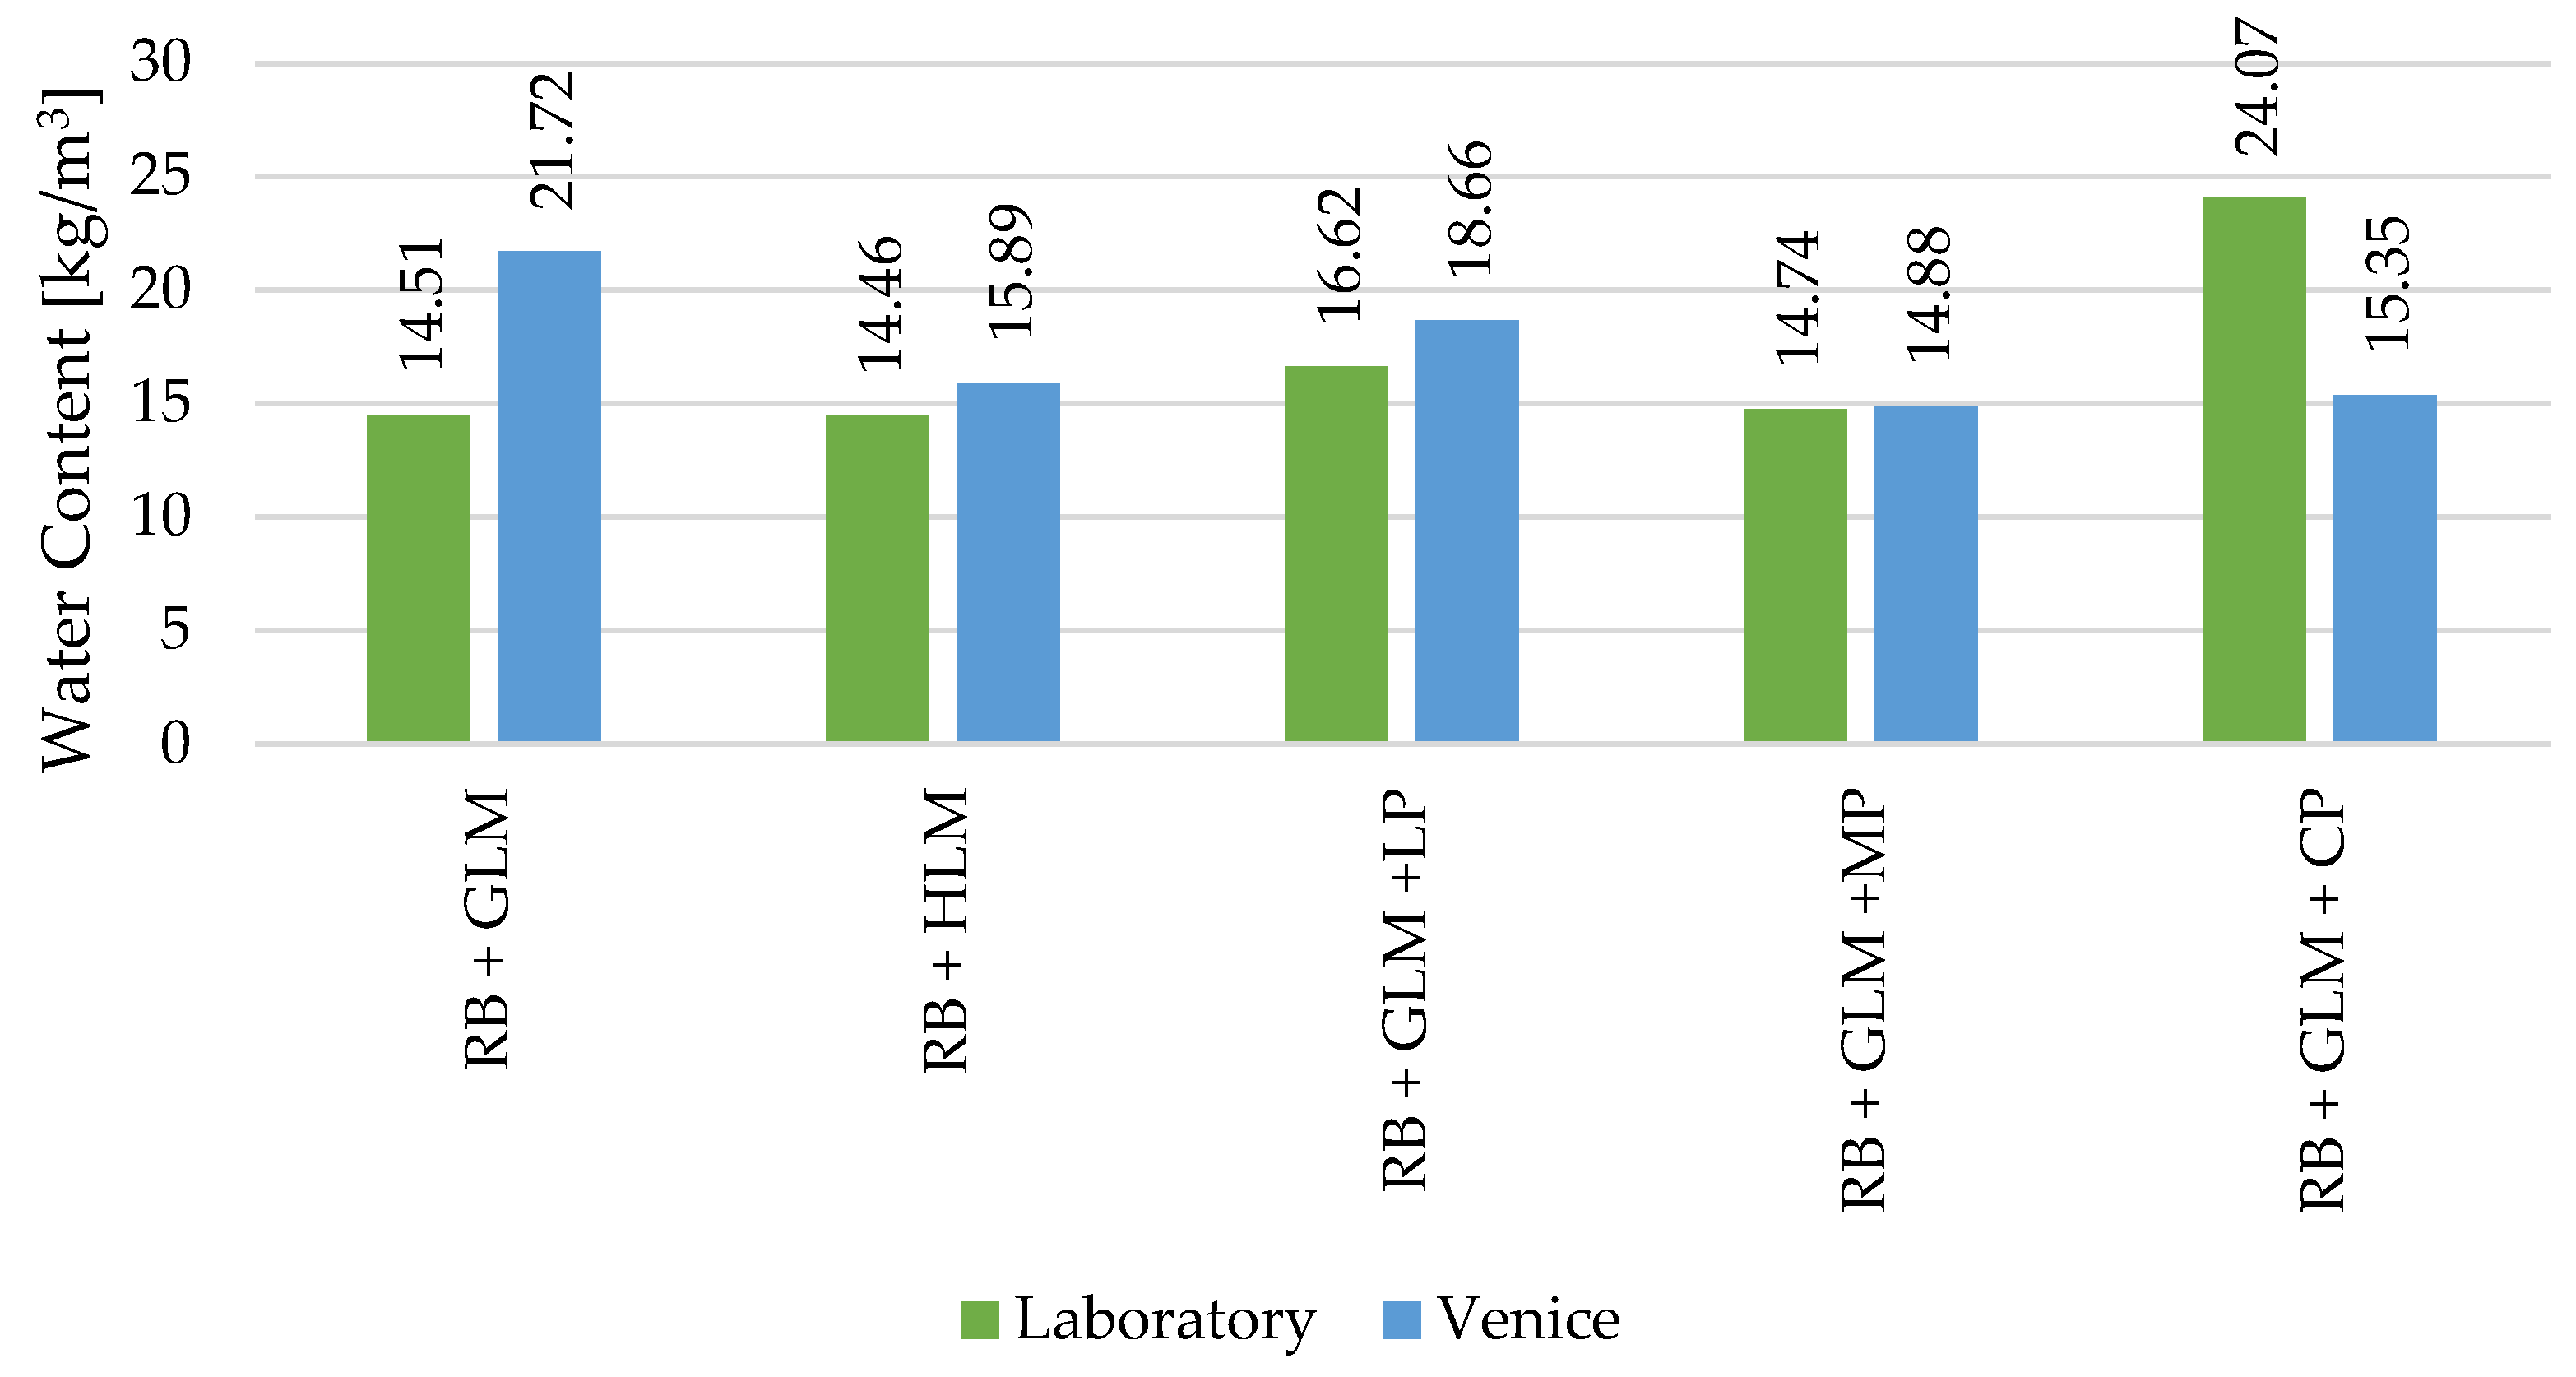
The same structures of mock-up masonry were analyzed in consideration of both sets of weather data presented in
Figure 3, as controlled (laboratory conditions) and uncontrolled environments (Venice conditions, by weather data). This comparison aimed to evaluate if different weather could influence the water content (WC) in the structure (
Figure 10).
The WC calculated for all masonries under laboratory conditions were in the range of 20 ÷ 30 kg/m3 at the end of the first day of soaking; after 1 year, the WC was about 5 ÷ 6.5 kg/m3, with a general decrease of about 75%. In the intermediate phase of about 1 month of imbibition, a decrease of about 35% was observed in all structures. The masonry under real Venetian conditions showed a slightly different behavior: an initial WC of about 25 kg/m3 was simulated in the unplastered structure, and 20 kg/m3 in the plastered wall; this content decreased after 1 month in the structure with traditional lime mortar/plaster by about 40%, and in the remainder of the masonries by about 5% on average. Finally, after 1 year, the situation became like the laboratory conditions in the structure with lime mortar/plaster, while in the other masonries the WC remained relatively constant to initial values.
4. Discussion
The results achieved in the analysis, both in laboratory and simulation, showed how the mock-up made with premixed mortar had a lower sharp front height than those made with traditional lime and sand mortar. The same assessment can be made for plastered walls, which had a greater presence of water on the surface. Therefore, mortar or plaster made with traditional receipt (based on lime and sand) acts as a “bridge” between the bricks, carrying moisture to a higher area than premixed mortar. This suction characteristic depends on the material intrinsic properties: a premixed mortar contains water repellent or cement additive, giving lower absorption characteristics, while traditional mortar has more hygroscopic properties.
The variation in diffusion moisture between analyzed structures depended on the type of construction (with or without plaster), nature and properties of materials used, boundary conditions, and the season analyzed. These parameters modify the wetting front and the water content, which both decrease when the pores are completely saturated; that is, the masonry reaches its equilibrium state. It happens when the absorption rate decreases relative to the evaporation rate, causing a drop in the moisture content.
Furthermore, simulation of masonries in the real environment (Venice) showed that the climatic conditions can influence the values. In fact, the variation in temperature included an oscillation from −8 °C to 29 °C from winter to summer; the relative humidity values were always in the range of 77 ± 15%; moreover, precipitation, radiation, and air flows influence the evaporation rate. In this case, the specimens built in the laboratory presented a height of around 1 m, not corresponding with the reality in the Venetian context when analyzing the solar radiation contribution; in fact, the solar radiation considered in the simulation model was very low, and did not replicate the typical build environment of Venice city, where building density is very high and the streets are tight-fitting, and consequently the walls at ground level are usually shaded from the solar path during the day.
Obviously, these boundary conditions do not occur in the laboratory, where fluctuations in the environment are under control (T 22 ± 3 °C, RH 52 ± 8%), and no atmospheric pollutants are present. Future developments of this research plan to examine in depth the influence of atmospheric conditions on the rising damp process, also assessing how the moisture content fluctuates at different depths, and comparing masonry materials.
As far as dynamic simulations are concerned, the analysis of the exposed masonries with different mortars reported a similar behavior in terms of rising damp level. Moreover, similar outcomes were obtained among the walls plastered with lime-sand and Cocciopesto; smaller reductions in the rate of rising damp were instead observed in the Marmorino structure, because this material has a lower water vapor resistance factor than the other plasters, correlating to the presence of a marble percentage in powder on the inside.
There are some differences between the results of laboratory tests and simulations, not relatively to the rising damp level or the speed, but in the masonry type that absorbs more water; the main cause could be derived by the composition of materials. In the simulation model, the data input about the mortar and plaster characteristics were provided by the literature, and presented a homogeneous and isotropic mixture; on the contrary, for laboratory testing, the hygroscopic behavior in the mockups presented a level of uncertainty because the declared composition of materials is not guaranteed, as it depends on human practice; thus, the mixture during the building phase could not be homogeneous and uniform.
The levels of ascent were recorded quickly (a few days in the simulated wall, and a few weeks in the laboratory testing), and may have also varied slightly to the boundary conditions. The most important influence was provided by the results of the suction balance: the greater the exposed surface, the greater level of rising damp recorded. These data are very useful for highlighting the differences between theoretical and observed rising damp heights: in the masonry analyzed here, the rapid evaporation process compensated for the capillary suction, slowing down the rising water.
5. Conclusions
The scope of this study was to increase knowledge of the behavior of rise damp phenomena in masonry, especially in Venice, which represents an extreme example of structures in continuous contact with water. Therefore, the study presented a comparison between two analyses on masonries, one developed with laboratory specimens and one with numerical models.
The comparison between full-size laboratory masonry and dynamic simulations produced important results, even if the calibration of the two systems obviously could exactly match because of the diversity and inhomogeneity between actual specimen materials and literature data.
The support between IR thermography and hygrothermal dynamic simulation is important, because the former shows the current situation while the latter predicts it. The combination of both allows for the identification of issues and to study a specific phenomenon, toward the most suitable treatment technology, in addition to planning next steps, both for maintenance and conservation status monitoring.
During the first 7–10 days of water imbibition, the velocity of rising damp was very fast, involving a rapid increase in the WC through the masonry. After the rising period, there was a gradual decrease phase in the WC (10–20 days), until its stabilization for about 1 year.
The parameters of the materials, such as the hygroscopicity and porosity, are very important for characterizing these structures. Initially, plastered masonry has a slightly higher WC and a greater level of wetting area with respect to the same masonry without plaster. There were slight differences between laboratory tests and simulations concerning the height of surface moisture and rising speed, which probably derived from flaws in the real construction.
In conclusion, this research confirmed that the rising damp in the masonry is strictly connected to a high liquid suction power of the material, and to a continuous supply of water from the ground to the wall. These investigations offer an interesting assessment for the restoration sector, because the use of mortars with limited water-repellent properties do not have a great impact on the wall, but at the same time they can contain the effects of rising damp compared to traditional mortar. Therefore, it is important to consider the dual role of mortar/plaster in protecting the masonry, but also as a vehicle for water rise.
Author Contributions
Conceptualization, E.G. and F.P.; methodology, E.G. and F.P.; software, E.G.; validation, E.G. and F.P; formal analysis, E.G.; investigation, E.G.; resources, F.P.; data curation, E.G.; writing—original draft preparation, E.G. and F.P.; writing—review and editing, T.D.M. and P.R.; visualization, E.G.; supervision, F.P. and P.R.; project administration, F.P.; funding acquisition, F.P. and P.R. All authors have read and agreed to the published version of the manuscript.
Funding
This research was funded by the Consortium for Coordination of Research activities Concerning the Venice Lagoon System, grant number 1642/2018.
Institutional Review Board Statement
Not applicable.
Informed Consent Statement
Not applicable.
Data Availability Statement
Data available on request due to restrictions e.g., privacy or ethical. The data presented in this study are available on request from the corresponding author. The data are not publicly available due to under future processing and implementation.
Acknowledgments
Scientific activity was performed in the Research Program Venezia 2021, with the contribution of the Provveditorato for the Public Works of Veneto, Trentino Alto Adige and Friuli Venezia Giulia, provided through the concessionary of State Consorzio Venezia Nuova, and coordinated by CORILA.
Conflicts of Interest
The authors declare no conflict of interest.
References
- World Health Organization. WHO Guidelines for Indoor Air Quality: Dampness and Mould; Heseltine, E., Rosen, J., Eds.; WHO: Geneva, Switzerland, 2009. [Google Scholar]
- Franzoni, E. State-of-the-art on methods for reducing rising damp in masonry. J. Cult. Herit. 2018, 31, S3–S9. [Google Scholar] [CrossRef]
- Hall, C.; Hoff, W.D. Water Transport in Brick, Stone and Concrete; Taylor and Francis: Oxford, UK, 2002. [Google Scholar]
- Camuffo, D. Chapter 8—Rising Damp Treatment and Prevention. In Microclimate for Cultural Heritage, 3rd ed.; Camuffo, D., Ed.; Elsevier: Amsterdam, The Netherlands, 2019; pp. 153–166. [Google Scholar] [CrossRef]
- Li, Y.; Kong, Z.; Xie, H.; Ma, Y.; Mu, B.; Hokoi, S. Construction type influences features of rising damp of blue-brick masonry walls. Constr. Build. Mater. 2021, 284, 122791. [Google Scholar] [CrossRef]
- Guolo, E.; Romagnoni, P.; Peron, F. Capillary rising damp in Venetian context: State of the art and numerical simulation—IOPscience. J. Phys. Conf. Ser. 2021, 2069, 012046. [Google Scholar] [CrossRef]
- Biscontin, G.; Ganzerla, R.; Lenarda, M.; Michelon, G.; Valle, A. Indagine sui fenomeni di risalita capillare nelle murature di Venezia. In Proceedings of the Il Mattone di VENEZIA, Contributi Presentati al Concorso di Idee su Patologia, Diagnosi e Terapia del Mattone di Venezia, Venice, Italy, 29 October 1982; pp. 33–65. [Google Scholar]
- Falchi, L.; Slanzi, D.; Balliana, E.; Driussi, G.; Zendri, E. Rising damp in historical buildings: A Venetian perspective. Build. Environ. 2018, 131, 117–127. [Google Scholar] [CrossRef]
- Guimarães, A.S.; Delgado, J.M.P.Q.; Azevedo, A.C.; de Freitas, V.P. Interface influence on moisture transport in buildings. Constr. Build. Mater. 2018, 162, 480–488. [Google Scholar] [CrossRef]
- Spencer, T.; Spence, R.J.S.; Da Mosto, J.; Fletcher, C.A. Introduction: Urban flooding and the urban system. In Flooding and Environmental Challenges for Venice and Its Lagoon: State of Knowledge; Cambridge University Press: Cambridge, UK, 2005; pp. 143–145. [Google Scholar]
- Apih, V.; Makarovic, M. Development of a method for drying out the damp walls of buildings in Venice. Trans. Built Environ. 1993, 4, 635–642. [Google Scholar]
- UNI EN 771-1:2015; Specification for Masonry Units—Part 1: Clay Masonry Units. Beuth Verlag GmbH: Berlin, Germany, 2015.
- Doglioni, F.; Mirabella Roberti, G. Venezia. Forme della Costruzione. Forme del Dissesto; Libreria Cluva Editrice: Venice, Italy, 2011. [Google Scholar]
- Doglioni, F.; Scappin, L.; Squassina, A.; Trovò, F. Conoscenza e Restauro Degli Intonaci e Delle Superfici Murarie Esterne di Venezia. Campionature, Esemplificazioni, Indirizzi di Intervento, 1st ed.; Il Prato Casa Editrice: Saonara, Italy, 2017. [Google Scholar]
- Department of Hygrothermics at Fraunhofer IBP. WUFI (en). WUFI®. Available online: https://wufi.de/en/ (accessed on 20 April 2019).
- UNI EN 15026:2008; Hygrothermal Performance of Building Components and Building Elements—Assessment of Moisture Transfer by Numerical Simulation. ISS: Belgrade, Serbia, 2008.
- Karoglou, M.; Moropoulou, A.; Krokida, M.K.; Maroulis, Z.B. A powerful simulator for moisture transfer in buildings. Build. Environ. 2007, 42, 902–912. [Google Scholar] [CrossRef]
- Holm, A.; Kunzel, H. Two-dimensional transient heat and moisture simulations of rising damp with WUFI 2d. In Proceedings of the 12th International Brick/Block Masonry Conference, Madrid, Spain, 25–28 June 2000; pp. 1–8. [Google Scholar]
- Kunzel, H.M.; Kiessl, K. Calculation of heat and moisture transfer in exposed building components. Int. J. Heat Mass Transf. 1997, 40, 159–167. [Google Scholar] [CrossRef]
- Krus, M. Moisture Transport and Storage Coefficients of Porous Mineral Building Materials, 3rd ed.; Fraunhofer IRB Verlag: Stuttgart, Germany, 1996. [Google Scholar]
- UNI EN ISO 13788:2013; Hygrothermal Performance of Building Components and Building Elements—Internal Surface Temperature to Avoid Critical Surface Humidity and Interstitial Condensation—Calculation Methods. ISO: Geneva, Switzerland, 2013.
- EnergyPlus. National Renewable Energy Laboratory (NREL). Available online: https://energyplus.net/weather (accessed on 20 April 2019).
- UNI EN ISO 15927-4:2005; Hygrothermal Performance of Buildings—Calculation and Presentation of Climatic Data—Part 4: Hourly Data for Assessing the Annual Energy Use for Heating and Cooling. ISO: Geneva, Switzerland, 2005.
Figure 1.
(a) Mock-up masonries in the laboratory, MU-6, and (b) representation of construction method.
Figure 1.
(a) Mock-up masonries in the laboratory, MU-6, and (b) representation of construction method.
Figure 2.
Masonry specimens simulated in WUFI 2D software (a) without plaster, (b) with plaster; the analyzed layers are listed as follows: 1 brick, 2 mortar, 3 soil layer with high quantity of water, 4 plaster layer.
Figure 2.
Masonry specimens simulated in WUFI 2D software (a) without plaster, (b) with plaster; the analyzed layers are listed as follows: 1 brick, 2 mortar, 3 soil layer with high quantity of water, 4 plaster layer.
Figure 3.
Climatic conditions of the indoor laboratory and Venice, used for dynamic simulations.
Figure 3.
Climatic conditions of the indoor laboratory and Venice, used for dynamic simulations.
Figure 4.
Variations in time of the level height of surface rising damp during the laboratory test.
Figure 4.
Variations in time of the level height of surface rising damp during the laboratory test.
Figure 5.
Level of rising damp by IR thermography images of three mock-up masonries at different times: MU-6 new brick + premixed mortar; MU-2 new brick + historical mortar; MU-6.L new brick + premixed mortar + lime plaster. The yellow color represents a dry area, the grayscale represents a wet area.
Figure 6.
Rising speed in laboratory mock-ups, over 20 days.
Figure 6.
Rising speed in laboratory mock-ups, over 20 days.
Figure 7.
Variations in time of the level height of surface rising damp during the laboratory test.
Figure 7.
Variations in time of the level height of surface rising damp during the laboratory test.
Figure 8.
Rising speed in mock-ups simulated with WUFI software, over 20 days.
Figure 8.
Rising speed in mock-ups simulated with WUFI software, over 20 days.
Figure 9.
Rising damp mode in exposed (a) and plastered masonry with Cocciopesto (b).
Figure 9.
Rising damp mode in exposed (a) and plastered masonry with Cocciopesto (b).
Figure 10.
Water content in masonry under laboratory conditions and Venice weather, after 1 month of imbibition (results from simulation).
Figure 10.
Water content in masonry under laboratory conditions and Venice weather, after 1 month of imbibition (results from simulation).
Table 1.
Masonry components parameters: ρ bulk density, φ porosity, c specific heat, λ thermal conductivity, and μ water vapor resistance factor.
Table 1.
Masonry components parameters: ρ bulk density, φ porosity, c specific heat, λ thermal conductivity, and μ water vapor resistance factor.
| Material | ρ [kg/m3] | φ [%] | c [J/(kg K)] | λ [W/(m K)] | μ [-] |
|---|
| RB | 1700 | 37 | 850 | 0.345 | 9.5 |
| GLM | 1800 | 20 | 850 | 0.920 | 15 |
| HLM/LP | 1750 | 20 | 850 | 1.000 | 13 |
| MP | 1650 | 32 | 850 | 0.800 | 0.14 |
| CP | 1450 | 40 | 850 | 0.930 | 10.5 |
Table 2.
IR camera technical specifications used for non-invasive monitoring in the mock-up laboratory.
Table 2.
IR camera technical specifications used for non-invasive monitoring in the mock-up laboratory.
| IR Resolution | 1024 × 768 Pixels |
|---|
| NETD—Noise Equivalent Temperature Difference | <20 mK at +30 °C |
| FOV—Field of View | 12° × 9° |
| IFOV—Instantaneous Field of View | 0.20 mrad |
| Spectral band | 7.5–14 μm |
| Frame rate | 565 Hz |
| Image frequency | 30 Hz |
| Focal length | 83.4 mm (3.28″) |
| Emissivity correction | 0.01–1.0 |
| Object temperature range | −40 °C to +2000 °C (−40° F to +3662° F) |
| Operating temperature range | −32 °C to +55 °C (−25.6° F to +131° F) |
Table 3.
Hobo data logger technical specifications used for microclimate monitoring of the laboratory.
Table 3.
Hobo data logger technical specifications used for microclimate monitoring of the laboratory.
| Range Measurement | T: −20 °C to +70 °C
RH: 5% to 95% |
| Accuracy | T: ±0.35 °C (0 °C to +50 °C)
RH: ± 2.5% (10% to 90%) |
| Response Time | T: 6 min at 90%
RH: 1 min at 90% |
| Memory | 64 kB |
| Disclaimer/Publisher’s Note: The statements, opinions and data contained in all publications are solely those of the individual author(s) and contributor(s) and not of MDPI and/or the editor(s). MDPI and/or the editor(s) disclaim responsibility for any injury to people or property resulting from any ideas, methods, instructions or products referred to in the content. |
© 2022 by the authors. Licensee MDPI, Basel, Switzerland. This article is an open access article distributed under the terms and conditions of the Creative Commons Attribution (CC BY) license (https://creativecommons.org/licenses/by/4.0/).


